Abstract
Nuclear processes like V(D)J recombination are determined by the three-dimensional organization of chromosomes in multiple layers, including the compartments1 and topologically associated domains (TADs)2,3 consisting of chromatin loops4. TADs are formed by chromatin loop extrusion5-7, which depends on the ring-shaped cohesin complex8-10 with its loop extrusion function11,12. The cohesin-release factor Wapl13,14 instead restricts loop extension10,15. The generation of a diverse antibody repertoire, providing humoral immunity to pathogens, requires the participation of all V genes in V(D)J recombination16, which depends on contraction of the 2.8-Mb-long immunoglobulin heavy-chain (Igh) locus by Pax517,18. How Pax5 controls Igh contraction in pro-B-cells is, however, unknown. Here, we demonstrate that locus contraction is caused by loop extrusion across the entire Igh locus. Notably, the expression of Wapl is repressed by Pax5 specifically in pro-B and pre-B-cells, which facilitates extended loop extrusion by increasing the residence time of cohesin on chromatin. Pax5 mediates the transcriptional repression of Wapl through a single Pax5-binding site by recruiting the Polycomb repressive complex 2 to induce bivalent chromatin at the Wapl promoter. Reduced Wapl expression causes global alterations in the chromosome architecture, indicating that the potential to recombine all V genes entails structural changes of the entire genome in pro-B-cells.
Keywords: Pax5, Polycomb repressive complex 2, suppression of Wapl, loop extrusion, Igh recombination
Introduction
The mouse Igh locus is composed of a 0.26-Mb-long 3? proximal region consisting of 13 DH, 4 JH and 8 CH gene segments and of a distal 2.44-Mb-long VH gene cluster containing 113 functional VH genes19,20. DH-JH rearrangements occur in lymphoid progenitors followed by VH gene recombination in pro-B-cells16, which depends on Igh locus contraction to facilitate the participation of all VH genes in VH-DJH recombination17,18,21. DH-JH recombination22 and rearrangements of the most 3’ proximal VH genes23 depend on loop extrusion, explaining the linear scanning activity of the RAG endonuclease, which ensures the orientation-biased cleavage of RSS elements in V(D)J recombination24.
Cohesin is enriched in the genome at the DNA-bound zinc finger protein CTCF25,26, which anchors chromatin loops by binding in an orientation-dependent manner to convergent CTCF-binding elements (CBEs)4. All 125 CBEs in the VH gene cluster have the same directionality and are present in convergent orientation to one CBE in the IGCR1 region and 10 CBEs at the Igh 3’ end (known as 3’CBEs)20 (Extended Data Fig. 1a), suggesting that loops across the entire Igh locus may be formed by loop extrusion.
Results
Inverted Igh VH genes do not recombine
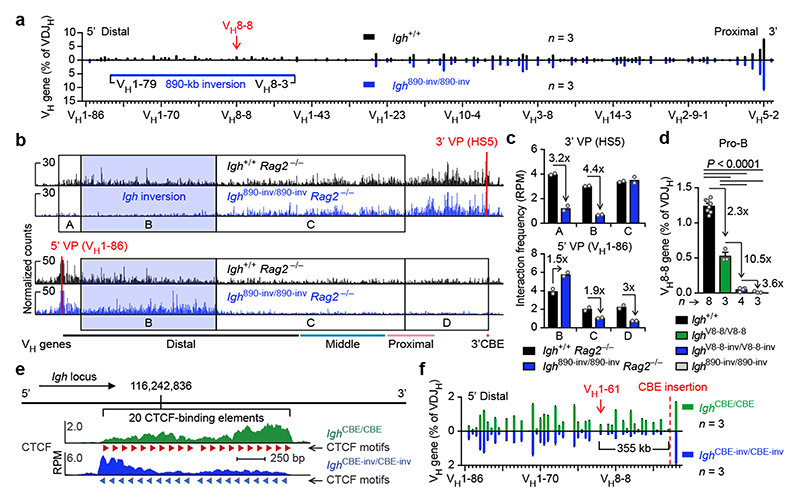
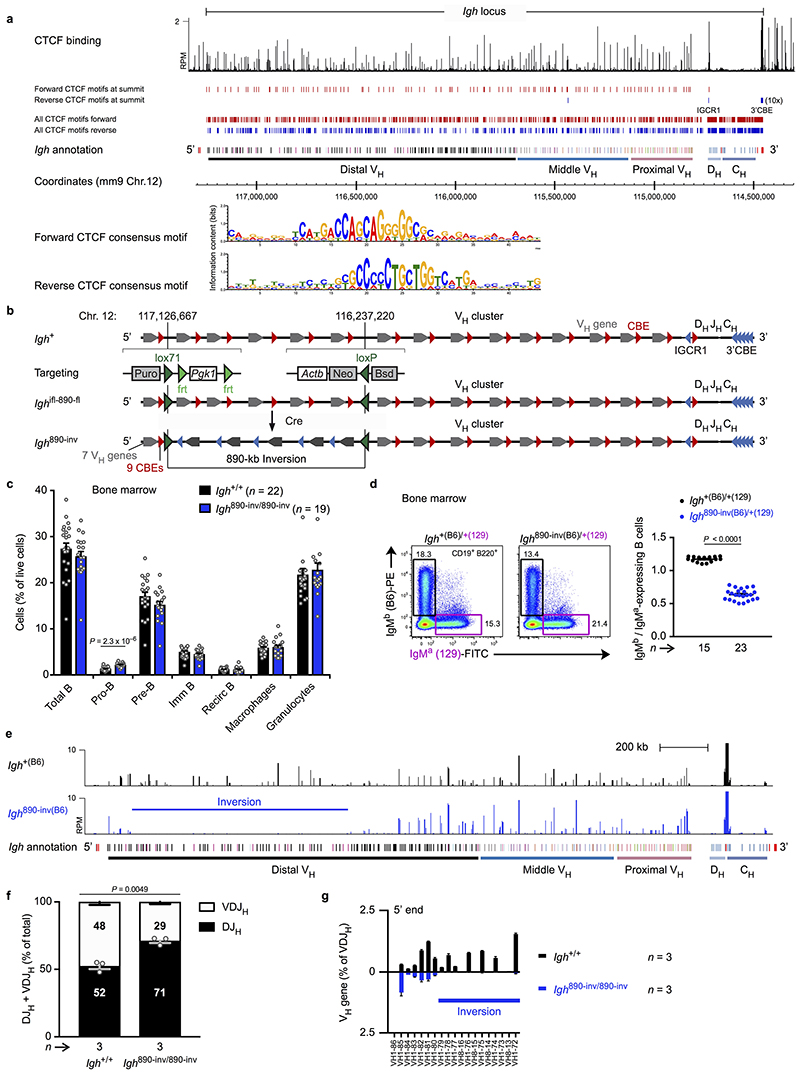
To test the loop extrusion hypothesis, we inverted an 890-kb distal Igh region, containing 32 functional VH genes and 49 CBEs that should be inefficient loop anchors, as they have the same reverse orientation as the 3’CBEs in the Igh 890-inv allele (Extended Data Fig. 1b). While B-cell development was similar in Igh 890-inv/890-inv and Igh +/+ mice, the Igh 890-inv allele in a competitive situation gave rise to half as many immature B-cells (CD19+B220+IgM+IgD–) as the wild-type allele in Igh 890-inv/+ mice (Extended Data Fig. 1c,d). Remarkably, the inverted VH genes of the Igh 890-inv allele were not expressed in immature B-cells (Extended Data Fig. 1e). Analysis of V(D)J recombination by VDJ-seq27 revealed proportionally fewer VDJH-rearranged Igh alleles in bone marrow pro-B-cells (CD19+B220+IgM–IgD–Kit+CD25–) of Igh 890-inv/890-inv mice compared to Igh +/+ littermates (Extended Data Fig. 1f). The inverted VH genes failed to undergo VH-DJH recombination in Igh 890-inv/890-inv pro-B-cells (Fig. 1a).
Fig. 1. Inversion of an 890-kb Igh region and insertion of inverted CBEs interfere with VH gene recombination.
a, VDJ-seq analysis27 of Igh 890-inv/890-inv bone marrow pro-B-cells. VH gene usage is shown as mean percentage (with SEM) of all VDJH recombination events in Igh +/+ or Igh 890-inv/890-inv pro-B-cells. The VH genes (Supplementary Table 1a) are aligned according to their Igh position. b, 3C-seq analysis of interactions from a 3’ viewpoint (HS5) or 5’ viewpoint (VH1-86) in short-term cultured Igh 890-inv/890-inv Rag2 –/– and Igh +/+ Rag2 –/– pro-B-cells. Normalized counts of the 3C-seq reads are plotted. One of two 3C-seq experiments is shown. c, Quantification of interactions. The 3C-seq reads in regions A-D (b) were quantified as mean RPM value per region for each viewpoint. RPM, reads per million mapped sequence reads. d, VDJ-seq analysis of the VH8-8 recombination frequency in pro-B-cells of the indicated genotypes. e, CTCF binding at an array of 20 CBEs, inserted at position 116,242,836 (mm9, chromosome 12) in forward (Igh CBE /CBE) or reverse (Igh CBE-inv/CBE-inv) orientation, as determined by ChIP-seq (Extended Data Fig. 3b). f, VDJ-seq analysis of VH gene recombination at the Igh 5’ end in Igh CBE/CBE and Igh CBE-inv/CBE-inv pro-B-cells. Statistical data in d were analysed by one-way ANOVA with Tukey’s post-hoc test. n, number of experiments. Each dot corresponds to one mouse (c,d).
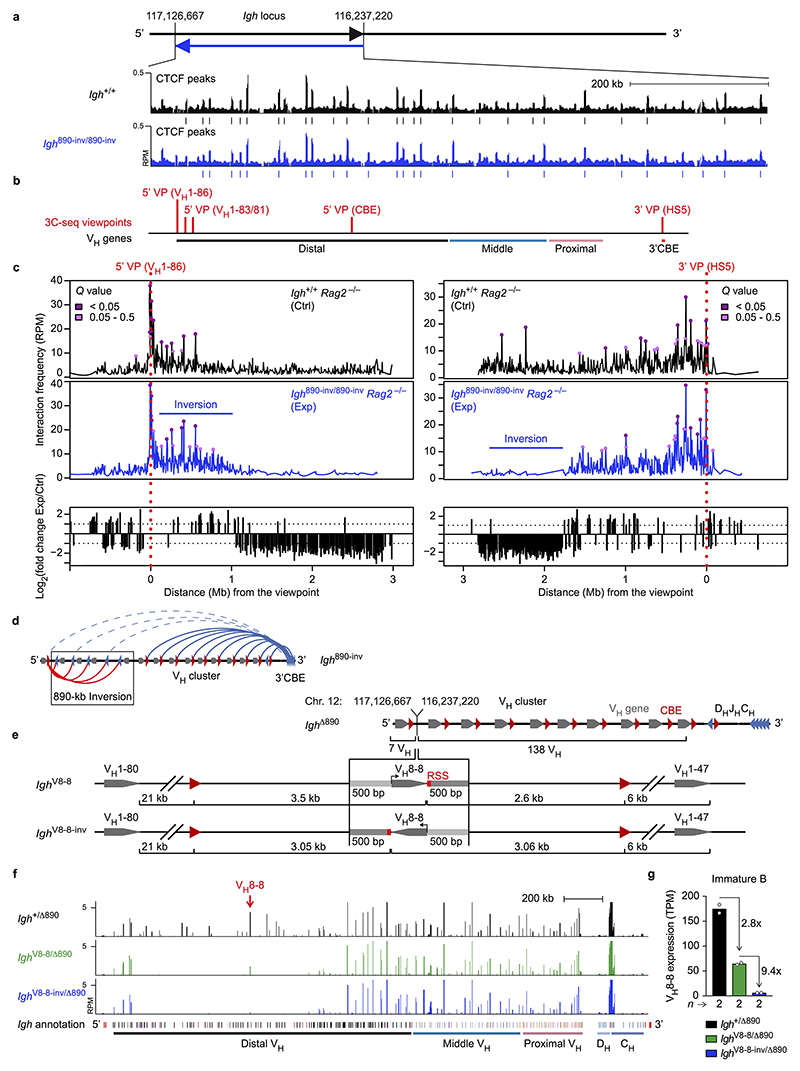
The lack of VH-DJH recombination could be caused by the inverted CBEs preventing loop formation with the 3’CBEs, by inversion of the VH genes or a combination of both. CTCF binding in the inverted region was normal in Igh 890-inv/890-inv pro-B-cells (Extended Data Fig. 2a). As RAG2 deficiency prevents V(D)J recombination16, we used Igh 890-inv/890-inv Rag2 –/– and Igh +/+ Rag2 –/– pro-B-cells for chromosome conformation capture sequencing (3C-seq) to map interactions from viewpoints at the Igh 5’ or 3’ end (Fig. 1b and Extended Data Fig. 2b,c). Interactions from the 3’ viewpoint (HS5) to the inverted region (B) were 4.4-fold reduced in Igh 890-inv/890-inv Rag2 –/– pro-B-cells compared to Igh +/+ Rag2 –/– pro-B-cells (Fig. 1b,c and Extended Data Fig. 2c). Interactions from the 3’ viewpoint to the 7 VH genes at the Igh 5’ end (A) were also decreased 3.2-fold in Igh 890-inv/890-inv Rag2 –/– pro-B-cells relative to Igh +/+ Rag2 –/– pro-B-cells (Fig. 1b,c), although these VH genes with their 9 associated CBEs were present in normal forward orientation (Extended Data Fig. 1b). Recombination of 5 of these VH genes (VH1-80 to VH1-84) in pro-B-cells and their subsequent expression in immature B-cells were strongly reduced (Fig. 1a and Extended Data Fig. 1e,g).
3C-seq analysis revealed a 1.5-fold increase of the interactions from the 5’ viewpoint (VH1-86) to the inverted region (B), but a 1.9-fold and 3-fold decrease of interactions to the middle (C) and 3’ proximal (D) regions in Igh 890-inv/890-inv Rag2 –/– pro-B-cells compared to Igh +/+ Rag2 –/– pro-B-cells (Fig. 1b,c and Extended Data Fig. 2c). The inverted CBEs in region B thus interacted preferentially with the forward CBEs in region A on the Igh 890-inv allele, which created a new loop domain in the distal VH gene region (Extended Data Fig. 2d). Hence, the convergent orientation of the CBEs in the distal VH gene cluster and the 3’CBEs promotes long-range interactions by loop extrusion across the entire Igh locus in wild-type pro-B-cells.
To study the effect of VH gene inversion, we deleted the distal 890-kb region to generate the Igh Δ890 allele, followed by re-insertion of the VH8-8 gene with its 500-bp flanking sequences (lacking CBEs) in normal forward (Igh V8-8) or inverted (Igh V8-8-inv) orientation (Extended Data Fig. 2e and Supplementary Table 1b). mRNA expression of the inverted VH8-8 gene was 9.4-fold reduced in immature Igh V8-8-inv/Δ890 B-cells compared to Igh V8-8/Δ890 B-cells (Extended Data Fig. 2f,g). VDJ-seq of Igh V8-8-inv/V8-8-inv and Igh V8-8/V8-8 pro-B-cells demonstrated a 10.5-fold lower recombination frequency of the inverted VH8-8 gene relative to the forward oriented VH8-8 gene (Fig. 1d). This recombination frequency was still 3.6-fold higher in Igh V8-8-inv/V8-8-inv pro-B-cells compared to Igh 890-inv/890-inv pro-B-cells (Fig. 1d), indicating that the recombination was further impaired upon inversion of the CBEs flanking the VH8-8 gene in the Igh 890-inv allele. In summary, efficient VH-DJH recombination depends on the forward orientation of both the VH genes and associated CTCF-binding sites.
Inverted CBEs impair VH recombination
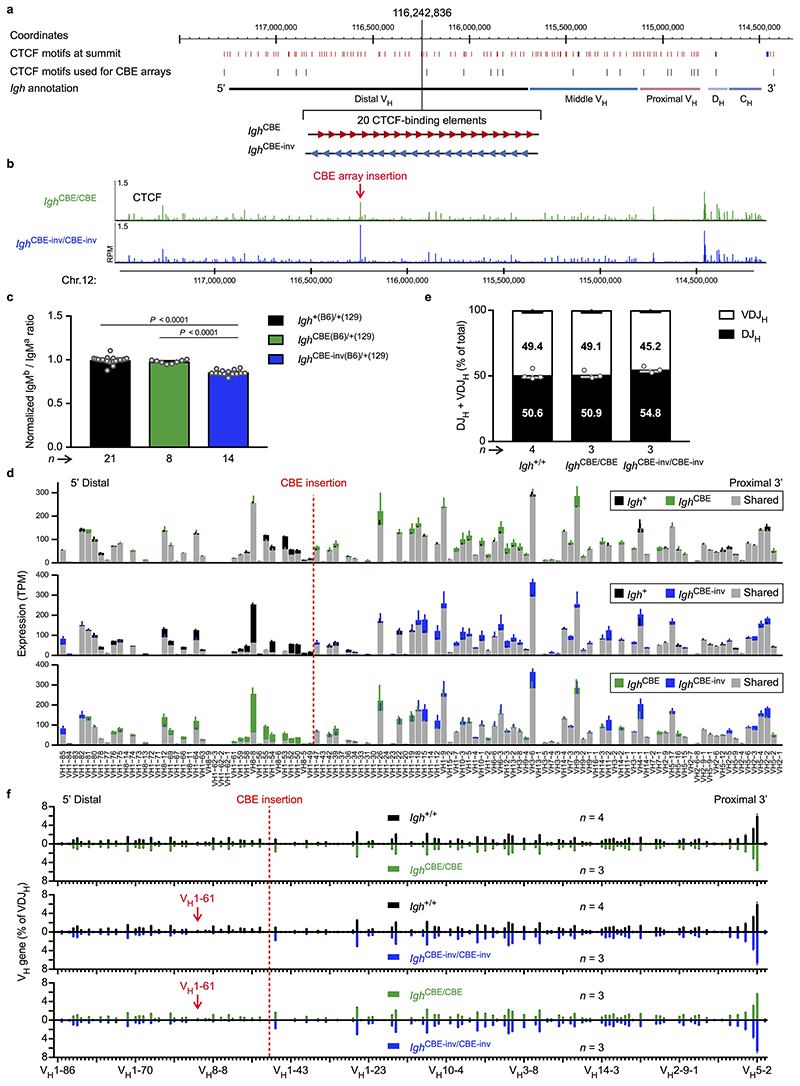
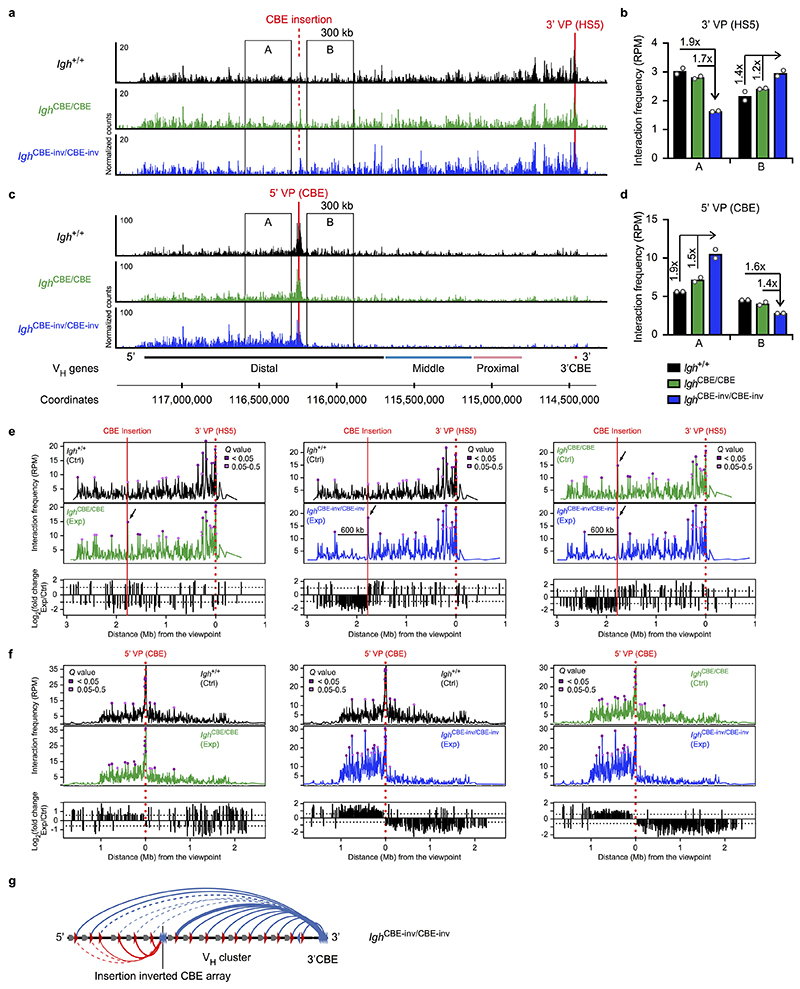
Loop extrusion across the Igh locus predicts that the insertion of multiple inverted CBEs (mimicking the 3’CBEs) in the VH gene cluster may induce a new loop pattern interfering with distal VH-DJH recombination. To test this, we generated the Igh CBE-inv and control Igh CBE alleles by inserting an array of 20 CBEs in inverted or forward orientation in the middle of the Igh locus, respectively (Fig. 1e, Extended Data Fig. 3a and Supplementary Table 1c). The inserted arrays were efficiently bound by CTCF (Fig. 1e and Extended Data Fig. 3b). Expression of the VH genes located upstream of the inverted CBE array in the Igh CBE-inv allele was strongly reduced in immature B-cells of Igh CBE-inv/+ mice compared to the respective VH genes of the Igh CBE allele in Igh CBE/+ mice (Extended Data Fig. 3c,d). VDJ-seq demonstrated that the VH genes, located 5’ of the inverted CBE array up to the VH1-61 gene at a distance of 355 kb, recombined at a significantly lower efficiency in Igh CBE-inv/CBE-inv pro-B-cells compared to Igh CBE/CBE pro-B-cells (Fig. 1f) or wild-type Igh +/+ pro-B-cells (Extended Data Fig. 3e,f). 3C-seq revealed that the long-range interactions from the 3’ viewpoint (HS5) to the VH gene region A, located upstream of the inverted CBE array, were 1.7- or 1.9-fold decreased in Igh CBE-inv/CBE-inv pro-B-cells compared to Igh CBE/CBE or Igh +/+ pro-B-cells, while the interactions to the downstream region B were 1.2- or 1.4-fold increased, respectively (Extended Data Fig. 4a,b,e). Conversely, the interactions from the 5’ viewpoint (CBE), located immediately 5’ of the CBE array insertion (Extended Data Fig. 2b and Supplementary Table 1c), to the upstream region A were 1.5- or 1.9-fold increased, and the interactions to the downstream region B were 1.4- or 1.6-fold decreased in Igh CBE-inv/CBE-inv pro-B-cells compared to the Igh CBE/CBE and Igh +/+ pro-B-cells, respectively (Extended Data Fig. 4c,d,f). Hence, the insertion of a second 3’CBE-like element created a new loop domain in the distal VH gene region of the Igh CBE-inv allele, which interfered with efficient loop formation from the Igh 3’ end (Extended Data Fig. 4g). In summary, the analyses of the distal 890-kb inversion and inverted CBE array insertion together demonstrate that loop extrusion occurs across the Igh locus, generating extraordinarily long loops of up to a 2.8-Mb size.
Pax5 represses Wapl in precursor B-cells
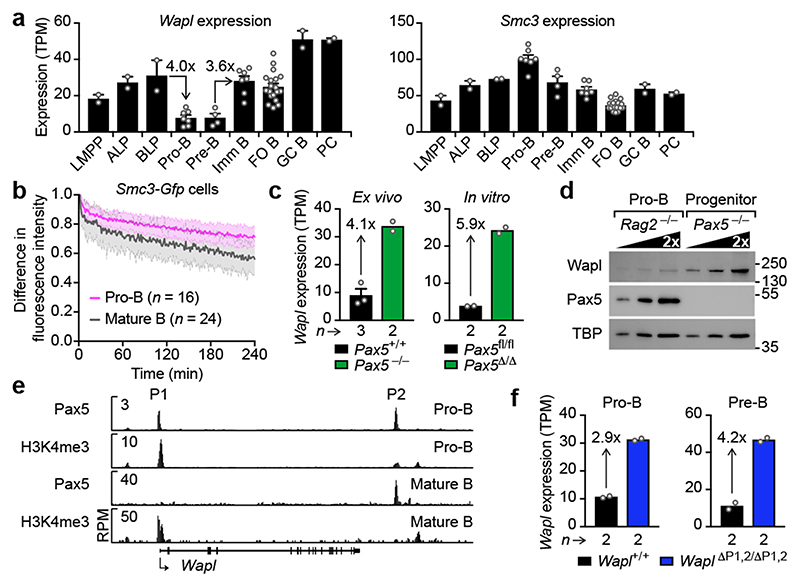
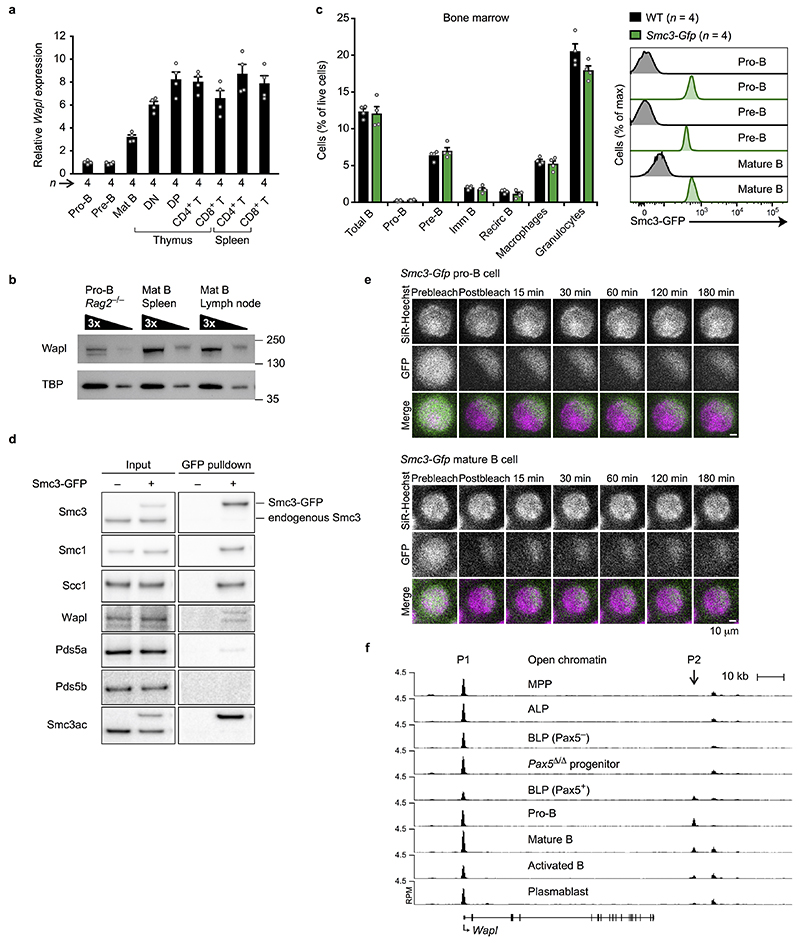
As loop extrusion depends on cohesin8-10, we investigated whether cohesin components are differentially expressed in pro-B-cells. mRNA expression of the cohesin-release factor Wapl10,14,15 was down-regulated 4-fold only in pro-B and pre-B-cells within the lymphoid system in contrast to other cohesin genes such as Smc3 (Fig. 2a and Extended Data Fig. 5a). Wapl protein expression was similarly down-regulated in pro-B-cells compared to mature B-cells (CD19+B220+IgD+; Extended Data Fig. 5b), indicating that the reduced Wapl expression may increase the residence time of cohesin on chromatin in pro-B-cells. To test this, we generated a Smc3-Gfp transgenic mouse expressing the Smc3-GFP protein in all cell types (Extended Data Fig. 5c). Smc3-GFP interacted with Smc1, Scc1 and Wapl (Extended Data Fig. 5d), suggesting that the fusion protein was functional. Bone marrow pro-B-cells and splenic mature B-cells of Smc3-Gfp transgenic mice were analysed by inverse fluorescence recovery after photobleaching (iFRAP; Extended Data Fig. 5e). The fluorescence signal recovered more slowly in Wapllow pro-B-cells compared to Waplhigh mature B-cells (Fig. 2b), demonstrating that the residence time of cohesin on chromatin was increased in pro-B-cells consistent with extended loop extrusion creating long-range interactions across the Igh locus.
Fig. 2. Pax5-dependent repression of Wapl in pro-B and pre-B-cells.
a, Expression of Wapl and Smc3 in developing B-cells. RNA-seq expression data for the indicated cell types (Methods) are shown as mean TPM values with SEM. LMPP, lymphoid-primed multipotent progenitors; ALP, all-lymphoid progenitors; BLP, B-cell-biased lymphoid progenitors; FO and GC B, follicular and germinal centre B-cells; PC, plasma cells. For experiment numbers see source data. b, iFRAP analysis of short-term cultured bone marrow pro-B-cells and ex vivo sorted splenic mature B-cells from Smc3-Gfp transgenic mice. The difference in fluorescence intensity between bleached and unbleached regions is plotted against time. The mean values are indicated by lines and the SD by shading. n, number of cells analysed. c, Wapl expression in ex vivo sorted and in vitro cultured pro-B-cells of the indicated genotypes. d, Wapl expression in cultured Pax5 –/– progenitors and Rag2 –/– pro-B-cells, determined by immunoblotting of whole-cell extracts with antibodies detecting Wapl, Pax5 or TBP. One of two experiments is shown with marker proteins (kilodaltons). e, Detection of Pax5 binding and H3K4me3 at the Wapl locus in bone marrow pro-B-cells and splenic mature B-cells by ChIP-seq. The Pax5 peaks P1 and P2 are indicated. One of two experiments is shown. f, Wapl expression in pro-B and pre-B-cells of Wapl ΔP1,2/ΔP1,2 and Wapl +/+ mice is shown as mean TPM values. n, number of RNA-seq experiments (c,f).
As Pax5 controls Igh locus contraction17,18, we investigated whether Pax5 represses Wapl expression in pro-B-cells. Wapl mRNA was 4.1- or 5.9-fold more highly expressed in ex vivo sorted Pax5 –/– or short-term cultured Pax5 Δ/Δ (Vav-Cre Pax5 fl/fl) progenitors (CD19–B220+Kit+Ly6D+) compared to wild-type pro-B-cells (Fig. 2c). Wapl protein expression was similarly increased in Pax5 –/– progenitors relative to Rag2 –/– pro-B-cells (Fig. 2d). In pro-B-cells, Pax5 bound to two sites (P1 and P2) at the Wapl locus (Fig. 2e), with the P1 site being located in the H3K4me3+ promoter at a distance of 310 bp from the transcription start site. Pax5 binding was, however, lost at the P1 site in mature B-cells (Fig. 2e). The Wapl promoter was present in open chromatin from multipotent progenitors (MPPs) to terminally differentiated plasmablasts, whereas open chromatin was detected at the P2 region only upon Pax5 expression (Extended Data Fig. 5f). Hence, the P1 and P2 sites may be involved in Wapl repression.
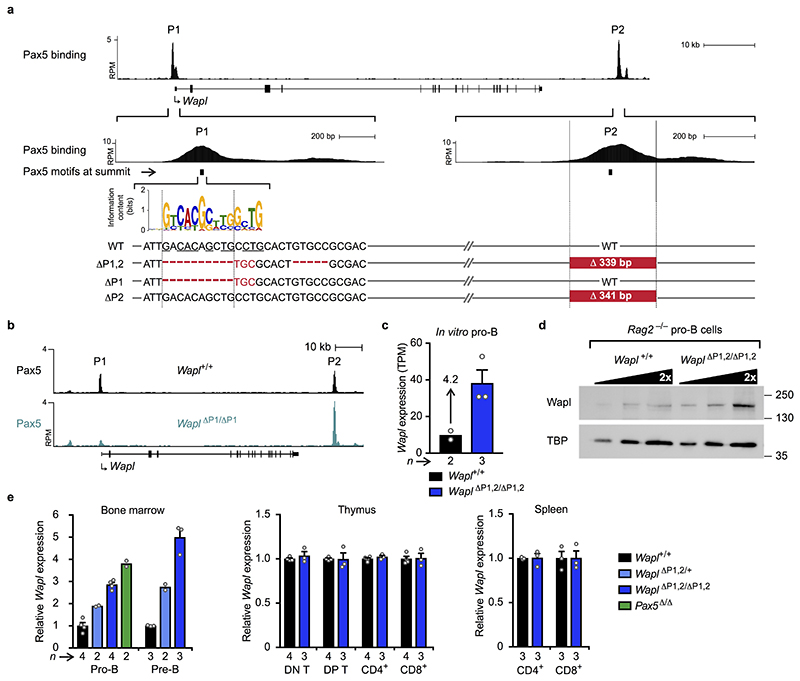
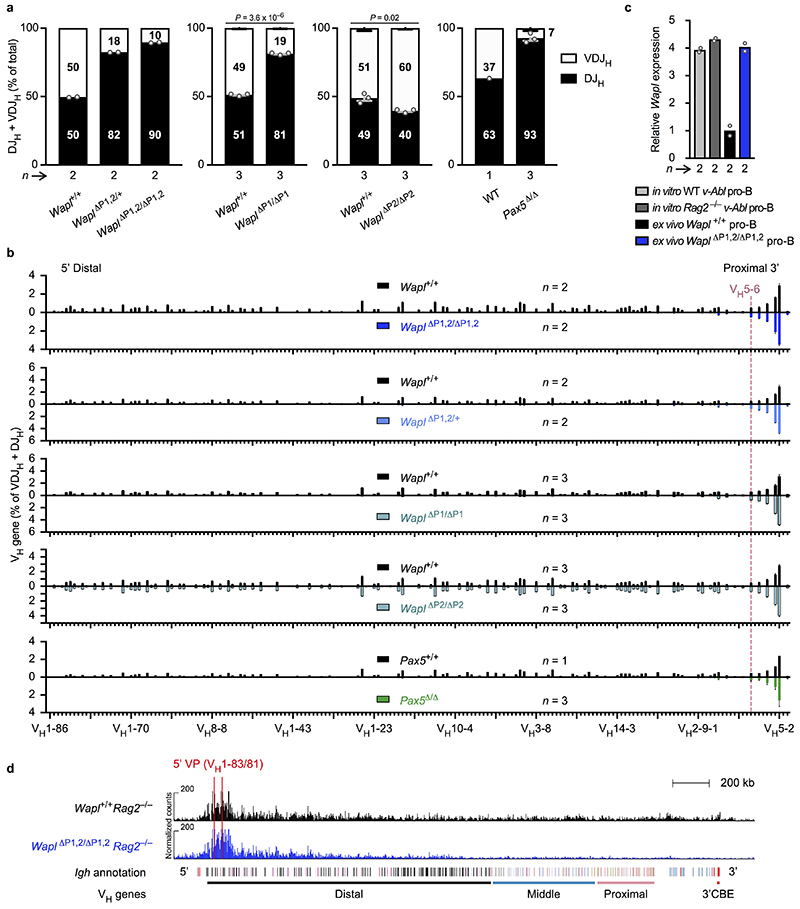
The Pax5 motif was unequivocally identified at the P1 site, but was less well defined at the P2 site (Extended Data Fig. 6a). We inactivated the P1 site by eliminating 10 bp of its Pax5 motif and deleted the P2 site by removing a 339-bp region by CRISPR/Cas9-mediated mutagenesis to generate the Wapl ΔP1,2 allele, which inadvertently resulted in a 5-bp deletion downstream of P1 (Extended Data Fig. 6a). Deletion of the P1 site prevented Pax5 binding to the Wapl promoter (Extended Data Fig. 6b). Wapl transcripts were increased 2.9- and 4.2-fold in ex vivo sorted Wapl ΔP1,2/ΔP1,2 pro-B-cells and pre-B-cells (CD19+B220+IgM–IgD–Kit–CD25+) compared to Wapl +/+ cells, respectively (Fig. 2f), while Wapl expression levels in heterozygous Wapl ΔP1,2/+ pro-B and pre-B-cells were between those of the homozygous and wild-type cells (Extended Data Fig. 6e). Increased Wapl mRNA and protein expression was confirmed in short-term cultured Wapl ΔP1,2/ΔP1,2 pro-B-cells (Extended Data Fig. 6c,d). Wapl mRNA was, however, similarly expressed throughout T-cell development in Wapl ΔP1,2/ΔP1,2 and Wapl +/+ mice (Extended Data Fig. 6e), Hence, deletion of both P1 and P2 increased Wapl expression only in pro-B and pre-B-cells, identifying Wapl as a repressed Pax5 target gene in early B-cell development.
Wapl Pax5 site induces Igh loop extrusion
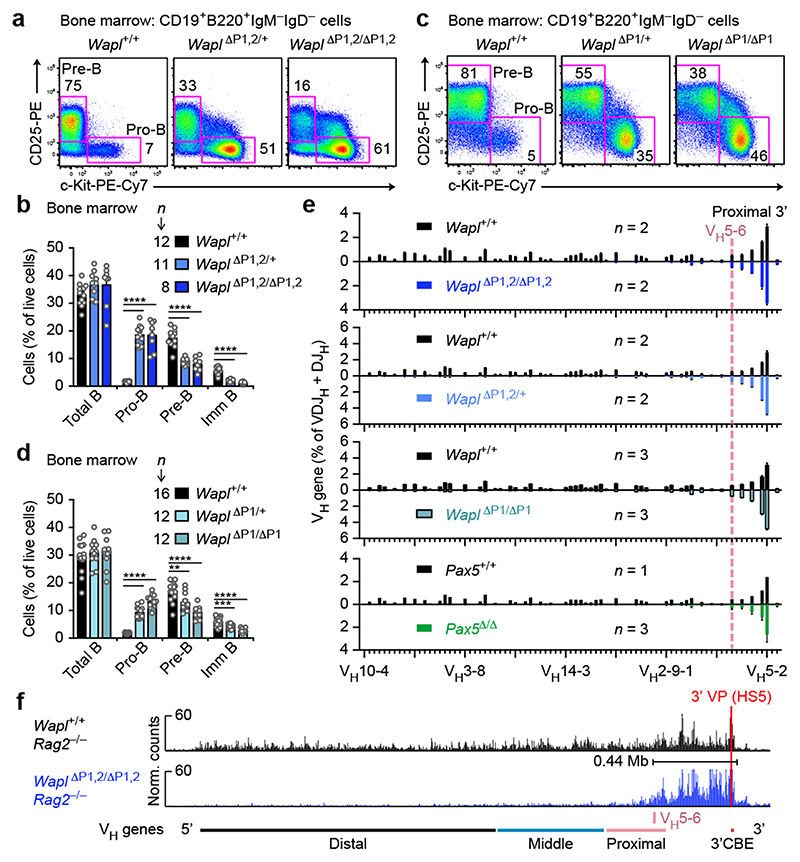
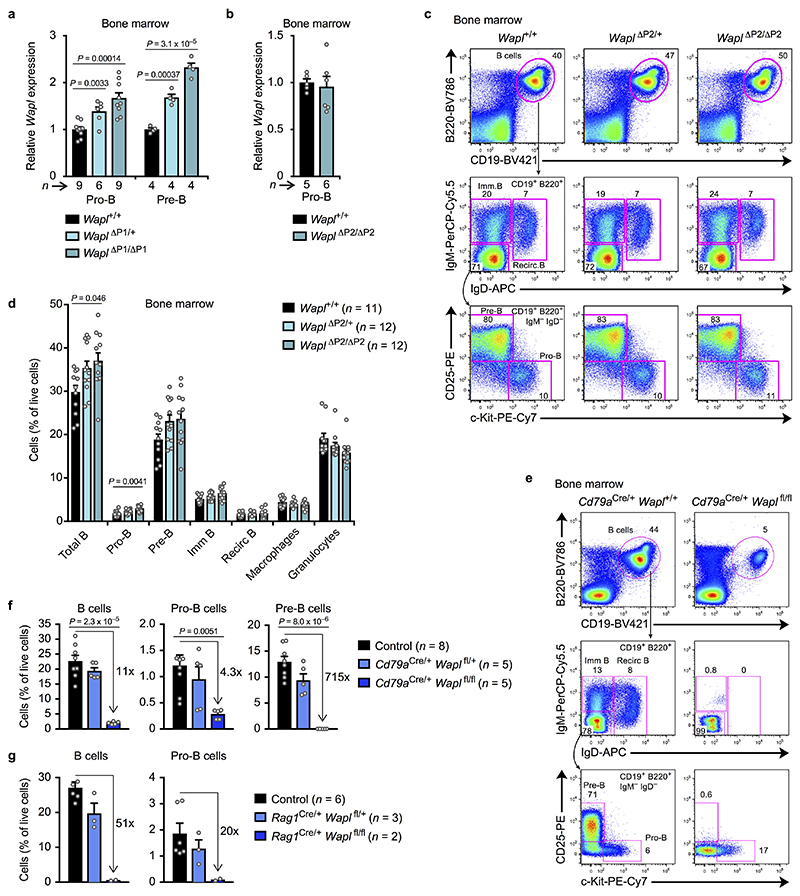
B-cell development was strongly arrested at the pro-B-cell stage in the bone marrow of Wapl ΔP1,2/ΔP1,2 and Wapl ΔP1,2/+ mice (Fig. 3a,b). We next generated the Wapl ΔP1 and Wapl ΔP2 alleles (Extended Data Fig. 6a). Wapl expression was increased in pro-B and pre-B-cells of Wapl ΔP1/+ and Wapl ΔP1/ΔP1 mice, whereas it was similarly expressed in Wapl ΔP2/ΔP2 and Wapl +/+ pro-B-cells (Extended Data Fig. 7a,b). The pro-B-cell block was strong in Wapl ΔP1/ΔP1 mice and slightly attenuated in Wapl ΔP1/+ mice (Fig. 3c,d), while B-cell development was normal in Wapl ΔP2/ΔP2 mice (Extended Data Fig. 7c,d). Hence, the developmental block is caused by loss of a single Pax5-binding site in the Wapl promoter. Notably, pro-B-cells were lost upon conditional inactivation of Wapl in lymphoid progenitors of Rag1 Cre/+ Wapl fl/fl mice or in pro-B-cells of Cd79a Cre/+ Wapl fl/fl mice (Extended Data Fig. 7e-g), indicating that pro-B-cells do not tolerate the complete loss of Wapl, while the physiological 4-fold down-regulation of Wapl expression in wild-type pro-B-cells promotes B-cell development.
Fig. 3. The Pax5-binding site at the Wapl promoter controls loop extrusion and VH-DJH recombination.
a-d, Flow cytometric analysis of B-cell development in the bone marrow of the indicated genotypes. The percentage of pro-B and pre-B-cells is indicated for one of five experiments (a,c), and the relative frequencies of the indicated cell types are shown as mean values with SEM (b,d). e, VH gene recombination in Wapl +/+ and mutant pro-B-cells, determined by pairwise VDJ-seq experiments. The VDJ-seq data of Wapl +/+ and mutant pro-B-cells are shown in the upper and lower part, respectively. The VH gene usage is shown as mean percentage of all DJH and VDJH rearrangement events with SEM. f, 3C-seq analysis of interactions from the 3’ viewpoint (HS5) in Wapl ΔP1,2/ΔP1,2 Rag2 –/– and Wapl +/+ Rag2 –/– pro-B-cells. The 0.44-Mb proximal loop domain and the position of the VH5-6 gene are indicated. One of two 3C-seq experiments is shown. Statistical data in b and d were analysed by multiple t-tests (unpaired and two-tailed with Holm-Sidak correction); **P < 0.01; ***P < 0. 001; ****P < 0.0001. n, number of mice (b,d) or experiments (e). Each dot (b,d) corresponds to one mouse.
VDJ-seq revealed that the proportion of VDJH-rearranged sequences was strongly reduced in pro-B-cells with the P1 site deletion (Wapl ΔP1,2/ΔP1,2, Wapl ΔP1,2/+ and Wapl ΔP1/ΔP1; Extended Data Fig. 8a). The middle and distal VH genes failed to undergo VH-DJH recombination in pro-B-cells with the P1 site deletion (Wapl ΔP1,2/ΔP1,2, Wapl ΔP1,2/+ and Wapl ΔP1/ΔP1) in contrast to their normal recombination in Wapl ΔP2/ΔP2 and Wapl +/+ pro-B-cells (Fig. 3e and Extended Data Fig. 8b). The recombination frequency of the proximal VH genes declined with increasing distance from the 3’ end of the VH gene cluster, as the two most proximal functional VH genes (VH5-2 (VH81X) and VH2-2) rearranged at a higher frequency, the next three VH genes (VH5-4, VH2-3 and VH5-6) at a similar frequency and the following VH genes started to lose their potential to undergo VH-DJH recombination in Wapl ΔP1,2/ΔP1,2, Wapl ΔP1,2/+ and Wapl ΔP1/ΔP1 pro-B-cells (Fig. 3e). An equally strong recombination phenotype was observed in Pax5 Δ/Δ progenitors (Fig. 3e), which are unable to contract the Igh locus17,18. Notably, v-Abl transformed pro-B-cells also do not undergo Igh locus contraction23, as they express Wapl mRNA at the same high level as Wapl ΔP1,2/ΔP1,2 pro-B-cells (Extended Data Fig. 8c).
3C-seq analysis of Wapl ΔP1,2/ΔP1,2 Rag2 –/– pro-B-cells demonstrated that interactions from the 3’ viewpoint (HS5) were only observed over a 0.44-Mb-long region up to the most 3’ proximal sequences of the VH gene cluster (Fig. 3f), including the 5 VH genes that could still undergo efficient VH-DJH recombination in Wapl ΔP1,2/ΔP1,2 pro-B-cells. Likewise, interactions from the 5’ viewpoints (VH1-83/81) could be detected only in the distal VH gene region in Wapl ΔP1,2/ΔP1,2 Rag2 –/– pro-B-cells (Extended Data Fig. 8d), whereas interactions from both viewpoints extended across the 2.8-Mb-long Igh locus in Rag2 –/– pro-B-cells (Figs. 1b and 3f). The low Wapl expression in wild-type pro-B-cells thus results in a 6-fold extension of the proximal interaction domain from 0.44 Mb to 2.8 Mb.
Pax5 recruits PRC2 to the Wapl promoter
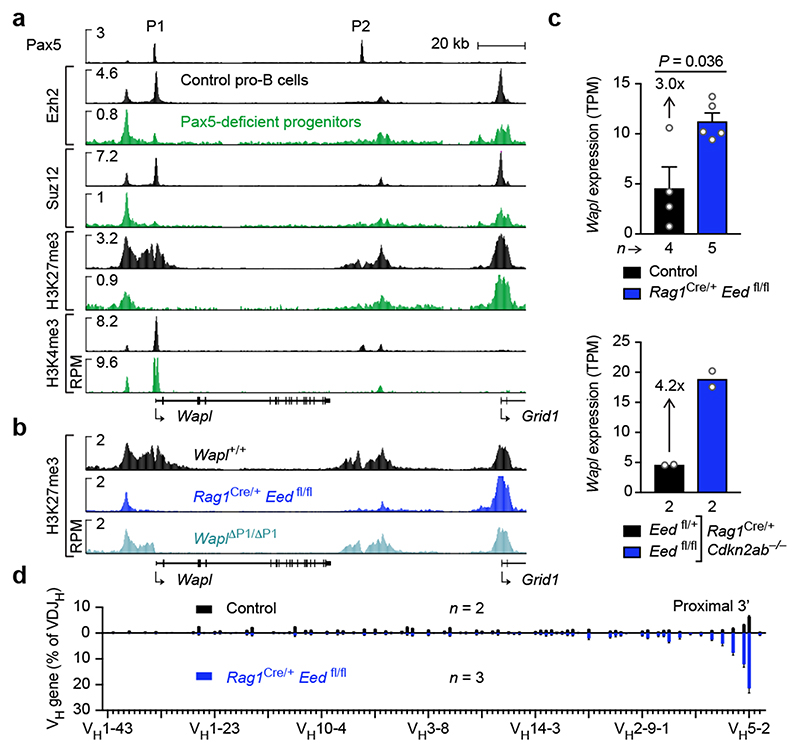
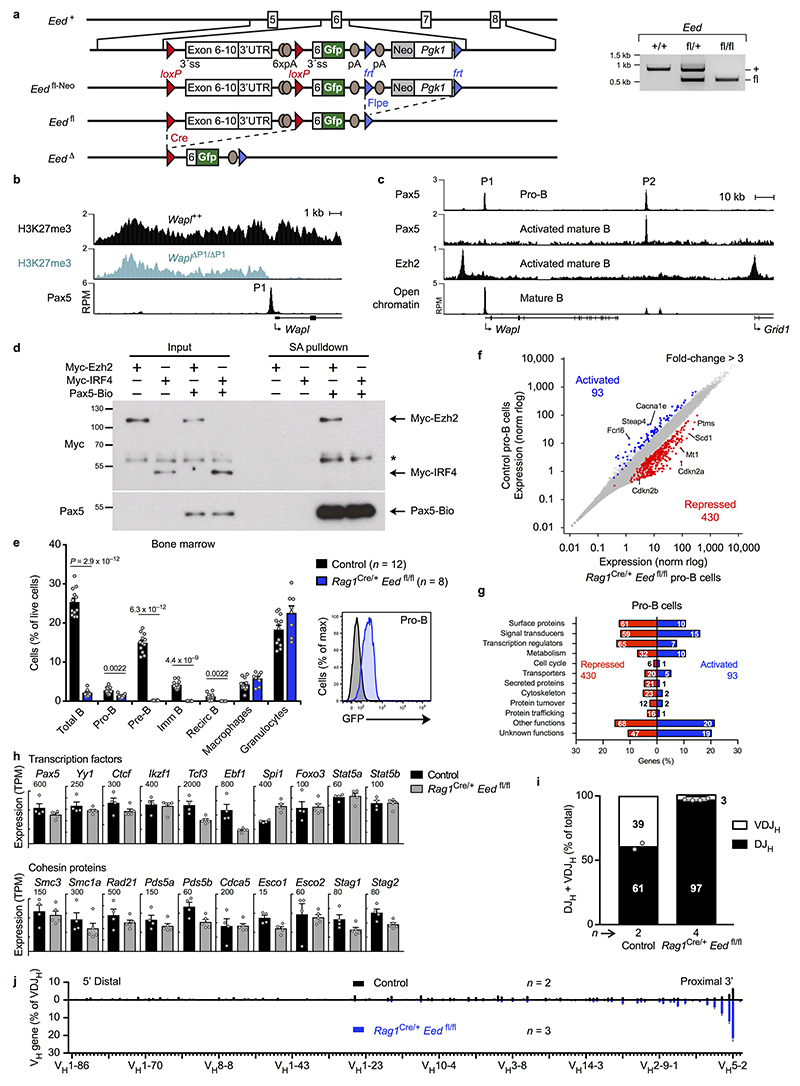
Analysis of the chromatin landscape at the Wapl locus revealed that the active histone mark H3K4me3 was abundantly present at the Wapl promoter in Pax5-deficient progenitors and Pax5-expressing control pro-B-cells (Fig. 4a). In contrast, the repressive histone mark H3K27me3, which is produced by the Polycomb repressive complex 2 (PRC2) consisting of the core components Eed, Ezh2 and Suz12 (ref. 28), was detected at the Wapl promoter only in Pax5-expressing pro-B-cells, consistent with selective binding of Ezh2 and Suz12 in these cells (Fig. 4a). We generated a floxed Eed fl allele (Extended Data Fig. 9a) for elimination of this essential PRC2 component in pro-B-cells of Rag1 Cre/+ Eed fl/fl mice. In Eed-deficient pro-B-cells, H3K27me3 was absent at the Wapl promoter in contrast to its residual presence at other locations in the locus (Fig. 4b). Moreover, H3K27me3 was specifically lost at the Wapl promoter in Wapl ΔP1/ΔP1 pro-B-cells (Fig. 4b and Extended Data Fig. 9b), and Ezh2 (PRC2) binding was absent upon loss of Pax5 binding at the P1 site in mature B-cells (Extended Data Fig. 9c). Hence, Pax5 may recruit PRC2 to the P1 site in early B-lymphopoiesis. To investigate this, we performed streptavidin-pulldown experiments with nuclear extracts prepared from HEK-293T cells that were transiently transfected with expression vectors encoding Pax5-Bio-IRES-BirA and Myc-tagged Ezh2 or IRF4 proteins. Streptavidin-pulldown of Pax5-Bio specifically co-precipitated Myc-Ezh2 but not Myc-IRF4 (Extended Data Fig. 9d). We conclude that Pax5-mediated recruitment of PRC2 represses the Wapl promoter by inducing bivalent chromatin (H3K4me3+ H3K27me3+) in pro-B-cells.
Fig. 4. Pax5-mediated recruitment of PRC2 to the Wapl promoter facilitates VH-DJH recombination.
a, Epigenetic landscape at the Wapl locus in Pax5-deficient progenitors and Pax5-expressing control pro-B-cells. Binding of Pax5, Ezh2 and Suz12 and the presence of H3K4me3 and H3K27me3 were determined by ChIP-seq. One of two experiments per genotype and antibody is shown. b, Selective loss of H3K27me3 at the Wapl promoter in Rag1 Cre/+ Eed fl/fl and Wapl ΔP1/ΔP1 pro-B-cells. One of two experiments per genotype is shown. c, Wapl mRNA expression in ex vivo sorted pro-B-cells from mice of the indicated genotypes, as shown by mean TPM values. The P value and SEM (c, top) were determined by DESeq2. d, VDJ-seq analysis of pro-B-cells from Rag1 Cre/+ Eed fl/fl or control mice. The VH gene usage is shown as mean percentage of all VDJH rearrangement events with SEM. n, number of experiments.
B-cell development in Rag1 Cre/+ Eed fl/fl mice was stringently blocked at pro-B-cells, which exhibited impaired activation of 93 genes and de-repression of 430 genes including Cdkn2a and Cdkn2b encoding cell cycle inhibitors (Extended Data Fig. 9e-g and Supplementary Table 2). However, genes encoding cohesin subunits and key regulators of early B-cell development were similarly expressed in Eed-deficient and control pro-B-cells (Extended Data Fig. 9h). In contrast, Wapl expression was derepressed 3-fold in Rag1 Cre/+ Eed fl/fl pro-B-cells and 4.2-fold in Rag1 Cre/+ Eed fl/fl Cdkn2ab –/– pro-B-cells (Fig. 4c). Consequently, VH-DJH recombination in Eed-deficient pro-B-cells was strongly reduced and was only observed for the most 3’ proximal VH genes (Fig. 4d and Extended Data Fig. 9i,j), similar to Pax5 Δ/Δ progenitors and pro-B-cells lacking the Wapl P1 site (Fig. 3e). In summary, Pax5 recruits PRC2 to the Wapl promoter to induce bivalent chromatin, which leads to down-regulation of Wapl expression, extension of loop extrusion across the Igh locus and thus participation of all VH genes in VH-DJH recombination.
Pax5 sculpts the chromosomal architecture
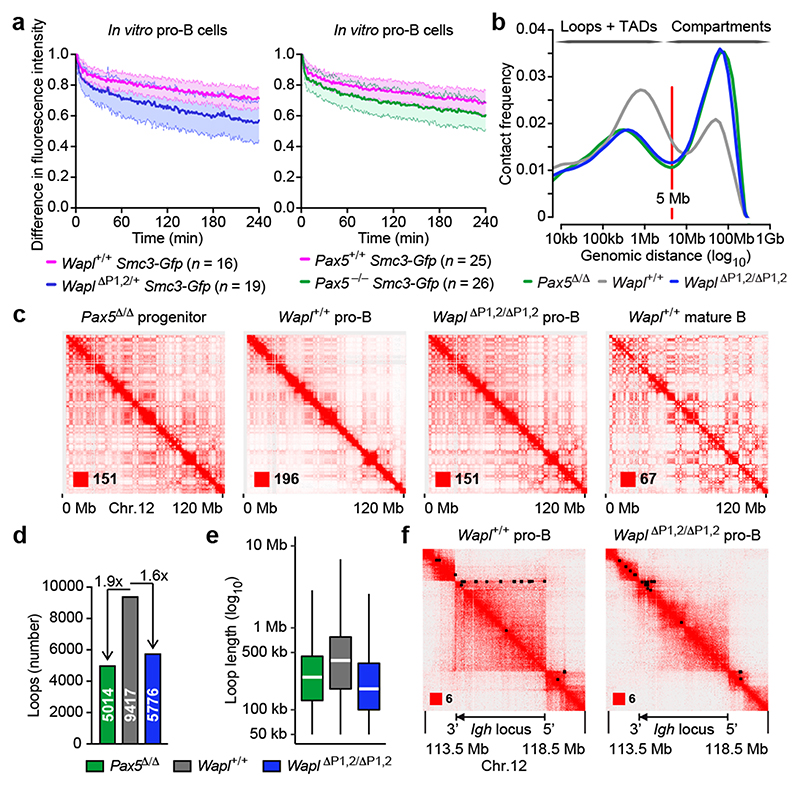
To investigate whether Wapl repression by Pax5 induces global chromosomal changes in pro-B-cells, we performed iFRAP experiments with mutant and wild-type pro-B and mature B-cells expressing the Smc3-Gfp transgene. Recovery of the fluorescence signal after photobleaching was slow only in Wapl +/+ pro-B-cells compared to the faster recovery observed with Pax5 –/– progenitors and Wapl ΔP1,2/+ pro-B-cells (Fig. 5a) as well as Wapl ΔP1,2/+ and Wapl +/+ mature B-cells (Extended Data Fig. 10a). Hence, Pax5 controls the residence time of cohesin on chromatin only in early B-cell development, consistent with the loss of Pax5 and Ezh2 binding at the Wapl promoter in mature B-cells (Fig. 2e and Extended Data Fig. 9c).
Fig. 5. Pax5-dependent changes of the entire chromatin architecture in pro-B-cells.
a, iFRAP analysis of short-term cultured bone marrow pro-B-cells from Wapl ΔP1,2/+, Pax5 –/– and wild-type mice carrying the Smc3-Gfp transgene, as described in Fig. 2b. n, number of cells analysed. b, Frequency distribution of intra-chromosomal contacts as a function of the genomic distance using logarithmically increased genomic distance bins, as determined by HOMER analysis of Hi-C data generated with short-term cultured Pax5 Δ/Δ progenitors, Wapl +/+ pro-B-cells and Wapl ΔP1,2/ΔP1,2 pro-B-cells. c, Hi-C contact matrices of chromosome 12 determined for Pax5 Δ/Δ progenitors, Wapl +/+ and Wapl ΔP1,2/ΔP1,2 pro-B-cells and ex vivo sorted Wapl +/+ mature B-cells, plotted at 250-kb bin resolution with Juicebox30. The intensity of each pixel represents the normalized number of contacts between a pair of loci4 with the maximum intensity being indicated in the lower left corner. d, Number of chromatin loops (with a length of < 5 Mb) identified in Pax5 Δ/Δ progenitors, Wapl +/+ and Wapl ΔP1,2/ΔP1,2 pro-B-cells with HiCCUPS30. e, Distribution of the loop length. The median (white lines), middle 50% of the data (boxes) and all values of 1.5× interquartile range (whiskers) are shown. f, Hi-C contact matrices of the Igh region. Black dots indicate loop anchors. Two Hi-C experiments per genotype were performed except for mature B-cells (one experiment).
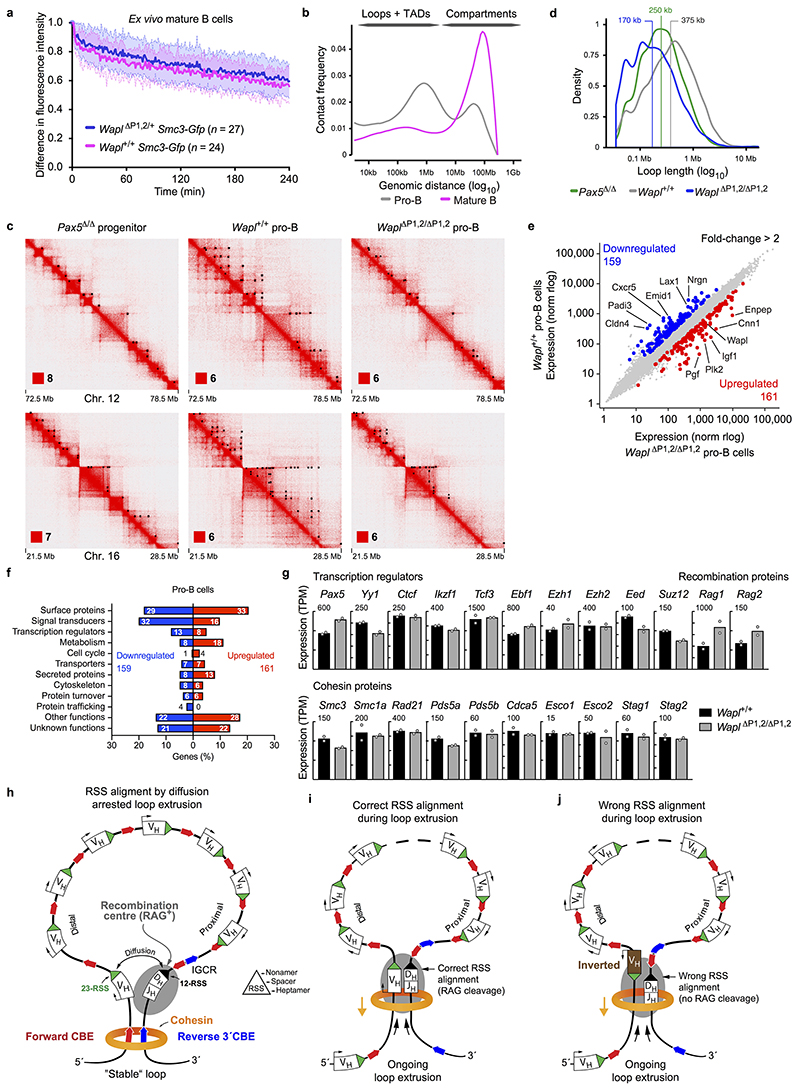
We next studied the genome-wide chromosomal architecture of pro-B and mature B-cells by in situ Hi-C4. Analysis of all identified sequence contacts revealed that the frequencies of contacts up to a distance of 5 Mb, which largely generate chromatin loops within TADs4, were significantly lower in Pax5 Δ/Δ progenitors, Wapl ΔP1,2/ΔP1,2 pro-B-cells and Wapl +/+ mature B-cells compared to Wapl +/+ pro-B-cells (Fig. 5b and Extended Data Fig. 10b). In contrast, the frequencies of contacts over very large distances (> 10 Mb), which mainly give rise to chromosomal compartments1, were strongly increased in Pax5 Δ/Δ progenitors, Wapl ΔP1,2/ΔP1,2 pro-B-cells and Wapl +/+ mature B-cells relative to Wapl +/+ pro-B-cells (Fig. 5b and Extended Data Fig. 10b). Consequently, the Hi-C contact map of chromosome 12 revealed a better-defined ‘checkerboard’ pattern of higher intensity for Pax5 Δ/Δ progenitors, Wapl ΔP1,2/ΔP1,2 pro-B-cells and Wapl +/+ mature B-cells compared to Wapl +/+ pro-B-cells (Fig. 5c). Hi-C contact maps of zoomed-in regions on chromosomes 12 and 16 demonstrated a significant extension of loops in Wapl +/+ pro-B-cells compared to Pax5 Δ/Δ progenitors and Wapl ΔP1,2/ΔP1,2 pro-B-cells (Extended Data Fig. 10c). The number of loops was increased by a factor of 1.9 and 1.6 and the average loop length by a factor of 1.5 and 2.2 in Wapl +/+ pro-B-cells compared to Pax5 Δ/Δ progenitors and Wapl ΔP1,2/ΔP1,2 pro-B-cells, respectively (Fig. 5d,e and Extended Data Fig. 10d). The Hi-C contact map of the Igh locus confirmed the 3C-seq results, as loops across the entire Igh locus were seen in Wapl +/+ pro-B-cells in contrast to Wapl ΔP1,2/ΔP1,2 pro-B-cells (Fig. 5f). Only a relatively small number of genes was upregulated (161) or downregulated (159) in Wapl ΔP1,2/ΔP1,2 pro-B-cells relative to Wapl +/+ pro-B-cells (Extended Data Fig. 10e,f and Supplementary Table 3). Genes coding for key regulators of early B-cell development or cohesin subunits other than Wapl were not deregulated (Extended Data Fig. 10g). In summary, the 4-fold repression of Wapl, mediated by a single Pax5-binding site (P1), leads to massive alterations of the chromosomal architecture in pro-B-cells.
Discussion
The long-range interaction and VH-DJH recombination defects, observed upon inversion of a distal 890-kb region or insertion of an inverted CBE array in the Igh locus, provide strong evidence that it is the loop extrusion mechanism rather than any other folding principle that creates the long-range interactions across the Igh locus. The finding that a distal VH gene upon its inversion can no longer participate in VH-DJH recombination demonstrates an essential role for loop extrusion in correctly positioning the convergent RSS elements of the VH and DJH-rearranged gene segments for RAG-mediated cleavage and recombination16. In a ‘stable’ loop anchored at the 3’CBEs, the RSS elements of two adjacent gene segments could be correctly aligned by local diffusion (Extended Data Fig. 10h). However, as loop extrusion may initiate at any position within the Igh locus, it is also conceivable that cohesin rings moving by symmetrical loop extrusion11,12 through the RAG-bound recombination centre29 may correctly position the RSS sequences of a VH gene and the DJH-rearranged gene segment for subsequent RAG-mediated cleavage (Extended Data Fig. 10i). This model of correct RSS alignment through ongoing loop extrusion could also explain why an inverted VH gene cannot rearrange due to misalignment of the respective RSS elements (Extended Data Fig. 10j).
The 4-fold repression of Wapl by Pax5 causes global changes of the chromosomal architecture in pro-B-cells, as the number and length of chromatin loops are significantly increased, while the compartments are weakened similar to observations made with Wapl-depleted human cell lines10,15. This global phenotype is exquisitely sensitive to small changes of Wapl expression, as a 2-fold increase of Wapl expression in Wapl ΔP1,2/+ pro-B-cells is sufficient to decrease the residence time of cohesin on chromatin, to abolish long-range looping across the Igh locus and, by inference, to induce global alterations in the chromosome architecture. In summary, the entire genome of pro-B-cells undergoes massive three-dimensional changes to facilitate the generation of a diverse antibody repertoire through participation of all VH genes in VH-DJH recombination, which depends on prolonged loop extrusion across the Igh locus.
Methods
Mice
The following mice were maintained on the C57BL/6 background: Pax5 +/– mice31, Pax5 fl/fl mice32, Pax5 Bio/Bio mice33, Pax5 ihCd2/ihCd2 mice34, Rag2 –/– mice35, Cdkn2ab +/– mice36, Wapl fl/fl mice14, Meox2 Cre/+ mice37, Rag1 Cre/+ mice38, Cd79a(Mb1)Cre/+ mouse39, Rosa26 CreERt2/+ mice40, transgenic Vav-Cre mice41, transgenic Flpe mice42 and transgenic CAGGs-Dre mice43. All animal experiments were carried out according to valid project licenses, which were approved and regularly controlled by the Austrian Veterinary Authorities.
Generation of mutant mice
Genetic alterations were introduced into the C57BL/6 Igh allele. The hybrid C57BL/6 × 129Sv ES cell line A9 was used for homologous recombination in ES cells. The frt-flanked Pgk1-Neo or Pgk1-Puro expression cassette, which was used for selection of the targeted ES cell clones, was deleted after germline transmission in the mutant mice additionally expressing the Flpe transgene42, except for the generation of Igh fl-890-fl and Igh ifl-890-fl alleles. All mutant strains were back-crossed to the C57BL/6 background. The Igh fl-890-fl and Igh ifl-890-fl alleles were created by first inserting a loxP (fl) site at position 116,237,220 (mm9, Chr. 12) into the middle of the VH gene cluster followed by insertion of a second lox (lox71) site (in the same orientation; Igh fl-890-fl) or an inverted lox71 (ifl) site (Igh ifl-890-fl) at position 117,126,667 in the Igh 5’ region by ES cell targeting (Extended Data Fig. 1b). The Igh 890-inv allele was generated by Cre-mediated inversion of the lox71/loxP-flanked Igh region in Meox2 Cre/+ Igh ifl-890-fl/+ mice (Extended Data Fig. 1b). The Igh Δ890 allele was created by Cre-mediated deletion of the lox71/loxP-flanked Igh region in Meox2 Cre/+ Igh fl-890-fl/+ mice. The Igh V8-8 and Igh V8-8-inv alleles were generated by using the Floxin method44 to insert the VH8-8 gene in both orientations into Igh Δ890/+ ES cells (Extended Data Fig. 2e and Supplementary Table 1b). The rox-flanked Actb-Bsd expression cassette, used for selection of targeted ES cells, was deleted after germline transmission with the CAGGs-Dre transgene, which left only one frt and one rox site in the targeted Igh locus. An array of 20 CBEs (Supplementary Table 1c) was inserted in both orientations at position 116,242,836 (mm9, Chr. 12) into the Igh locus by targeting Rosa26 CreERt2/+ ES cells to generate the Igh CBE and Igh CBE-inv alleles (Extended Data Fig. 3a). The loxP-flanked Pgk1-Neo expression cassette, used for selection of targeted Rosa26 CreERt2/+ ES cells, was deleted by 4-hydroxytamoxifen-mediated induction of Cre activity in ES cells. The Eed fl allele was created by ES cell targeting as described in detail in Extended Data Fig. 9a. The Wapl ΔP1,2/+, Wapl ΔP1/+ and Wapl ΔP2/+ mice were generated by CRISPR/Cas9-mediated genome editing in mouse zygotes45 (C57BL/6 × CBA). For this, mouse zygotes were injected with Cas9 mRNA, a P1-specific sgRNA (linked to the scaffold tracrRNA) and a repair template to specifically delete the Pax5-binding site P1 and/or with Cas9 mRNA and two different P2-specific sgRNAs and a repair template to delete a 340-bp fragment encompassing the site P2 (Extended Data Fig. 6a and Supplementary Table 4). The Smc3-Gfp transgenic mouse line 43 was generated by injecting the pronucleus of a mouse zygote with the bacterial artificial chromosome (BAC) RP24-276L14 containing the Smc3 locus that was modified by insertion of a C-terminal localization-affinity purification (LAP) tag comprising the green fluorescent protein (GFP)46.
Antibodies
The following monoclonal antibodies were used for flow cytometric analysis of the mouse bone marrow, spleen and thymus: B220/CD45R (RA3-6B2), CD2 (RM2-5), CD3 (145-2C11), CD4 (L3T4), CD5 (53-7.3), CD8a (53-6.7), CD11b (M1/70), CD19 (1D3), CD21/CD35 (7G6), CD23 (B3B4), CD25/IL-2Rα (PC61), CD28 (37.51), CD44 (IM7), CD90.2/Thy1.2 (30-H12), CD95/Fas ((Jo2), CD115/MCSF-R (AFS98), CD117/Kit (2B8), CD127/IL-7Rα (A7R34), CD135/Flt3 (A2F10.1), CD138 (281-2), GL7(GL7), Gr1 (RB6-8C5), hCD2 (RPA-2.10), IgD (11-26c), IgM (II/41), IgMa (MA-69), IgMb (AF6-78), Ly6D (49H4), Sca1/Ly6A (D7), TCRβ (H57-597) and Ter119 (TER119).
The following antibodies were used for immunoblot or immunoprecipitation analyses: anti-Ezh2 (rabbit mAb clone D2C9; Cell Signaling) or anti-Ezh2 (rabbit polyclonal Ab, pAb-039-050; Diagenode), anti-Myc (mouse mAb clone 9E10; produced in-house), anti-Suz12 (rabbit mAb clone D39F6; Cell Signaling), anti-Pax5 (rabbit polyclonal Ab, detecting the paired domain (amino acids 17-145)47; Busslinger laboratory), anti-CTCF (rabbit polyclonal Ab 07-729; Merck Millipore), anti-Wapl (rabbit polyclonal Ab, A960; Peters laboratory), anti-TBP (mouse mAb clone 3TF1-3G3; Active Motif), anti-GFP (chicken polyclonal Ab, ab13970; Abcam), anti-Smc1 (rabbit polyclonal Ab, A300-055A; Bethyl Laboratories), anti-Smc3 (rabbit polyclonal Ab, A300-060A; Bethyl Laboratories), anti-Smc3ac (mouse mAb; a gift from K. Shirahige), anti-Scc1(Rad21) (mouse mAb 53A303; EMD Millipore Corporation), anti-Pds5a (rabbit polyclonal Ab, A300-089A; Bethyl Laboratories), anti-Pds5b (rabbit polyclonal Ab, A300-537A; Bethyl Laboratories), anti-H3K4me3 (rabbit polyclonal Ab, pAb-003-050; Diagenode) and anti-H3K27me3 (rabbit mAb 9733; Cell Signaling).
Definition of cell types by flow cytometry
Cell types were defined as follows in the bone marrow: MPP (Lin–KithiSca1hi), LMPP (Lin–KithiSca1hiCD135+), ALP (Lin–CD127+CD135+Ly6D–), Pax5– BLP (Lin–CD127+CD135+Ly6D+hCD2(Pax5)–), Pax5+ BLP (Lin–CD127+CD135+Ly6D+hCD2(Pax5)+), Pax5-deficient progenitors (CD19–B220+Kit+Ly6D+), pro-B cells (CD19+B220+IgM–IgD–Kit+CD25–), pre-B cells (CD19+B220+IgM–IgD–Kit–CD25+), immature B cells (CD19+B220+IgM+IgD–), recirculating B cells (CD19+B220+IgD+), plasma cells Lin−GFP(Blimp1)hiB220loCD138hiCD28+, macrophages (CD115+Gr1int), granulocytes (Gr1+); in the spleen: immature B cells (CD19+B220+IgM+IgD–), mature B cells (CD19+B220+IgD+), follicular (FO) B cells (CD19+B220+CD23+CD21lo), germinal centre (GC) B cells (CD19+B220+GL7+Fas+), T cells (TCRβ+), CD4+ T cells (CD4+CD8–), CD8+ T cells (CD4–CD8+); in the thymus: DN T cells (CD4–CD8–CD90.2+), DP T cells (CD4+CD8+), CD4+ SP T cells (CD4+CD8–), CD8+ SP T cells (CD4–CD8+). Lineage depletion (Lin–) was performed using the MagniSort™ Mouse Hematopoietic Lineage Depletion Kit (Thermo Fisher Scientific), which contains anti-CD2, CD3, CD5, CD11b, CD19, B220/CD45R, Ly6G and Ter119 antibodies. Flow cytometry experiments and FACS sorting were performed on LSR Fortessa (BD Biosciences) and FACSAria III (BD Biosciences) machines, respectively. Flowjo software (Treestar) was used for data analysis.
In vitro culture of pro-B cells
Pro-B cells and Pax5-deficient progenitors were cultured on OP9 cells in IL-7-containing IMDM as described48.
RT-qPCR analysis of mRNA expression
Total RNA was prepared from distinct B and T cell types sorted from the bone marrow, thymus and spleen or from in vitro cultured v-Abl pro-B cell lines, using a semi-automated RNA bead isolation method with Sera-Mag SpeedBead Carboxylate-Modified Magnetic Particles (Hydrophobic; GE Healthcare) run on the magnetic particle processor KingFisher Duo instrument (Thermo Fisher Scientific). The cDNA was synthesized using Oligo d(T)18 primer (NEB) and SuperScript II Reverse Transcriptase (Thermo Fisher Scientific) in the presence of RNase inhibitor (Thermo Fisher Scientific). The transcripts of selected genes were amplified by qPCR using primers located in different exons (Supplementary Table 4) and were normalized against the Tbp mRNA.
Transient transfection and co-precipitation analysis
To investigate the interaction of Pax5-Bio with PRC2 by co-precipitation experiments (Extended Data Fig. 9d), 1.5 × 10⁷ HEK-293T cells were transiently transfected by Lipofectamine (Invitrogen) with the expression plasmids pCMV-mPax5-Bio-IRES-BirA (1 μg), pCMV-myc-hEzh2 (1 μg), pCMV-hSuz12 (1 μg) and pCMV-mEed (1μg) or with pCMV-mPax5-Bio-IRES-BirA (1 μg) and pCMV-myc-mIRF4 (1 μg). Two days after transfection, nuclear extracts were prepared as described in detail49 and their protein content was measured by Bradford assay (BioRad). All Dynabeads used for streptavidin pulldown were incubated with 1 mg/ml BSA in PBS overnight at 4 °C. Nuclear extracts were precleared with protein G Dynabeads for 1 h at 4 °C and subsequently incubated at 4 °C overnight with M-280 Streptavidin Dynabeads (Thermo Fisher Scientific). The beads were washed five times in 20 mM Tris pH 8, 250 mM KCl, 1.5 mM MgCl2, 10% glycerol, 2 mM 6-aminocaproic acid (6AA), 10 mM NaF, 1 mM β-glycerophosphate, 1 mM sodium pyrophosphate and 1× cOmplete Protease Inhibitor Cocktail (Roche) by removal of the supernatant by magnetic sorting. The precipitated proteins were resuspended in 2× SDS sample buffer, eluted from the beads by boiling and separated by SDS-PAGE followed by immunoblotting.
Inverse fluorescence recovery after photobleaching (iFRAP) analysis
In vitro short-term cultured pro-B cells and Pax5-deficient progenitors as well as ex vivo sorted splenic mature B cells (CD43–) expressing the Smc3-Gfp transgene were seeded onto poly-L-lysine-coated glass slides in phenol red-free IMDM in the presence of recombinant IL-7 or BAFF 60-mer ligand (AdipoGen Life Sciences), respectively. Cells were imaged on a LSM710 confocal microscope (Carl Zeiss) at 37 °C in the presence of 5% CO2, using a 40×/1.4 numerical aperture (N/A) objective. DNA was counterstained with 0.5 μM SiR-Hoechst (SiR-DNA, Spirochrome) for 4 h before the experiment. Two images were acquired before bleaching half of the nucleus by two iterations of a 488 nm laser at maximal intensity, and 240 images were acquired afterwards at 1 min intervals. Signal intensities were measured in bleached and unbleached regions followed by background subtraction using the blue ZEN software (version 2.6). Normalization of the iFRAP curve and curve fitting were performed as described50.
Mapping of open chromatin regions
Open chromatin regions were mapped in ex vivo sorted lymphoid progenitors and different B cell types by the ATAC-seq method as described51 with the modification that the nuclei were prepared by incubating cells with nuclear preparation buffer (0.3 M sucrose, 10 mM Tris pH 7.5, 60 mM KCl, 15 mM NaCl, 5 mM MgCl2, 0.1 mM EGTA, 0.1% NP-40, 0.15 mM spermine, 0.5 mM spermidine, and 2 mM 6AA) before treatment with the transposase Tn5 (4 μl of Nextera Tn5 transposase per 30,000 cells).
ChIP analysis of transcription factors, epigenetic regulators and histone modifications
Ex vivo sorted and short-term cultured pro-B cells were crosslinked with 1% formaldehyde (Sigma) for 10 min (Pax5, CTCF and histone modification analysis). Nuclei were prepared and lysed in the presence of 0.25% SDS (Pax5, CTCF) or 1% SDS (histone modifications). The chromatin was sheared by sonication with the Bioruptor® Standard (Diagenode), followed by immunoprecipitation with specific antibodies. The specific enrichment was measured and calculated as the precipitated DNA amount relative to input DNA.
For Suz12 and Ezh2 ChIP-seq experiments, short-term cultured control (Rag2 –/–) and Pax5-deficient (Pax5 –/– Rag2 –/–) pro-B cells as well as activated mature B cells were subjected to crosslinking first with 1% formaldehyde (Sigma) for 10 min followed by 2 mM disuccinimidyl glutarate (DSG, 20593, Thermo Fisher Scientific) for 45 min. Nuclei were prepared and lysed in the presence of 0.25% SDS. Pax5 binding was determined in mature Pax5 Bio/Bio B cells, which were stimulated with 1.5 mg/ml anti-CD40 (HM40-3, eBioscience) and 10 ng/ml IL-4 for 2 days, followed by Bio-ChIP-seq analysis as described52. The ChIP-precipitated DNA (1–2 ng) was used for library preparation and subsequent Illumina deep sequencing (Supplementary Table 5).
VDJ-seq analysis
VDJ-Seq analysis of the Igh locus was performed as described27. Genomic DNA was extracted from ex vivo sorted pro-B cells. The DNA (2 μg) was sheared using the Bioruptor sonicator (Diagenode) and subjected to end-repair and A-tailing, followed by ligation of adapters containing 12 UMI sequences using the NEBNext Ultra II DNA library prep kit from Illumina (NEB). A primer extension step with biotinylated JH-specific primers generated the single-stranded DNA products that were captured using Dynabeads MyOne streptavidin T1 beads (Thermo Fisher Scientific) and PCR-amplified with nested JH-specific and adapter-binding primers (Supplementary Table 4). The llumina sequencing adapter primers including the indexes for multiplexing of libraries were added to the PCR products in a final PCR amplification step. Paired-end 300-bp sequencing was performed on a MiSeq (Illumina) sequencing instrument (Supplementary Table 5).
3C-seq analysis
The 3C-seq method, which is a modified version of the 3C-HTGTS method23, is based on the VDJ-seq method27. In short, 3C-templates were prepared by crosslinking 107 short-term cultured pro-B cells in 2% formaldehyde for 10 min, followed by quenching with glycine and cell lysis. Nuclei were subjected to treatment with 0.5% SDS (62 °C, 10 min) and 1.14% Triton X-100 (37 °C, 15 min), and chromatin was digested with DpnII (4x 500 U DpnII (NEB) at 37 °C for 4-5 h), as described4. After heat inactivation of DpnII, the chromatin was ligated, then de-crosslinked (0.3 mg/ml proteinase K, 55 °C for 4 hr and 65 °C overnight) and treated with RNase A. Phenol-chloroform extracted DNA (5-6 μg) was used for 3C-seq library preparation by using the VDJ-seq method27 with viewpoint-specific biotinylated and nested primers (Supplementary Table 4), followed by paired-end 300-bp sequencing on a MiSeq (Illumina) sequencing instrument (Supplementary Table 5).
Complementary DNA (cDNA) preparation for RNA-sequencing
Total RNA from ex vivo sorted pro-B and pre-B cells or short-term in vitro expanded pro-B cells was isolated with the RNeasy Plus Mini Kit (Qiagen), and mRNA was purified by two rounds of poly(A) selection with the Dynabeads mRNA purification kit (Invitrogen). The mRNA was fragmented by heating at 94 °C for 3 min in fragmentation buffer. The fragmented mRNA was used as template for first-strand cDNA synthesis with random hexamers and the Superscript Vilo First-Strand Synthesis System (Invitrogen). The second-strand cDNA synthesis was performed with 100 mM dATP, dCTP, dGTP and dUTP in the presence of RNase H, E. coli DNA polymerase I and DNA ligase (Invitrogen).
Library preparation and Illumina deep sequencing
About 0.6-20 ng of cDNA or ChIP-precipitated DNA was used as starting material for the generation of sequencing libraries with the NEBNext Ultra II DNA library prep kit for Illumina (NEB). Alternatively, sequencing libraries were generated using the NEBNext End Repair/dA-Tailing Module and NEBNext Ultra Ligation Module (NEB) followed by amplification with the KAPA Real-Time Amplification kit (KAPA Biosystems). Cluster generation and sequencing were carried out using the Illumina HiSeq 2500 system with a read length of 50 nucleotides, according to the manufacturer’s guidelines.
Hi-C library preparation
CD19+ pro-B cells or B220+ Pax5-deficient progenitors, which were isolated from the bone marrow by immunomagnetic enrichment with anti-CD19- or B220-MicroBeads (Milteny Biotec), respectively, were cultured for 4-12 days on OP9 cells in IL-7-containing IMDM48. Prior to Hi-C library preparation, the cultured CD19+ pro-B cells or B220+ Pax5-deficient progenitors were purified by immunomagnetic enrichment with anti-CD19- or B220-MicroBeads (Milteny Biotec) to eliminate contaminating OP9 feeder cells. The CD19+ pro-B cells were additionally depleted of IgM-expressing cells. Mature CD43– B cells were isolated from the spleen with the B Cell Isolation Kit (mouse; Milteny Biotec), which depleted CD43-expressing immature B cells and non-B cells following staining with biotin-conjugated anti-CD43, anti-CD4 and anti-Ter119 antibodies and subsequent depletion with Anti-Biotin Microbeads. Hi-C libraries were prepared from 2 × 10⁷ cells as described in detail4 and were sequenced using the Illumina NextSeq system with a read length of 75 nucleotides in the paired-end mode, according to the manufacturer’s guidelines.
Identification of CTCF peaks in the Igh locus
We identified CTCF peaks (here referred to as CTCF-binding elements; CBEs) in the Igh locus based on the published data of our CTCF antibody ChIP-seq experiment (GSM114565) that was performed with short-term cultured Rag2 –/– pro-B cells18. Sequence reads were uniquely aligned to the mouse genome assembly version of July 2007 (NCBI37/mm9) using the Bowtie program version 1.0 (ref. 53). CTCF peaks were called by MACS 1.3.6.1 (ref. 54) and filtered for P values of < 10-10 to obtain a total of 97,487 peaks. We subsequently split all 166 peaks called in the Igh locus (mm9, Chr.12; 114,451,520-117,269,160) using PeakSplitter55 with height cutoff parameter 10 and valley parameter 0.4, and applied a conservative height cutoff of 100 reads to obtain a final list of peaks. This resulted in 137 CBEs: 10 CBEs at the 3’ end, 2 CBEs in the IGCR1 region and 125 CBEs within the VH gene cluster (Extended Data Fig 1a). The inverted region (mm9 Chr12: 116,237,220-117,126,667) of the Igh 890-inv allele contained 49 CBEs.
To enumerate all potential CTCF-binding sites in the Igh locus, we retrieved the repeat-masked mouse genome sequence (mm9) using EXONERATE56 and scanned the sequence region of the Igh locus with a CTCF motif derived from the summits of the top 300 CTCF peaks, using MEME57. The scanning was done with FIMO version 4.9.1 (ref. 57) by setting the P value threshold to < 0.001, which resulted in 994 (forward) and 791 (reverse) hits (Extended Data Fig 1a). For 115 of the 137 CBEs, we could assign a clear CTCF motif within 25 bp from the peak summit. Within the inverted region of the Igh 890-inv allele, 37 of the 49 CBEs contained a CTCF motif.
Definition of the 5’ and 3’ ends of the mouse Igh locus
For this paper, we defined the extent of the Igh locus according to its loop domain (TAD) in pro-B cells starting with the first interacting CTCF peak (second peak upstream of VH1-86 gene) to the last of the 10 CTCF peaks in the 3’CBE region. We furthermore added 2 kb from the summit of these two CTCF peaks, which resulted in the following Chr. 12 mm9 coordinates for the mouse C57BL/6 Igh locus; 114,451,520 (3’ end) - 117,269,160 (5’ end) with a length of 2,817,641 bp.
Design of the CTCF-binding site array
We selected the top 20 CTCF peaks from the Igh locus (Extended Data Fig. 3a), extracted a 24-bp sequence containing the forward CTCF-binding motif, added the flanking 10 bp after random sequence shuffling57 and added another 20 bp of random sequence, which result in an 84-bp sequence (Supplementary Table 1c). Care was taken not to create an additional CTCF or Pax5 motif in the shuffling process. The 20 CTCF-binding sequences were concatenated to generate an array of 20 CBEs, which was inserted in forward or reverse orientation at position 116,242,836 of the Igh locus (Extended Data Fig 3a).
Analysis of RNA-seq data
The number of reads per gene was counted using the featureCounts version 1.5.0 (ref. 58) with default settings. Transcripts per million (TPM) values were calculated as described59. Differential gene expression between ex vivo sorted Wapl +/+ and Wapl ΔP1,2/ΔP1,2 pro-B cells was analysed using R version 3.3.3. and DESeq2 version 2.1.14.1. Regularized log transformations were computed with the blind option set to ‘FALSE’. Genes with an adjusted P value < 0.05, TPM (averaged for each genotype) > 5 at least in one of the two genotypes, and a fold-change of > 2 were called as significantly differentially expressed (Extended Data Fig. 10e and Supplementary Table 3). All transcripts of the V, D and J gene segments at the Igh, Igk and Igl loci were eliminated from the list of significantly regulated genes, although the immunoglobulin and T cell receptor transcripts were included in all TPM calculations.
Differential gene expression between ex vivo sorted control and Rag1 Cre/+ Eed fl/fl pro-B cells was analysed as described above, except that only genes with an expression difference of > 3-fold were considered (Extended Data Fig. 9f and Supplementary Table 2). The control samples consisted of 3 independent experiments performed with Rag1 Cre/+ Eed fl/+ pro-B cells and 1 experiment performed with Eed fl/fl pro-B cells (Supplementary Table 5).
Bioinformatic analysis of 3C-seq data
We analysed the 3C-seq data with the captureC 2.0 program60 with newer versions of the programs cutadapt 1.16 (ref. 61) and trim_galore 0.4.2 (https://www.bioinformatics.babraham.ac.uk/projects/trim_galore/). For comparison, the 3C-seq reads were mapped as normalized counts by normalizing to the number of viewpoint-containing reads of the smallest library in the set of samples compared. The 3C-seq data were further analysed with r3Cseq 1.28 (ref. 62) with minor modifications to adjust for a larger viewing range required for the Igh locus and for the insertion of the CBE array by generating modified genome versions. The mean RPM values shown in Fig. 1c and Extended Data Fig. 4b,d have been calculated by r3Cseq, using a customized script based on the R version 3.3.3. For the generation of the 3C-seq data shown in Extended Data Figs. 2c and 4e,f, we used the r3Cseq command ‘getBatchInteractions’ with the option ‘union’ for analyzing the 3C-seq data of the two replica experiments performed with pro-B cells of each genotype. The Igh regions analysed in Fig. 1b,c were defined by the following mm9 coordinates on chromosome 12: A (117,126,669-117,270,000), B (116,237,129-117,126,668), C (115,000,000-116,237,128) and D (114,451,520-114,999,999). The Igh regions analysed in Extended Data Fig. 4a-d were defined as follows: A (116,292,840-116,592,840) and B (115,892,840-116,192,840).
Bioinformatic analysis of VDJ-seq data
The bioinformatic analysis of the VDJ-seq data was performed as described in detail27, and the resulting data was summarised using customised scripts based on the R version 3.3.3.
Processing, normalization and resolution of Hi-C data
The HiCUP pipeline version 0.5.10 (ref. 63) with the scorediff parameter set to “10” was used to truncate, align and filter the reads by applying the following software versions: R 3.4.1 9 (https://www.r-project.org), Bowtie 2.2.9 (ref. 53) and SAMtools 1.4. (ref. 64). We merged the data of the two Hi-C experiments, which were performed with progenitor or pro-B cells of the same genotype, to produce contact matrix files with the Juicer tools 1.8.9 (ref. 30). The resolution of the Hi-C data has been calculated according to Rao et al.4 by using the script “calculate_map_resolution”. The following unique di-tags were generated; 382,665,804 (Pax5 Δ/Δ progenitors), 314,876,625 (Wapl +/+ pro-B cells), 306,800,111 (Wapl ΔP1,2/ΔP1,2 pro-B cells) and 111,531,239 (Wapl +/+ mature B cells). The following resolution of the Hi-C data (Fig. 5b-f) was calculated; 5.4 kb (Pax5 Δ/Δ progenitors), 6.7 kb (Wapl +/+ pro-B cells), 7.25 kb (Wapl ΔP1,2/ΔP1,2 pro-B cells) and 28.6 kb (Wapl +/+ mature B cells).
Analysis of intra-chromosomal contact frequency (Hi-C)
Contact frequency distributions have been calculated using the makeTagDirectory command of HOMER 4.10.3 (ref. 65). The contact frequency plots shown in Fig. 5b and Extended Data Fig. 10b are based on ~50 contact data points based on ~50 bins, whereby each bin is defined as 0.1 step on the log10 scale of genomic distance observed between the contract points. Each data point is thus the sum of all contact fraction values in the respective bin. The contact frequency plot is shown as a smoothened line of the ~50 contact data points plotted against the logarithmic (log10) genomic distance.
Analysis of chromatin loops and compartments (Hi-C)
Intra-chromosomal loops have been called with the HiCCUPS algorithm from the Juicer tools30. The distribution of the loop length has been calculated by custom R and bash scripts. The compartments shown in Fig. 5c were calculated and visualized with Juicebox4.
Statistical analysis
Statistical analysis was performed with the GraphPad Prism 7 software. Two-tailed unpaired Student’s t-test analysis was used to assess the statistical significance of one observed parameter between two experimental groups. If more than one parameter were measured in two experimental groups, multiple t-tests were applied, and the Holm-Sidak multi comparison test was used to report the significance between the two groups. One-way ANOVA was used when more than two experimental groups were compared, and the statistical significance was determined by the Tukey post hoc test. The statistical evaluation of the RNA-seq data was performed with the DESeq2 program.
Reporting summary
Further information on the research design is available in the Nature Research Reporting Summary linked to this paper.
Extended Data
Extended Data Fig. 1. Generation and characterization of the Igh 890-inv allele.
a, Orientation of the CTCF-binding sites in the Igh locus. The CTCF-binding pattern was determined by ChIP-seq of Rag2 –/– pro-B cells. The locations of forward (red) and reverse (blue) CTCF motifs detected at the summit of the CTCF peaks are shown together with all predicted CTCF motifs, identified based on the forward and reverse consensus CTCF-binding motifs shown. The annotation of the C57BL/6 Igh locus indicates the distinct VH gene families (different colours) in the distal, middle and proximal VH gene regions (Johnston et al. 2006. J. Immunol. 176, 4221-4234) and the 3’ proximal Igh domain containing the DH, JH and CH elements as well as the Eμ and 3’RR enhancers (red). b, Schematic diagram of the Igh ifl-890-fl and Igh 890-inv alleles. The indicated selection cassettes were used for introducing the upstream inverted lox71 site (ifl) and downstream loxP site (fl) by sequential ES cell targeting. c, Flow cytometric analysis of bone marrow cells from Igh 890-inv/890-inv and Igh +/+ mice. The relative frequencies of the indicated cell types (defined in Methods) are shown as mean values with SEM. d, Flow cytometric determination of the ratio of immature IgMb (B6) to IgMa (129) B cells from Igh 890-inv(B6)/+(129) and Igh +(B6)/+(129) mice, which were generated by crossing Igh 890-inv/+ mice on the C57BL/6 (B6) background with Igh +/+ mice of the 129/Sv (129) strain. The rearranged Igh alleles of the C57BL/6 and 129/Sv strains give rise to expression of the IgMb and IgMa isotypes, respectively. e, VH gene expression from the Igh 890-inv(B6) or Igh +(B6) allele in immature IgMb (B6) B cells sorted from Igh 890-inv(B6)/+(129) or Igh +(B6)/+(129) mice, respectively. The RNA-seq profiles are shown with the Igh annotation (see a) and inverted region (bar). One of two experiments is shown. RPM, reads per million mapped sequence reads. f,g VDJ-seq analysis of pro-B cells from the bone marrow of Igh 890-inv/890-inv and Igh +/+ mice. f, The percentages of uniquely identified DJH and VDJH sequences are indicated. g, The relative usage of the distal VH genes at the Igh 5’ end is shown as mean percentage of all VDJH recombination events with SEM. A horizontal bar indicates the 5’ end of the inverted region. Statistical data are shown as mean value with SEM and were analysed either by multiple t-tests (unpaired and two-tailed with Holm-Sidak correction; c,f) or by the Student’s t-test (unpaired and two-tailed; d). n, number of mice (c,d) or experiments (f,g). Each dot corresponds to one mouse.
Extended Data Fig. 2. Dependence of VH-DJH recombination on chromatin looping and VH gene orientation.
a, ChIP-seq analysis of CTCF binding in the distal 890-kb region in short-term cultured pro-B cells from Igh 890-inv/890-inv and Igh +/+ mice. Vertical bars indicated CTCF peaks defined by ‘peak calling’. The ChIP-seq data of the Igh 890-inv allele were aligned on the wild-type Igh sequences. One of two experiments per genotype is shown. b, Igh positions of the 3C-seq viewpoints, which are referred to by the nearest VH gene, the hypersensitive site 5 (HS5) in the 3’CBE region or the CBE array insertion (Supplementary Table 1c). c, Interactions from the 5’ (VH1-86; left) and 3’ (HS5; right) viewpoints in short-term cultured pro-B cells from Igh 890-inv/890-inv Rag2 –/– and Igh +/+ Rag2 –/– mice. The 3C-seq reads along the Igh locus (upper two panels) are shown as RPM values with the respective Q values, which were calculated by the r3Cseq program based on two 3C-seq experiments per genotype. The lower panel shows the fold-change of the RPM values for interaction differences of > 2-fold (dashed line) between experimental (Exp) Igh 890-inv/890-inv Rag2 –/– and control (Ctrl) Igh +/+ Rag2 –/– pro-B cells. d, Schematic diagram summarising the loop formation at the Igh 890-inv allele in pro-B cells. The CBEs with their orientation are indicated by red and blue arrowheads, VH genes by grey arrows and loops by arches. The new loop domain is indicated in red. e, Schematic diagram of the Igh Δ890, Igh V8-8 and Igh V8-8-inv alleles. The Igh V8-8 and Igh V8-8-inv alleles were generated by insertion of the VH8-8 gene with 500 bp of its 5’ and 3’ flanking sequences (lacking any CBE) in the forward or reverse orientation at the deletion point (117,126,667 / 116,237,220; mm9, Chr. 12) of the Igh Δ890 allele (see Methods). The distances from the 3’ end of the VH8-8 gene to the next CBEs and VH genes are indicated. The sequence of the inserted VH8-8 with its flanking DNA sequences is shown in Supplementary Table 1b. f, RNA-seq profile of the Igh locus in immature B cells from the bone marrow of Igh V8-8/Δ890, Igh V8-8-inv/Δ890 and Igh +/Δ890 mice. The VH8-8 gene position and Igh annotation are indicated. The data of one of two RNA-seq experiments per genotype is shown. g, VH8-8 mRNA expression in immature B-cells of the indicated genotypes is shown as mean TPM (transcripts per million) value. Each dot corresponds to one experiment.
Extended Data Fig. 3. Characterization of Igh alleles with inserted CBE arrays.
a, Insertion of an array of 20 functional CBEs in forward (red) or inverted (inv, blue) orientation at position 116,242,836 (mm9, Chr. 12) in the Igh CBE or Igh CBE-inv allele, respectively. The positions of the Igh CBEs used for the generation of the CBE arrays (Supplementary Table 1c) are indicated below a map of all CBEs. b, CTCF binding at the Igh locus, as determined by ChIP-seq analysis of short-term cultured pro-B cells from the bone marrow of Igh CBE-inv/CBE-inv and Igh CBE/CBE mice. One of two experiments is shown. c, Flow cytometric determination of the ratio of immature IgMb (B6) to IgMa (129) B cells in the bone marrow of Igh CBE-inv(B6)/+(129), Igh CBE(B6)/+(129) and Igh +(B6)/+(129) mice (see Extended Data Fig. 1d). The IgMb / IgMa ratios are shown relative to that of immature B cells of Igh +(B6)/+(129) mice (set to 1). Statistical data are shown as mean value with SEM and were analysed by one-way ANOVA with Tukey’s post-hoc test. d, VH gene expression from the Igh CBE-inv(B6), Igh CBE(B6) and Igh +(B6) alleles in immature IgMb (B6) B cells sorted from Igh CBE-inv(B6)/+(129), Igh CBE(B6)/+(129) and Igh +(B6)/+(129) mice, respectively (see Extended Data Fig. 1d). The expression (TPM) value of each VH gene is shown as shared (grey) and unique expression of the Igh CBE-inv(B6) (blue), Igh CBE(B6) (green) and Igh +(B6) (black) alleles. Mean TPM values with SEM were determined by the DESeq2 program and are based on two (Igh CBE-inv(B6), Igh CBE(B6)) and three (Igh +(B6)) RNA-seq experiments. The VH genes are aligned according to their Igh position. e,f, VDJ-seq analysis of ex vivo sorted pro-B cells from the bone marrow of Igh +/+, Igh CBE/CBE and Igh CBE-inv/CBE-inv mice. e, The percentages of uniquely identified DJH and VDJH sequences are shown as mean percentage with SEM. f, Pairwise comparisons of VDJ-seq results obtained with Igh +/+ (black), Igh CBE/CBE (green) and Igh CBE-inv/CBE-inv (blue) pro-B cells. The relative usage of each VH gene was determined as percentage of all VDJH recombination events and is shown as mean percentage with SEM. n, number of mice. Each dot corresponds to one mouse (c,e).
Extended Data Fig. 4. New loop formation upon insertion of an inverted CBE array in the Igh locus.
a-d, 3C-seq analysis of interactions across the Igh locus from the 3’ (HS5; a,b) or 5’ (CBE; c,d) viewpoint in short-term cultured Igh CBE-inv/CBE-inv , Igh CBE/CBE and Igh +/+ pro-B cells. a,c, Mapping of the 3C-seq reads as normalized counts across the Igh locus. One of two experiments per genotype is shown. b,d, Quantification of the interactions from the 3’ (HS5, b) or 5’(CBE, d) viewpoint. The 3C-seq reads in regions A and B were quantified as mean RPM value per region, based on two experiments per genotype. e,f, Interactions from the 3’ (HS5; e) or 5’ (CBE; f) viewpoint in Igh +/+, Igh CBE/CBE and Igh CBE-inv/CBE-inv pro-B cells. The 3C-seq reads along the Igh locus (upper two panels) are shown as RPM values with the respective Q values, calculated by the r3Cseq program based on two experiments per genotype. Arrows highlight a strong interaction from the 3’ viewpoint (HS5) to a region immediately downstream of the inserted CBE array (e), and a bar denotes the 600-kb region exhibiting reduced interactions in Igh CBE-inv/CBE-inv pro-B cells (e). The lower panel shows the fold-change of the RPM values for interaction differences of > 2-fold (dashed line; e) or > 1.5-fold (f) between the experimental (Exp) and control (Ctrl) pro-B cells of the indicated genotypes. g, Schematic diagram summarising the loop formation at the Igh CBE-inv allele in pro-B cells. The CBEs with their orientation are indicated by red and blue arrowheads, VH genes by grey arrows and loops by arches. The new loop domain is indicated in red. A thicker blue arche indicates the enhanced interaction from the 3’CBE to a region immediately downstream of the inserted CBE array.
Extended Data Fig. 5. Cohesin stabilization on chromatin by Pax5-dependent Wapl repression in pro-B cells.
a, Wapl mRNA expression in developing and mature B and T cells of wild-type mice. The indicated B and T cell types were sorted from the bone marrow (pro-B, pre-B cells), thymus (DN, DP, CD4+, CD8+ T cells) or spleen (mature B, CD4+ and CD8+ T cells). The Wapl mRNA expression of the different cell types was determined by RT-qPCR analysis relative to Tbp expression and is shown relative to that of pro-B cells (set to 1). The expression data are shown as mean values with SEM, based on four RT-qPCR experiments per cell type. b, Wapl protein expression in ex vivo sorted Rag2 –/– pro-B cells from the bone marrow and wild-type mature B cells from the spleen and lymph nodes, as determined by immunoblotting of 3-fold serially diluted whole-cell extracts with antibodies detecting Wapl or TBP. One of two experiments is shown with marker proteins (kilodaltons). c, B cell development in the bone marrow of Smc3-Gfp transgenic (green) and wild-type (black) mice, as determined by flow cytometry. The relative frequencies of the indicated cell types are shown as mean values with SEM (left). GFP expression in selected cell types is shown (right). d, Interaction of the Smc3-GFP protein with other cohesin subunits in short-term cultured Smc3-Gfp pro-B cells. Endogenous Smc1, Scc1 (Rad21), Wapl, Pds5a and Pds5b proteins were co-precipitated with Smc3-GFP from whole-cell extracts of Smc3-Gfp or wild-type pro-B cells with an anti-GFP antibody. The input (1/10) and protein precipitate were analysed by immunoblotting with antibodies detecting the indicated cohesin proteins. Smc3ac, acetylated Smc3. One experiment was performed. e, Images of one of 16 or 24 iFRAP experiments performed with Smc3-Gfp pro-B or mature B cells, respectively. The fluorescence intensities of SiR-Hoechst (pink) and GFP (green) are false-coloured. Scale bar, 10 μm. f, Identification of open chromatin regions at the Wapl locus by ATAC-seq of the indicated progenitor and B cell types. MPPs, ALPs, pro-B and mature B cells were sorted from wild-type bone marrow or lymph nodes (mature B). Activated B cells and plasmablasts were generated by in vitro LPS stimulation of mature B cells. hCD2– (Pax5–) and hCD2+ (Pax5+) BLPs were sorted from bone marrow of Pax5 ihCd2/ihCd2 mice, and Pax5 Δ/Δ progenitors from Vav-Cre Pax5 fl/fl Rag2 –/– mice. n, number of mice. Each dot corresponds to one mouse (a,c). The different cell types are defined in Methods.
Extended Data Fig. 6. Generation and analysis of Wapl mutant mice.
a, Mutations introduced at the Pax5-binding sites P1 and P2 in the Wapl ΔP1,2, Wapl ΔP1 and Wapl ΔP2 alleles by CRISPR/Cas9-mediated mutagenesis. The consensus Pax5 motif and the extent of the deletions (red) are indicated. b, Loss of Pax5 binding at the mutated P1 site in Wapl ΔP1/ΔP1 pro-B cells. One of two ChIP-seq experiments is shown. c. Wapl mRNA expression in short-term cultured Wapl ΔP1,2/ΔP1,2 and Wapl +/+ pro-B cells is shown as mean TPM value with SEM. n, number of RNA-seq experiments. d, Wapl protein expression in short-term cultured Wapl ΔP1,2/ΔP1,2 Rag2 –/– and Wapl +/+ Rag2 –/– pro-B cells was determined by immunoblotting of 2-fold serially diluted whole-cell extracts with antibodies detecting Wapl or TBP. One of two experiments is shown with marker proteins (kilodaltons). e, Wapl mRNA expression in ex vivo sorted Wapl ΔP1,2/ΔP1,2 (blue), Wapl ΔP1,2/+ (light blue) and Wapl +/+ (black) pro-B and pre-B cells, Pax5 Δ/Δ progenitors (green; Vav-Cre Pax5 fl/fl) as well as Wapl ΔP1,2/ΔP1,2 and Wapl +/+ T cell subsets from the thymus and spleen, as determined by RT-qPCR analysis relative to Tbp expression. The Wapl expression of each cell type is indicated relative to that of the Wapl +/+ cells (set to 1) and is shown as mean value with SEM, based on 2-4 independent RT-qPCR experiments for each cell type and genotype. Each dot (c,e) corresponds to one mouse. The different cell types are defined in Methods.
Extended Data Fig. 7. B cell development in Wapl mutant mice.
a,b, Wapl expression in ex vivo sorted Wapl ΔP1/ΔP1 (blue), Wapl ΔP1/+ (light blue) and Wapl +/+ (black) pro-B and pre-B cells (a) as well as in Wapl ΔP2/ΔP2 (blue) and Wapl +/+ (black) pro-B cells (b), as determined by RT-qPCR analysis relative to Tbp expression. The Wapl expression of each cell type is shown as mean value with SEM relative to that of Wapl +/+ cells (set to 1). Each dot corresponds to one RT-qPCR experiment performed with sorted cells from one mouse. c,d, Flow cytometric analysis of bone marrow from Wapl ΔP2/ΔP2 (blue), Wapl ΔP2/+ (light blue) and Wapl +/+ (black) mice (c). The frequencies of the indicated cell types are shown as mean values with SEM (d). e, Flow cytometric analysis of bone marrow from Cd79a Cre/+ Wapl fl/fl and Cd79a Cre/+ Wapl +/+ mice. f,g, Frequencies of total B, pro-B and pre-B cells are shown for Cd79a Cre/+ Wapl fl/fl, Cd79a Cre/+ Wapl fl/+ and control mice (f) as well as for Rag1 Cre/+ Wapl fl/fl, Rag1 Cre/+ Wapl fl/+ and control mice (g). The control mice in (f) were 3× Cd79a Cre/+ Wapl +/+ and 5× Wapl fl/+ mice, and the control mice in (g) were 2× Rag1 Cre/+ Wapl +/+, 2× Wapl fl/fl, 1× Wapl fl/+ and 1× Wapl +/+. Statistical data (a,b,d,f,g) are shown as mean values with SEM and were analysed by multiple t-tests (unpaired and two-tailed with Holm-Sidak correction). One of 5 (c) or 4 (e) experiments is shown. n, number of mice. Each dot corresponds to one mouse.
Extended Data Fig. 8. VH-DJH recombination and looping in Wapl mutant mice.
a, VDJ-seq analysis of Igh rearrangements in Wapl ΔP1,2/ΔP1,2, Wapl ΔP1,2/+, Wapl ΔP1/ΔP1, Wapl ΔP2/ΔP2 and Wapl +/+ pro-B cells as well as in Pax5 Δ/Δ progenitors (Vav-Cre Pax5 fl/fl), which were performed in 4 different experimental series. The percentages of uniquely identified DJH and VDJH sequences are shown as mean values with SEM and were analysed by multiple t-tests (unpaired and two-tailed with Holm-Sidak correction). b, VH gene recombination in Wapl +/+ and mutant pro-B-cells, as determined by pairwise VDJ-seq experiments. The VDJ-seq data of Wapl +/+ and mutant pro-B-cells are shown in the upper and lower part, respectively. The VH gene usage is shown as mean percentage of all DJH and VDJH rearrangement events with SEM. c, Wapl mRNA expression in in vitro cultured v-Abl transformed pro-B cells of the wild-type (light grey) or Rag2 –/– (grey) genotype as well as in ex vivo sorted Wapl ΔP1,2/ΔP1,2 (blue) and wild-type Wapl +/+ (black) pro-B cells. The Wapl expression was determined by RT-qPCR analysis relative to the Tbp expression and is shown a mean value relative to that of the Wapl +/+ pro-B cells (set to 1). d, 3C-seq analysis of interactions across the Igh locus from the 5’ viewpoints (VH1-83/81) in short-term cultured Wapl ΔP1,2/ΔP1,2 Rag2 –/– and Wapl +/+ Rag2 –/– pro-B cells. The 3C-seq reads are mapped as normalized counts. One of two experiments is show. n, number of experiments. Each dot corresponds to one mouse.
Extended Data Fig. 9. Generation and analysis of conditional Eed mutant mice.
a, Generation of a floxed (fl) Eed allele. The Eed fl-Neo allele was generated by replacing exon 6 of the Eed gene with the following sequences in the 5’ to 3’ direction: (i) a loxP-flanked Eed cDNA fragment (from exon 6 to the 5’ part of the 3’UTR) linked to six copies of the SV40 polyadenylation (pA) region, (ii) a DNA fragment containing the 3’ splice site and 5’ sequences of exon 6 fused in-frame to the coding sequence of Gfp followed by an SV40 pA sequence and (iii) a frt-flanked DNA fragment containing the mouse phosphoglycerate kinase 1 (Pgk1) promoter linked to the neomycin (Neo) resistance gene. Brackets indicate the two homology regions used for ES cell recombination. The frt (blue) and loxP (red) sites (arrowheads) of the Eed fl-Neo allele were used to generate the Eed fl and Eed Δ alleles by sequential Flpe- and Cre-mediated deletion in vivo. The six SV40 pA sequences downstream of the last Eed exon prevented RNA splicing to the Gfp exon prior to Cre-mediated deletion, as demonstrated by flow cytometry (e, right). A genotyping gel image of Eed +/+, Eed fl/+, and Eed fl/fl mice is shown to the right. b, Selective loss of H3K27me3 at the Wapl promoter in Wapl ΔP1/ΔP1 pro-B cells (light blue) compared to Wapl +/+ pro-B cells (black). The H3K27me3 signal is precipitously lost 220 bp upstream of the P1 site. One of two ChIP-seq experiments are shown. c, Loss of Ezh2 and Pax5 binding at the Wapl promoter in mature B cells after two days of activation. d, Co-precipitation of Myc-tagged Ezh2 or IRF4 by streptavidin (SA) pulldown of biotinylated Pax5-Bio from nuclear extracts prepared from HEK-293T cells that were transiently transfected with expression vectors encoding Pax5-Bio-IRES-BirA, Myc-Ezh2, Eed and Suz12 or Pax5-Bio-IRES-BirA and Myc-IRF4. The input (1/100) and protein precipitates were analysed by immunoblotting with antibodies detecting Myc and Pax5. The band indicated by an asterisk may correspond to endogenous Myc. One of four experiments is shown with marker proteins (kilodaltons). e, Flow cytometric analysis of bone marrow from Rag1 Cre/+ Eed fl/fl (blue) and control (black) mice. Rag1 Cre/+ Eed fl/+, Rag1 Cre/+, Eed fl/+ and Eed +/+ mice were used as control. The relative frequencies of the indicated cell types (left), which were determined in six experiments, are shown as mean values with SEM and were analysed by multiple t-tests (unpaired and two-tailed with Holm-Sidak correction). GFP expression (right) is shown for Rag1 Cre/+ Eed fl/fl pro-B cells in contrast to control Eed fl/+ pro-B cells. f, Scatterplot of gene expression differences between Eed-deficient and control pro-B cells. Eed-activated (blue) and Eed-repressed (red) genes were defined by an expression difference of > 3-fold, an adjusted P value of < 0.05 and a TPM value of > 5 in Eed-deficient or control pro-B cells, respectively (Supplementary Table 2). The expression data are based on 5 (Rag1 Cre/+ Eed fl/fl) and 4 (control; 3× Rag1 Cre/+ Eed fl/+, 1× Eed fl/fl) RNA-seq experiments. g, Functional classification and quantification of the proteins encoded by Eed-activated and Eed-repressed genes (Supplementary Table 2). The bar size indicates the percentage of activated or repressed genes in each functional class relative to the total activated or repressed genes, respectively. Numbers in the bars refer to the genes in each functional class. h, Expression of selected genes in Eed-deficient (grey) and Eed-expressing (black) pro-B cells. The expression of the indicated genes, which are not differentially expressed according to the definition in f, is shown as mean TPM value with SEM. i,j, VDJ-seq analysis of Rag1 Cre/+ Eed fl/fl and control pro-B cells. i, The mean percentages of uniquely identified DJH and VDJH sequences were determined based on 4 (Rag1 Cre/+ Eed fl/fl) and 2 (control; 1× Eed fl/+, 1× Eed +/+) experiments. j, The VH gene usage is shown as mean percentage of all VDJH rearrangement events with SEM. n, number of experiments. Each dot corresponds to one mouse (e,h,i) or one gene (f).
Extended Data Fig. 10. Changes of chromosomal architecture and gene expression in Wapl +/+ and Wapl ΔP1,2/ΔP1,2 pro-B cells.
a, iFRAP analysis of splenic mature B cells from Wapl ΔP1,2/+ (blue) and Wapl +/+ (pink) mice carrying the Smc3-Gfp transgene. The difference in fluorescence intensity between bleached and unbleached regions is plotted against time. The mean values are indicated by lines and the SD by shading. n, number of cells analysed in three experiments per genotype. b, Frequency distribution of intra-chromosomal contacts as a function of the genomic distance using logarithmically increased genomic distance bins, as determined by Homer analysis of Hi-C data generated with short-term cultured pro-B cells (grey) and ex vivo sorted splenic mature B cells (pink) from wild-type mice. c, Hi-C contact matrices of a zoomed-in region on chromosome 12 (mm9: 72,500,000-78,500,000; upper row) and 16 (21,500,000-28,500,000; lower row), displayed at a 10-kb bin resolution for Pax5 Δ/Δ progenitors, Wapl +/+ and Wapl ΔP1,2/ΔP1,2 pro-B cells. Black dots indicate loop anchors identified with Juicebox, and the intensity of each pixel represents the normalized number of contacts between a pair of loci (Durand et al. 2016. Cell Syst. 3, 95-98). The maximum intensity is indicated in the lower left of each panel. d, Density distribution of the loop length in Pax5 Δ/Δ progenitors, Wapl +/+ and Wapl ΔP1,2/ΔP1,2 pro-B cells, as determined with HiCCUPS of Juicer. The median loop length (in kb) is shown for each genotype. e, Scatterplot of gene expression differences, based on two RNA-seq experiments per genotype. Genes upregulated (red) or downregulated (blue) in Wapl ΔP1,2/ΔP1,2 pro-B cell compared to Wapl +/+ pro-B cells were defined by an expression difference of > 2-fold, an adjusted P value of < 0.05 and a TPM value of > 5 in at least one of the two pro-B cell types (Supplementary Table 3). f, Functional classification and quantification of the proteins encoded by up-regulated (red) and down-regulated (blue) genes in Wapl ΔP1,2/ΔP1,2 pro-B cells relative to Wapl +/+ pro-B cells (Supplementary Table 3). See Extended Data Fig. 9g for detailed explanation. g, Expression of selected genes in Wapl ΔP1,2/ΔP1,2 (grey) and Wapl +/+ (black) pro-B cells. The expression of the indicated genes, which are not differentially expressed according to the definition in e, is shown as mean TPM value. h, Schematic diagram depicting a ‘stable’ loop formed by loop extrusion across the entire Igh locus in pro-B cells. The forward CBEs (in the VH gene cluster and IGCR region) and the reverse CBEs (in the IGCR and 3’CBE regions) are indicated by red and blue arrows, respectively. The RAG-bound recombination centre, which is located at the DJH-rearranged gene segment (Ji et al. 2010. Cell 141, 419-431), is indicated in grey. The convergent orientation of the 12-RSS (recognition signal sequence with a 12-bp spacer, black arrowhead) of the DH segment and the 23-RSS (with a 23-bp spacer, green arrowhead) of the VH genes is essential for mediating RAG-cleavage and deletional joining (Alt et al. 2013. Cell 152, 417-429). The loop-extruding cohesin ring (orange) is arrested at convergent CBEs. In a ‘stable’ loop, the correct alignment of the RSS elements of a VH gene and the DJH-rearranged gene segment likely occurs by local diffusion. Arrowheads symbolize the RSS element consisting of the heptamer, nonamer and intervening spacer. i, Correct alignment of the RSS elements of a VH gene and the DJH-rearranged gene segment may be mediated by the ongoing process of loop extrusion. Orange and black arrows indicate the direction of movement of cohesin and DNA, respectively. j, Misalignment of the RSS elements of an inverted VH gene and the DJH-rearranged gene segment during loop extrusion, which prevents RAG-mediated cleavage.
Supplementary Material
Acknowledgements
We thank William C. Skarnes for advice and help with the Floxin method, M. Leeb for assistance with ES cell derivation, E. Lieberman Aiden for discussion, R. Stocsits for advice with Hi-C analysis, K. Aumayr’s team for flow cytometric sorting, C. Theussl’s team for generating gene-modified mice and A. Sommer’s team at the Vienna BioCenter Core Facilities for Illumina sequencing. This research was supported by Boehringer Ingelheim, the European Research Council (ERC) under the European Union’s Horizon 2020 research and innovation program (grant agreement No 740349-PlasmaCellControl and No 693949-CohesinMolMech), the Austrian Industrial Research Promotion Agency (Headquarter Grant FFG-852936), the Human Frontier Science Program grant RGP0057/2018 (to J.-M.P.) and a long-term fellowship from the Human Frontier Science Program LT001527/2017 (to K.N.).
Footnotes
Author contributions
L.H. did most experiments; A.E. generated and analysed the Eed mutant mouse; G.W. generated the Hi-C data; K.N. performed the iFRAP analyses; H.T. performed ATAC-seq analyses and contributed to 3C-seq experiments; D.K.-P. performed RT-qPCR analyses; K.S. generated the Igh CBE/+ and Igh CBE-inv/+ mice and inserted the VH8-8 gene into Igh Δ890/+ ES cells; Q.S. generated the transgenic Smc3-Gfp mouse and contributed to the generation of the Igh fl-890-fl/+ mouse; P.B. performed the PRC2-Pax5 recruitment experiments; M.J. performed most bioinformatic analyses (RNA-seq, VDJ-seq, 3C-seq and Hi-C data); M.F. analysed the Eed RNA-seq data; J.-M.P. provided advice on cohesin biology and the design of iFRAP and Hi-C experiments; L.H. and M.B. planned the project, designed the experiments and wrote the manuscript.
Competing interests
The authors declare no competing financial interests.
Data availability
The RNA-seq, ChIP-seq, ATAC-seq, VDJ-seq, 3C-seq and Hi-C data reported in this study (Supplementary Table 5) are available at the Gene Expression Omnibus (GEO) repository under the accession number GSE140975. Figure source data are provided for this paper.
References
- 1.Lieberman-Aiden E, et al. Comprehensive mapping of long-range interactions reveals folding principles of the human genome. Science. 2009;326:289–293. doi: 10.1126/science.1181369. [DOI] [PMC free article] [PubMed] [Google Scholar]
- 2.Dixon JR, et al. Topological domains in mammalian genomes identified by analysis of chromatin interactions. Nature. 2012;485:376–380. doi: 10.1038/nature11082. [DOI] [PMC free article] [PubMed] [Google Scholar]
- 3.Nora EP, et al. Spatial partitioning of the regulatory landscape of the X-inactivation centre. Nature. 2012;485:381–385. doi: 10.1038/nature11049. [DOI] [PMC free article] [PubMed] [Google Scholar]
- 4.Rao SS, et al. A 3D map of the human genome at kilobase resolution reveals principles of chromatin looping. Cell. 2014;159:1665–1680. doi: 10.1016/j.cell.2014.11.021. [DOI] [PMC free article] [PubMed] [Google Scholar]
- 5.Nasmyth K. Disseminating the genome: joining, resolving, and separating sister chromatids during mitosis and meiosis. Annu Rev Genet. 2001;35:673–745. doi: 10.1146/annurev.genet.35.102401.091334. [DOI] [PubMed] [Google Scholar]
- 6.Sanborn AL, et al. Chromatin extrusion explains key features of loop and domain formation in wild-type and engineered genomes. Proc Natl Acad Sci USA. 2015;112:E6456–E6465. doi: 10.1073/pnas.1518552112. [DOI] [PMC free article] [PubMed] [Google Scholar]
- 7.Fudenberg G, et al. Formation of chromosomal domains by loop extrusion. Cell reports. 2016;15:2038–2049. doi: 10.1016/j.celrep.2016.04.085. [DOI] [PMC free article] [PubMed] [Google Scholar]
- 8.Rao SSP, et al. Cohesin loss eliminates all loop domains. Cell. 2017;171:305–320. doi: 10.1016/j.cell.2017.09.026. [DOI] [PMC free article] [PubMed] [Google Scholar]
- 9.Schwarzer W, et al. Two independent modes of chromatin organization revealed by cohesin removal. Nature. 2017;551:51–56. doi: 10.1038/nature24281. [DOI] [PMC free article] [PubMed] [Google Scholar]
- 10.Wutz G, et al. Topologically associating domains and chromatin loops depend on cohesin and are regulated by CTCF, WAPL, and PDS5 proteins. EMBO J. 2017;36:3573–3599. doi: 10.15252/embj.201798004. [DOI] [PMC free article] [PubMed] [Google Scholar]
- 11.Davidson IF, et al. DNA loop extrusion by human cohesin. Science. 2019;366:1338–1345. doi: 10.1126/science.aaz3418. [DOI] [PubMed] [Google Scholar]
- 12.Kim Y, Shi Z, Zhang H, Finkelstein IJ, Yu H. Human cohesin compacts DNA by loop extrusion. Science. 2019;366:1345–1349. doi: 10.1126/science.aaz4475. [DOI] [PMC free article] [PubMed] [Google Scholar]
- 13.Kueng S, et al. Wapl controls the dynamic association of cohesin with chromatin. Cell. 2006;127:955–967. doi: 10.1016/j.cell.2006.09.040. [DOI] [PubMed] [Google Scholar]
- 14.Tedeschi A, et al. Wapl is an essential regulator of chromatin structure and chromosome segregation. Nature. 2013;501:564–568. doi: 10.1038/nature12471. [DOI] [PMC free article] [PubMed] [Google Scholar]
- 15.Haarhuis JHI, et al. The cohesin release factor WAPL restricts chromatin loop extension. Cell. 2017;169:693–707. doi: 10.1016/j.cell.2017.04.013. [DOI] [PMC free article] [PubMed] [Google Scholar]
- 16.Alt FW, Zhang Y, Meng F-L, Guo C, Schwer B. Mechanisms of programmed DNA lesions and genomic instability in the immune system. Cell. 2013;152:417–429. doi: 10.1016/j.cell.2013.01.007. [DOI] [PMC free article] [PubMed] [Google Scholar]
- 17.Fuxa M, et al. Pax5 induces V-to-DJ rearrangements and locus contraction of the immunoglobulin heavy-chain gene. Genes Dev. 2004;18:411–422. doi: 10.1101/gad.291504. [DOI] [PMC free article] [PubMed] [Google Scholar]
- 18.Medvedovic J, et al. Flexible long-range loops in the VH gene region of the Igh locus facilitate the generation of a diverse antibody repertoire. Immunity. 2013;39:229–244. doi: 10.1016/j.immuni.2013.08.011. [DOI] [PMC free article] [PubMed] [Google Scholar]
- 19.Johnston CM, Wood AL, Bolland DJ, Corcoran AE. Complete sequence assembly and characterization of the C57BL/6 mouse Ig heavy chain V region. J Immunol. 2006;176:4221–4234. doi: 10.4049/jimmunol.176.7.4221. [DOI] [PubMed] [Google Scholar]
- 20.Proudhon C, Hao B, Raviram R, Chaumeil J, Skok JA. Long-range regulation of V(D)J recombination. Adv Immunol. 2015;128:123–182. doi: 10.1016/bs.ai.2015.07.003. [DOI] [PMC free article] [PubMed] [Google Scholar]
- 21.Jhunjhunwala S, et al. The 3D structure of the immunoglobulin heavy-chain locus: implications for long-range genomic interactions. Cell. 2008;133:265–279. doi: 10.1016/j.cell.2008.03.024. [DOI] [PMC free article] [PubMed] [Google Scholar]
- 22.Zhang Y, et al. The fundamental role of chromatin loop extrusion in physiological V(D)J recombination. Nature. 2019;573:600–604. doi: 10.1038/s41586-019-1547-y. [DOI] [PMC free article] [PubMed] [Google Scholar]
- 23.Jain S, Ba Z, Zhang Y, Dai HQ, Alt FW. CTCF-binding elements mediate accessibility of RAG substrates during chromatin scanning. Cell. 2018;174:102–116. doi: 10.1016/j.cell.2018.04.035. [DOI] [PMC free article] [PubMed] [Google Scholar]
- 24.Hu J, et al. Chromosomal loop domains direct the recombination of antigen receptor genes. Cell. 2015;163:947–959. doi: 10.1016/j.cell.2015.10.016. [DOI] [PMC free article] [PubMed] [Google Scholar]
- 25.Parelho V, et al. Cohesins functionally associate with CTCF on mammalian chromosome arms. Cell. 2008;132:422–433. doi: 10.1016/j.cell.2008.01.011. [DOI] [PubMed] [Google Scholar]
- 26.Wendt KS, et al. Cohesin mediates transcriptional insulation by CCCTC-binding factor. Nature. 2008;451:796–801. doi: 10.1038/nature06634. [DOI] [PubMed] [Google Scholar]
- 27.Chovanec P, et al. Unbiased quantification of immunoglobulin diversity at the DNA level with VDJ-seq. Nat Protoc. 2018;13:1232–1252. doi: 10.1038/nprot.2018.021. [DOI] [PubMed] [Google Scholar]
- 28.Margueron R, Reinberg D. The Polycomb complex PRC2 and its mark in life. Nature. 2011;469:343–349. doi: 10.1038/nature09784. [DOI] [PMC free article] [PubMed] [Google Scholar]
- 29.Ji Y, et al. The in vivo pattern of binding of RAG1 and RAG2 to antigen receptor loci. Cell. 2010;141:419–431. doi: 10.1016/j.cell.2010.03.010. [DOI] [PMC free article] [PubMed] [Google Scholar]
- 30.Durand NC, et al. Juicer provides a one-click system for analyzing loop-resolution Hi-C experiments. Cell Syst. 2016;3:95–98. doi: 10.1016/j.cels.2016.07.002. [DOI] [PMC free article] [PubMed] [Google Scholar]
- 31.Urbánek P, Wang Z-Q, Fetka I, Wagner EF, Busslinger M. Complete block of early B cell differentiation and altered patterning of the posterior midbrain in mice lacking Pax5/BSAP. Cell. 1994;79:901–912. doi: 10.1016/0092-8674(94)90079-5. [DOI] [PubMed] [Google Scholar]
- 32.Horcher M, Souabni A, Busslinger M. Pax5/BSAP maintains the identity of B cells in late B lymphopoiesis. Immunity. 2001;14:779–790. doi: 10.1016/s1074-7613(01)00153-4. [DOI] [PubMed] [Google Scholar]
- 33.McManus S, et al. The transcription factor Pax5 regulates its target genes by recruiting chromatin-modifying proteins in committed B cells. EMBO J. 2011;30:2388–2404. doi: 10.1038/emboj.2011.140. [DOI] [PMC free article] [PubMed] [Google Scholar]
- 34.Fuxa M, Busslinger M. Reporter gene insertions reveal a strictly B lymphoid-specific expression pattern of Pax5 in support of its B cell identity function. J Immunol. 2007;178:3031–3037. doi: 10.4049/jimmunol.178.5.3031. [DOI] [PubMed] [Google Scholar]
- 35.Shinkai Y, et al. RAG-2-deficient mice lack mature lymphocytes owing to inability to initiate V(D)J rearrangement. Cell. 1992;68:855–867. doi: 10.1016/0092-8674(92)90029-c. [DOI] [PubMed] [Google Scholar]
- 36.Krimpenfort P, et al. p15Ink4b is a critical tumour suppressor in the absence of p16Ink4a. Nature. 2007;448:943–946. doi: 10.1038/nature06084. [DOI] [PubMed] [Google Scholar]
- 37.Tallquist MD, Soriano P. Epiblast-restricted Cre expression in MORE mice: a tool to distinguish embryonic vs. extra-embryonic gene function. Genesis. 2000;26:113–115. doi: 10.1002/(sici)1526-968x(200002)26:2<113::aid-gene3>3.0.co;2-2. [DOI] [PubMed] [Google Scholar]
- 38.McCormack MP, Forster A, Drynan L, Pannell R, Rabbitts TH. The LMO2 T-cell oncogene is activated via chromosomal translocations or retroviral insertion during gene therapy but has no mandatory role in normal T-cell development. Mol Cell Biol. 2003;23:9003–9013. doi: 10.1128/MCB.23.24.9003-9013.2003. [DOI] [PMC free article] [PubMed] [Google Scholar]
- 39.Hobeika E, et al. Testing gene function early in the B cell lineage in mb1-cre mice. Proc Natl Acad Sci USA. 2006;103:13789–13794. doi: 10.1073/pnas.0605944103. [DOI] [PMC free article] [PubMed] [Google Scholar]
- 40.Seibler J, et al. Rapid generation of inducible mouse mutants. Nucleic Acids Res. 2003;31:e12. doi: 10.1093/nar/gng012. [DOI] [PMC free article] [PubMed] [Google Scholar]
- 41.de Boer J, et al. Transgenic mice with hematopoietic and lymphoid specific expression of Cre. Eur J Immunol. 2003;33:314–325. doi: 10.1002/immu.200310005. [DOI] [PubMed] [Google Scholar]
- 42.Rodriguez CI, et al. High-efficiency deleter mice show that FLPe is an alternative to Cre-loxP. Nat Genet. 2000;25:139–140. doi: 10.1038/75973. [DOI] [PubMed] [Google Scholar]
- 43.Anastassiadis K, et al. Dre recombinase, like Cre, is a highly efficient site-specific recombinase in E. coli, mammalian cells and mice. Dis Model Mech. 2009;2:508–515. doi: 10.1242/dmm.003087. [DOI] [PubMed] [Google Scholar]
- 44.Singla V, et al. Floxin, a resource for genetically engineering mouse ESCs. Nat Methods. 2010;7:50–52. doi: 10.1038/nmeth.1406. [DOI] [PMC free article] [PubMed] [Google Scholar]
- 45.Yang H, et al. One-step generation of mice carrying reporter and conditional alleles by CRISPR/Cas-mediated genome engineering. Cell. 2013;154:1370–1379. doi: 10.1016/j.cell.2013.08.022. [DOI] [PMC free article] [PubMed] [Google Scholar]
- 46.Poser I, et al. BAC TransgeneOmics: a high-throughput method for exploration of protein function in mammals. Nat Methods. 2008;5:409–415. doi: 10.1038/nmeth.1199. [DOI] [PMC free article] [PubMed] [Google Scholar]
- 47.Adams B, et al. Pax-5 encodes the transcription factor BSAP and is expressed in B lymphocytes, the developing CNS, and adult testis. Genes Dev. 1992;6:1589–1607. doi: 10.1101/gad.6.9.1589. [DOI] [PubMed] [Google Scholar]
- 48.Nutt SL, Urbánek P, Rolink A, Busslinger M. Essential functions of Pax5 (BSAP) in pro-B cell development: difference between fetal and adult B lymphopoiesis and reduced V-to-DJ recombination at the IgH locus. Genes Dev. 1997;11:476–491. doi: 10.1101/gad.11.4.476. [DOI] [PubMed] [Google Scholar]
- 49.Minnich M, et al. Multifunctional role of the transcription factor Blimp-1 in coordinating plasma cell differentiation. Nat Immunol. 2016;17:331–343. doi: 10.1038/ni.3349. [DOI] [PMC free article] [PubMed] [Google Scholar]
- 50.Holzmann J, et al. Absolute quantification of cohesin, CTCF and their regulators in human cells. eLife. 2019;8:e46269. doi: 10.7554/eLife.46269. [DOI] [PMC free article] [PubMed] [Google Scholar]
- 51.Buenrostro JD, Giresi PG, Zaba LC, Chang HY, Greenleaf WJ. Transposition of native chromatin for fast and sensitive epigenomic profiling of open chromatin, DNA-binding proteins and nucleosome position. Nat Methods. 2013;10:1213–1218. doi: 10.1038/nmeth.2688. [DOI] [PMC free article] [PubMed] [Google Scholar]
- 52.Revilla-i-Domingo R, et al. The B-cell identity factor Pax5 regulates distinct transcriptional programmes in early and late B lymphopoiesis. EMBO J. 2012;31:3130–3146. doi: 10.1038/emboj.2012.155. [DOI] [PMC free article] [PubMed] [Google Scholar]
- 53.Langmead B. Aligning short sequencing reads with Bowtie. Curr Protoc Bioinformatics. 2010 doi: 10.1002/0471250953.bi1107s32. Chapter 11, Unit 11.7. [DOI] [PMC free article] [PubMed] [Google Scholar]
- 54.Zhang Y, et al. Model-based analysis of ChIP-Seq (MACS) Genome Biol. 2008;9:R137. doi: 10.1186/gb-2008-9-9-r137. [DOI] [PMC free article] [PubMed] [Google Scholar]
- 55.Salmon-Divon M, Dvinge H, Tammoja K, Bertone P. PeakAnalyzer: genome-wide annotation of chromatin binding and modification loci. BMC Bioinformatics. 2010;11:415. doi: 10.1186/1471-2105-11-415. [DOI] [PMC free article] [PubMed] [Google Scholar]
- 56.Slater GS, Birney E. Automated generation of heuristics for biological sequence comparison. BMC Bioinformatics. 2005;6:31. doi: 10.1186/1471-2105-6-31. [DOI] [PMC free article] [PubMed] [Google Scholar]
- 57.Machanick P, Bailey TL. MEME-ChIP: motif analysis of large DNA datasets. Bioinformatics. 2011;27:1696–1697. doi: 10.1093/bioinformatics/btr189. [DOI] [PMC free article] [PubMed] [Google Scholar]
- 58.Liao Y, Smyth GK, Shi W. featureCounts: an efficient general purpose program for assigning sequence reads to genomic features. Bioinformatics. 2014;30:923–930. doi: 10.1093/bioinformatics/btt656. [DOI] [PubMed] [Google Scholar]
- 59.Wagner GP, Kin K, Lynch VJ. Measurement of mRNA abundance using RNA-seq data: RPKM measure is inconsistent among samples. Theory Biosci. 2012;131:281–285. doi: 10.1007/s12064-012-0162-3. [DOI] [PubMed] [Google Scholar]
- 60.Davies JO, et al. Multiplexed analysis of chromosome conformation at vastly improved sensitivity. Nat Methods. 2016;13:74–80. doi: 10.1038/nmeth.3664. [DOI] [PMC free article] [PubMed] [Google Scholar]
- 61.Martin M. Cutadapt removes adapter sequences from high-throughput sequencing reads. EMBnet J. 2011;17:10–12. [Google Scholar]
- 62.Thongjuea S, Stadhouders R, Grosveld FG, Soler E, Lenhard B. r3Cseq: an R/Bioconductor package for the discovery of long-range genomic interactions from chromosome conformation capture and next-generation sequencing data. Nucleic Acids Res. 2013;41:e132. doi: 10.1093/nar/gkt373. [DOI] [PMC free article] [PubMed] [Google Scholar]
- 63.Wingett S, et al. HiCUP: pipeline for mapping and processing Hi-C data. F1000Res. 2015;4:1310. doi: 10.12688/f1000research.7334.1. [DOI] [PMC free article] [PubMed] [Google Scholar]
- 64.Li H, et al. The Sequence Alignment/Map format and SAMtools. Bioinformatics. 2009;25:2078–2079. doi: 10.1093/bioinformatics/btp352. [DOI] [PMC free article] [PubMed] [Google Scholar]
- 65.Heinz S, et al. Simple combinations of lineage-determining transcription factors prime cis-regulatory elements required for macrophage and B cell identities. Mol Cell. 2010;38:576–589. doi: 10.1016/j.molcel.2010.05.004. [DOI] [PMC free article] [PubMed] [Google Scholar]
Associated Data
This section collects any data citations, data availability statements, or supplementary materials included in this article.
Supplementary Materials
Data Availability Statement
The RNA-seq, ChIP-seq, ATAC-seq, VDJ-seq, 3C-seq and Hi-C data reported in this study (Supplementary Table 5) are available at the Gene Expression Omnibus (GEO) repository under the accession number GSE140975. Figure source data are provided for this paper.


