

Abstract
Human Bocavirus (HBoV) is a novel virus which can cause respiratory tract disease in infants or children. In this study, the codon usage bias and the base composition variations in the available 11 complete HBoV genome sequences have been investigated. Although, there is a significant variation in codon usage bias among different HBoV genes, codon usage bias in HBoV is a little slight, which is mainly determined by the base compositions on the third codon position and the effective number of codons (ENC) value. The results of correspondence analysis (COA) and Spearman's rank correlation analysis reveals that the G + C compositional constraint is the main factor that determines the codon usage bias in HBoV and the gene's function also contributes to the codon usage in this virus. Moreover, it was found that the hydrophobicity of each protein and the gene length are also critical in affecting these viruses’ codon usage, although they were less important than that of the mutational bias and the genes’ function. At last, the relative synonymous codon usage (RSCU) of 44 genes from these 11 HBoV isolates is analyzed using a hierarchical cluster method. The result suggests that genes with same function yet from different isolates are classified into the same lineage and it does not depend on geographical location. These conclusions not only can offer an insight into the codon usage patterns and gene classification of HBoV, but also may help in increasing the efficiency of gene delivery/expression systems.
Abbreviations: bp, base pair; HBoV, Human Bocavirus; RSCU, relative synonymous codon usage; ENC, effective number of codons; COA, correspondence analysis; GC3S, the frequency of G + C at the synonymous third position of sense codons; A3S, T3S, G3S and C3S, the adenine, thymine, guanine and cytosine content at synonymous third positions; S.D., standard deviation
Keywords: HBoV, Complete genome, Synonymous codon usage, Mutational bias, Selection pressure, Hierarchical cluster analysis
1. Introduction
In general, synonymous codons are not used equally in inter-genome and different genomes have their own characteristic patterns of synonymous codon usage (Grantham et al., 1980, Nakamura et al., 1991). In Escherichia coli, Bacillus subtilis, Saccharomyces cerevisiae, Dictyostelium discoideum (Bulmer, 1988, Sharp et al., 1993), Drosophila melanogaster (Shields et al., 1988) and Caenorhabditis elegans (Stenico et al., 1994), compositional constraints and translational selection have been found to be the main factors accounting for codon usage variation among genes. However, in some genome with extremely high A + T or G + C contents (Karlin and Mrazek, 1996, Sharp et al., 1993, Zhao et al., 2007, Zhong et al., 2007), mutation bias is the major factor accounting for the variation in codon usage. Recently, codon usage was suggested to be related to gene function (Fuglsang, 2003, Liu et al., 2005, Ma et al., 2002b) and protein secondary structure (Griswold et al., 2003, Kahali et al., 2007, Ma et al., 2002a).
Codon usage information has also been analyzed in different viruses. For example, a survey of the patterns of synonymous codon preference in human immunodeficiency virus (HIV) reveals that HIV has a marked codon usage bias due to its strong preference for the A nucleotide (Chou and Zhang, 1992). It was also found that codon usage appears to be simply a consequence of uneven base composition in nucleopolyhedroviruses (Levin and Whittome, 2000). Moreover, in Mimivirus genes, codon usage bias is dictated both by mutational pressure and translational selection, and evidences show that four factors such as mean molecular weight (MMW), hydropathy, aromaticity and cysteine content are mostly responsible for the variation of amino acid usage in Mimivirus proteins (Sau et al., 2006). Some published studies are mostly restricted to particular groups of viruses and have usually addressed phylogenetic questions (Berkhout et al., 2002, Gu et al., 2004, Zhou et al., 2005). In 2005, a research on coding sequences of RNA viruses and their genome polarity showed that positive-stranded RNA viruses have significantly higher GC contents than negative-stranded RNA viruses. Coding sequences of all negative-stranded RNA viruses are biased toward high A in coding strands (high T in genomes) (Auewarakul, 2005). A recent study showed that genome-wide mutational pressure, rather than natural selection for specific coding triplets, is the main determinant of codon usage in vertebrate-infecting DNA viruses (Shackelton et al., 2006). Studies of the synonymous codon usage in viruses can reveal information about the molecular evolution of individual genes and such information would be relevant to understanding the regulation of viral gene expression and also to vaccine design where the efficient expression of viral proteins may be required to generate immunity (Hassard and Ward, 1995, Jenkins and Holmes, 2003).
In 2005, applying molecular methods, a novel respiratory virus has been discovered in children with respiratory tract infections in Sweden and was subsequently named Human Bocavirus (HBoV) (Allander et al., 2005). Phylogenetic analyses of the complete genome of HBoV revealed that the virus is most closely related to canine minute virus and bovine parvovirus, which are members of the Bocavirus genus of the Parvoviridae family (Allander et al., 2005). The genome of parvovirus consists of two major ORFs encoding a nonstructural protein (NS1) and at least two capsid proteins (VP1 and VP2), respectively. Moreover, HBoV also has a third middle ORF encoding a nonstructural protein (NP1) of unknown function (Allander et al., 2005). HBoV is currently being detected in patients with respiratory disease in several countries, suggesting that HBoV may be circulating worldwide (Bastien et al., 2006, Phillips et al., 1987, Simon et al., 2007). The relative importance of HBoV on viral respiratory tract illnesses is still not known, but it has been associated with respiratory illnesses ranging from upper respiratory tract disease (24%) to severe bronchiolitis (11–26%) and pneumonia (17–33%) (Bastien et al., 2006, Bastien et al., 2007, Phillips et al., 1987). Preliminary reports also have suggested that the HBoV detection rate in children with respiratory tract infection at approximately 1.5–18.3% and it seems that this virus is associated with respiratory tract illness in patients, especially in infants and young children (Fryxell and Zuckerkandl, 2000, Ma et al., 2006, Sloots et al., 2006, Weissbrich et al., 2006).
Although genome sequence of HBoV has been published and many studies have been performed on it in recent years (Allander et al., 2005, Lu et al., 2006), few genomic analyses are available on this virus (Chieochansin et al., 2007). In particular, no in depth genomic analyses have so far been made on codon usage, which may provide more information on the features of HBoV genome. In this study, we have analyzed and compared the codon usage data of 11 available complete genome sequences of HBoV. Such information not only can offer an insight into the codon usage patterns of HBoV, but also may help in increasing the efficiency of gene delivery/expression systems.
2. Materials and methods
2.1. Datasets
The 11 available complete genome sequences of HBoV (listed in Table 1 ) have been downloaded from NCBI (http://www.ncbi.nlm.nih.gov/). To minimize the sampling error we have taken only those genes, which are greater than or equal to 300 bp and have internal termination codons. Finally 44 genes were selected for analysis (Table 2 ).
Table 1.
Eleven complete genome sequences of HBoV under study
| Isolate name | Country of isolation | Accession |
|---|---|---|
| HBoV WLL-3 | China | EF584447 |
| HBoV WLL-2 | China | EF441262 |
| HBoV BJ3722 | China | DQ988934 |
| HBoV CU74 | Thailand | EF203922 |
| HBoV CU49 | Thailand | EF203921 |
| HBoV CU6 | Thailand | EF203920 |
| HBoV BJ3064 | China | DQ988933 |
| HBoV WLL-1 | China | DQ778300 |
| HBoV CRD2 | USA | DQ340570 |
| HBoV st2 | Sweden | DQ000496 |
| HBoV st1 | Sweden | DQ000495 |
Table 2.
Identified genes (length > 300 bps) in these 11 HBoV genomes under study
| SN | Gene | GC3Sa | GCb | ENC | F1c | F2d | SN | Gene | GC3S | GC | ENC | F1 | F2 |
|---|---|---|---|---|---|---|---|---|---|---|---|---|---|
| 1 | WLL-3-NS1 | 0.31 | 0.42 | 46.63 | −0.03 | −0.41 | 23 | CU6-VP1 | 0.30 | 0.42 | 42.07 | 0.26 | 0.11 |
| 2 | WLL-3-NP1 | 0.40 | 0.44 | 47.96 | −0.50 | 0.16 | 24 | CU6-VP2 | 0.31 | 0.43 | 41.09 | 0.29 | 0.14 |
| 3 | WLL-3-VP1 | 0.30 | 0.42 | 42.12 | 0.24 | 0.10 | 25 | BJ3064-NS1 | 0.31 | 0.42 | 46.63 | −0.03 | −0.41 |
| 4 | WLL-3-VP2 | 0.31 | 0.43 | 41.27 | 0.27 | 0.13 | 26 | BJ3064-NP1 | 0.40 | 0.44 | 47.41 | −0.54 | 0.18 |
| 5 | WLL-2-NS1 | 0.31 | 0.42 | 46.69 | −0.03 | −0.41 | 27 | BJ3064-VP1 | 0.29 | 0.42 | 41.97 | 0.25 | 0.11 |
| 6 | WLL-2-NP1 | 0.40 | 0.44 | 47.96 | −0.50 | 0.16 | 28 | BJ3064-VP2 | 0.31 | 0.43 | 41.10 | 0.29 | 0.14 |
| 7 | WLL-2-VP1 | 0.30 | 0.42 | 42.14 | 0.24 | 0.10 | 29 | WLL-1-NS1 | 0.31 | 0.42 | 46.84 | −0.03 | −0.41 |
| 8 | WLL-2-VP2 | 0.31 | 0.43 | 41.31 | 0.27 | 0.12 | 30 | WLL-1-NP1 | 0.39 | 0.44 | 47.91 | −0.49 | 0.16 |
| 9 | BJ3722-NS1 | 0.30 | 0.41 | 46.57 | −0.03 | −0.41 | 31 | WLL-1-VP1 | 0.29 | 0.42 | 41.89 | 0.25 | 0.12 |
| 10 | BJ3722-NP1 | 0.39 | 0.44 | 47.91 | −0.49 | 0.16 | 32 | WLL-1-VP2 | 0.31 | 0.43 | 40.87 | 0.28 | 0.15 |
| 11 | BJ3722-VP1 | 0.29 | 0.42 | 41.97 | 0.25 | 0.11 | 33 | CRD2-NS1 | 0.30 | 0.41 | 46.41 | −0.02 | −0.41 |
| 12 | BJ3722-VP2 | 0.31 | 0.43 | 41.10 | 0.29 | 0.14 | 34 | CRD2-NP1 | 0.39 | 0.44 | 47.91 | −0.49 | 0.16 |
| 13 | CU74-NS1 | 0.30 | 0.41 | 46.57 | −0.03 | −0.40 | 35 | CRD2-VP1 | 0.30 | 0.42 | 41.95 | 0.25 | 0.12 |
| 14 | CU74-NP1 | 0.39 | 0.43 | 47.76 | −0.49 | 0.16 | 36 | CRD2-VP2 | 0.31 | 0.43 | 41.00 | 0.29 | 0.14 |
| 15 | CU74-VP1 | 0.30 | 0.42 | 42.27 | 0.25 | 0.12 | 37 | st2-NS1 | 0.31 | 0.42 | 46.63 | −0.03 | −0.41 |
| 16 | CU74-VP2 | 0.31 | 0.43 | 41.41 | 0.28 | 0.14 | 38 | st2-NP1 | 0.39 | 0.43 | 47.76 | −0.49 | 0.16 |
| 17 | CU49-NS1 | 0.30 | 0.41 | 46.40 | −0.03 | −0.41 | 39 | st2-VP1 | 0.30 | 0.42 | 41.87 | 0.25 | 0.11 |
| 18 | CU49-NP1 | 0.39 | 0.44 | 47.91 | −0.49 | 0.16 | 40 | st2-VP2 | 0.31 | 0.43 | 40.93 | 0.29 | 0.14 |
| 19 | CU49-VP1 | 0.30 | 0.42 | 42.67 | 0.23 | 0.11 | 41 | st1-NS1 | 0.30 | 0.41 | 46.40 | −0.03 | −0.42 |
| 20 | CU49-VP2 | 0.31 | 0.43 | 41.95 | 0.27 | 0.14 | 42 | st1-NP1 | 0.40 | 0.44 | 48.42 | −0.50 | 0.16 |
| 21 | CU6-NS1 | 0.30 | 0.41 | 46.46 | −0.03 | −0.41 | 43 | st1-VP1 | 0.29 | 0.42 | 42.16 | 0.23 | 0.12 |
| 22 | CU6-NP1 | 0.40 | 0.44 | 48.04 | −0.49 | 0.16 | 44 | st1-VP2 | 0.31 | 0.43 | 41.37 | 0.26 | 0.14 |
SN: sequence number; ENC: effective number of codons.
The frequency of G + C at the third synonymously variable coding position.
The frequency of G + C of this gene.
The first axis values of each gene in COA.
The second axis values of each gene in COA.
2.2. Statistical analysis
Correlation analysis was carried out by using the Spearman's rank correlation analysis method. In order to compare the variation of codon usage between different gene groups, a one-tailed t-test has been used. Cluster analysis was done using a hierarchical cluster method and the distances between selected sequences were calculated by the Euclidean distance method.
2.3. Measures of synonymous codon usage bias
Relative synonymous codon usage (RSCU) values were calculated by dividing the observed codon usage by that expected when all codons for the same amino acid are used equally to normalize codon usage within datasets of different amino acid compositions (Paul and Wen-Hsiung, 1986). The ‘effective number of codons’ (ENC) was often used to measure the magnitude of codon bias for an individual gene, which yields values ranging from 20 for a gene with extreme bias using only one codon per amino acid, to 61 for a gene with no bias using synonymous codons equally (Wright, 1990). GC3S value is the frequency of G + C at the third synonymously variable coding position (excluding Met, Trp, and termination codons), which is a good indicator of the extent of base composition bias. Similarly, GC1S and GC2S are the frequencies of the nucleotide G + C at the synonymous first and second position, respectively. The GRAVY score, which indicates the mean hydropathy index of the encoded amino acid residues and hence, is an estimate of overall hydrophobicity (Kyte and Doolittle, 1982), was computed for each gene product.
2.4. Correspondence analysis (COA)
The most commonly used method of multivariate statistical analysis is called COA in which all genes were plotted in a 59-dimensional hyperspace, according to their usage of the 59 sense codons (excluding Met, Trp, and termination codons). Major trends within this dataset can be determined using measures of relative inertia and genes ordered according to their positions along the axis of major inertia. This method has been successfully used to investigate the variation of RSCU values among genes (Sau et al., 2006, Shackelton et al., 2006, Zhao et al., 2003).
2.5. Analysis tools
Therefore, the RSCU, GC3s, ENC, G + C, GRAVY, length value, COA were calculated using the program CodonW Version 1.4 (http://codonw.sourceforge.net). The correlation analysis and Cluster analysis were carried out by using the multianalysis software SPSS Version 13.0 (http://spss.com).
3. Results
3.1. Synonymous codon usage in HBoV
The details of genes and the overall RSCU values of 59 codons in 11 HBoV isolates were, respectively, shown in Table 2 and Table 3 (see http://222.210.17.171/yak/HBoV/Table3.htm for Table 3). Most of preferentially used codons in HBoV are all A- or U-ended codons (Table 3). These HBoV isolates are GC poor genomes with average GC content of 42%. Due to compositional constraints, it is expected that A- and/or U-ended codons should be preferentially used in this genome. But it is also interesting to note that UAC is most used among these 44 genes, while GAC is the most used in all NS1 and VP2 genes.
To study the codon usage variation among different HBoV genes, ENC and GC3S values of different HBoV genes were calculated (Table 2). ENC values of different HBoV genes vary from 40.87 to 48.42, with a mean value of 44.45 and S.D. of 2.89. All the ENC values of these genes are more than 40. The data suggests the homogeneity of synonymous codon usage among HBoV genes examined. This concept is further supported by the GC3S values for each HBoV genes, which range from 29% to 40% with a mean of 33% and S.D. of 0.04.
3.2. Correspondence analysis on codon usage
To investigate the variation of RSCU values among genes, correspondence analysis (COA) was implemented on these 44 HBoV genes examined as a single dataset based on the RSCU value of each gene. As mentioned, the axis of a correspondence analysis identifies the source of the variation among a set of multivariate data point. The four largest trends in codon usage among these genes were observed: the first axis accounts for 61.20% of all variation among genomes, whereas the next three axes accounts for 35.43%, 1.62% and 0.55%, respectively.
3.3. Effect of mutational bias on the codon usage variation in HBoV
To investigate if the evolution of codon usage bias is controlled by mutation pressure or by natural selection, firstly, G + C content at the first and second codon positions (GC12) was compared with that at synonymous third codon positions (GC3S) (Fig. 1 ) and a highly significant correlation was observed (r = −0.837, P < 0.05) by using the Spearman's rank correlation analysis method, indicating that patterns of base composition are most likely the result of mutation pressure, and not natural selection, since the effects are present at all codon positions. Secondly, for each gene, actual codon bias was plotted against both GC3S and the expected ENC value, if codon usage bias is solely due to biased base composition (i.e. G + C content). Result showed that the actual codon usage indices are close to the values expected from their G + C composition, although all are slightly lower (Fig. 2 ). Thirdly, we plotted the first and second axis values in COA and GC3S values of each strains (Fig. 3 ). The patterns of codon usage in different genes also appear to be closely related to the GC content on the third codon position. Correlation analysis has been implemented to each gene to find some correlation between synonymous codon usage and nucleotide compositions. We also found that axis 1 coordinates are correlated with GC3S and GC (r = −0.918, P < 0.01; r = −0.585, P < 0.01), while there is a significant correlation between axis 2 value and GC3S (r = 0.366, P < 0.05). Taken together, these analyses indicate that most of the codon usage bias among these HBoV genes is directly related to the nucleotide composition. Furthermore, mutational bias is the major factor responsible for the variation of synonymous codon usage among genes in these virus genomes.
Fig. 1.

Correlation between GC content at first and second codon positions (GC12) with that at synonymous third codon positions (GC3S).
Fig. 2.

Distribution of the codon usage index, ENC, and GC content at synonymous third codon positions (GC3S). The curve indicates the expected codon usage if GC compositional constraints alone account for codon usage bias.
Fig. 3.
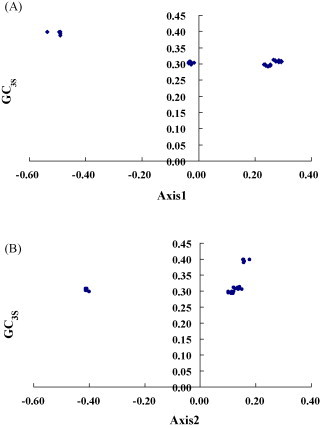
Correlation between the first axis (A), second axis (B) values in COA and GC3S values of each gene.
3.4. Gene function also drives the codon usage variation among different viruses
It is clear in Table 2 that the functionally homologous genes in different viral genomes tend to have close value of the first axis in COA. Because the closeness of any two genes on this value reflects the similarities of their codon usages, synonymous codon usage bias appears to be conservative between genes that are functionally closely related (Zhou et al., 2005). To detect whether gene function were correlated with the observed variation in codon bias, all genes were grouped into several classes according to gene function. Because most of these viruses contain genes coding for a nonstructural protein (NS1), two capsid proteins (VP1 and VP2), respectively, and also a third middle ORF encoding a nonstructural protein (NP1) of unknown function, these four gene groups were selected to find whether there is a correlation between codon usage and gene function. The average ENC value and its corresponding S.D. value of each group were calculated (Fig. 4 ). The S.D. values of NS1, VP1, VP2 and NP1 groups were all slight. A one-tailed t-test was then performed on ENC values and values of both axes1 and axes 2 in COA of these genes with the hypothesis that there is no correlation between codon usage bias and gene function (t-test, P-value < 10−3). It suggests that the gene's function also contributes to the codon usage in HBoV, although the mutational bias mainly drives the codon usage in these genes.
Fig. 4.

Average ENC value and its corresponding S.D. value of each group according to the gene type among 11 HBoV isolates under study.
3.5. Effect of other factors on codon usage
Usually, mutational bias and natural selection, (i.e. gene length and the hydrophobicity of each protein) are thought to account for the codon usage variation among genes in different organisms. To test that whether any selection pressure contributes to the codon usage variation among these virus genes and which selection pressure determines this variation, we performed a correlation analysis on axis 1, axis 2 between the hydrophobicity of each protein and gene length. The results show that axis 1 and axis 2 coordinates are also significantly correlated with the hydrophobicity of each protein (r = 0.709, P < 0.01; r = −0.703, P < 0.01), respectively, while axis 1 and axis 2 coordinates are also significantly correlated with the gene length (r = 0.848, P < 0.01; r = −0.451, P < 0.01), respectively, indicating that the hydrophobicity of each protein and gene length are also critical in affecting these viruses’ codon usage, although they were less important than that of the mutational bias and the gene's function.
3.6. Cluster analysis
Based on the RSUC variation of these 44 HBoV genes examined, a cluster tree was generated by using Hierarchical cluster method. As shown in Fig. 5 , these 44 HBoV genes examined were divided into four main lineages (I–IV). Lineage I was comprised 11 NP1 genes from these 11 HBoV isolates examined. Lineage II was comprised 11 NS1 genes. All VP2 genes from these 11 HBoV isolates examined were grouped into lineage III. Lineage IV included genes of VP2. From the above, we can see that genes with same function yet from different isolates are classified into the same lineage and it does not depend on geographical location.
Fig. 5.

Dendroid chart of the cluster result of the 44 HBoV genes under study based on hierarchical cluster method.
Distances between each lineage center are listed in Table 4 . From Table 4, it can be found that the longer the distances between the main lineage centers, the bigger the difference between their codon usages. The distances between lineages of similar gene functions are relatively closer than those distances between classes of different gene functions. For example, the distance between lineages III and IV is obviously closer than their distances to other classes, such as classes I and II. This once again testified to the conclusion that genes with similar functions also display similar codon usage bias.
Table 4.
Distances between main lineages
| Lineage no. | I | II | III | IV |
|---|---|---|---|---|
| I | 5.85 | 5.73 | 6.11 | |
| II | 5.85 | 4.97 | 5.41 | |
| III | 5.73 | 4.97 | 1.11 | |
| IV | 6.11 | 5.41 | 1.11 |
4. Discussion
It has been well established that synonymous codon usage in various organisms, often reflect a balance between mutation pressure and translational selection. However, with the development of genome project of many organisms, many researches have showed that other factors also influence the biased usage of synonymous codons. Knowledge of codon usage pattern in virus may assist the development of polynucleotide vaccines and improve understanding of the evolution and pathogenesis of certain virus.
In 2003, a comprehensive analysis and comparison of codon usage and A + T content in 79 human papillomavirus (HPV) genotypes from three distinct phylogenetic groups has revealed that all eight ORFs across HPV genotypes show a strong codon usage bias and a similar pattern of codon usage is observed in human and nonhuman PVs though they originate from different phylogenetic groups (Zhao et al., 2003). In this study, evidence suggests that synonymous codon usage bias in HBoV was less biased, which was mainly determined by the base compositions on the third codon position. As a case in point, the values of ENC vary from 40.87 to 48.42 (S.D. = 2.89) and the GC3S values range from 29% to 40% (S.D. = 0.04). The average ENC value of 44.45 among 44 genes can be compared to those seen in other organisms such as H5N1 virus, severe acute respiratory syndrome Coronavirus (SARSCoV), Porcine adenovirus, Orgyia pseudotsugata multicapsid nucleopolyhedrovirus (OpMNPV) and Lymantria dispar multinucleocapsid nuclear polyhedrosis virus (LdMNPV), where mean values of 50.91, 48.99, 38.97, 38.80 and 35.90, respectively, have been reported (Das et al., 2006, Gu et al., 2004, Levin and Whittome, 2000, Zhou et al., 2005). Therefore, taken together with published data of codon usage bias among some other viruses, we could conclude that codon usage bias in HBoV genes is less biased.
In human RNA viruses, mutation pressure seems to be the main force shaping codon usage, accounting for 71–85% of the observed bias (Jenkins and Holmes, 2003). In 2005, in order to understand the common features and differences among viruses, some sequenced vertebrate-infecting DNA viruses were analyzed. This research revealed that patterns of codon usage bias are strongly correlated with overall genomic GC content, suggesting that genome-wide mutational pressure, rather than natural selection for specific coding triplets, is the main determinant of codon usage (Shackelton et al., 2006). But in Chlamydomonas reinhardtii genome (Naya et al., 2001) which had high GC contents, there was no evidence that the genome composition shaped the codon usages of genes. In this study, the general association between codon usage bias and base composition suggests that mutational pressure, rather than natural selection is the main factor that determines the codon usage bias in HBoV, which is also supported by the highly significant correlation between GC12 and GC3S (r = −0.837, P < 0.05), and the result of ENC-plot (Fig. 2). A similar pattern of codon usage has been reported amongst some viruses (Das et al., 2006, Jenkins and Holmes, 2003, Levin and Whittome, 2000, Shackelton et al., 2006, Zhao et al., 2003). Therefore, mutational bias is the major factor responsible for the variation of synonymous codon usage among genes in these virus genomes.
Generally, natural selection, such as translational selection, gene length and gene function are thought to be the factors accounting for the codon usage variation among genes in different organisms (Zhou et al., 2005). Some published results have shown that functionally homologous genes in different viral genomes tend to cluster together in COA (Das et al., 2006, Gu et al., 2004, Zhou et al., 2005). In this study, it is also clear that, gene function, rather than mutational bias, is another factor accounting for codon usage variation among these virus genes.
The longer genes had higher expression level and higher codon usage bias in Streptococcus pneumoniae genome (Hou, 2002), but in Drosophila (Comeron et al., 1999), longer genes had lower codon usage bias. While in some virus, gene length has no effect on the variations of synonymous codon usage (Das et al., 2006, Gu et al., 2004, Levin and Whittome, 2000, Zhou et al., 2005). Those indicated that different genomes had different gene lengths which accommodated their particular genome's best requirements, and there were not universal rules about gene length and codon usage in all genomes. In this study, the gene length had played a critical role in affecting HBoV codon usage. The mechanisms that lead this is not clear, which is needed a more comprehensive analysis.
The hydropathy level of each protein influence codon choices in Chlamydia trachomatis, and Thermotoga maritime (Romero et al., 2000, Zavala et al., 2002). Evidences show that hydropathy of each Mimivirus gene, aromaticity and cysteine content are mostly responsible for the variation of amino acid usage in Mimivirus and foot-and-mouth disease viurs (FMDV) (Sau et al., 2006, Zhong et al., 2007). In this study, codon usage is significantly positively correlated with the hydrophobicity of each HBoV gene. The link with hydropathy and codon usage may be caused by the fact that the expressed sequences are hydrophilic just because they accomplish their function in the aqueous media of the cell (Romero et al., 2000).
To date, phylogenetic analyses have been performed on HBoV from complete coding sequence, NS1, NP1, VP1, and VP2 gene (Bastien et al., 2007, Chieochansin et al., 2007, Mandal et al., 2007, Neske et al., 2007, Qu et al., 2007). These analyses indicated the NS/NP1 gene are the most conserved regions and thus, will not demonstrate differences between HBoV isolates; most variations of nucleotide sequences appeared in the VP1/VP2 gene encoding the capsid protein and the variation between HBoV isolates does not depend on geographical location. In this study, cluster analyses based on the RSUC values of the 44 HBoV genes examined were carried out using a hierarchical cluster method. The result indicated that gene's function is the dominant factor that determines the result of cluster analysis and suggests that the cluster pattern of HBoV does not correlate with geographic variation. This conclusion has prosperous applications in the field of gene classification and the prediction of gene functions.
Our analysis revealed that although there are a few variations in codon usage bias among different HBoV isolates, codon usage bias in HBoV is low. But clearly, a more comprehensive analysis is needed to reveal the true extent of codon usage bias variation within and among HBoV isolates and what other factors are responsible, including the influence of factors such as cell tropism, principal host species, method of transmission, and viral genetic structure. Such information would then allow us to judge more precisely the relative importance of mutation pressure versus natural selection in determining base composition and codon usage in these pathogens (Jenkins et al., 2001).
Codon usage patterns and the phylogenetic results we proposed here are useful to understand the processes governing the evolution of HBoV, especially the roles played by mutation pressure and natural selection. Further, such information not only can offer an insight into the codon usage patterns and gene classification of HBoV, but also may help in increasing the efficiency of gene delivery/expression systems.
Footnotes
Supplementary data associated with this article can be found, in the online version, at doi:10.1016/j.biosystems.2008.01.006.
Appendix A. Supplementary data
Synonymous codon usage of 44 genes in these 11 HBoV genomes under study.
References
- Allander T., Tammi M.T., Eriksson M., Bjerkner A., Tiveljung-Lindell A., Andersson B. Cloning of a human parvovirus by molecular screening of respiratory tract samples. Proc. Natl. Acad. Sci. U.S.A. 2005;102(36):12891–12896. doi: 10.1073/pnas.0504666102. [DOI] [PMC free article] [PubMed] [Google Scholar]
- Auewarakul P. Composition bias and genome polarity of RNA viruses. Virus Res. 2005;109(1):33–37. doi: 10.1016/j.virusres.2004.10.004. [DOI] [PMC free article] [PubMed] [Google Scholar]
- Bastien N., Brandt K., Dust K., Ward D., Li Y. Human Bocavirus infection, Canada. Emerg. Infect. Dis. 2006;12(5):848–850. doi: 10.3201/eid1205.051424. [DOI] [PMC free article] [PubMed] [Google Scholar]
- Bastien N., Chui N., Robinson J.L., Lee B.E., Dust K., Hart L., Li Y. Detection of Human Bocavirus in Canadian children in a 1-year study. J. Clin. Microbiol. 2007;45(2):610–613. doi: 10.1128/JCM.01044-06. [DOI] [PMC free article] [PubMed] [Google Scholar]
- Berkhout B., Grigoriev A., Bakker M., Lukashov V.V. Codon and amino acid usage in retroviral genomes is consistent with virus-specific nucleotide pressure. AIDS Res. Hum. Retrov. 2002;18(2):133–141. doi: 10.1089/08892220252779674. [DOI] [PubMed] [Google Scholar]
- Bulmer M. Are codon usage patterns in unicellular organisms determined by selection-mutation balance? J. Evol. Biol. 1988;1(1):15–26. [Google Scholar]
- Chieochansin T., Chutinimitkul S., Payungporn S., Hiranras T., Samransamruajkit R., Theamboolers A., Poovorawan Y. Complete coding sequences and phylogenetic analysis of Human Bocavirus (HBoV) Virus Res. 2007;129(1):54–57. doi: 10.1016/j.virusres.2007.04.022. [DOI] [PubMed] [Google Scholar]
- Chou K.C., Zhang C.T. Diagrammatization of codon usage in 339 human immunodeficiency virus proteins and its biological implication. AIDS Res. Hum. Retrov. 1992;8(12):1967–1976. doi: 10.1089/aid.1992.8.1967. [DOI] [PubMed] [Google Scholar]
- Comeron J.M., Kreitman M., Aguade M. Natural selection on synonymous sites is correlated with gene length and recombination in Drosophila. Genetics. 1999;151(1):239–249. doi: 10.1093/genetics/151.1.239. [DOI] [PMC free article] [PubMed] [Google Scholar]
- Das S., Paul S., Dutta C. Synonymous codon usage in adenoviruses: influence of mutation, selection and protein hydropathy. Virus Res. 2006;117(2):227–236. doi: 10.1016/j.virusres.2005.10.007. [DOI] [PubMed] [Google Scholar]
- Fryxell K.J., Zuckerkandl E. Cytosine deamination plays a primary role in the evolution of mammalian isochors. Mol. Biol. Evol. 2000;17(9):1371–1383. doi: 10.1093/oxfordjournals.molbev.a026420. [DOI] [PubMed] [Google Scholar]
- Fuglsang A. Strong associations between gene function and codon usage. Apmis. 2003;111(9):843–847. doi: 10.1034/j.1600-0463.2003.1110902.x. [DOI] [PubMed] [Google Scholar]
- Grantham R., Gautier C., Gouy M. Codon frequencies in 119 individual genes confirm corsistent choices of degenerate bases according to genome type. Nucliec Acids Res. 1980;8(9):1893–1912. doi: 10.1093/nar/8.9.1893. [DOI] [PMC free article] [PubMed] [Google Scholar]
- Griswold K.E., Mahmood N.A., Iverson B.L., Georgiou G. Effects of codon usage versus putative 5’-mRNA structure on the expression of Fusarium solani cutinase in the Escherichia coli cytoplasm. Protein Expres. Purif. 2003;27(1):134–142. doi: 10.1016/s1046-5928(02)00578-8. [DOI] [PubMed] [Google Scholar]
- Gu W.J., Zhou T., Ma J.M., Sun X., Lu Z.H. Analysis of synonymous codon usage in SARS Coronavirus and other viruses in the Nidovirales. Virus Res. 2004;101(2):155–161. doi: 10.1016/j.virusres.2004.01.006. [DOI] [PMC free article] [PubMed] [Google Scholar]
- Hassard S., Ward G. Efficient creation of sequencing libraries from blunt-ended restriction enzyme fragments. Biotechniques. 1995;18(3):396–398. 400. [PubMed] [Google Scholar]
- Hou ZC Y.N. Analysis of factors shaping S. pneumoniae codon usage. Yi. Chuan Xue. Bao. 2002;29(8):747–752. [PubMed] [Google Scholar]
- Jenkins G.M., Holmes E.C. The extent of codon usage bias in human RNA viruses and its evolutionary origin. Virus Res. 2003;92(1):1–7. doi: 10.1016/s0168-1702(02)00309-x. [DOI] [PubMed] [Google Scholar]
- Jenkins G.M., Pagel M., Gould E.A., Zanotto P.M.d.A., Holmes E.C. Evolution of base composition and codon usage bias in the genus Flavivirus. J. Mol. Evol. 2001;52(4):383–390. doi: 10.1007/s002390010168. [DOI] [PubMed] [Google Scholar]
- Kahali B., Basak S., Ghosh T.C. Reinvestigating the codon and amino acid usage of S. cerevisiae genome: a new insight from protein secondary structure analysis. Biochem. Biophys. Res. Commun. 2007;354(3):693–699. doi: 10.1016/j.bbrc.2007.01.038. [DOI] [PubMed] [Google Scholar]
- Karlin S., Mrazek J. What drives codon choices in human genes? J. Mol. Biol. 1996;262(4):459–472. doi: 10.1006/jmbi.1996.0528. [DOI] [PubMed] [Google Scholar]
- Kyte J., Doolittle R.F. A simple method for displaying the hydropathic character of a protein. J. Mol. Biol. 1982;157(1):105–132. doi: 10.1016/0022-2836(82)90515-0. [DOI] [PubMed] [Google Scholar]
- Levin D.B., Whittome B. Codon usage in nucleopolyhedroviruses. J. Gen. Virol. 2000;81(Pt 9):2313–2325. doi: 10.1099/0022-1317-81-9-2313. [DOI] [PubMed] [Google Scholar]
- Liu Q., Dou S., Ji Z., Xue Q. Synonymous codon usage and gene function are strongly related in Oryza sativa. Biosystems. 2005;80(2):123–131. doi: 10.1016/j.biosystems.2004.10.008. [DOI] [PubMed] [Google Scholar]
- Lu X., Chittaganpitch M., Olsen S.J., Mackay I.M., Sloots T.P., Fry A.M., Erdman D.D. Real-time PCR assays for detection of Bocavirus in human specimens. J. Clin. Microbiol. 2006;44(9):3231–3235. doi: 10.1128/JCM.00889-06. [DOI] [PMC free article] [PubMed] [Google Scholar]
- Ma J., Campbell A., Karlin S. Correlations between shine-dalgarno sequences and gene features such as predicted expression levels and operon structures. J. Bacteriol. 2002;184(20):5733–5745. doi: 10.1128/JB.184.20.5733-5745.2002. [DOI] [PMC free article] [PubMed] [Google Scholar]
- Ma J., Zhou T., Gu W., Sun X., Lu Z. Cluster analysis of the codon use frequency of MHC genes from different species. Biosystems. 2002;65(2–3):199–207. doi: 10.1016/s0303-2647(02)00016-3. [DOI] [PubMed] [Google Scholar]
- Ma X., Endo R., Ishiguro N., Ebihara T., Ishiko H., Ariga T., Kikuta H. Detection of Human Bocavirus in Japanese children with lower respiratory tract infections. J. Clin. Microbiol. 2006;44(3):1132–1134. doi: 10.1128/JCM.44.3.1132-1134.2006. [DOI] [PMC free article] [PubMed] [Google Scholar]
- Mandal D., Feng Z., Stoltzfus C.M. Gag processing defect of HIV-1 integrase E246 and G247 mutants is caused by activation of an overlapping 5′ splice site. J. Virol. 2007 doi: 10.1128/JVI.02295-07. [DOI] [PMC free article] [PubMed] [Google Scholar]
- Nakamura T., Suyama A., Wada A. Two types of linkage between codon usage and gene-expression levels. FEBS Lett. 1991;289(1):123–125. doi: 10.1016/0014-5793(91)80923-q. [DOI] [PubMed] [Google Scholar]
- Naya H., Romero H., Carels N., Zavala A., Musto H. Translational selection shapes codon usage in the GC-rich genome of Chlamydomonas reinhardtii. FEBS Lett. 2001;501(2–3):127–130. doi: 10.1016/s0014-5793(01)02644-8. [DOI] [PubMed] [Google Scholar]
- Neske F., Blessing K., Tollmann F., Schubert J., Rethwilm A., Kreth H.W., Weissbrich B. Real-time PCR for Human Bocavirus infections and phylogenetic analysis. J. Clin. Microbiol. 2007 doi: 10.1128/JCM.00027-07. [DOI] [PMC free article] [PubMed] [Google Scholar]
- Paul M.S., Wen-Hsiung L. An evolutionary perspective on synonymous codon usage in unicellular organisms. J. Mol. Evol. 1986;24(1):28–38. doi: 10.1007/BF02099948. [DOI] [PubMed] [Google Scholar]
- Phillips G.J., Arnold J., Ivarie R. The effect of codon usage on the oligonucleotide composition of the E. coli genome and identification of over- and underrepresented sequences by Markov chain analysis. Nucleic Acids Res. 1987;15(6):2627–2638. doi: 10.1093/nar/15.6.2627. [DOI] [PMC free article] [PubMed] [Google Scholar]
- Qu X.W., Duan Z.J., Qi Z.Y., Xie Z.P., Gao H.C., Liu W.P., Huang C.P., Peng F.W., Zheng L.S., Hou Y.D. Human Bocavirus infection, People's Republic of China. Emerg. Infect. Dis. 2007;13(1):165–168. doi: 10.3201/eid1301.060824. [DOI] [PMC free article] [PubMed] [Google Scholar]
- Romero H., Zavala A., Musto H. Codon usage in Chlamydia trachomatis is the result of strand-specific mutational biases and a complex pattern of selective forces. Nucleic Acids Res. 2000;28(10):2084–2090. doi: 10.1093/nar/28.10.2084. [DOI] [PMC free article] [PubMed] [Google Scholar]
- Sau K., Gupta S.K., Sau S., Mandal S.C., Ghosh T.C. Factors influencing synonymous codon and amino acid usage biases in Mimivirus. Biosystems. 2006;85(2):107–113. doi: 10.1016/j.biosystems.2005.12.004. [DOI] [PubMed] [Google Scholar]
- Shackelton L.A., Parrish C.R., Holmes E.C. Evolutionary basis of codon usage and nucleotide composition bias in vertebrate DNA viruses. J. Mol. Evol. 2006;62(5):551–563. doi: 10.1007/s00239-005-0221-1. [DOI] [PubMed] [Google Scholar]
- Sharp P.M., Stenico M., Peden J.F., Lloyd A.T. Codon usage: mutational bias, translational selection, or both? Biochem. Soc. Trans. 1993;21(4):835–841. doi: 10.1042/bst0210835. [DOI] [PubMed] [Google Scholar]
- Shields D.C., Sharp P.M., Higgins D.G., Wright F. “Silent” sites in Drosophila genes are not neutral: evidence of selection among synonymous codons. Mol. Biol. Evol. 1988;5(6):704–716. doi: 10.1093/oxfordjournals.molbev.a040525. [DOI] [PubMed] [Google Scholar]
- Simon A., Groneck P., Kupfer B., Kaiser R., Plum G., Tillmann R.L., Muller A., Schildgen O. Detection of Bocavirus DNA in nasopharyngeal aspirates of a child with bronchiolitis. J. Infect. 2007;54(3):e125–e127. doi: 10.1016/j.jinf.2006.08.001. [DOI] [PMC free article] [PubMed] [Google Scholar]
- Sloots T.P., McErlean P., Speicher D.J., Arden K.E., Nissen M.D., Mackay I.M. Evidence of human coronavirus HKU1 and Human Bocavirus in Australian children. J. Clin. Virol. 2006;35(1):99–102. doi: 10.1016/j.jcv.2005.09.008. [DOI] [PMC free article] [PubMed] [Google Scholar]
- Stenico M., Lloyd A.T., Sharp P.M. Codon usage in Caenorhabditis elegans: delineation of translational selection and mutational biases. Nucleic Acids Res. 1994;22(13):2437–2446. doi: 10.1093/nar/22.13.2437. [DOI] [PMC free article] [PubMed] [Google Scholar]
- Weissbrich B., Neske F., Schubert J., Tollmann F., Blath K., Blessing K., Kreth H.W. Frequent detection of Bocavirus DNA in German children with respiratory tract infections. BMC Infect. Dis. 2006;6:109. doi: 10.1186/1471-2334-6-109. [DOI] [PMC free article] [PubMed] [Google Scholar]
- Wright F. The ‘effective number of codons’ used in a gene. Gene. 1990;87(1):23–29. doi: 10.1016/0378-1119(90)90491-9. [DOI] [PubMed] [Google Scholar]
- Zavala A., Naya H., Romero H., Musto H. Trends in codon and amino acid usage in Thermotoga maritime. J. Mol. Evol. 2002;54(5):563–568. doi: 10.1007/s00239-001-0040-y. [DOI] [PubMed] [Google Scholar]
- Zhao K.N., Liu W.J., Frazer I.H. Codon usage bias and A+T content variation in human papillomavirus genomes. Virus Res. 2003;98(2):95–104. doi: 10.1016/j.virusres.2003.08.019. [DOI] [PubMed] [Google Scholar]
- Zhao S., Zhang Q., Chen Z., Zhao Y., Zhong J. The factors shaping synonymous codon usage in the genome of Burkholderia mallei. J. Genet. Genomics. 2007;34(4):362–372. doi: 10.1016/S1673-8527(07)60039-3. [DOI] [PubMed] [Google Scholar]
- Zhong J., Li Y., Zhao S., Liu S., Zhang Z. Mutation pressure shapes codon usage in the GC-Rich genome of foot-and-mouth disease virus. Virus Genes. 2007;35(3):767–776. doi: 10.1007/s11262-007-0159-z. [DOI] [PMC free article] [PubMed] [Google Scholar]
- Zhou T., Gu W., Ma J., Sun X., Lu Z. Analysis of synonymous codon usage in H5N1 virus and other influenza A viruses. Biosystems. 2005;81(1):77–86. doi: 10.1016/j.biosystems.2005.03.002. [DOI] [PubMed] [Google Scholar]
Associated Data
This section collects any data citations, data availability statements, or supplementary materials included in this article.
Supplementary Materials
Synonymous codon usage of 44 genes in these 11 HBoV genomes under study.