

Abstract
We investigated peripheral blood mononuclear cell gene expression responses to acute psychosocial stress to identify molecular pathways relevant to the stress response. Blood samples were obtained from 10 healthy male subjects before, during and after (at 0, 30, and 60 min) a standardized psychosocial laboratory stressor. Ribonucleic acid (RNA) was extracted and gene expression measured by hybridization to a 20,000-gene microarray. Gene Set Expression Comparisons (GSEC) using defined pathways were used for the analysis. Forty-nine pathways were significantly changed from baseline to immediately after the stressor (p < 0.05), implicating cell cycle, cell signaling, adhesion and immune responses. The comparison between stress and recovery (measured 30 min later) identified 36 pathways, several involving stress-responsive signaling cascades and cellular defense mechanisms. These results have relevance for understanding molecular mechanisms of the physiological stress response, and might be used to further study adverse health outcomes of psychosocial stress.
Keywords: Gene expression, Psychosocial stress, Peripheral blood mononuclear cell, Microarray, Biological pathways
1. Introduction
The importance of psychosocial stress as a risk factor for a variety of negative health outcomes is widely recognized. Stress induces endocrine and immune system responses that help coping with the change in demand (McEwen, 1998) and stressors exert these influences by regulation of genes. Findings from previous gene expression studies in animal models show changes due to acute stress exposure cannot be readily translated to the human paradigm (Fujikawa et al., 2000, Liberzon et al., 1999). It has been suggested that peripheral blood mononuclear cell (PBMC) gene expression may provide an indicator of gene activation changes as a response to stress in humans (Segman et al., 2005), as lymphocytes have been shown to be perturbed following acute psychological stress (Aloe et al., 1994), probably mediated through endocrine and immune markers that are activated by the stressor. Only very few studies have investigated gene expression alterations due to stress in humans. Studies examining genome-wide transcriptional activity in PBMCs have been reported. One examined chronic isolation and showed it was associated with specific signaling pathways involved in immune regulation and biological stress responses (Cole et al., 2007). A more recent study associated chronic care-giving stress with alterations in glucocorticoid signal transduction as reflected by altered gene expression compared to a control group (Miller et al., 2008). Microarrays, which allow high-throughput profiling of transcriptional activity, are powerful tools that detect signatures of biological processes that underlie adaptive and maladaptive responses to a challenge of the system. Measurement of expression of multiple genes or even genome-wide transcriptional activity patterns is warranted. Previous studies have not attempted to study gene expression alterations using more than one single measurement time point. However, considering the complex chronology of biological processes that occur due to exposure to an acute stressor, repeated measurement of gene expression is crucial. In the current pilot study, we attempted to repeatedly measure gene expression patterns using a genome-wide approach allowing us to examine biological pathways changes that follow an acute psychosocial laboratory stressor in adult healthy men. As this is a “proof of concept” approach that will drive future research endeavors using a repeated measurement approach, no hypotheses about alterations in specific pathways were formulated. Therefore, the following analyses should be regarded as explorative in nature and will hopefully inform future decisions on formulating specific hypotheses. However, we expected to find changes in processes that are relevant for the biological response to stress. In particular, psychological stress is known to activate the hypothalamic–pituitary–adrenal (HPA) axis (Charmandari et al., 2005). The HPA axis plays a fundamental role in regulating other homeostatic systems, including the sympathetic nervous system and the immune system. Cortisol exerts inhibitory effects on the secretion of pro-inflammatory cytokines, including interleukin (IL)-6, and helps return these cytokines to baseline levels after stress. Increased sympathetic responses may mediate increased immune responses especially during stress. Thus, we expected changes in gene expression profiles that were closely related to changes in these biological stress systems.
2. Methods
2.1. Participants and conditions
This study was approved by the Institutional Review Boards of Emory University School of Medicine and the Centers for Disease Control and Prevention (CDC). All subjects were recruited via newspaper advertisement. Only male participants were included in the study. Exclusionary criteria were significant medical illness, past or current presence of psychotic symptoms or bipolar disorder, current presence of psychoactive substance abuse/dependency or eating disorders, as well as hormonal and psychotropic medication in the 4 weeks prior to study entry. Written informed consent was obtained prior to study entry and subjects were admitted as inpatients to the Emory University General Clinical Research Center. This study was conducted as part of a larger study.
2.2. Psychosocial stress procedure
A standardized and validated psychosocial stress test, the Trier Social Stress Test (TSST) (Kirschbaum et al., 1993), was performed between 15:00 h and 16:00 h. The test consists of a 10-min anticipation and preparation phase and a subsequent 10-min public speaking and mental arithmetic task in front of three individuals.
2.3. Assessments during the stress procedure
2.3.1. Psychometric measures
We measured positive and negative affect before and after TSST using the Positive and Negative Affect Scale (PANAS) (Crawford and Henry, 2004), which comprises 20 items describing emotions experienced at the present moment.
2.3.2. Biological measures
At 12:00 h, an intravenous (IV) catheter was inserted and subjects were not allowed to intake anything per oral except for water until 17:00 h. Blood was sampled in ethylenediaminetetraacetic acid (EDTA) tubes through the IV before (−15 and 0 min), during (15 min) and after the stress exposure (30, 45, 60, 75, and 90 min) for assessment of plasma adrenocorticotropin (ACTH), cortisol, norepinephrine/epinephrine, and interleukin (IL)-6 concentrations. ACTH and cortisol concentrations were measured using commercial radioimmunoassays (ACTH: Nichols Institute, San Juan Capistrano, CA; cortisol: DiaSorin Corporation, Stillwater, MN). Inter- and intra-assay coefficients of variation were less than 6% for ACTH and less than 4% for cortisol. Catecholamines were measured by reverse-phase, ion pair high performance liquid chromatography. For norepinephrine, mean intra-assay coefficient of variation was 7.1% (>800 pg/ml) and mean inter-assay coefficient of variation was 10.3% (300–550 pg/ml). For epinephrine, mean intra-assay coefficient of variation was 9.6% (>80 pg/ml) and mean inter-assay coefficient of variation was 16.3% (60–140 pg/ml). Plasma IL-6 concentrations were measured by enzyme-linked immunosorbent assay (R&D Systems, Minneapolis, MN).
2.3.3. Gene expression profiling
Whole blood was drawn (at 0, 30, and 60 min) into an 8 ml BD Vacutainer Cell Preparation Tube with sodium citrate (Becton Dickinson, NJ), and immediately processed according to manufacturer's instructions. Total ribonucleic acid (RNA) was isolated using TRIzol™ reagent (Invitrogen, CA) and RNA quality and quantity was assessed using the Agilent 2100 Bioanalyzer, all RNA used had RIN >8.5. Contaminating deoxyribonucleic acid (DNA) was removed by incubation with 1 U DNaseI (GeneHunter Corp., TN) at 37 °C for 15 min. RNA was labeled and arrays processed as previously described (Ojaniemi et al., 2003, Whistler et al., 2003). Hybridization was onto a 20K array (MWG Biotech, Germany, now Ocimum Biosolutions). A median background value was calculated around each of the features and subtracted from the mean feature signal to give the net signal for the respective gene. The data was quantile normalized and log2 transformed. Features showing minimal variation across the set of arrays were excluded from the analysis, those whose expression differed by at least 1.5-fold from the median in at least 50% of the arrays were retained, giving 7247 genes for further analysis.
2.4. Statistical analyses
2.4.1. Gene set expression comparison (GSEC) analysis
The GSEC tool (Xu et al., 2008) in BRB-ArrayTools (v3.7; http://linus.nci.nih.gov/BRB-ArrayTools.html) analyzes pre-defined gene sets for differential expression among pre-defined classes (Pavlidis et al., 2004). Gene sets for this analysis were derived from 593 BioCarta (http://www.biocarta.com), or 181 Kyoto Encyclopedia of Genes and Genomes (KEGG) pathways (http://www.genome.jp/kegg/pathway.html) and 65 experimentally verified transcription factor targets. We identified pathways whose expression was differentially regulated among the classes. By analyzing gene sets, rather than individual genes, we were able to reduce the number of tests conducted, and allow findings among biologically related genes to reinforce each other. This analysis is different than annotating a gene list using gene ontology (GO) categories. For each gene set we computed the number of genes represented on the microarray in that group, and calculated the statistical significance for each gene by a univariate analysis using a paired t-test with a random variance model (Wright and Kirby, 2003). Then, for each gene set two p-value summary statistics (the Fisher (LS) and the Kolmogorov–Smirnov (KS) statistics (Simon and Lam, 2004) and the Efron–Tishirani's maxmean test statistic (Efron and Tishirani, 2007) were calculated. The significance level associated with the gene set is the proportion of the random samples giving as large a value of the summary statistic as in the actual genes of the specified gene set. We considered a gene set to be significantly differentially regulated if one of the tests was <0.05.
2.4.2. Transcription factor analysis
In an attempt to determine the over-representation of transcription factor binding sites (TFBS) within the set of co-expressed genes from the GSEC pathway analysis, as compared with a background set of genes, the Opossum system was used for enrichment analysis (Ho Sui et al., 2005, Huang et al., 2005). The analysis parameters looked at promoters 2000 nucleotides upstream of each gene's transcription start site, using a conservation level of top 10 percentile of non-coding conserved regions with an absolute minimum percent identity of 70%. Two measures of statistical over-representation were measured, a Z-score and a one-tailed Fisher exact probability.
2.4.3. Peripheral markers analysis
The Friedman test was used to compare observations repeated on the same subjects.
2.5. Microarray validation
2.5.1. Quantitative real-time polymerase chain reaction (qPCR)
Validation of the microarray gene expression findings was performed using qPCR on four genes that showed different expression patterns between the three time points for all donors. The candidate genes for validation are given in Table 1 .
Table 1.
Hydrolysis primer and probe sets used for the validation of gene expression data. The probes were labeled with the HEX fluorophore 5′, and the non-fluorescent Black Hole Quencher 3′.
| Gene symbol | Forward primer sequence (5′–3′) | Reverse primer sequence (5′–3′) | Probe sequence (5′–3′) | Amplicon length (bp) | PCR efficiencya |
|---|---|---|---|---|---|
| GAPDH | AACCTGCCAAATATGATGACATCA | GCCCAGGATGCCCTTGA | AGCAGGCGTCGGAGGGCCC | 67 | 1.88 |
| PGK1 | CAAGAAGTATGCTGAGGCTGTCA | CAAATACCCCCACAGGACCAT | TCGGGCTAAGCAGATTGTGTGG | 68 | 1.93 |
| PKC | TGACAAACCCCCGTTCTTGA | GTTGACATATTCCATGACGAAGTACA | ACTCCTGCTTCCAGACAGTGGATCGG | 82 | 1.80 |
| CASP8 | CCTGGGTGCGTCCACTTT | CAAGGTTCAAGTGACCAACTCAAG | TGGGCACGTGAGGTTGGGCC | 78 | 1.96 |
| ALDH3A2 | GCAGCGATTTGACCACATTTTC | TAACATGGACTTTTCCCTCCCA | CGGTTGGCAAAATTGTCATGGAAGCT | 120 | 1.88 |
| IL6R | GTACCACTGCCCACATTCCT | CAGCTTCCACGTCTTCTTGA | CCTGGCCTTCGGAACGCTCCTC | 71 | 1.99 |
The maximum efficiency for a PCR reaction = 2.
Endogenous control genes were selected on the basis of the microarray gene expression data from all time points. Ten genes were selected that showed low coefficients of variation, and genes with different functions were chosen to avoid genes belonging to the same biological pathways that might be co-regulated. GeNorm was used to select the most stable pair-wise combination of reference genes: phosphoglycerate kinase 1 (PGK1) and glyceraldehyde-3-phosphate dehydrogenase (GAPDH) (Table 1). The slope of a five-step fivefold dilution standard curve (100 μg–10 pg) for each primer set was used to determine their PCR amplification efficiency (10−1/slope). The template cDNA was pooled total RNA extracted from PBMC of several donors.
One microgram of DNAse digested RNA was reverse transcribed into cDNA using random hexamers and the Transcriptor Reverse Transcriptase kit (Roche Applied Sciences, Indianapolis, IN) according to the manufacturer's instructions. Quantitative real-time PCR was performed using the LightCycler® 480 system and the Probes Master Mix kit (Roche) in 96 well plates according to the manufacturer's instructions. The primers and probes used are outlined in Table 1. All samples including the external standards and non-template control were run in duplicate. The cycling conditions consisted of one cycle at 95 °C for 5 min followed by 45 cycles of 95 °C × 15 s, 60 °C × 15 s and 72 °C × 45 s. The Lightcycler 480 software was used to extract crossing points. The data was normalized to GAPDH and PGK1 using the geometric means of the reference genes.
3. Results
Demographic characteristics of the participants are summarized in Table 2 . Positive affect did not change before and after stress. However, negative affect increased significantly from pre- to post-stress.
Table 2.
Demographic features and psychological measures during psychosocial stress test.
| n = 10 | |
|---|---|
| Mean age in years (range) | 32.4 (20–54) |
| Mean BMI (range) | 25.8 (21.3–33.4) |
| Race (%) | |
| Caucasian | 5 (50) |
| African-American | 5 (50) |
| PANAS-positive | |
| Pre-stress (95% CI) | 18.8 (12.5–25.0) |
| Post-stress (95% CI) | 16.8 (9.5–24.0) |
| PANAS-negative | |
| Pre-stress (95% CI) | 3.2 (−0.8 to 7.2) |
| Post-stress (95% CI) | 10.8* (5.9–15.6) |
BMI = body mass index; PANAS = Positive Affect Negative Affect Scale.
p < 0.01.
Analysis of repeated measures of peripheral markers revealed significant differences between time points for ACTH (χ 2(7) = 24.8; p = 0.001), cortisol (χ 2(7) = 34.5; p < 0.001), norepinephrine (χ 2(7) = 47.7; p < 0.001), and epinephrine (χ 2(7) = 41.0; p < 0.001) (Fig. 1A–D). Plasma IL-6 (χ 2(7) = 38.2; p < 0.001) and log2 normalized signal intensity for IL-6 extracted from gene expression data are presented in Fig. 2 .
Fig. 1.

Biological measures during psychosocial stress test. Plasma ACTH (A), plasma cortisol (B), plasma norepinephrine (C), and plasma epinephrine (D) changed significantly over time. Red arrows indicate when blood sample was analyzed for PBMC gene expression. (For interpretation of the references to color in this figure legend, the reader is referred to the web version of the article.)
Fig. 2.
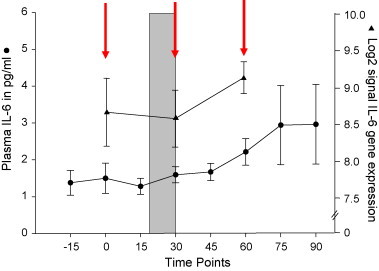
Plasma IL-6 and log2 normalized signal intensity for IL-6 extracted from gene expression data. Similar profiles for the two measures add validity to the gene expression data. Red arrows indicate when blood sample was analyzed for PBMC gene expression. (For interpretation of the references to color in this figure legend, the reader is referred to the web version of the article.)
Comparison between baseline (0 min) and stress samples (30 min) revealed a total of 49 pathways that significantly changed (p < 0.05) (Table 3 ). When comparing stress (30 min) and recovery samples (60 min), 36 pathways were significantly changed (Table 4 ). The parametric p-values and the geometric means for all genes identified in the pathways of Table 3, Table 4 can be found in Supplementary file 1. Eight pathways were identified as common to each of these analyses (bold highlight, Table 3, Table 4) involving 210 unique genes. This represents 36 and 45% of the unique genes common to these eight pathways. We are able to dissect out the gene expression changes in each of the pathways (Supplementary file 2). The Janus kinase-signal (JAK/STAT) signaling pathway is central to the stress response and looking at the expression changes between baseline and stressor (0 and 30 min) we find 42/56 genes are showing ≥2-fold increase in expression. Then 31/42 of these genes are down-regulated (≥2-fold change) during the recovery (30–60 min). A further 11 genes in this pathway, unchanged from baseline to stress, are also down-regulated during the recovery. Similar analytical dissection of the gene regulation for the remaining seven common pathways is given in Supplementary file 2.
Table 3.
Results of the paired class comparison analysis between baseline and stress time points using BioCarta and KEGG pathways as defined gene sets. Pathways containing more than five genes present on the array were included in the analysis. This meant that 176 BioCarta and 146 KEGG pathways were considered. A univariate analysis using paired t-tests with a random variance model was run to determine the differentially expressed genes in each gene set. Significant gene sets were then identified with summary statistics (the LS/KS permutation test and Efron–Tishirani's maxmean test (Efron and Tishirani, 2007) using a threshold of 0.05 for at least one test. In the combined BioCarta/KEGG analysis 49 pathways passed this threshold. Pathways in highlighted in bold are common to both the baseline-stress and stress–recovery analyses. p-Values and Log ratios are presented in Supplementary file 1.
| Pathway ID | Pathway description | No. of genes | Biological function | |
|---|---|---|---|---|
| 1 | h_ucalpain | uCalpain and friends in Cell spread | 11 | Adhesion |
| 2 | h_agr | Agrin in postsynaptic differentiation | 19 | Adhesion, cell migration |
| 3 | h_ecm | Erk and PI-3 kinase are necessary for collagen binding in corneal epithelia | 10 | Adhesion, cell migration |
| 4 | h_rho | Rho cell motility signaling pathway | 13 | Adhesion, cell morphology |
| 5 | h_rac1 | Rac 1 cell motility signaling pathway | 10 | Adhesion, cell signaling |
| 6 | hsa05040 | Huntington's disease | 13 | Apoptosis |
| 7 | h_ras | Ras signaling pathway | 8 | Apoptosis |
| 8 | h_intrinsic | Intrinsic prothrombin activation pathway | 6 | Blood collection |
| 9 | hsa04110 | Cell cycle | 43 | Cell cycle |
| 10 | h_g1 | Cell cycle: G1/S check point | 9 | Cell cycle |
| 11 | h_skp2e2f | E2F1 destruction pathway | 5 | Cell cycle |
| 12 | h_RacCycD | Influence of Ras and Rho proteins on G1 to S Transition | 12 | Cell cycle |
| 13 | h_p27 | Regulation of p27 phosphorylation during cell cycle progression | 7 | Cell cycle progression |
| 14 | hsa04120 | Ubiquitin mediated proteolysis | 15 | Cell cycle, immune response |
| 15 | h_pml | Regulation of transcriptional activity by PML | 15 | Cell growth, apoptosis |
| 16 | h_At1r | Angiotensin II mediated activation of JNK Pathway via Pyk2 | 16 | Cell migration |
| 17 | h_mrp | Multi-drug resistance factors | 6 | Cell regulation |
| 18 | h_cardiacegf | Role of EGF receptor transactivation by GPCRs in cardiac hypertrophy | 6 | Cell regulation |
| 19 | hsa04540 | Gap junction | 35 | Cell signaling |
| 20 | h_gpcr | Signaling pathway from G-protein families | 10 | Cell signaling |
| 21 | h_erk | Erk1/Erk2 MAPK signaling pathway | 13 | Cell signaling, cell growth and differentiation |
| 22 | h_calcineurin | Effects of calcineurin in keratinocyte differentiation | 5 | Cell signaling: Ca++ |
| 23 | hsa04630 | JAK/STAT signaling pathway | 56 | Cell signaling: cytokines, growth factors, stress |
| 24 | hsa04310 | Wnt signaling pathway | 48 | Cell signaling: development, proliferation, mobility |
| 25 | h_pelp1 | Pelp1 modulation of estrogen receptor activity | 5 | Cell signaling: growth factor signaling |
| 26 | hsa04010 | MAPK signaling pathway | 114 | Cell signaling: growth, inflammation, apoptosis |
| 27 | h_fcer1 | Fc epsilon receptor I signaling in mast cells | 12 | Cell signaling: immunity, arachadonic acid metabolism |
| 28 | hsa04330 | Notch signaling pathway | 17 | Cell signaling: T-cell development |
| 29 | h_hes | Segmentation clock | 8 | Cell signaling: WNT and Notch |
| 30 | hsa00790 | Folate biosynthesis | 14 | Cofactor biosynthesis |
| 31 | h_ppara | Mechanism of gene regulation by peroxisome proliferators via PPARa | 20 | Gene regulation |
| 32 | h_sppa | Aspirin blocks signaling pathway involved in platelet activation | 6 | Hemostasis |
| 33 | hsa04650 | Natural killer cell mediated cytotoxicity | 64 | Immune response: NK cell |
| 34 | h_dc | Dendritic cells in regulating TH1 and TH2 development | 5 | Immune response: T-cell |
| 35 | h_tcr | T cell receptor signaling pathway | 14 | Immune response: T-cell |
| 36 | h_mef2d | Role of MEF2D in T-cell apoptosis | 5 | Immune response: T-cell; apoptosis |
| 37 | hsa04730 | Long-term depression | 32 | Learning and memory |
| 38 | hsa04720 | Long-term potentiation | 28 | Learning and memory |
| 39 | hsa00380 | Tryptophan metabolism | 41 | Metabolism: Amino acid |
| 40 | hsa00530 | Aminosugars metabolism | 6 | Metabolism: carbohydrate |
| 41 | hsa00053 | Ascorbate and aldarate metabolism | 9 | Metabolism: carbohydrate |
| 42 | hsa00190 | Oxidative phosphorylation | 43 | Metabolism: energy production |
| 43 | hsa00770 | Pantothenate and CoA biosynthesis | 8 | Metabolism: fatty acid |
| 44 | hsa00531 | Glycosaminoglycan degradation | 10 | Metabolism: glucosamine |
| 45 | hsa00534 | Heparan sulfate biosynthesis | 7 | Metabolism: glucosamine |
| 46 | hsa00604 | Glycosphingolipid biosynthesis - ganglioseries | 9 | Metabolism: glycolipid |
| 47 | hsa00960 | Alkaloid biosynthesis II | 16 | Metabolism: secondary metabolites |
| 48 | h_prc2 | PRC2 complex long-term gene silencing by modification of histone tails | 7 | Regulation gene expression |
| 49 | h_arap | ADP-ribosylation factor | 10 | Vesicular trafficking |
Table 4.
Results of the paired class comparison analysis between stress and recovery time points using BioCarta and KEGG pathways as defined gene sets. Pathways containing more than five genes present on the array were included in the analysis. This meant that 176 BioCarta and 146 KEGG pathways were considered. A univariate analysis using paired t-tests with a random variance model was run to determine the differentially expressed genes in each gene set. Significant gene sets were then identified with summary statistics (the LS/KS permutation test and Efron–Tishirani's maxmean test (Efron and Tishirani, 2007) using a threshold of 0.05 for at least one test. In the combined BioCarta/KEGG analysis 49 pathways passed this threshold. Pathways in highlighted in bold are common to both the baseline-stress and stress–recovery analyses. p-Values and Log ratios are presented in Appendix BSupplementary file 1.
| Pathway ID | Pathway description | No. of genes | Biological function | |
|---|---|---|---|---|
| 1 | hsa04810 | Regulation of actin cytoskeleton | 89 | Adhesion |
| 2 | hsa05040 | Huntington's disease | 13 | Apoptosis |
| 3 | h_p27 | Regulation of p27 phosphorylation during cell cycle progression | 7 | Cell cycle progression |
| 4 | h_skp2e2f | E2F1 destruction pathway | 5 | Cell cycle progression, TF |
| 5 | h_gsk3 | Inactivation of Gsk3 by AKT: accumulation of b-catenin in macrophages | 8 | Cell proliferation/differentiation |
| 6 | h_CCR3 | CCR3 signaling in eosinophils | 14 | Cell signaling |
| 7 | h_akt | AKT signaling pathway | 5 | Cell signaling: cell survival |
| 8 | hsa04630 | JAK/STAT signaling pathway | 56 | Cell signaling: cytokines, growth factors |
| 9 | hsa04010 | MAPK signaling pathway | 114 | Cell signaling: growth, inflammation, apoptosis |
| 10 | hsa04912 | GnRH signaling pathway | 38 | Cell signaling: HPG axis |
| 11 | hsa04620 | Toll-like receptor signaling pathway | 45 | Cell signaling: immunity |
| 12 | hsa04664 | Fc epsilon RI signaling pathway | 36 | Cell signaling: immunity, arachadonic acid metabolism |
| 13 | h_il1r | Signal transduction through IL1R | 15 | Immune response, cell signaling |
| 14 | h_tall1 | TACI and BCMA stimulation of B cell immune responses. | 7 | Immune response: B-cell |
| 15 | h_dc | Dendritic cells in regulating TH1 and TH2 development | 5 | Immune response: T-cell |
| 16 | hsa00460 | Cyanoamino acid metabolism | 5 | Metabolism: amino acid |
| 17 | hsa00340 | Histidine metabolism | 27 | Metabolism: amino acid |
| 18 | hsa00450 | Selenoamino acid metabolism | 12 | Metabolism: amino acid |
| 19 | hsa00220 | Urea cycle and metabolism of amino groups | 8 | Metabolism: amino acid |
| 20 | hsa00053 | Ascorbate and aldarate metabolism | 9 | Metabolism: carbohydrate |
| 21 | hsa00051 | Fructose and mannose metabolism | 17 | Metabolism: carbohydrate |
| 22 | hsa00010 | Glycolysis/gluconeogenesis | 18 | Metabolism: carbohydrate |
| 23 | hsa00030 | Pentose phosphate pathway | 6 | Metabolism: carbohydrate |
| 24 | hsa00190 | Oxidative phosphorylation | 43 | Metabolism: energy |
| 25 | hsa00591 | Linoleic acid metabolism | 17 | Metabolism: fatty acid |
| 26 | hsa00600 | Sphingolipid metabolism | 14 | Metabolism: fatty acid |
| 27 | h_eicosanoid | Eicosanoid metabolism | 5 | Metabolism: fatty acid. Stress response |
| 28 | hsa00940 | Stilbene, coumarine and lignin biosynthesis | 7 | Metabolism: xenobiotic |
| 29 | h_eponfkb | Erythropoietin mediated neuroprotection through NF-κB | 7 | NF-κB |
| 30 | h_hcmv | Human cytomegalovirus and Map kinase pathways | 8 | NF-κB |
| 31 | h_nthi | NF-κB activation by non-typeable hemophilus influenzae | 18 | NF-κB |
| 32 | h_arenrf2 | Oxidative stress induced gene expression via Nrf2 | 9 | Stress response |
| 33 | hsa03020 | RNA polymerase | 10 | Transcription |
| 34 | h_eif4 | Regulation of eIF4e and p70 S6 kinase | 14 | Translation regulation |
| 35 | hsa04130 | SNARE interactions in vesicular transport | 13 | Vesicular trafficking |
| 36 | h_SARS | SARS coronavirus protease | 8 | Glycolysis |
The transcription factors that regulate the genes in the pathways that were found to be differentially expressed were examined by over-representation analysis (Table 5, Table 6 ).
Table 5.
Statistically over-represented TFBS in genes associated with the GSEC baseline and stress analysis as determined by Opossum. Results displayed where Z-score ≥5 and Fisher ≤0.01.
| Transcription factor | TF class | Information contenta | Target gene hits | Background TFBS rateb | Target TFBS rateb | Z-scorec | Fisher scored |
|---|---|---|---|---|---|---|---|
| MZF1_5-13 | Zn-Finger, C2H2 | 9.4 | 301 | 0.0222 | 0.0245 | 10.6 | 2.71E−07 |
| MZF1_1-4 | Zn-Finger, C2H2 | 8.6 | 377 | 0.0464 | 0.0494 | 10.3 | 2.20E−04 |
| SP1 | Zn-Finger, C2H2 | 9.7 | 290 | 0.02 | 0.022 | 9.9 | 6.78E−08 |
| TEAD1 | TEA | 15.7 | 100 | 0.0029 | 0.0037 | 9.9 | 2.07E−04 |
| RELA | REL | 14.8 | 141 | 0.0039 | 0.0048 | 9.2 | 2.39E−05 |
| GABPA | ETS | 13.9 | 157 | 0.0049 | 0.0057 | 8.3 | 8.50E−05 |
| REL | REL | 10.5 | 227 | 0.0089 | 0.01 | 8.1 | 4.86E−07 |
| CEBPA | bZIP | 9.2 | 210 | 0.0118 | 0.013 | 7.8 | 5.60E−04 |
| ELF5 | ETS | 8.7 | 353 | 0.0291 | 0.0307 | 6.6 | 4.05E−07 |
| Spz1 | bHLH-ZIP | 11.9 | 166 | 0.0049 | 0.0056 | 6.6 | 1.13E−08 |
| NR3C1 | Nuclear Receptor | 14.7 | 60 | 0.0023 | 0.0027 | 6.4 | 1.48E−03 |
| ELK1 | ETS | 8.8 | 315 | 0.0201 | 0.0213 | 6.1 | 2.56E−07 |
| HLF | bZIP | 11.1 | 124 | 0.0048 | 0.0054 | 5.9 | 6.55E−03 |
| Arnt-Ahr | bHLH | 9.5 | 319 | 0.0179 | 0.0189 | 5.7 | 6.97E−05 |
| GFI | Zn-Finger, C2H2 | 9.5 | 270 | 0.0169 | 0.0179 | 5.4 | 4.65E−05 |
| RORA_1 | Nuclear Receptor | 13.2 | 197 | 0.006 | 0.0065 | 5.0 | 1.61E−09 |
| NF-κB | REL | 13.3 | 180 | 0.0057 | 0.0062 | 5.0 | 5.24E−07 |
This is the specificity of the TFBS profile's position weight matrix.
The number of times this TFBS was detected within the conserved non-coding regions of the background or target set of genes.
The likelihood that the number of TFBS nucleotides detected for the included target genes is significant as compared with the number of TFBS nucleotides detected for the background set. Z-score is expressed in units of magnitude of the standard deviation.
The probability that the number of hits vs. non-hits for the included target genes could have occurred by random chance based on the hits vs. non-hits for the background set.
Table 6.
Statistically over-represented TFBS in genes associated with the GSEC stress and recovery analysis as determined by Opossum. Results displayed where Z-score ≥5 and Fisher ≤0.01.
| Transcription factor | TF class | ICa | Target gene hits | Background TFBS rateb | Target TFBS rateb | Z-scorec | Fisher scored |
|---|---|---|---|---|---|---|---|
| REST | Zn-Finger, C2H2 | 22.958 | 10 | 0.0002 | 0.0006 | 17.8 | 1.72E−03 |
| NR3C1 | Nuclear Receptor | 14.749 | 49 | 0.0023 | 0.0031 | 9.9 | 2.77E−03 |
| RELA | REL | 14.757 | 105 | 0.0039 | 0.0047 | 7.1 | 3.93E−03 |
| NF-κB | REL | 13.345 | 142 | 0.0057 | 0.0065 | 6.2 | 2.39E−05 |
| Spz1 | bHLH-ZIP | 11.907 | 127 | 0.0049 | 0.0056 | 5.8 | 9.30E−06 |
| SRF | MADS | 17.965 | 17 | 0.0005 | 0.0007 | 5.6 | 4.41E−02 |
| ELF5 | ETS | 8.693 | 280 | 0.0291 | 0.0305 | 5.2 | 4.47E−05 |
This is the specificity of the TFBS profile's position weight matrix.
The number of times this TFBS was detected within the conserved non-coding regions of the background or target set of genes.
The likelihood that the number of TFBS nucleotides detected for the included target genes is significant as compared with the number of TFBS nucleotides detected for the background set. Z-score is expressed in units of magnitude of the standard deviation.
The probability that the number of hits vs. non-hits for the included target genes could have occurred by random chance based on the hits vs. non-hits for the background set.
The limited amount of RNA on several subjects allowed for validation of four genes by qPCR (Fig. 3 ). Overall there was very good agreement of the qPCR data with the mRNA generated microarray data, in that the trends of differential expression were maintained in both.
Fig. 3.

Comparison of microarray gene expression (left) and qPCR data (right) for selected genes. Bar chart represents averaged signal ± SD.
4. Discussion
Acute stressors trigger adaptive up-regulation of natural immunity, redistribution of cells (Goebel and Mills, 2000), and preparation of the natural immune system (Miller et al., 2005). In our analysis these effects from psychosocial stress are reflected in changes in acute inflammatory response pathways (see Table 3, 33–36), and pathways regulating adhesion molecules (Table 3, 1–5). The effects of the leukocytosis are more apparent in the baseline-stress analysis than the stress–recovery time period, as a greater number of pathways are associated with cell migration and adhesion in the former compared to the latter. In addition, stress response pathways associated with nuclear factor kappa B (NF-κB) appear to be associated with the stress–recovery period (Table 4, 29–32). A variety of pathways were significantly changed between baseline and stress, involving basic cell regulatory and signaling processes, many involving cell growth, differentiation and proliferation (Table 3, 17–29). Also, it was noted that ras-related C3 botulinum toxin substrate 1 (RAC1) was central to the functioning of several pathways in the baseline–stress analysis (Table 3, 1, 2 and 16). This protein is a pleiotropic regulator of many cellular processes, including the cell cycle, cell–cell adhesion, and motility (through the actin network). Thus, all these pathways are implicated in the adhesion and diapedesis of immune cells from the lymphatic system to the blood stream. A shortfall in this pilot study was that we did not monitor the cell subsets during the course of the time series, which is essential for larger scale studies, so we can account for the differences in the gene expression profiles being driven by the changes in T cell, B cell and natural killer cell populations.
Acute stressors trigger suppression of specific immunity (Segerstrom and Miller, 2004). The role of psychological stress in the regulation of lymphocyte adhesion molecules has been well examined (Mills et al., 1998, Redwine et al., 2003). These mechanisms are also reflected by changes in the pathway implicated in adhesion (Table 3, 1–5). More specifically, stress induces changes in effector T cell distribution, as can be seen by changes in the pathways involved in T helper cell mobilization (Table 3, 28 and 34–35).
Apoptosis plays an important role in the organism's response to acute stress. While lymphocytes expand and proliferate in response to acute stress, apoptosis has to be inhibited in the early phase of the stress response. In the later stages, though, apoptosis must occur to reduce the number of accumulated cells and to restore homeostasis. Our findings show that during stress gene products involved in apoptotic processes are altered upon exposition of the organism to acute stress (Table 3, 6–7, 15 and 23).
Several pathways involved in the immediate stress response were common across stress and recovery, indicating common mechanisms underlying the processes that allow the body to mount an adequate response and recover from a stressor to regain homeostasis. Two of the pathways, involved in metabolic processes (Oxidative Phosphorylation and Ascorbate metabolism, a total of 52 genes) all showed up-regulation of gene expression between baseline-stress, followed by down-regulation during recovery, as did the vast majority of genes in the JAK/STAT signaling pathway. The immediate physiological consequences of the stress response are evident in the analyses seen here, i.e. immune activation and energy mobilization. However, genes in the three pathways associated with the cell cycle, cell differentiation, etc., showed mixed regulation of the genes, and genes that were up- (or down-) regulated in the baseline-stress analysis were still up-regulated in the stress–recovery analysis (Supplementary file 2). Some of this reflects the biological changes occurring in the lymphocyte populations with respect to cell differentiation, activation and survival, as the proportion and numbers of circulating cells changes, as is well documented during stressors (Segerstrom and Miller, 2004, Zorrilla et al., 1995).
There are five transcription factors that are common to the genes in both GSEC pathway analyses (Table 5, Table 6). These are NF-κB, V-rel reticuloendotheliosis viral oncogene homolog A, nuclear factor of kappa light polypeptide gene enhancer in B-cells 3, p65 (avian) (RELA), nuclear receptor subfamily 3, group C, member 1 (NR3C1 or glucocorticoid receptor), spermatogenic leucine zipper 1 (SPZ1), and E74-like factor 5 (ELF5). The first two interact with each other to form the NF-κB transcription complex. This complex is involved in cellular responses to stimuli such as stress and plays a key role in regulating the immune response (Avitsur et al., 2003, Bhatara et al., 1998). In fact, it has recently been identified as a potential critical bridge between stress and cellular activation (Bierhaus et al., 2003, Rosecrans and Karin, 1998). Another common transcription factor regulating the differentially expressed genes in the common pathways was NR3C1, a transcription factor that binds to glucocorticoid response elements (GRE) and is a modulator of other transcription factors. It affects inflammatory responses, cellular proliferation and differentiation. SPZ1 is involved in regulating genes involved in cell growth and differentiation, while ELF5 is an ETS-domain transcription factor, which regulate a diverse range of biological functions including mammalian hematopoiesis (Sharrocks et al., 1997).
Cortisol activation of the glucocorticoid receptor (GR) exerts broad anti-inflammatory effects by inhibiting NF-κB/Rel transcription factors and other pro-inflammatory signaling pathways such as the JAK/STAT signaling pathway (Collado-Hidalgo et al., 2006, Rhen and Cidlowski, 2005). Exploring the JAK/STAT signaling pathway in the baseline-stress GSEC analysis (Supplementary file 3) we see 19 genes are identified with the NF-κB/RELA TFBS combination and eight genes are up-regulated ≥2-fold between baseline and stress, while only three of these genes are down-regulated. Three of five genes with NR3C1 (GR) promoter sequences in the JAK/STAT pathway are down-regulated (Supplementary file 3). We find that the cortisol effects are evident in the gene expression patterns during the time series analysis. This indicates by using state-of-the-art methodologies we can explore the biological changes of psychological stressors.
When blood is collected, the intrinsic pathway is activated by contact with the collection devices causing damage to the platelets and activation of factor XII (Schaffer et al., 2008). This pathway was identified as having differentially expressed genes in the baseline-stress analysis (Table 3).
Several limitations of the current study need to be addressed. The small sample size limits generalization to a broader population. Also, not all genes measured in the microarrays were annotated and genes that might be critical for the stress response might thus have been omitted from our analysis. Related to this issue, only a fraction of the annotated genes are summarized in a pathway. To some extent, we were able to address some of these limitations by analyzing gene sets, rather than individual genes, thus we were able to reduce the number of tests conducted, and allow findings among biologically related genes to reinforce each other. This functional class scoring is a more powerful method of identifying differentially expressed gene classes than the commonly used over-representation analysis, or annotation of gene lists based on individually analyzed genes (Simon and Lam, 2004). It indicates which gene sets contain more differentially expressed genes than would be expected by chance. Further, we were able to measure gene expression patterns at three time points (immediately before and after, as well as 30 min after an acute stressor) in our current study. It would have certainly been of great interest to have further measures beyond that time frame. Longer lasting changes in the endocrine, immune, and sympathetic nervous system could not be captured in our study. Clearly, future studies need to incorporate more measurement time points in order to be able to capture the complex biological processes that occur following an acute stressor. Also, increasing both sample size and sampling time points will allow us to more closely describe cellular events in a chronological order as they occur before, during, and after a stressor. Finally, we chose to use a within-subject measurement approach. This allowed us to examine changes of biological pathways after exposure to an acute stressor. However, further studies that will expand our current efforts will benefit from including a control condition in which no stress intervention occurred. This will allow discerning baseline and stress-related processes.
In conclusion, we were able to show even in a small sample of healthy volunteers that effects of acute psychological stress are reflected in genome-wide transcriptional activity changes in peripheral blood. Specific pathways may be changed in specific disorders in response to psychosocial stress. Our pilot study needs to be replicated and future studies will expand our current findings by including more subjects. The stress-related changes that we were able to describe are most likely adaptive responses to a moderate stressor. It might be of great interest to use this approach in clinical samples. Identification of gene expression patterns relevant for psychiatric and somatic disorders that are related to stress has the potential to identify novel targets for the prevention and treatment of adverse outcomes of stress.
Conflicts of interest
Drs. Nater, Whistler, Vernon, and Ms. Mletzko and Mr Lonergan reported no biomedical financial interests or potential conflicts of interest. Dr. Heim reports having received funding from NIMH, CDC, NARSAD, ADAA, Eli Lilly, and Novartis.
Acknowledgments
This study was supported by a 2002 NARSAD Young Investigator Award (CH) and a PHS grant, NCRR M01-RR00039 (Emory University Hospital General Clinical Research Center). This research was supported in part by an appointment to the Research Participation Program at the Centers for Disease Control and Prevention administered by the Oak Ridge Institute for Science and Education through an interagency agreement between the U.S. Department of Energy and CDC (UMN). The funding sources did not have any role in study design; in the collection, analysis and interpretation of data; in the writing of the report; and in the decision to submit the paper for publication.
Footnotes
The findings and conclusions in this report are those of the authors and do not necessarily represent the views of the funding agency.
Supplementary data associated with this article can be found, in the online version, at doi:10.1016/j.biopsycho.2009.06.009.
Appendix A. Supplementary data
Pathways identified in time series paired analysis as being differentially expressed from both the KEGG and BioCarta databases. Data includes filtered gene set associated with pathway, parametric p-value of each gene and geometric mean (or fold change). Gene symbols used in these tables are those designated by the HUGO Gene Nomenclature Committee (HGNC). More information on each can be obtained by searching their website: http://www.genenames.org/.
Eight pathways identified as common to BS and SR GSEC analysis giving geometric mean intensity values (or fold change information) for each of the genes associated with these pathways. Gene symbols used in these tables are those designated by the HUGO Gene Nomenclature Committee (HGNC). More information on each can be obtained by searching their website: http://www.genenames.org/.
Genes identified in the BS and SR GSEC analyses that are regulated by NF-κB/RELA or Glucocorticoid receptor (NR3C1) transcription factors giving geometric mean intensity values (or fold change information) for each of the genes associated with each transcription factor binding site. Gene symbols used in these tables are those designated by the HUGO Gene Nomenclature Committee (HGNC). More information on each can be obtained by searching their website: http://www.genenames.org/.
References
- Aloe L., Bracci-Laudiero L., Alleva E., Lambiase A., Micera A., Tirassa P. Emotional stress induced by parachute jumping enhances blood nerve growth factor levels and the distribution of nerve growth factor receptors in lymphocytes. Proceedings of the National Academy of Science of the United States of America. 1994;91(22):10440–10444. doi: 10.1073/pnas.91.22.10440. [DOI] [PMC free article] [PubMed] [Google Scholar]
- Avitsur R., Padgett D.A., Dhabhar F.S., Stark J.L., Kramer K.A., Engler H. Expression of glucocorticoid resistance following social stress requires a second signal. Journal of Leukocyte Biology. 2003;74(4):507–513. doi: 10.1189/jlb.0303090. [DOI] [PubMed] [Google Scholar]
- Bhatara V.S., Tripathi R.P., Sankar R., Gupta A., Khushu S. Frontal lobe proton magnetic-resonance spectroscopy in Graves’ disease: a pilot study. Psychoneuroendocrinology. 1998;23(6):605–612. doi: 10.1016/s0306-4530(98)00028-6. [DOI] [PubMed] [Google Scholar]
- Bierhaus A., Wolf J., Andrassy M., Rohleder N., Humpert P.M., Petrov D. A mechanism converting psychosocial stress into mononuclear cell activation. Proceedings of the National Academy of Science of the United States of America. 2003;100(4):1920–1925. doi: 10.1073/pnas.0438019100. [DOI] [PMC free article] [PubMed] [Google Scholar]
- Charmandari E., Tsigos C., Chrousos G. Endocrinology of the stress response. Annual Review of Physiology. 2005;67:259–284. doi: 10.1146/annurev.physiol.67.040403.120816. [DOI] [PubMed] [Google Scholar]
- Cole S.W., Hawkley L.C., Arevalo J.M., Sung C.Y., Rose R.M., Cacioppo J.T. Social regulation of gene expression in human leukocytes. Genome Biology. 2007;8(9):R189. doi: 10.1186/gb-2007-8-9-r189. [DOI] [PMC free article] [PubMed] [Google Scholar]
- Collado-Hidalgo A., Sung C., Cole S. Adrenergic inhibition of innate anti-viral response: PKA blockade of Type I interferon gene transcription mediates catecholamine support for HIV-1 replication. Brain, Behavior, and Immunity. 2006;20(6):552–563. doi: 10.1016/j.bbi.2006.01.005. [DOI] [PubMed] [Google Scholar]
- Crawford J.R., Henry J.D. The positive and negative affect schedule (PANAS): construct validity, measurement properties and normative data in a large non-clinical sample. The British Journal of Clinical Psychology. 2004;43(Pt 3):245–265. doi: 10.1348/0144665031752934. [DOI] [PubMed] [Google Scholar]
- Efron B., Tishirani R. On testing the significance of sets of genes. Annals of Applied Statistics. 2007;1(1):107–129. [Google Scholar]
- Fujikawa T., Soya H., Fukuoka H., Alam K.S., Yoshizato H., McEwen B.S. A biphasic regulation of receptor mRNA expressions for growth hormone, glucocorticoid and mineralocorticoid in the rat dentate gyrus during acute stress. Brain Research. 2000;874(2):186–193. doi: 10.1016/s0006-8993(00)02576-2. [DOI] [PubMed] [Google Scholar]
- Goebel M.U., Mills P.J. Acute psychological stress and exercise and changes in peripheral leukocyte adhesion molecule expression and density. Psychosomatic Medicine. 2000;62(5):664–670. doi: 10.1097/00006842-200009000-00010. [DOI] [PubMed] [Google Scholar]
- Ho Sui S.J., Mortimer J.R., Arenillas D.J., Brumm J., Walsh C.J., Kennedy B.P. oPOSSUM: identification of over-represented transcription factor binding sites in co-expressed genes. Nucleic Acids Research. 2005;33(10):3154–3164. doi: 10.1093/nar/gki624. [DOI] [PMC free article] [PubMed] [Google Scholar]
- Huang S., Fulton D., Arenillas D.J., Perco P., Ho Sui S.J., Mortimer J.R. vol. 3. Imperial College Press; London: 2005. Identification of over-represented combinations of transcription factor binding sites in sets of co-expressed genes. (Advances in Bioinformatics and Computational Biology). pp. 247–256. [Google Scholar]
- Kirschbaum C., Pirke K.M., Hellhammer D.H. The ‘Trier Social Stress Test’—a tool for investigating psychobiological stress responses in a laboratory setting. Neuropsychobiology. 1993;28(1–2):76–81. doi: 10.1159/000119004. [DOI] [PubMed] [Google Scholar]
- Liberzon I., Lopez J.F., Flagel S.B., Vazquez D.M., Young E.A. Differential regulation of hippocampal glucocorticoid receptors mRNA and fast feedback: relevance to post-traumatic stress disorder. Journal of Neuroendocrinology. 1999;11(1):11–17. doi: 10.1046/j.1365-2826.1999.00288.x. [DOI] [PubMed] [Google Scholar]
- McEwen B.S. Protective and damaging effects of stress mediators. The New England Journal of Medicine. 1998;338(3):171–179. doi: 10.1056/NEJM199801153380307. [DOI] [PubMed] [Google Scholar]
- Miller G.E., Chen E., Sze J., Marin T., Arevalo J.M., Doll R., Ma R., Cole S.W. A functional genomic fingerprint of chronic stress in humans: blunted glucocorticoid and increased NF-kappaB signaling. Biol Psychiatry. 2008;64:266–272. doi: 10.1016/j.biopsych.2008.03.017. [DOI] [PMC free article] [PubMed] [Google Scholar]
- Miller G.E., Rohleder N., Stetler C., Kirschbaum C. Clinical depression and regulation of the inflammatory response during acute stress. Psychosomatic Medicine. 2005;67(5):679–687. doi: 10.1097/01.psy.0000174172.82428.ce. [DOI] [PubMed] [Google Scholar]
- Mills P.J., Ziegler M.G., Rehman J., Maisel A.S. Catecholamines, catecholamine receptors, cell adhesion molecules, and acute stressor-related changes in cellular immunity. Advances in Pharmacology. 1998;42:587–590. doi: 10.1016/s1054-3589(08)60819-4. [DOI] [PubMed] [Google Scholar]
- Ojaniemi H., Evengard B., Lee D.R., Unger E.R., Vernon S.D. Impact of RNA extraction from limited samples on microarray results. Biotechniques. 2003;35(5):968–973. doi: 10.2144/03355st04. [DOI] [PubMed] [Google Scholar]
- Pavlidis P., Qin J., Arango V., Mann J.J., Sibille E. Using the gene ontology for microarray data mining: a comparison of methods and application to age effects in human prefrontal cortex. Neurochemical Research. 2004;29(6):1213–1222. doi: 10.1023/b:nere.0000023608.29741.45. [DOI] [PubMed] [Google Scholar]
- Redwine L., Snow S., Mills P., Irwin M. Acute psychological stress: effects on chemotaxis and cellular adhesion molecule expression. Psychosomatic Medicine. 2003;65(4):598–603. doi: 10.1097/01.psy.0000079377.86193.a8. [DOI] [PubMed] [Google Scholar]
- Rhen T., Cidlowski J.A. Antiinflammatory action of glucocorticoids—new mechanisms for old drugs. The New England Journal of Medicine. 2005;353(16):1711–1723. doi: 10.1056/NEJMra050541. [DOI] [PubMed] [Google Scholar]
- Rosecrans J.A., Karin L.D. Effects of nicotine on the hypothalamic–pituitary-axis (HPA) and immune function: introduction to the Sixth Nicotine Round Table Satellite. American Society of Addiction Medicine Nicotine Dependence Meeting, November 15, 1997Psychoneuroendocrinology. 1998;23(2):95–102. doi: 10.1016/s0306-4530(97)00073-5. [DOI] [PubMed] [Google Scholar]
- Schaffer L., Burkhardt T., Muller-Vizentini D., Rauh M., Tomaske M., Mieth R.A. Cardiac autonomic balance in small-for-gestational-age neonates. American Journal of Physiology. Heart and Circulatory Physiology. 2008;294(2):H884–890. doi: 10.1152/ajpheart.00318.2007. [DOI] [PubMed] [Google Scholar]
- Segerstrom S.C., Miller G.E. Psychological stress and the human immune system: a meta-analytic study of 30 years of inquiry. Psychology Bulletin. 2004;130(4):601–630. doi: 10.1037/0033-2909.130.4.601. [DOI] [PMC free article] [PubMed] [Google Scholar]
- Segman R.H., Shefi N., Goltser-Dubner T., Friedman N., Kaminski N., Shalev A.Y. Peripheral blood mononuclear cell gene expression profiles identify emergent post-traumatic stress disorder among trauma survivors. Molecular Psychiatry. 2005;10(5):500–513. doi: 10.1038/sj.mp.4001636. 425. [DOI] [PubMed] [Google Scholar]
- Sharrocks A.D., Brown A.L., Ling Y., Yates P.R. The ETS-domain transcription factor family. The International Journal of Biochemistry & Cell Biology. 1997;29(12):1371–1387. doi: 10.1016/s1357-2725(97)00086-1. [DOI] [PubMed] [Google Scholar]
- Simon R., Lam A. Biometric Research Branch, National Cancer Institute; 2004. BRB-ArrayTools User Guide, Version 3.2. [Google Scholar]
- Whistler T., Unger E.R., Nisenbaum R., Vernon S.D. Integration of gene expression, clinical, and epidemiologic data to characterize Chronic Fatigue Syndrome. Journal of Translational Medicine. 2003;1(1):10. doi: 10.1186/1479-5876-1-10. [DOI] [PMC free article] [PubMed] [Google Scholar]
- Wright R.A., Kirby L.D. Cardiovascular correlates of challenge and threat appraisals: a critical examination of the biopsychosocial analysis. Personality and Social Psychology Review. 2003;7(3):216–233. doi: 10.1207/S15327957PSPR0703_02. [DOI] [PubMed] [Google Scholar]
- Xu X., Zhao Y., Simon R. Gene set expression comparison kit for BRB-ArrayTools. Bioinformatics. 2008;24(1):137–139. doi: 10.1093/bioinformatics/btm541. [DOI] [PubMed] [Google Scholar]
- Zorrilla E.P., DeRubeis R.J., Redei E. High self-esteem, hardiness and affective stability are associated with higher basal pituitary-adrenal hormone levels. Psychoneuroendocrinology. 1995;20(6):591–601. doi: 10.1016/0306-4530(95)00005-9. [DOI] [PubMed] [Google Scholar]
Associated Data
This section collects any data citations, data availability statements, or supplementary materials included in this article.
Supplementary Materials
Pathways identified in time series paired analysis as being differentially expressed from both the KEGG and BioCarta databases. Data includes filtered gene set associated with pathway, parametric p-value of each gene and geometric mean (or fold change). Gene symbols used in these tables are those designated by the HUGO Gene Nomenclature Committee (HGNC). More information on each can be obtained by searching their website: http://www.genenames.org/.
Eight pathways identified as common to BS and SR GSEC analysis giving geometric mean intensity values (or fold change information) for each of the genes associated with these pathways. Gene symbols used in these tables are those designated by the HUGO Gene Nomenclature Committee (HGNC). More information on each can be obtained by searching their website: http://www.genenames.org/.
Genes identified in the BS and SR GSEC analyses that are regulated by NF-κB/RELA or Glucocorticoid receptor (NR3C1) transcription factors giving geometric mean intensity values (or fold change information) for each of the genes associated with each transcription factor binding site. Gene symbols used in these tables are those designated by the HUGO Gene Nomenclature Committee (HGNC). More information on each can be obtained by searching their website: http://www.genenames.org/.