

Abstract
During the 1990s, Chinese state-owned enterprises (SOEs) and collective enterprises continually decreased coverage of public health insurance to their employees. This paper investigates this changing pattern of health insurance coverage in China using panel data from the China Nutrition and Health Survey (1991–2000). It is the first attempt in this literature that tries to identify precisely the effects of specific policies and reforms on health insurance coverage in the transitional period of China. The fixed effects linear model clustering at the province level is used for estimation, and results are compared to alternative models, including pooled OLS, random effects GLS model and fixed effects logit model. Strong empirical evidence is found that unemployment as a side effect of the Open Door Policy, and the deregulation of SOE and collective enterprises were the main causes for the decreasing trend. For example, urban areas that were highly affected by the Open Door Policy were associated with 17 percentage points decrease in the insurance coverage. Moreover, I found evidence that the gaps between SOE and non-SOE employees, collective and non-collective employees, urban and rural employees have considerably decreased during the ten years.
Keywords: China, Health insurance, Economic reforms, Policy effects, Fixed effects and random effects
Introduction
China has achieved great economic success as a result of economic “reform and opening up” since 1978. The annual economic growth rate was among the highest of all countries during the 1990s; GDP per capita has been increasing dramatically. China's economy has taken rapid steps to open up its doors to investment from foreign countries and competition. In addition, the economic structure has undergone dramatic changes. State-owned Enterprises (SOEs) reformed from government-protected units to profit-maximizing enterprises. Deregulation has allowed collective enterprises (enterprises owned by local government: province, city, county, etc) to become either contract responsibility system1 or individual firms. Meanwhile, there was a big boom in private, foreign-funded and other source-funded enterprises.
A wealth of literature (Lardy, 1995, Li, 1997, Lin, 1992, Lin and Liu, 1995, Naughton, 1995, Woo, 1998, etc), has focused on how economic reform positively affected growth, trade, labor productivity and education during the 1980s and 1990s. However, relatively few studies emphasized that dramatic reform also affected employment and associated welfare benefits. Chen (2005) has noticed unemployment and social security sustainability problem after reforms. Chinese leader Deng Xiaoping directed the Chinese economy to build “socialism with Chinese characteristics”. This direction essentially allowed all enterprises to participate in a market economy while still keeping the ownership of the state. However, there was no clear statement as of how this goal would affect the welfare provision in China. As state firms faced fierce competition and financial troubles, were they still able to continue providing welfare benefits? Moreover, the urban and rural gap in the economic conditions has become larger. The report in the New York Times (Jan 14th, 2000) noted that “the collapse of socialized medicine and staggering cost increases [opened] a yawning gap between health care in the cities and the rural areas”, which had the consequences that “absence of adequate health care…spread infectious diseases like hepatitis and tuberculosis and making the country – and the world – more vulnerable to epidemics like severe acute respiratory syndrome, or SARS, and possibly bird flu.”
This paper looks at health insurance benefit as one of the most important components of welfare benefits. The purpose of this paper is fourfold: (1) to illustrate the changing pattern of health insurance in the transitional economy during 1990–2000; (2) to investigate the causes of declining coverage of public health insurance; (3) to examine the impact of recent economic restructuring on China's workers' health insurance coverage; and (4) to determine whether there is a rural and urban difference in insurance coverage.
Several studies (Akin et al., 2004, Giles et al., 2003, Hu et al., 1999) have linked insurance coverage with reforms, but due to data limitations and lack of reform information, none could identify the specific reform effects that were responsible. The contribution of this paper is to identify the policy and reform effects on health insurance coverage in the transitional period of China. In particular, this paper tries to disentangle the effects of the Open Door Policy, deregulation of collective enterprises, and SOE reforms on health insurance coverage. Panel survey data from the China Health and Nutrition Survey (CHNS) are used, and the period 1991–2000 that China experienced the largest transition is studied.
The outcome in this paper is whether or not an individual has health insurance in each of the years studied. The fixed effects linear model with clustering at the province level is applied and results are compared to alternative models, including pooled OLS, random effects GLS and fixed effects logit model.
Empirical evidence was found that unemployment as a side effect of the Open Door Policy and the deregulation of SOE and collective enterprises were the main causes for this decreasing trend. Results also indicated that gaps in insurance coverage between SOE and non-SOE employees, collective and non-collective employees, urban and rural workers became smaller in the 1990s. Moreover, policy effects were found to be stronger in urban areas than in rural areas.
The remainder of this paper is organized as follows: Section 2 introduces the health insurance scheme in China and its relationship with various reforms. Section 3 reviews related literature and Section 4 summarizes the data. Section 5 provides the specification of the model and Section 6 presents the results. Section 7 concludes.
Health insurance and reforms
There are several major policy changes that could possibly affect public health insurance2 coverage (Fig. 1 ). The Open Door Policy, deregulation of collective enterprises and SOE reforms were expected to have a negative effect on insurance coverage, whereas the effect of health insurance reform may be mixed.
Fig. 1.
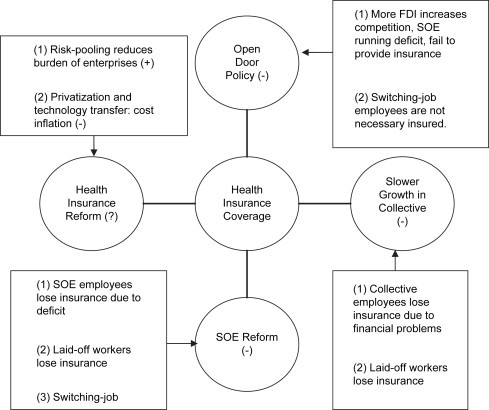
Summary of the effect of reforms on health insurance coverage.
The open door policy
The Open Door Policy increased competition from foreign countries, consequently domestic enterprises that faced great competition tended to reduce fringe benefits (e.g. health insurance). Beginning in 1979, coastal cities began to attract more investment from foreign countries. From 1979 to the mid-1980s, there were only limited openings of Special Economic Zones in Fujian and Guangdong province. From 1985 to the early 1990s, The Open Door Policy was enforced in most of the coastal cities, and Coastal Economic Zones came into being. From 1992 to 2000, the level of opening up increased and expanded to major parts of China (though some rural areas were excluded). During the 1990s, FDI actually used increased from 44 to 407 billion US dollars, about 10 fold (MOFTEC (2001)). For total industrial output, foreign-funded firms' share increased from 5% in 1991 to 23% in 2000. Facing severe competition, shutting down of inefficient SOEs had accelerated. Workers who lost their job would also lose their health insurance.
The SOE reform
SOEs have undergone dramatic restructuring and decentralization during the 1980s. Government decentralized administrative control and delegated power to individual companies and started sharing profits. As a consequence SOEs took responsibilities for their own profits and losses by means of contracts; bankruptcy and joint ventures are allowed. Beginning in 1992, the modern enterprises system was established and all the decision-making, implementation and supervising power were controlled by SOEs themselves. Since SOEs were able to make decisions on new recruits, many workers in the SOEs were laid off, and others switched to private companies. In both cases individuals would lose insurance.
No growth in SOEs had been seen since the middle 1990s. In 1992, 26% of SOEs were making losses, whereas in 1996, 50% of SOEs were making losses (Chow and Xu (2001)). The employment of SOEs decreased dramatically. During the same period, non-state-owned work enterprises, including private enterprises, cooperative enterprises, joint ownership enterprises, limited liability corporations, share-holding corporations, foreign-funded units and urban self-employed, had a more than six folds increase in employment.
Deregulation of rural collective enterprises
Rural collective enterprises also faced similar problems as the SOEs (Bloom and Jing (2003)). During the early 1980s (until 1983), decentralization and household responsibility system3 of collective enterprises were implemented in an increasingly larger scale. Beginning in 1984, township and village enterprises (TVEs) (non-agricultural business) came into being. TVEs were referred to as rural collective enterprises here.4 TVEs and non-state enterprises were allowed to hire labor through contract and determine wages independently. More and more TVEs and non-state enterprises were reformed into individual-owned or private-owned firms if they were small. Since in China non-state-owned enterprises were not required to provide health insurance, workers who remained in the reformed collective enterprises were likely to lose health insurance. In addition, in the middle and later 1990s, the rural collective enterprises had slower growth which further troubled the insurance coverage.5
Health care reforms
China's health care system experienced dramatic changes during the 1980s in cities as well as in rural area (Hsiao (1995), Yang, Lin, and Lawson (1991), Ho (1995)). During the period 1979–1991, government introduction of the co-payment system and focused on changing hospital incentives, introducing prepayment and fixed fee-for-service, giving more independence to hospitals, and allowing private ownership and other forms of insurance. Privatization plus technology transfer from western countries had accelerated the cost of medical care, which made health insurance less affordable. However, beginning in 1991, risk pooling and deductibles were introduced in the health care system, the burden of SOEs may be lessened and provision of health insurance may be made easier.
Literature review
Studies on Chinese health insurance coverage are generally descriptive. Several studies have linked insurance coverage with reforms, but due to data limitation and lack of reform variables, none could identify the specific reform effects that were responsible. Hu et al. (1999) analyzed cross-section survey data of urban workers in 1992 and found wide variation of coverage for health insurance benefits in urban China and stated that health insurance benefits variations were associated with SOE reforms. Akin et al. (2004) focused on the equality of the distribution of health insurance in China and showed that differences in insurance coverage narrowed significantly across socioeconomic groups during 1989–1997. However their focus was not on specific policies or reforms. Giles et al. (2003) demonstrated that economic restructuring as the consequence of economic reform from 1996 to 2001 caused a large unemployment shock that in turn led to “health benefit arrears” and new jobs created by government programs could not guarantee workers' health insurance benefits.
Other related studies on economic reforms and insurance, especially insurance inequality are summarized as follows Liu, Wu, Peng, and Fu (2003) found increasing health insurance coverage in rural China in the early 1990s was closely related to urbanization. Grogan (1995) reviewed major economic reforms in urban areas and pointed out disparities in insurance coverage increase across regions and provinces due to uneven openness and development, and further suggested integrating urban and rural health insurance systems. Smith (1998) provided evidence that health care services deteriorated both in quantity and quality since 1978, and benefits became more and more unevenly distributed across gender and region.
Overall, most of the existing research found decreasing health coverage and benefits were associated with reforms. However, the literature is mostly descriptive and not only lacks empirical evidence on this issue across reform years, but also a detailed model. This paper attempts to shed some light in this direction.
Data
CHNS data
The China Health and Nutrition Survey (CHNS) are designed to examine how the social and economic changes in the Chinese society affect health-related outcomes. The survey data cover a wide range of socioeconomic factors and related health, nutritional and demographic characteristics. A multistage random cluster process is used to draw the sample surveyed in each province. Counties in the nine provinces are stratified by income (low, middle, and high) and a weighted sampling scheme is used to randomly select four counties in each province. Within the counties, villages and townships are randomly selected. In addition, the provincial capital and a lower income city are selected and urban and suburban neighborhoods within the cities are randomly selected as well.
This study uses samples from the 1991, 1993, 1997 and 2000 surveys. The Liaoning province is excluded from the 1997 survey, and the Heilongjiang province is included only from 1997 on. In 2000, both provinces are included. The sample is restricted to those over 16 years old because insurance status in China heavily depends on the types of the working unit. After dropping missing values, 12,264 individuals and 26,561 person-year observations remained. The overall survey (n = 26,561) ratio of urban to rural residents is 4:6 which is roughly consistent with the actual ratio in China during the 1990s.
Trends in health insurance coverage
Now let us examine how health insurance coverage (calculated as % insured) in China in the 1990s changed over time. I categorize the sample by subgroups that include work unit group, urban/rural group, age group, education group, health status group and income group. Table 1 summarizes the insurance coverage for these subgroups over time. Working unit group is divided into SOEs, collective enterprises, other private enterprises, unemployed, retired, housewife, student and others not working. Collective enterprises include small collective enterprises (such as township owned enterprises and TVEs) and large collectives (such as those owned by county, city, or province). Other private includes family contract, individual, mixed-sources investment enterprises, household business. Rural and urban groups are divided according to the legal residence status. 6 Household income is divided into three groups: poor, middle and rich.7 There are several noted trends.
-
(1)
Overall, health insurance coverage decreased from 33% of individuals in 1991 to 23% of individuals in 2000.
-
(2)
By work units, in 1991, SOE had a leading health insurance coverage rate of 86% while collective enterprises had a slightly lower coverage rate of 61%. In contrast, other private had only 6% coverage rates and unemployed had 8% coverage. This may be because some of the unemployed workers still had their registered work units status (a status called xiagang), so they still maintained welfare relationships with their work unit. SOE and collectives experienced great loss of insurance overt time whereas other private and unemployed had relatively constant coverage (with a slight increase in 1997 and a slight drop in 2000) (See Fig. 2 as well). Retirees also had a slightly higher insurance coverage (around 12%) than the non-SOE and the non-collective employees, as retirees from the SOEs or the collective enterprises could still keep their insurance. Housewife's insurance status depended on whether any household member worked in a SOE or a collective enterprise. Most college students were insured through the school medical insurance as most universities were state-owned. To summarize, SOEs and collective enterprises decreased provision of health insurance to their workers greatly, whereas other private had slightly increased insurance coverage (6% in 1991 and 7% in 2000) and unemployed remained relatively constant (around 8%).
-
(3)
Urban residents (65%) had much higher insurance coverage than rural residents (11%) did at the beginning of 1990s. However, dramatic decreases in insurance coverage occurred in urban areas (from 65% to 44%), whereas rural areas had only small decline (from 11% to 8%). Migration from rural areas to urban areas may cause loss of health insurance as they were not officially registered in the cities.8
-
(4)
Predictably, the poor group had the lowest insurance rate (11% in 1991), whereas the rich group had the highest insurance rate (49% in 1991). However, over time insurance coverage decreased more for the rich group, so that the difference between the rich and poor narrowed. The associated phenomenon was also noticed in the literature.
Table 1.
Health insurance coverage rate (% insured) of different groups.
| Year | Sample Size | 1991 | 1993 | 1997 | 2000 |
|---|---|---|---|---|---|
| Overall | 26,561 | 0.33 | 0.31 | 0.28 | 0.23 |
| Provinces | |||||
| Liaoning | 2220 | 0.44 | 0.38 | – | 0.21 |
| Heilongjiang | 1493 | – | – | 0.22 | 0.17 |
| Jiangsu | 3367 | 0.67 | 0.54 | 0.56 | 0.51 |
| Shandong | 2660 | 0.34 | 0.39 | 0.45 | 0.38 |
| Henan | 3323 | 0.18 | 0.19 | 0.27 | 0.16 |
| Hubei | 3507 | 0.35 | 0.31 | 0.22 | 0.19 |
| Hunan | 3117 | 0.24 | 0.23 | 0.17 | 0.19 |
| Guangxi | 3675 | 0.23 | 0.25 | 0.18 | 0.13 |
| Guizhou | 3199 | 0.17 | 0.22 | 0.14 | 0.15 |
| Urban/Rural Group | |||||
| Rural | 15,549 | 0.11 | 0.09 | 0.14 | 0.08 |
| Urban | 11,012 | 0.65 | 0.60 | 0.46 | 0.44 |
| Working Unit Group | |||||
| SOE | 5136 | 0.86 | 0.79 | 0.67 | 0.63 |
| Collective | 3.366 | 0.61 | 0.48 | 0.48 | 0.43 |
| Private, Foreign and others | 14,139 | 0.06 | 0.04 | 0.10 | 0.07 |
| Unemployed | 567 | 0.08 | 0.07 | 0.10 | 0.08 |
| Retired | 849 | 0.12 | 0.13 | 0.11 | 0.07 |
| Housewife | 1165 | 0.17 | 0.15 | 0.13 | 0.16 |
| Student | 931 | 0.61 | 0.69 | 0.64 | 0.63 |
| Others not work | 408 | 0.21 | 0.08 | 0.11 | 0.10 |
| Age Group | |||||
| 16–25 | 6785 | 0.22 | 0.20 | 0.16 | 0.13 |
| 26–59 | 17,802 | 0.35 | 0.35 | 0.30 | 0.24 |
| 60+ | 1974 | 0.42 | 0.54 | 0.40 | 0.42 |
| Education Level Group | |||||
| None | 1926 | 0.23 | 0.29 | 0.17 | – |
| Finish primary | 6941 | 0.22 | 0.20 | 0.16 | 0.14 |
| Finish Lower Middle School | 11,246 | 0.32 | 0.26 | 0.24 | 0.17 |
| Finish Higher Middle School | 4008 | 0.48 | 0.42 | 0.34 | 0.30 |
| Finish Middle Technical School | 1336 | 0.79 | 0.71 | 0.59 | 0.52 |
| Finish University and up | 1104 | 0.94 | 0.87 | 0.78 | 0.68 |
| Household Income Group | |||||
| Poor | 7295 | 0.11 | 0.11 | 0.12 | 0.08 |
| Middle | 8769 | 0.35 | 0.33 | 0.23 | 0.23 |
| Rich | 10,497 | 0.49 | 0.43 | 0.39 | 0.36 |
| Temporary Health Group | |||||
| Good | 24,709 | 0.32 | 0.31 | 0.27 | 0.22 |
| bad | 1852 | 0.43 | 0.46 | 0.40 | 0.36 |
Fig. 2.
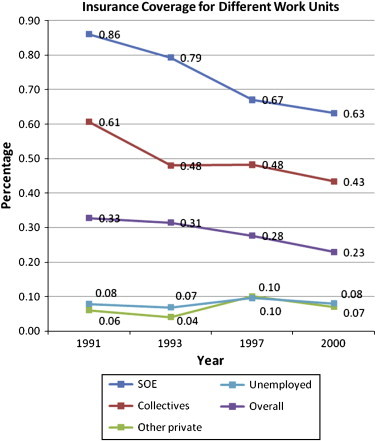
Insurance trends among different working units. Note: (1) Sample percentage: SOE 19%, Collectives 13%, others 53%, unemployed 2%.(2) Sample size: 26,561, individual: 12,264.
The model
The panel data model used to examine health insurance in China is the following:
i = 1,…N (individuals)
j = 1,…7 (provinces)
t = 1991, 1993, 1997, 2000
In a pooled OLS regression, α i= α. In a random effects model, and is to be estimated. I emphasize the fixed effects estimator, as it can control for individual characteristics that do not vary over time but may be correlated with regressors. In that case the province dummies are absorbed by the individual fixed effects. But there may still be some correlation with the time-varying province component of the error term due to common trends shared by different individuals in the same province, so standard errors are computed using clustering at the province level (Kaestner and Neeraj (2003), Borjas (2003)).
Additionally, the fixed effects logit model is estimated as follows,
where , is the logistic cdf.
The fixed effects logit model has the attraction of being explicitly for a binary dependent variable. But it has the detraction that it is only estimable for individuals that switch insurance status at some stage (Cameron & Trivedi (2005), pp 796). For this reason the original 12,264 individuals (most of whom had either no insurance in all periods they were observed or insurance in all periods they were observed) is reduced to 2017 individuals. Thus, the results from the fixed effects logit model are deemphasized due to the sample size loss, but they are given in last column of Table 5.
Table 5.
Regression results and model comparison.
| Dependant variables (Insurance) | Pooled OLS (n = 26,561) | Fixed effects linear (n = 26,561) | Random effects GLS (n = 26,561) | Fixed effects logit (n = 6011) | Fixed effects linear (n = 6011) |
|---|---|---|---|---|---|
| Open degree 1 | 0.0548 (1.24) | 0.0190 (0.40) | 0.0499 (1.13) | 0.352* (1.67) | 0.101 (0.34) |
| Open degree 2 | −0.00471 (−0.11) | −0.0231 (−0.51) | −0.0100 (−0.22) | −0.227 (−0.78) | −0.0256 (−0.14) |
| Collective 1 | −0.0627* (−2.22) | −0.0518 (−1.72) | −0.0605** (−2.13) | −0.546*** (−5.56) | −0.170* (−2.01) |
| Collective 2 | −0.0956** (−2.36) | −0.0798* (−1.89) | −0.0924** (−2.26) | −1.025*** (−5.51) | −0.278* (−2.09) |
| SOE | 0.544*** (8.74) | 0.249*** (9.04) | 0.504*** (8.62) | 2.101*** (7.08) | 0.548*** (3.48) |
| Collective | 0.243*** (6.95) | 0.236*** (8.37) | 0.246*** (7.13) | 1.662*** (5.21) | 0.494** (3.09) |
| Other units | −0.0813*** (−4.00) | −0.0270 (−1.41) | −0.0797*** (−4.02) | −0.472*** (−2.71) | −0.120 (−1.49) |
| Unemployed | −0.114*** (−4.27) | −0.077*** (−4.12) | −0.108*** (−4.52) | −0.705** (−2.48) | −0.166*** (−3.47) |
| SOE*Open Degree 1 | −0.122** (−2.53) | −0.0857** (−2.60) | −0.117** (−2.56) | −1.011*** (−3.98) | −0.240 (−1.54) |
| SOE*Open Degree 2 | −0.201** (−2.65) | −0.00406 (−0.09) | −0.168** (−2.38) | −0.594** (−2.00) | −0.0990 (−0.81) |
| Collective*Open Degree 1 | −0.198*** (−4.41) | −0.157*** (−5.40) | −0.192*** (−4.39) | −0.824*** (−2.89) | −0.274* (−1.97) |
| Collective*Open Degree 2 | −0.0365 (−0.78) | −0.0744* (−2.03) | −0.0470 (−1.02) | −0.698** (−2.35) | −0.212* (−1.98) |
| Reg*Open Degree 1 | −0.0633 | −0.0516* | −0.0614 | −0.673*** | −0.155 |
| (Reg = 1 if urban; = 0 if rural) | (−1.29) | (−2.30) | (−1.39) | (−2.98) | (−0.97) |
| Reg*Open Degree 2 | 0.0154 (0.27) | −0.151** (−2.35) | −0.00220 (−0.04) | −1.235*** (−3.90) | −0.258* (−1.97) |
| Registration status(urban = 1) | 0.145** (2.76) | 0.127** (2.60) | 0.156*** (2.96) | 1.113*** (4.05) | 0.230** (2.39) |
| Age | 0.000675 (0.69) | 0.0116 (0.66) | 0.00123 (1.31) | 0.231* (1.80) | 0.0495 (0.71) |
| Age square | 2.56e−05* (2.24) | −3.77e−05 (−0.77) | 1.89e−05* (1.73) | −0.00073* (−1.77) | −0.00019 (−1.15) |
| Gender(male = 1) | 0.00225 (0.39) | 0.00424 (0.68) | |||
| Number of HH rosters contributed to income | −0.0149*** | 0.00154 | −0.0129*** | 0.0226 | 0.00717 |
| (−3.57) | (0.42) | (−3.60) | (0.51) | (0.41) | |
| Education | 0.0342*** (7.69) | 0.0125* (2.12) | 0.0353*** (8.08) | 0.0722 (1.34) | 0.0245 (1.13) |
| Household income(adjusted) | 0.0532** (2.96) | 0.0143** (2.74) | 0.0463*** (2.94) | 0.246*** (4.34) | 0.0676** (3.12) |
| Temporary health(bad = 1) | 0.0452*** (6.04) | 0.0162 (1.31) | 0.0399*** (5.51) | 0.289* (1.95) | 0.0735 (1.65) |
| Marital Status(married = 1) | 0.0272** (3.29) | 0.0309* (2.28) | 0.0277*** (3.43) | 0.271 (1.63) | 0.0646 (1.81) |
| 1993 | −0.0586 (−1.81) | −0.0665 (−1.14) | −0.0575* (−1.82) | −0.954*** (−3.43) | −0.247 (−1.41) |
| 1997 | −0.0412 (−1.05) | −0.0599 (−0.44) | −0.0386 (−0.97) | −1.131 (−1.37) | −0.232 (−0.48) |
| 2000 | −0.0338 (−0.84) | −0.0966 (−0.52) | −0.0362 (−0.89) | −1.731 | −0.366 (−0.53) |
| Observations | 26,561 | 26,561 | 26,561 | 6011 | 6011 |
| R-squared | 0.46 | 0.08 | 0.17 | ||
| Number of id | 12,264 | 12,264 | 2017 | 2017 | |
Note: (1) Sample size is 26,561 for the first three models (first three columns) and 6011 for the fixed effects logit model. The last column gives the results for the fixed effects model using the smaller sample.
(2) The baseline group for employment group (SOE, Collective, Other Units, and Unemployed) is “others” including retired, housewife, student, and others with no job.
(3)***p < 0.01, ** p < 0.05, * p < 0.1. All are two-tailed tests. The numbers in the parenthesis below the coefficients are t-statistics.
(4) The standard errors are cluster-robust standard errors that cluster on the province.
(5) The above (2)-(4) apply to Table 6 as well.
Y is a binary variable which indicates health insurance status of an individual in a given province and a given year. Although private insurance existed in China in the later 1990s, not many people had private insurance. There were few cases of “opting out” of the publicly provided insurance. Those who had the choice of private insurance tend to choose to be insured by both public and private insurance. This is why temporary health status is treated as exogenous in the regression as not many Chinese people are able to purchase or choose private insurance by themselves. The time invariant fixed effect term αi represents individual unobserved factors. Openjt is the indicator of the degree of openness. Collectivejt is the indicator of the number of collective enterprises in each province. The parameters of interest are φ and π since they measure the reform effects and we call them “heterogeneous treatment effects”. Zit are individual-level control variables which include work unit type (SOE, Collective, Others, Unemployed) and registration status (urban or rural). Since we are also interested in how the gaps between different types of workers change over time, interaction terms between Zit and Openjt are included in the regression as well. Xit are other individual-level control variables and include age, education, gender, health status, marital status, household income and the number of bread-earners in the household. Dummy variables for provinces and years are included as provincial and year fixed effects.
Summary statistics of all the variables can be found in Table 2 . Sample means are reported for both the full sample (N = 26,561) and the selected sample (N = 6011). The noticeable difference is that the selected sample has relatively higher insurance coverage (48% vs. 29% in the full sample). The reason for more insured in the selected sample is that in order to be selected the person had to have had insurance in at least one year. This will inevitably lead to higher insurance rates when the original insurance rate was only 29%. In addition, more SOE employees (30% vs. 19%), more collective enterprises employees (24% vs. 13%), and more urban residents (59% compared to 41%) are included in the selected sample.
Table 2.
Regression variables description.
| Name | Unit | Mean (sample size 26,561) | Mean (sample size 6011) |
|---|---|---|---|
| LHS variable | |||
| Insurance | 1 if insured, 0 if not | 0.29 | 0.48 |
| Key RHS variables | |||
| Open degree 1 | Index for Open Door Policy, prov/year, dummy of Open Degree 1 | 0.28 | 0.23 |
| Open degree 2 | Dummy of Open Degree 2 | 0.57 | 0.65 |
| Collective Index 1 | Index of Collective enterprises reforms, Dummy of Collective 1 | 0.36 | 0.38 |
| Collective Index 2 | Dummy of Collective 2 | 0.35 | 0.24 |
| SOE | SOE = 1, otherwise = 0 | 0.19 | 0.30 |
| Collective | Collective = 1, otherwise = 0 | 0.13 | 0.24 |
| Other units | Other units = 1, otherwise = 0 | 0.52 | 0.32 |
| Unemployed | Unemployed(seeking job) = 1, otherwise = 0 | 0.02 | 0.02 |
| Retired | Retired = 1, otherwise = 0 | 0.04 | 0.05 |
| Housewife | Housewife = 1, otherwise = 0 | 0.03 | 0.02 |
| Student | Student = 1, otherwise = 0 | 0.04 | 0.03 |
| Others with no work | Others with no work = 1, otherwise = 0 | 0.02 | 0.01 |
| RHS control individual variables | |||
| registration | 1 if registered urban,0 if rural | 0.41 | 0.59 |
| age | Individual age | 36.68 | 37.25 |
| gender | 1 if male; 0 if female | 0.56 | 0.59 |
| Number of HH roasters contributed to income | # of person in the person's household who contributes to household income | 4.00 | 3.85 |
| edulevel | 0 none,1 primary school,2 junior high, 3 high school,4 middle technical or vocational degree,5 university or college,6 master or higher | 1.97 | 2.21 |
| lnhhincome | Log household income adjusted by price | 8.45 | 8.62 |
| health_status | Self-reported health status, 1 if good health, 0 if poor health | 0.73 | 0.75 |
| marital_status | if married, 0 if not | 0.73 | 0.79 |
| illness (Temporary Health Status) | whether the person have been sick or injured or suffering from chronic disease during the last 4 weeks 1 if sick or injured, 0 otherwise | 0.07 | 0.07 |
| Year province dummy variables | |||
| dyear1 | Year dummy, 1 if 1991, 0 otherwise | 0.27 | 0.26 |
| dyear2 | Year dummy, 1 if 1993, 0 otherwise | 0.21 | 0.25 |
| dyear3 | Year dummy, 1 if 1997, 0 otherwise | 0.26 | 0.26 |
| dyear4 | Year dummy, 1 if 2000, 0 otherwise | 0.26 | 0.23 |
| dprov1 | Province dummy, 1 if Liaoning, 0 otherwisee | 0.08 | 0.06 |
| dprov2 | Province dummy, 1 if Heilongjiang, 0 otherwisee | 0.06 | 0.02 |
| dprov3 | Province dummy, 1 if Jiangsu, 0 otherwisee | 0.13 | 0.22 |
| dprov4 | Province dummy, 1 if Shandong, 0 otherwisee | 0.10 | 0.17 |
| dprov5 | Province dummy, 1 if Henan, 0 otherwise | 0.13 | 0.10 |
| dprov6 | Province dummy, 1 if Hubei, 0 otherwise | 0.13 | 0.15 |
| dprov7 | Province dummy, 1 if Hunan, 0 otherwise | 0.12 | 0.11 |
| dprov8 | Province dummy, 1 if Guangxi, 0 otherwise | 0.14 | 0.10 |
| dprov9 | Province dummy, 1 if Guizhou, 0 otherwise | 0.12 | 0.06 |
Key reform variables given in Table 4 are constructed as follows. The degree of openness is used as a proxy for the Open Door Policy. It is constructed by the numbers and types of economic opening zones in each province; For instance, Economic and Technological Development Zones, Special Economic Zones, Coastal Open Economic Zones, etc. These reform variables were originally created by Woo, Sachs, Demurger, Bao, and Chang (2002) to analyze geographical and regional development. Here I adjusted their index by a one-year lag since the Open Door Policy usually took place in a few pilot cities, before spreading to the entire province. I also constructed the reform variables for the year 2000 following the methodology of Woo et al. (2002). The Open Door Policy variables differentiate across provinces and years, which can be used to identify the effects of economic reforms. “Open degree 1” is a binary variable indicating whether or not the Open Door Policy was in place in a certain province. “Open degree 2” is a binary variable indicating whether or not the policy had been developed to a certain level in a certain province and it indicates how much the province had been affected by the policy. The collective index is constructed from the proportion of collective employees in each province and is also composed of two indicator variables (see Table 3 ). The smaller is the proportion of the collective employees, the larger is the index.
Table 4.
Open door policy and collective index: a summary.
| The open door policy index measuring level of economic openness in each province | ||||
|---|---|---|---|---|
| prov/year | 1991 | 1993 | 1997 | 2000 |
| Liaoning | 2 | 2 | – | 2 |
| Heilongjiang | – | – | 2 | 2 |
| Jiangsu | 2 | 2 | 2 | 2 |
| Shandong | 2 | 2 | 2 | 2 |
| Henan | 0 | 1 | 1 | 1 |
| Hubei | 0 | 1 | 2 | 2 |
| Hunan | 0 | 1 | 1 | 1 |
| Guangxi | 2 | 2 | 2 | 2 |
| Guizhou | 0 | 1 | 1 | 1 |
| The collective index measuring level of collective enterprises reform in each province | ||||
| Liaoning | 0 | 0 | – | 1 |
| Heilongjiang | – | – | 0 | 1 |
| Jiangsu | 0 | 0 | 0 | 1 |
| Shandong | 1 | 0 | 0 | 1 |
| Henan | 2 | 1 | 1 | 1 |
| Hubei | 1 | 0 | 1 | 2 |
| Hunan | 2 | 0 | 1 | 2 |
| Guangxi | 2 | 1 | 2 | 2 |
| Guizhou | 2 | 2 | 2 | 2 |
Note: (1) Open Door Policy Index and Collective Index are both reform indicators and they both compose three values: 0, 1 and 2. ”2” indicates reform has gone into an advanced stage; “1” indicates reform is at the beginning stage; “0” indicates that reform has not affected this province.
(2) The reform variables vary across time and province.
(3) Sources: Woo et al. (2002).
Table 3.
Construction of the collective index.
| Collectives employees as a percentage of total population | Frequency | Percentage | Cumulative Percentage |
|---|---|---|---|
| 0.005 | 5604 | 9.88 | 9.88 |
| 0.006 | 2054 | 3.62 | 13.5 |
| 0.008 | 3557 | 6.27 | 19.77 |
| 0.009 | 5432 | 9.57 | 29.34 |
| 0.01 | 3117 | 5.49 | 34.83 |
| 0.011 | 3542 | 6.24 | 41.08 |
| 0.015 | 5023 | 8.85 | 49.93 |
| 0.017 | 3103 | 5.47 | 55.4 |
| 0.018 | 1677 | 2.96 | 58.35 |
| 0.019 | 1688 | 2.98 | 61.33 |
| 0.02 | 1000 | 1.76 | 63.09 |
| 0.021 | 2863 | 5.05 | 68.14 |
| 0.023 | 1598 | 2.82 | 70.95 |
| 0.025 | 1513 | 2.67 | 73.62 |
| 0.026 | 3105 | 5.47 | 79.09 |
| 0.029 | 1559 | 2.75 | 81.84 |
| 0.034 | 1729 | 3.05 | 84.89 |
| 0.035 | 1250 | 2.2 | 87.09 |
| 0.042 | 2628 | 4.63 | 91.72 |
| 0.049 | 1009 | 1.78 | 93.5 |
| 0.057 | 1250 | 2.2 | 95.7 |
| 0.062 | 1394 | 2.46 | 98.16 |
| 0.077 | 1043 | 1.84 | 100 |
Note: Collective index is created from the above table. It is divided into three groups at cumulative percentage 33% and 66%. The bolded line in the table is the cutting point.
Collective index = 2 if the percentage is less than 0.01.
Collective index = 1 if the percentage is more than 0.01 and less than 0.021.
Collective index = 0 if the percentage is more than 0.021.
The Jiangsu Province is used as the baseline group and year 1991 as the baseline year. The baseline working unit group is “others” including retired, housewife, student, and others with no job.
Results
I report results for four estimators in Table 5 . The first three estimators are pooled OLS, fixed effects and random effects estimators of the linear model. These have the advantage of simple interpretation of the coefficients but ignore the binary nature of the dependent variable. The final estimator is the fixed effects Logit estimator. The first three columns use the full sample (n = 26,561) and the last two columns use the selected sample (n = 6011).
In all models I expect correlation of observations for individual in the same province. Accordingly cluster-robust standard errors that cluster on the province are reported. These do not alter the parameter estimates, but do lead to considerably larger standard errors and smaller t-statistics. In the case of the FE logit estimator, a cluster bootstrap is used to get the cluster-robust standard errors.9
Results are summarized as follows. The reform variables (“Collective 2”), interaction terms (SOE*Open Degree 1, Collective*Open Degree 1) are negative and statistically significant at 5% in all models using the full sample. Fixed effects model (Table 5 column 2 and column 4) also gives statistically significant estimates for three more interaction terms (Collective*Open Degree 2, Reg*Open Degree 1, and Reg*Open Degree 2). On one hand, declining insurance coverage were strongly associated with economic reforms. On the other hand, the statistical significance of the interaction terms indicates the gap between SOE and non-SOE workers, collective and non-collective workers, and urban rural areas were shrinking. This is consistent with Fig. 1 where SOE and collective workers had the largest decline in insurance coverage whereas others had relatively small decline or even a slightly increase. Work unit type indicators are statistically significant at 5% in all models, which indicates strong association between welfare and employment status.
These results add to the literature the specific effects of reforms on health insurance coverage and hope to shed light on whether gaps in welfare benefits between different types of workers have changed in a more economically open society. For individual control variables, results are not directly comparable to Akin et al. (2004) since they estimate each year (1989, 1991, 1993 and 1997) as cross-section instead of treating it as panel and their estimates varies by year. But they do find significant results for the type of employers (state or collective) that is consistent with our model. Compare to Hu et al. (1999) that include relatively few regressors (no income and health status in their regression), gender and age are statistically significant in their model, but not ours. Instead, I found marital status, education and household income as important predictors of health insurance.
A robust version of the Hausman test using the auxiliary OLS regression proposed by Wooldridge (2002) rejects (χ 2 = 42.15) the random effects model in favor of the fixed effects model. The discussion and conclusion in the following sections are based on the results of the fixed effects linear model clustering at the province level.
Reform and policy effects
Based on the results of the fixed effects linear model (Table 5 column 2), the Open Door Policy had a negative impact on health insurance coverage. In particular, in urban areas insurance coverage was reduced by, respectively, 3.3% and 17.4% due to the beginning (“Open Degree 1”) and the developing (“Open Degree 2”) of the Open Door policy. The Open Door Policy was associated with two counter effects: decrease in SOE insurance and increase in provision of private insurance. However, the positive effect was dominated by the negative effect since private insurance was not widely purchased in China during the 1990s. The reforms in collective enterprises (refer to coefficient of “Collective 2”) is associated with 8% points decrease in health insurance. The transition to contract system and individual-owned firms, and the slower growth of collective enterprises especially rural collective enterprises were the key factors affecting the provision of public health insurance. The falling of rural collective enterprises was largely due to overall economic downturn, financial intermediation inadequacy and migration of skilled labors.
The negative signs of the interaction terms are strong evidence that the gaps between SOE and non-SOE employees, collective and non-collective employees, urban and rural employees have considerably decreased. In particular, when China began to open up (see the interaction terms with “Open Degree 1”), the gap between SOE and non-SOE employees decreased 8.6%; the gap between collective and non-collective employees decreased by 15.7%; and the gap between urban and rural workers decreased by 5.16%. The gap decreased further when the economy became more opened up (see the interaction terms with “Open Degree 2”). The decrease in gap was largely due to the lost in welfare benefits of SOE and collective workers rather than the better-off of non-SOE and non-collective workers. Even though the increases in income disparities in the 1990s were found in many studies (Tyler, 1995, Ying, 1999, Liu et al., 1999), the gap in welfare benefits had shrank during the economic open up and deregulation process.
Fixed effects linear model (Table 5 column 5) and fixed effects logit model (Table 5 column 4) use the selected sample that had their insurance status changed over time. The signs of all the coefficients do not change, which indicate our results are pretty robust. The FE logit coefficients are scaled differently to linear case so coefficients are not directly comparable. The magnitudes for statistically significant variables are about 2–3 times larger in the selected sample (compare column 5 with column 2). The enlargement of the policy effects in the selected sample is expected since this sample excludes individuals whose insurance status did not change.
Fig. 3 (top) demonstrates the relationship of the Open Door Policy and health insurance coverage. Health insurance coverage declined gradually as the Open Door Policy expanded in China. Also shown in Fig. 3 (bottom) is the collective index. The collective enterprises employment ratio in each province increased (the index has dropped) while the health insurance coverage rate dropped from 1991 to 1993, however we also observe that from 1997 to 2000 the most dramatic decrease in the health insurance coverage was associated with the most decline in the collective enterprises employment ratio (the index has increased).
Fig. 3.

Reforms and insurance coverage. Note: (1) Refer to Table 3 and Table 4 for details about the Open Door Policy and the Collective Index Collective.
Urban and rural differences
There are several major differences between urban and rural areas (Table 6 ). First, the interactions with policy variables were statistically significant in urban areas but not in rural areas except for Collective. The Open Door Policy mainly affected urban areas, especially coastal cities and most of the market competition and SOE reforms also occurred in the cities whereas collective reforms mainly affected rural areas.
Table 6.
Fixed effects model for urban and rural area separately.
| Dependent variable(insurance) | Urban | Rural |
|---|---|---|
| Open degree 1 | 0.0840 (1.85) | −0.0335 (−0.50) |
| Open degree 2 | −0.0464 (−0.85) | −0.0758 (−1.22) |
| Collective 1 | −0.0352 (−1.59) | −0.0435 (−0.77) |
| Collective 2 | −0.0252 (−0.62) | −0.109 (−1.48) |
| SOE | 0.267*** (4.90) | 0.115 (1.41) |
| Collective | 0.321*** (4.98) | 0.0646* (1.91) |
| Other units | −0.0786* (−2.13) | −0.0253 (−1.14) |
| Unemployed | 0.115*** (−4.33) | −0.00460 (−0.40) |
| SOE*Open Degree 1 | −0.135*** (−3.62) | −0.0736 (−0.83) |
| SOE*Open Degree 2 | −0.0369 (−0.64) | −0.0370 (−0.31) |
| Collective*Open Degree 1 | −0.229*** (−3.39) | −0.0610* (−2.09) |
| Collective*Open Degree 2 | −0.192** (−3.06) | 0.0945 (1.41) |
| Age | −0.0203 (−0.80) | 0.0185 (0.76) |
| Age square | 4.51e-05 (0.51) | −4.21e-05 (−0.83) |
| Number of HH rosters contributed to income | −0.00255 (−0.35) | 0.000708 (0.17) |
| Education | 0.0256** (3.33) | 0.00406 (1.64) |
| Household income(adjusted) | 0.0250** (2.72) | 0.0105 (1.70) |
| Temporary health(bad = 1) | 0.0189 (0.81) | 0.00603 (0.73) |
| Marital Status(married = 1) | 0.00136 (0.04) | 0.0439*** (3.70) |
| Observations | 11,012 | 15,549 |
| Number of id | 5404 | 7685 |
| R-squared | 0.12 | 0.05 |
Note: (1) “Gender” and “Registration Status” are dropped from the fixed effects model as they do not vary over time.
(2) Model used here is the baseline model that is the same as Table 6 column 2.
(3)*** p < 0.01, **p < 0.05, *p < 0.1.
Second, for individual control variables, SOE, collective and unemployed remain important predictors for insurance coverage in urban areas but not in rural areas. The noticeable difference of urban and rural is: household income and education were statistically significant in urban area whereas marital status was statistically significant (at 1%) in rural area. Education had been well developed in cities, whereas most of the rural population still remained a low level of education. Especially women in rural areas tended not to work due to low education and cultural reasons, whereas in cities women and men were more equally educated and women often worked. Women with high level of education in rural areas tended to move to cities whereas women with low level of education often got married and stayed in the original place where they were born. Therefore, being married is very important for women in rural areas to be covered with health insurance.
Conclusion
This paper finds that economic reforms had statistically significant and substantial negative impacts on health insurance coverage in China during the 1990s. In particular, individuals in urban areas that were highly affected by the Open Door Policy experienced 17 percentage points reduction in health insurance coverage. The reform and the consequent unemployment of collective enterprises were associated with 8 percentage points decrease in health insurance coverage.
In addition, gaps in insurance coverage between SOE and non-SOE employees, collective and non-collective employees, urban and rural workers became narrower in the 1990s. This could be due to the large decline in the provision of welfare benefits in SOE and collective enterprises. Moreover, policy effects were found to be stronger in urban areas than in rural areas. The effects of socioeconomic characteristics were asymmetric across urban and rural areas. For example, household income and education were important factors in urban areas, whereas being married is the most significant factor in rural areas.
The conclusion of this paper gives answers to the question what “socialism with Chinese characteristics” means in terms of welfare benefits. As more and more Chinese state-owned enterprises and collective enterprises faced market competition, they had no choice but to lay off workers and consequently reduce welfare benefits. As part of the “Chinese characteristics” and “socialism”, these companies continued to provide benefits to temporarily laid-off workers and retirees as a partial support to workers and their families. However, the continuing decline of health insurance coverage and its association to the Open Door Policy served as strong evidence that only those SOEs that can survive market competition are more likely to continue their provision of welfare benefits.
One of the important emphases of socialism is equity and a “comprehensively well-off society”. Compare workers in different sectors and different areas, we find evidence that the gaps between SOE and non-SOE employees, collective and non-collective employees, urban and rural employees have considerably decreased. As history has proven, openness promotes innovation which will in turn increase productivity. Workers in the private sectors certainly have benefited more from economic openness in terms of productivity, wage and welfare benefits.
As more and more types of private insurance were introduced in China, Chinese workers will have a choice of being covered by private and other forms of insurance. Future research should focus on the relationship between public-provided insurance and private-provided insurance and how insurance status changes over time. Studies that can address the topic of balanced growth in terms of both material attainment and welfare benefits are greatly needed.
I am indebted to Colin Cameron for his continuous help and numerous comments he gave for this paper. I am also grateful to Wing Woo, Douglas Miller, Hilary Hoynes, and Paul Leigh for their valuable suggestions and comments. All errors are my own.
This was a practice in China starting from 1981. The major change from the past egalitarian distribution method was that individual companies and managers were now responsible for their own losses and gains by contract with the government. It was first adopted in agriculture and later extended to other sectors of the economy.
The two primary elements of public health insurance in China are Public Insurance and Worker Insurance. Public Insurance covers employees (and their dependents) of state administrative organizations and institutes through which medical expenses are paid partially or completely by the state. Worker Insurance covers state-owned enterprise employees and certain collective-enterprise employees, through which medical expenses are paid partially or completely by the enterprises. Here the definition and categorizations used are consistent with CHNS Data.
It started with a small number of collectives started to leasing their land and allocating quotas to household. This was later on officially accepted and was called “household responsibility system”.
Here we follow the official statistics and CHNS Data, and regard TVEs as rural collectives. For details, please refer to Woo (2005).
GDP growth declined to below 2 digits and about 7–8 percent since 1996. Economic downturn was characterized by deflation and urban hidden unemployment. Falling output appeared not only in SOE, but also in rural TVEs.
In China, each resident is assigned a legal resident status according to the city or county they were born. There are certain benefits (e.g. education, health) associated with their legal resident status. Urban residents usually have more benefits than rural residents.
“Rich” is defined as household income above 6003 Yuan (lnincome > 8.7). “Poor” is defined as household income of below 3294 Yuan (lnincome < 8.1). 8.1 and 8.7 are the lower and upper quartile of logged household income.
This is because STATA command option vce (cluster prov) option is not available for FE logit model. So a cluster bootstrap is implemented.
They may apply to the government to change the registration status after they work, which should be agreed by their working unit and be legally processed. Only if the old working unit released the linkage of the worker and the new working unit approved the residency status, could the worker obtain urban registration status.
References
- Akin S.J., Dow H.W., Lance M.P. Did the distribution of health insurance in China continue to grow less equitable in the nineties? Results from a longitude survey. Social Science & Medicine. 2004;58:293–304. doi: 10.1016/s0277-9536(03)00207-7. [DOI] [PubMed] [Google Scholar]
- Bloom G., Jing F. Institute of Development Studies; 2003. China's Rural health system in a changing institutional context. Working Paper 194. [Google Scholar]
- Borjas G. Welfare reform, labor supply, and health insurance in the immigrant population. Journal of Health Economics. 2003;22(6):933–958. doi: 10.1016/j.jhealeco.2003.05.002. [DOI] [PubMed] [Google Scholar]
- Cameron A.C., Trivedi K.P. Cambridge University Press; NY: 2005. Microeconometrics: Methods and applications. [Google Scholar]
- Chen A. Assessing China's economic performance since 1978: material attainments and beyond. The Journal of Socio-Economics. 2005;34:449–527. [Google Scholar]
- Giles J., Park A., Fang C. William Davidson Institute; 2003. How has economic restructuring affected China's urban workers? Working Paper 628. [Google Scholar]
- Grogan C.M. Urban economic reform and access to health care coverage in the People's Republic of China. Social Science & Medicine. 1995;41(8):1073–1084. doi: 10.1016/0277-9536(94)00419-t. [DOI] [PubMed] [Google Scholar]
- Ho L.S. Market reforms and China's health care system. Social Science & Medicine. 1995;41(8):1065–1072. doi: 10.1016/0277-9536(94)00422-p. [DOI] [PubMed] [Google Scholar]
- Hsiao W. The Chinese health care system: lessons for other nations. Social Science & Medicine. 1995;41(8):1047–1055. doi: 10.1016/0277-9536(94)00421-o. [DOI] [PubMed] [Google Scholar]
- Hu T., Ong M., Lin Z., Li E. The effects of economic reform on health insurance and the financial burden for urban workers in China. Health Economics. 1999;8:309–321. doi: 10.1002/(sici)1099-1050(199906)8:4<309::aid-hec440>3.0.co;2-n. [DOI] [PubMed] [Google Scholar]
- Kaestner R., Neeraj K. Welfare reform and health insurance coverage of low income families. Journal of Health Economics. 2003;22(6):959–981. doi: 10.1016/j.jhealeco.2003.06.004. [DOI] [PubMed] [Google Scholar]
- Lardy N. The role of foreign trade and investment in China's economic transformation. The China Quarterly. 1995:1065–1082. Special Issue: China's Transitional Economy. [Google Scholar]
- Li W. The impact of economic reform on the performance of Chinese state enterprises 1980–1989. Journal of Political Economy. 1997;105(5):1080–1106. [Google Scholar]
- Lin Y. Rural reforms and agricultural growth in China. The American Economic Review. 1992;82(1):34–51. [Google Scholar]
- Lin Y., Liu Z. Fiscal decentralization and economic growth in China. Economic Development and Cultural Change. 1995;49:1–21. [Google Scholar]
- Liu G., Wu X., Peng C., Fu A. Urbanization and health care in rural China. Contemporary Economic Policy. 2003;21(1):11–24. [Google Scholar]
- Liu Y., Hsiao W., Eggleston K. Equity in health and health care: the Chinese experience. Social Science & Medicine. 1999;49:1349–1356. doi: 10.1016/s0277-9536(99)00207-5. [DOI] [PubMed] [Google Scholar]
- Ministry of Foreign Trade and Economic Cooperation (MOFTEC), 2001. Statistics on FDI in China, p. 6.
- Naughton B. Cambridge Univ. Press; Cambridge: 1995. Growing out of the plan: Chinese economic reform, 1978–1993. [Google Scholar]
- Smith C.J. Modernization and health care in contemporary China. Health and Place. 1998;4(2):125–139. doi: 10.1016/s1353-8292(98)00005-7. [DOI] [PubMed] [Google Scholar]
- Tyler P.E. Deng's economic drive leaves vast regions of China behind. New York Times. 1995;27 December:A1. [Google Scholar]
- Woo W.T. Chinese economic growth: sources and prospects. In: Fouquin Michel, Lemoine Francoise., editors. The Chinese economy. Economica; London: 1998. [Google Scholar]
- Woo W.T. China's rural enterprises in crisis: the role of inadequate financial intermediation. In: Huang Yasheng, Saich Anthony, Steinfeld Edward., editors. Financial sector reform in China. Harvard University Press; 2005. [Google Scholar]
- Woo W.T., Sachs J.D., Demurger S., Bao, Chang G. Geography, economic policy, and regional development in China. Asian Economic Paper. 2002;1:1. [Google Scholar]
- Wooldridge J.M. MIT Press; Cambridge: 2002. Econometric analysis of cross section and panel data. [Google Scholar]
- Yang P., Lin V., Lawson J. Health policy reform in the People's Republic of China. International Journal of Health Services. 1991;21:481–491. doi: 10.2190/GGUT-K19W-FHUR-PPLF. [DOI] [PubMed] [Google Scholar]
- Ying L.G. China's changing regional disparities during the reform period. Economic Geography. 1999;75(1):59–70. [Google Scholar]