

Abstract
In this study, an abundant (A + U)% and low codon bias were revealed in duck hepatitis virus type 1 (DHV-1) and the new serotype strains isolated from Taiwan, South Korea and Mainland China (DHV-N). The general correlation between base composition and codon usage bias suggests that mutational pressure rather than natural selection is the main factor that determines the codon usage bias in these samples. By comparative analysis of the codon usage patterns of 40 ORFs of DHV, we found that all of DHV-1 strains grouped in genotype C; the DHV-N strains isolated in South Korea and China clustered into genotypes B; and the DHV-N strains isolated from Taiwan clustered into genotypes A. The findings revealed that more than one subtype of DHV-1 circulated in East Asia. Furthermore, the results of phylogenetic analyses based on RSCU values and Clustal W method indicated obvious phylogenetic congruities. This suggested that better genome consistency of DHV may exist in nature and phylogenetic analyses based on RSCU values maybe a good method in classifying genotypes of the virus. Our work might give some clues to the features and some evolutionary information of DHV.
Keywords: DHV-1, DHV-N, Synonymous codon usage, ENC, Genotype
1. Introduction
Duck hepatitis virus (DHV) is the causative agent of duck viral hepatitis, an acute and fatal disease of young ducklings, characterized primarily by hepatitis. Three different serotypes (DHV-1, DHV-2, and DHV-3) have been described (Gough et al., 1985, Haider and Calnek, 1979). DHV-1 was provisionally classified as an enterovirus (Harvala et al., 2005, Wang et al., 2008), and DHV-3 was classified as a probable picornavirus. DHV-2 is now classified as an astrovirus (Gough et al., 1984, Gough et al., 1987). DHV-1 is distributed worldwide and is one of the most economically important to all duck farms because of the high potential for mortality, while DHV-2 and DHV-3 have only been reported in the UK and the USA, respectively (Ding and Zhang, 2007). The genome of DHV-1 is a single stranded, polyadenylated, positive sense RNA of approximately 7800 nucleotides with a single, long open reading frame (ORF) encoding a polyprotein covalently linked to the 5′ end of genome.
As an important evolutionary phenomenon, it was well known that synonymous codon usage bias exists in a wide range of biological systems from prokaryotes to eukaryotes (Archetti, 2004, Liu et al., 2010). Many previous analysis of codon usage have suggested that many different biological factors are related to synonymous codon usage biases, but codon usage variation is represented by two major paradigms (Guo and Yuan, 2009). Either of or both of mutational bias and selection determine codon usage (Zhou and Li, 2009). These observed patterns in synonymous codon usage varied among genes within a genome, and among genomes. Recently, it was reported that codon usage is an important driving force in the evolution of astroviruses and small DNA viruses (Karlin et al., 1990). Clearly, a better knowledge of codon usage bias in the virus is essential to understanding the processes governing their evolution, particularly the overall role played by mutation pressure.
Recent analyses of Picornaviridae codon composition and codon usage were primarily focused on foot-and-mouth disease (Zhong et al., 2007) and hepatitis A virus (Jenkins and Holmes, 2003). However, little information about synonymous codon usage patterns of DHV has been acquired to date. In addition, some new serotypes of DHV with some features of DHV-1, but with no antigenic relationship with DHV-1 in cross neutralization test, have been reported (Kim et al., 2007). In this study, some codon usage indexes, such as the relative synonymous codon usage (RSCU) values, effective number of codon (ENC) were utilized to reveal the relationship between DHV-1 and DHV-N.
2. Materials and Methods
2.1. Sequence Data
Previously reported picornavirus sequences including the DHV-N strains isolated in Taiwan (Tseng and Tsai, 2007), Mainland China (Fu et al., 2008, Pan et al., 2008, SHi et al., 2009) and South Korea (Kim et al., 2007), the two strains from ATCC (Kim et al., 2006) and other deposited DHV-1 genomes used in the comparisons were retrieved from NCBI (http://www.ncbi.nlm.nih.gov/Genbank/). A total of 40 DHV genomes were used in this study. The serial number (SN), genotype, isolated region, GenBank accession numbers, and other detail information about these strains were listed in Table 1 . All above DHV genomes only contains a single long ORF.
Table 1.
DHV genomes used in this study.
| SN | Strain | Isolation | Genotype | Accession no. |
|---|---|---|---|---|
| 1 | DRL-62 | ATCC | DHV-1 | DQ219396 |
| 2 | R85952 | ATCC | DHV-1 | DQ226541 |
| 3 | H | UK | DHV-1 | DQ249300 |
| 4 | 5886 | USA | DHV-1 | DQ249301 |
| 5 | AP-04009 | South Korea | DHV-N | DQ256133 |
| 6 | AP-04203 | South Korea | DHV-N | DQ256134 |
| 7 | DHV-HSS | South Korea | DHV-1 | DQ812092 |
| 8 | AP-04114 | South Korea | DHV-N | DQ812093 |
| 9 | DHV-HS | South Korea | DHV-1 | DQ812094 |
| 10 | A66 | Mainland China | DHV-1 | DQ886445 |
| 11 | 04G | China Taipei | DHV-N | EF067923 |
| 12 | 90D | China Taipei | DHV-N | EF067924 |
| 13 | HP-1 | Mainland China | DHV-1 | EF151312 |
| 14 | E53 | Mainland China | DHV-1 | EF151313 |
| 15 | F | Mainland China | DHV-1 | EU264072 |
| 16 | C-GY | Mainland China | DHV-N | EU352805 |
| 17 | YZ | Mainland China | DHV-1 | EF427900 |
| 18 | DHV | Mainland China | DHV-1 | EU395440 |
| 19 | B61 | Mainland China | DHV-N | EU747874 |
| 20 | 161/79/V | Mainland China | DHV-1 | EU753359 |
| 21 | G | Mainland China | DHV-N | EU755009 |
| 22 | ZJ | Mainland China | DHV-1 | EU841005 |
| 23 | FS | Mainland China | DHV-N | EU877916 |
| 24 | HDHV1-BJ | Mainland China | DHV-1 | FJ157172 |
| 25 | LY0801 | Mainland China | DHV-1 | FJ436047 |
| 26 | FFZ05 | Mainland China | DHV-1 | FJ496340 |
| 27 | GHZ04 | Mainland China | DHV-1 | FJ496339 |
| 28 | SG | Mainland China | DHV-1 | FJ971623 |
| 29 | GD | Mainland China | DHV-N | GQ122332 |
| 30 | NA | Mainland China | DHV-1 | GQ130377 |
| 31 | SD01 | Mainland China | DHV-N | GQ485310 |
| 32 | C-LGJ | Mainland China | DHV-1 | GU066819 |
| 33 | C-XNH | Mainland China | DHV-1 | GU066820 |
| 34 | C-YDF | Mainland China | DHV-N | GU066821 |
| 35 | C-BLZ | Mainland China | DHV-N | GU066822 |
| 36 | C-YCZ | Mainland China | DHV-N | GU066823 |
| 37 | C-YDW | Mainland China | DHV-N | GU066824 |
| 38 | 1v | Mainland China | DHV-N | GU250782 |
| 39 | 03D | China Taipei | DHV-1 | NC_008250 |
| 40 | AP-03337 | South Korea | DHV-N | NC_009750 |
2.2. The Codon Usage Indices
In order to investigate the extent of codon usage bias in DHV-1 and DHV-N, all RSCU values of different codon in 40 ORFs of DHV strains were calculated to measure synonymous codon usage (Sharp and Li, 1986, Zhou et al., 2010). The RSCU values of codons in the ORF of the DHV were calculated according to the formula of our previous reports (Wang et al., 2011a, Wang et al., 2011b).
where g ij is the observed number of the ith codon for jth amino acid which has n i type of synonymous codons. The codon with RSCU value more than 1.0 has positive codon usage bias, while the value <1.0 has relative negative codon usage bias. When RSCU value is equal to 1.0, it means that this codon is chosen equally and randomly.
ENC is the best overall estimator of absolute synonymous codon usage bias. It was used to quantify the codon usage bias of each ORF of DHV. The predicted values of ENC and the GC content of the third codon position (GC3) provides a useful display of the main features of codon usage patterns of DHV. All of codon usage indices were calculated by the methods described previously (Wang et al., 2011b).
2.3. Comparative Sequence Analysis
40 ORFs of DHV were aligned using the Clustal W method implemented in the MegAlign program (Thompson et al., 1994) (DNAStar). Phylogenetic trees were produced using Neighbor-joining implemented in the program MEGA 4.0 (Tamura et al., 2007).
2.4. Statistical Analysis
Principal component analysis (PCA) was carried out to analyze the major trend in codon usage pattern in different ORF of 40 DHV genomes. It is a statistical method that performs linear mapping to extract optimal features from an input distribution in the mean squared error sense and can be used by self-organizing neural networks to form unsupervised neural preprocessing modules for classification problems (Kanaya et al., 2001).
Correlation analysis is used to identify the relationship between codon usage bias and synonymous codon usage patterns of DHV-1 and DHV-N. This analysis is implemented based on the Spearman's rank correlation analysis way. All statistical analyses were carried out using the statistical analysis software SPSS Version 17.0.
3. Results
3.1. The Characteristics of Synonymous Codon Usage in the ORF of DHV
The comparative analysis of RSCU values indicated that only two preferred codon GAG and UUG which chooses G at the third position, and the rest of preferred ones are all ended with A or U (Table 2 ). The values of ENC among these samples are very similar, and vary from 49.837 to 52.440 with a mean value of 50.750 and S.D. of 0.124 (Table 3 ), suggesting that the extent of codon preference in DHV-1 and DHV-N genomes are less biased (mean ENC > 40) and keeps at a stable level.
Table 2.
Synonymous codon usage in 40 ORFs of DHV.
| AAa | Codon | RSCUb | AA | Codon | RSCUb |
|---|---|---|---|---|---|
| Phe | UUU | 1.427 | Gln | CAA | 1.025 |
| UUC | 0.573 | CAG | 0.975 | ||
| Leu | UUA | 0.694 | His | CAU | 1.160 |
| UUG | 1.794 | CAC | 0.840 | ||
| CUU | 1.355 | Asn | AAU | 1.429 | |
| CUC | 0.900 | AAC | 0.571 | ||
| CUA | 0.518 | Lys | AAA | 1.140 | |
| CUG | 0.739 | AAG | 0.860 | ||
| Val | GUU | 1.506 | Asp | GAU | 1.293 |
| GUC | 0.758 | GAC | 0.707 | ||
| GUA | 0.499 | Glu | GAA | 0.867 | |
| GUG | 1.238 | GAG | 1.133 | ||
| Ser | UCU | 1.974 | Arg | AGA | 1.573 |
| UCC | 0.742 | AGG | 1.325 | ||
| UCA | 1.715 | CGU | 0.812 | ||
| UCG | 0.097 | CGC | 1.114 | ||
| AGU | 1.033 | CGA | 0.606 | ||
| AGC | 0.438 | CGG | 0.540 | ||
| Pro | CCU | 1.178 | Cys | UGU | 1.405 |
| CCC | 0.691 | UGC | 0.595 | ||
| CCA | 2.073 | Tyr | UAU | 1.554 | |
| CCG | 0.057 | UAC | 0.446 | ||
| Thr | ACU | 1.548 | Ala | GCU | 1.445 |
| ACC | 0.751 | GCC | 1.152 | ||
| ACA | 1.600 | GCA | 1.306 | ||
| ACG | 0.101 | GCG | 0.097 | ||
| Gly | GGU | 1.181 | Ile | AUU | 1.784 |
| GGC | 0.998 | AUC | 0.628 | ||
| GGA | 1.044 | AUA | 0.588 | ||
| GGG | 0.776 |
Note: The preferentially used codons for each amino acid are described in bold.
AA is the abbreviation of amino acid.
RSCU value is the fraction of the relative synonymous codon usage. The words in bold refer to preferred codon.
Table 3.
Identified composition and ENC in 40 ORFs of DHV genomes.
| SN | A% | G% | U% | C% | A3% | G3% | U3% | C3% | (A + T)% | (A + T)12% | (A+T)3% | ENC |
|---|---|---|---|---|---|---|---|---|---|---|---|---|
| 1 | 29.07 | 22.74 | 28.15 | 20.04 | 27.03 | 17.29 | 36.53 | 19.15 | 57.22 | 54.29 | 63.56 | 50.89 |
| 2 | 28.96 | 22.86 | 27.84 | 20.34 | 26.78 | 17.61 | 35.82 | 19.79 | 56.80 | 54.12 | 62.60 | 51.68 |
| 3 | 29.17 | 22.70 | 27.99 | 20.15 | 27.41 | 17.02 | 36.18 | 19.39 | 57.16 | 54.17 | 63.59 | 51.32 |
| 4 | 29.21 | 22.59 | 28.8 | 19.39 | 27.54 | 16.69 | 37.88 | 17.90 | 58.01 | 54.61 | 65.41 | 50.07 |
| 5 | 28.06 | 22.44 | 29.01 | 20.49 | 24.37 | 16.64 | 38.88 | 20.11 | 57.07 | 54.19 | 63.25 | 50.97 |
| 6 | 28.12 | 22.37 | 28.97 | 20.54 | 24.59 | 16.49 | 38.77 | 20.15 | 57.09 | 54.17 | 63.36 | 50.79 |
| 7 | 29.3 | 22.56 | 28.59 | 19.54 | 27.82 | 16.64 | 37.55 | 17.99 | 57.89 | 54.45 | 65.37 | 49.92 |
| 8 | 28.08 | 22.41 | 29.01 | 20.50 | 24.51 | 16.54 | 38.74 | 20.20 | 57.09 | 54.22 | 63.25 | 50.99 |
| 9 | 28.93 | 22.86 | 28.12 | 20.09 | 27.03 | 17.34 | 36.44 | 19.19 | 57.05 | 54.08 | 63.47 | 50.54 |
| 10 | 29.27 | 22.61 | 27.78 | 20.34 | 27.83 | 16.65 | 35.71 | 19.81 | 57.05 | 54.04 | 63.54 | 51.72 |
| 11 | 27.75 | 22.64 | 29.01 | 20.61 | 23.69 | 17.08 | 38.82 | 20.41 | 56.76 | 54.12 | 62.52 | 50.35 |
| 12 | 27.69 | 22.74 | 28.93 | 20.64 | 23.69 | 17.12 | 38.59 | 20.59 | 56.62 | 54.03 | 62.29 | 50.44 |
| 13 | 28.9 | 22.92 | 27.79 | 20.39 | 26.69 | 17.70 | 35.82 | 19.79 | 56.69 | 54.01 | 62.51 | 51.91 |
| 14 | 29.27 | 22.65 | 27.88 | 20.19 | 27.82 | 16.78 | 35.98 | 19.43 | 57.15 | 54.10 | 63.79 | 51.63 |
| 15 | 29.27 | 22.70 | 28.06 | 19.97 | 27.52 | 16.98 | 36.61 | 18.89 | 57.33 | 54.20 | 64.13 | 50.88 |
| 16 | 28.17 | 22.44 | 29.11 | 20.28 | 24.56 | 16.54 | 39.16 | 19.74 | 57.28 | 54.29 | 63.72 | 50.34 |
| 17 | 29.11 | 22.68 | 28.39 | 19.82 | 27.06 | 17.33 | 37.26 | 18.35 | 57.50 | 54.36 | 64.32 | 50.60 |
| 18 | 29.35 | 22.55 | 27.88 | 20.21 | 27.90 | 16.73 | 35.77 | 19.60 | 57.23 | 54.29 | 63.67 | 51.51 |
| 19 | 28.32 | 22.22 | 28.64 | 20.82 | 25.03 | 16.24 | 37.58 | 21.15 | 56.96 | 54.35 | 62.61 | 50.96 |
| 20 | 29.72 | 22.3 | 28.59 | 19.39 | 29.02 | 15.86 | 37.55 | 17.57 | 58.31 | 54.52 | 66.57 | 50.18 |
| 21 | 28.2 | 22.37 | 29.03 | 20.41 | 24.56 | 16.50 | 38.79 | 20.16 | 57.23 | 54.38 | 63.35 | 50.58 |
| 22 | 29.11 | 22.71 | 28.19 | 19.99 | 27.27 | 17.16 | 37.11 | 18.46 | 57.30 | 54.01 | 64.38 | 50.71 |
| 23 | 28.08 | 22.48 | 29.11 | 20.32 | 24.37 | 16.59 | 39.06 | 19.97 | 57.19 | 54.29 | 63.44 | 49.89 |
| 24 | 29.48 | 22.43 | 27.96 | 20.13 | 28.14 | 16.41 | 36.02 | 19.43 | 57.44 | 54.36 | 64.16 | 51.06 |
| 25 | 28.99 | 22.83 | 27.63 | 20.55 | 27.07 | 17.39 | 35.14 | 20.40 | 56.62 | 54.03 | 62.22 | 52.44 |
| 26 | 29.24 | 22.61 | 28.83 | 19.32 | 27.78 | 16.79 | 38.45 | 16.98 | 58.07 | 54.34 | 66.23 | 49.84 |
| 27 | 29.24 | 22.62 | 28.74 | 19.39 | 27.62 | 16.96 | 38.23 | 17.19 | 57.98 | 54.36 | 65.85 | 49.98 |
| 28 | 29.39 | 22.5 | 27.94 | 20.16 | 28.13 | 16.54 | 35.91 | 19.42 | 57.33 | 54.26 | 64.04 | 51.37 |
| 29 | 28.11 | 22.5 | 28.95 | 20.44 | 24.39 | 16.64 | 38.62 | 20.35 | 57.06 | 54.29 | 63.00 | 50.22 |
| 30 | 29.2 | 22.65 | 28.15 | 20.00 | 27.41 | 17.02 | 37.06 | 18.51 | 57.35 | 54.04 | 64.47 | 50.62 |
| 31 | 27.95 | 22.48 | 29.31 | 20.26 | 24.14 | 16.64 | 39.57 | 19.65 | 57.26 | 54.24 | 63.72 | 50.28 |
| 32 | 29.30 | 22.64 | 28.13 | 19.93 | 27.75 | 16.75 | 36.71 | 18.79 | 57.43 | 54.18 | 64.45 | 50.64 |
| 33 | 29.13 | 22.73 | 28.06 | 20.09 | 27.26 | 17.25 | 36.44 | 19.05 | 57.19 | 54.20 | 63.70 | 51.36 |
| 34 | 28.33 | 22.28 | 29.07 | 20.32 | 24.70 | 16.36 | 38.97 | 19.97 | 57.40 | 54.49 | 63.67 | 50.52 |
| 35 | 28.08 | 22.39 | 29.34 | 20.19 | 24.66 | 16.32 | 39.41 | 19.61 | 57.42 | 54.31 | 64.07 | 50.17 |
| 36 | 28.2 | 22.34 | 29.17 | 20.29 | 24.65 | 16.45 | 39.30 | 19.60 | 57.37 | 54.31 | 63.95 | 50.25 |
| 37 | 28.42 | 22.22 | 29.29 | 20.07 | 25.07 | 16.27 | 39.48 | 19.18 | 57.71 | 54.54 | 64.55 | 50.30 |
| 38 | 28.24 | 22.39 | 29.16 | 20.20 | 24.79 | 16.45 | 39.34 | 19.42 | 57.40 | 54.26 | 64.13 | 50.57 |
| 39 | 29.19 | 22.67 | 28.01 | 20.13 | 27.77 | 16.69 | 36.44 | 19.10 | 57.20 | 53.94 | 64.21 | 51.11 |
| 40 | 28.05 | 22.44 | 28.88 | 20.63 | 24.42 | 16.59 | 38.51 | 20.48 | 56.93 | 54.12 | 62.93 | 51.24 |
3.2. Effect of Mutational Bias on Codon Usage
In codon usage pattern of DHV, the codons ended with A or U were favored, indicating that the content of A and U in different position of sense codons may reflect some important characteristics of codon usage pattern of DHV. Firstly, (A + U)12% was compared with (A + U)3%, a highly significant correlation was observed (Spearman r = 0.475, P < 0.01). Secondly, the correlation between the Axis 1 (calculated by PCA) which was the largest trends in codon usage among these genomes and A%, C%, G%, U%, A3%, C3%, G3%, U3%, (A + U)%, (A + U)3% of each strain was also analyzed. The significant correlation was found between nucleotide compositions and synonymous codon usage to some extent (Table 4 ). Finally, the ENC-plot [ENC plotted against (G + C)3%] was used as a part of general strategy to investigate patterns of synonymous codon usage. All of the spots gathered together lie below the expected curve indicates that the codon usage bias of these samples have no apparent difference, implying that the codon bias can be explained mainly by an uneven base composition, in other words, by mutation pressure rather than natural selection (Fig. 1 ).
Table 4.
Correlation analysis between Axis 1 and nucleotide contents of 40 ORFs of DHV.
| A% | C% | G% | U% | (A + U)% | A3% | C3% | G3% | U3% | (A + U)3% | ||
|---|---|---|---|---|---|---|---|---|---|---|---|
| Axis 1 | r | -0.929** | 0.584** | -0.641** | 0.862** | 0.278 | −0.947** | 0.614** | −0.454** | 0.850** | −0.407* |
Means P < 0.01.
Means 0.01 < P < 0.05.
Fig. 1.
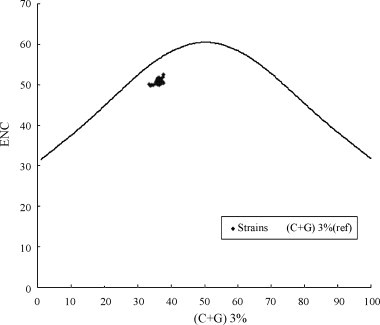
Graphs showing the relationship between ENC and the (G + C)3%. The curve indicates the expected codon usage if GC compositional constraints alone account for codon usage bias.
3.3. Principal Component Analysis of Codon Usage
From the result of PCA, we could detect one major trend in the first axis (Axis 1) which can account for 33.451% of the total variation, and another major trend in the second axis (Axis 2) for 11.928% of the total variation. A plot of the Axis 1 and the Axis 2 of each ORF in NDV was shown in Fig. 2 . Clearly, because of different codon usage pattern, 40 ORFs of DHV were mainly gathered at three places. We termed them as DHV types A, B, and C. Furthermore, we found that all of DHV-1 strains grouped in genotype C; the DHV-N strains isolated in South Korea and China clustered into genotypes B; and the DHV-N strains isolated Taiwan clustered into genotypes A.
Fig. 2.
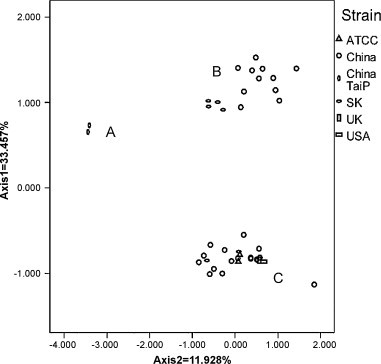
A plot of the values of the Axis 1a (34.555%) and the Axis 2a (12.701%) of 40 ORFs of DHV-1 genomes in principle component analysis. China is stand for Mainland China. SK is stand for South Korea. TaiB is stand for China Taipei. The A, B and C indicate lineage A, B and C, respectively.
3.4. Comparative Sequence Analysis
Comparisons between members which belong to same lineage showed that the range of nucleotide identity in lineage C was 92.7–99.2%, in lineage B was 92.7–98.6%, and in lineage A was 99.6%. In addition, the nucleotide identity between members belong to different lineages were also calculated as follow: between lineage A and lineage B were 78.5–78.1%, between lineage B and lineage C were 72.9–74.1%, between lineage A and lineage C were72.8–73.4%. In addition, phylogenetic analysis of these 40 ORFs of DHV strains was done to identify the result of principal component analysis. The same classification of lineage A, lineage B or lineage C was obtained with that of principle component analysis (Fig. 3 ).
Fig. 3.
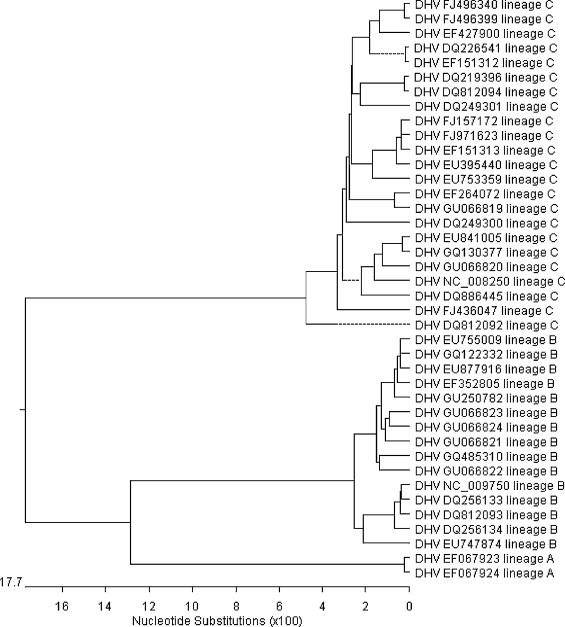
Phylogenetic trees, based on the ORF, showing the relationship among these available DHV sequences. The same classification of lineage A, lineage B or lineage C after the GenBank accession number was obtained with that of principle component analysis.
3.5. Qualitative Evaluation of Codon Usage Bias in Three Lineages of DHV
As shown in Fig. 4 , the global codon usage pattern was very similar among the three lineages of DHV coding regions except the codons coding for Ala, Arg, Glu and Gly.
Fig. 4.
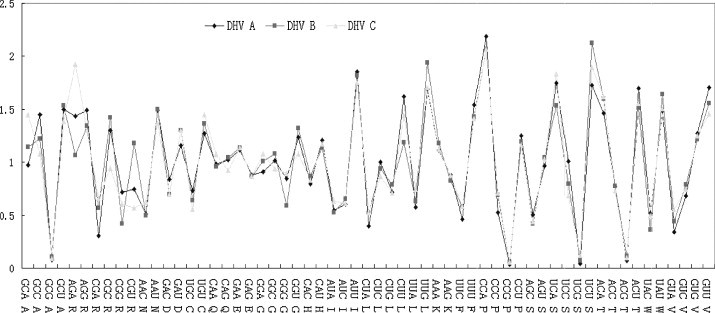
Qualitative evaluation of codon usage bias in three lineages of DHV.
4. Discussion
The synonymous codon usage has been well established to reveal genetic information of some viral genomes (Bai et al., 2004, Jenkins and Holmes, 2003). Like other viruses, as for, SARS-covs (mean ENC = 48.99) (Gu et al., 2004) and human Bocavirus (mean ENC = 44.45) (Zhao et al., 2008), the synonymous codon usage bias in DHV was also low (mean ENC = 50.750, higher than 40). A low codon usage bias is advantageous to replicate efficiently in vertebrate host cells, with potentially distinct codon preferences (Das et al., 2006, Zhong et al., 2007).
In this study, the highly significant correlation between (A + U)12% and (A + U)3% (Spearman r = 0.475, P < 0.01), suggests that mutational pressure was the main factor that determined codon usage bias, rather than natural selection, since the effects are present at all codon positions (Tao et al., 2009, Zhong et al., 2007). That is also supported by the ENC-plot [ENC plotted against (G + C)3%] (Fig. 1) and the highly significant correlation between codon usage indices (Axis 1) and A%, U%, G%, C%, (A + U)%, A3%, U3%, G3%, C3% and (A + U)3% (Table 4).
A phylogenetic tree is a branching diagram showing the inferred evolutionary relationships among various biological species or other entities based upon similarities and differences in their physical and/or genetic characteristics and is always generated according to the result of sequence alignment. There existed published reports of similar clustering phenomenon by using different methods. In detail, Wang et al. (2008) reported DHV could be classified into three genotypes according to phylogenetic trees, based on the nucleotide sequences of VP1, VP0, VP3, and partial 3D. All Chinese strains in the above-mentioned paper were clustered into one genotype. However, our study first reported more than one genotypes of DHV circulates in Mainland China and phylogenetic analyses based on RSCU values maybe provide more detailed information in classifying genotypes of DHV. The lineage A of DHV only contains strains 90D and 04G, which was isolated from Taiwan. Recently, Tseng and Tsai reported strains 90D and 04G were determined to be antigenically unrelated to DHV-1 by in vitro cross-neutralization assay and phylogenetic and evolutionary analysis of the two strains revealed that the two strains belong to a novel genus in the Picornaviridae family (Tseng and Tsai, 2007). Moreover, the strains isolated from China and Korea has two different codon usage patterns, this finding reconfirm that more than one genotype of DHV circulated in Korea and China (Fu et al., 2008, Kim et al., 2007, Tseng et al., 2007). The study also implied that differences of the codon usage patterns might be utilized as a reference to classify genotypes of virus (Wang et al., 2011b).
To our knowledge, our work was the first report of the codon usage analysis on DHV-1 and DHV-N. It was revealed that codon usage bias in DHV was low and mutational pressure was the main factor that affects codon usage variation in DHV. DHV-1 and DHV-N strains of this study were classified into three genotypes based on codon usage analysis. All of three different codon usage patterns existed in DHV strains isolated from East Asia. However, due to a lack of sequence data and detailed information about these isolations, a comprehensive analysis is needed to reveal more information about other responsible factors within DHV.
Acknowledgements
This work was supported in parts by grants from National Science & Technology Key Project (2009ZX08007-006B), International Science & Technology Cooperation Program of China (No. 2010DFA32640) and Science and Technology Key Project of Gansu Province (No. 0801NKDA034). This study was also supported by National Natural Science foundation of China (No. 30700597 and No. 31072143).
References
- Archetti M. Codon usage bias and mutation constraints reduce the level of error minimization of the genetic code. J. Mol. Evol. 2004;59(2):258–266. doi: 10.1007/s00239-004-2620-0. [DOI] [PubMed] [Google Scholar]
- Bai X., Xu J.Z., Li L., Guo Z., Li J., Zhu Y.M. Analysis of codon usage in potato and its application in the modification of t-PA gene. Yi Chuan. 2004;26(1):75–83. [PubMed] [Google Scholar]
- Das S., Paul S., Dutta C. Synonymous codon usage in adenoviruses: influence of mutation, selection and protein hydropathy. Virus Res. 2006;117:227–236. doi: 10.1016/j.virusres.2005.10.007. [DOI] [PubMed] [Google Scholar]
- Ding C., Zhang D. Molecular analysis of duck hepatitis virus type 1. Virology. 2007;361(1):9–17. doi: 10.1016/j.virol.2007.01.007. [DOI] [PubMed] [Google Scholar]
- Fu Y., Pan M., Wang X., Xu Y., Yang H., Zhang D. Molecular detection and typing of duck hepatitis A virus directly from clinical specimens. Vet. Microbiol. 2008;131(3):247–257. doi: 10.1016/j.vetmic.2008.03.011. [DOI] [PubMed] [Google Scholar]
- Gough R.E., Borland E.D., Keymer I.F., Stuart J.C. An outbreak of duck hepatitis type II in commercial ducks. Avian Pathol. 1985;14(2):227–236. doi: 10.1080/03079458508436224. [DOI] [PubMed] [Google Scholar]
- Gough R.E., Borland E.D., Keymer I.F., Stuart J.C. An outbreak of duck virus enteritis in commercial ducks and geese in East Anglia. Vet. Rec. 1987;121(4):85. doi: 10.1136/vr.121.4.85. [DOI] [PubMed] [Google Scholar]
- Gough R.E., Collins M.S., Borland E., Keymer L.F. Astrovirus-like particles associated with hepatitis in ducklings. Vet. Rec. 1984;114(11):279. doi: 10.1136/vr.114.11.279-a. [DOI] [PubMed] [Google Scholar]
- Gu W., Zhou T., Ma J., Sun X., Lu Z. Analysis of synonymous codon usage in SARS Coronavirus and other viruses in the Nidovirales. Virus Res. 2004;101(2):155–161. doi: 10.1016/j.virusres.2004.01.006. [DOI] [PMC free article] [PubMed] [Google Scholar]
- Guo F.B., Yuan J.B. Codon usages of genes on chromosome, and surprisingly, genes in plasmid are primarily affected by strand-specific mutational biases in Lawsonia intracellularis. DNA Res. 2009;16:91–104. doi: 10.1093/dnares/dsp001. [DOI] [PMC free article] [PubMed] [Google Scholar]
- Haider S.A., Calnek B.W. In vitro isolation, propagation, and characterization of duck hepatitis virus type III. Avian Dis. 1979;23(3):715–729. [PubMed] [Google Scholar]
- Harvala H., Kalimo H., Bergelson J., Stanway G., Hyypia T. Tissue tropism of recombinant coxsackieviruses in an adult mouse model. J. Gen. Virol. 2005;86(7):1897–1907. doi: 10.1099/vir.0.80603-0. [DOI] [PubMed] [Google Scholar]
- Jenkins G.M., Holmes E.C. The extent of codon usage bias in human RNA viruses and its evolutionary origin. Virus Res. 2003;92(1):1–7. doi: 10.1016/s0168-1702(02)00309-x. [DOI] [PubMed] [Google Scholar]
- Kanaya S., Kinouchi M., Abe T., Kudo Y., Yamada Y., Nishi T., Mori H., Ikemura T. Analysis of codon usage diversity of bacterial genes with a self-organizing map (SOM): characterization of horizontally transferred genes with emphasis on the E. coli O157 genome. Gene. 2001;276(1–2):89–99. doi: 10.1016/s0378-1119(01)00673-4. [DOI] [PubMed] [Google Scholar]
- Karlin S., Blaisdell B.E., Schachtel G.A. Contrasts in codon usage of latent versus productive genes of Epstein–Barr virus: data and hypotheses. J. Virol. 1990;64(9):4264–4273. doi: 10.1128/jvi.64.9.4264-4273.1990. [DOI] [PMC free article] [PubMed] [Google Scholar]
- Kim M.C., Kwon Y.K., Joh S.J., Kim S.J., Tolf C., Kim J.H., Sung H.W., Lindberg A.M., Kwon J.H. Recent Korean isolates of duck hepatitis virus reveal the presence of a new geno- and serotype when compared to duck hepatitis virus type 1 type strains. Arch. Virol. 2007;152(11):2059–2072. doi: 10.1007/s00705-007-1023-0. [DOI] [PubMed] [Google Scholar]
- Kim M.C., Kwon Y.K., Joh S.J., Lindberg A.M., Kwon J.H., Kim J.H., Kim S.J. Molecular analysis of duck hepatitis virus type 1 reveals a novel lineage close to the genus Parechovirus in the family Picornaviridae. J. Gen. Virol. 2006;87(11):3307–3316. doi: 10.1099/vir.0.81804-0. [DOI] [PubMed] [Google Scholar]
- Liu X., Wu C., Chen A.Y. Codon usage bias and recombination events for neuraminidase and hemagglutinin genes in Chinese isolates of influenza A virus subtype H9N2. Arch. Virol. 2010;155(5):685–693. doi: 10.1007/s00705-010-0631-2. [DOI] [PubMed] [Google Scholar]
- Pan M., Fu Y., Wang X.Y., Xu Y.L., Yang H.C., Zhang D.B. Characteristics of the 3′ end sequence in genome of a new serotype of duck hepatitis virus isolated from China. J. China Agric. Univ. 2008;13(4):65–70. [Google Scholar]
- Sharp P.M., Li W.H. Codon usage in regulatory genes in Escherichia coli does not reflect selection for ‘rare’ codons. Nucleic Acids Res. 1986;14:7737–7749. doi: 10.1093/nar/14.19.7737. [DOI] [PMC free article] [PubMed] [Google Scholar]
- SHi S.H., Cheng L.F., Fu G.H., Chen H.M., Chen Z., Yang W.X., Su J.J., Huang Y. Genomic sequence of a new serotype duck hepatitis virus. Acta Microbiol. Sin. 2009;49(19):309–315. [PubMed] [Google Scholar]
- Tamura K., Dudley J., Nei M., Kumar S. MEGA4: Molecular Evolutionary Genetics Analysis (MEGA) software version 4.0. Mol. Biol. Evol. 2007;24(8):1596–1599. doi: 10.1093/molbev/msm092. [DOI] [PubMed] [Google Scholar]
- Tao P., Dai L., Luo M., Tang F., Tien P., Pan Z. Analysis of synonymous codon usage in classical swine fever virus. Virus Genes. 2009;38(1):104–112. doi: 10.1007/s11262-008-0296-z. [DOI] [PMC free article] [PubMed] [Google Scholar]
- Thompson J.D., Higgins D.G., Gibson T.J. CLUSTAL W: improving the sensitivity of progressive multiple sequence alignment through sequence weighting, position-specific gap penalties and weight matrix choice. Nucleic Acids Res. 1994;22(22):4673–4680. doi: 10.1093/nar/22.22.4673. [DOI] [PMC free article] [PubMed] [Google Scholar]
- Tseng C.H., Knowles N.J., Tsai H.J. Molecular analysis of duck hepatitis virus type 1 indicates that it should be assigned to a new genus. Virus Res. 2007;123(2):190–203. doi: 10.1016/j.virusres.2006.09.007. [DOI] [PubMed] [Google Scholar]
- Tseng C.H., Tsai H.J. Molecular characterization of a new serotype of duck hepatitis virus. Virus Res. 2007;126(1):19–31. doi: 10.1016/j.virusres.2007.01.012. [DOI] [PubMed] [Google Scholar]
- Wang L., Pan M., Fu Y., Zhang D. Classification of duck hepatitis virus into three genotypes based on molecular evolutionary analysis. Virus Genes. 2008;37:52–59. doi: 10.1007/s11262-008-0233-1. [DOI] [PubMed] [Google Scholar]
- Wang M., Liu Y.S., Zhou J.H., Chen H.T., Ma L.N., Ding Y.Z., Liu W.Q., Gu Y.X., Zhang J. Analysis of codon usage in Newcastle disease virus. Virus Genes. 2011;42:245–253. doi: 10.1007/s11262-011-0574-z. [DOI] [PMC free article] [PubMed] [Google Scholar]
- Wang M., Zhang J., Zhou J.H., Chen H.T., Ma L.N., Ding Y.Z., Liu W.Q., Liu Y.S. Analysis of codon usage in bovine viral diarrhea virus. Arch. Virol. 2011;156(1):153–160. doi: 10.1007/s00705-010-0848-0. [DOI] [PMC free article] [PubMed] [Google Scholar]
- Zhao S., Zhang Q., Liu X., Wang X., Zhang H., Wu Y., Jiang F. Analysis of synonymous codon usage in 11 human bocavirus isolates. Biosystems. 2008;92(3):207–214. doi: 10.1016/j.biosystems.2008.01.006. [DOI] [PMC free article] [PubMed] [Google Scholar]
- Zhong J., Li Y., Zhao S., Liu S., Zhang Z. Mutation pressure shapes codon usage in the GC-Rich genome of foot-and-mouth disease virus. Virus Genes. 2007;35(3):767–776. doi: 10.1007/s11262-007-0159-z. [DOI] [PMC free article] [PubMed] [Google Scholar]
- Zhou J.H., Zhang J., Chen H.T., Ma L.N., Liu Y.S. Analysis of synonymous codon usage in foot-and-mouth disease virus. Vet. Res. Commun. 2010;34(4):393–404. doi: 10.1007/s11259-010-9359-4. [DOI] [PubMed] [Google Scholar]
- Zhou M., Li X. Analysis of synonymous codon usage patterns in different plant mitochondrial genomes. Mol. Biol. Rep. 2009;36(8):2039–2046. doi: 10.1007/s11033-008-9414-1. [DOI] [PubMed] [Google Scholar]