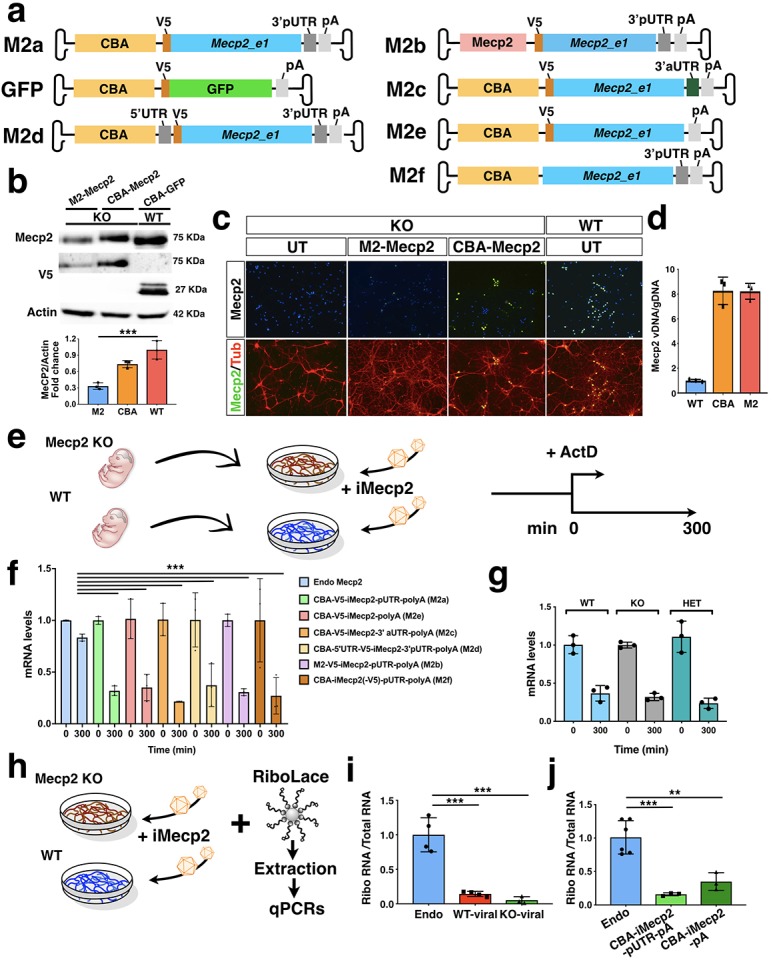
Figure 1. RNA stability and translational efficiency of the viral Mecp2 transgene.

(a) Illustration of the AAV vectors expressing V5-tagged Mecp2_e1 or GFP under the control of Chicken β-Actin (CBA) promoter or Mecp2 core promoter. Vectors included murine Mecp2 coding sequence with either its own proximal 3’UTR (3’pUTR, M2a), or a synthetic 3’UTR sequence (3’aUTR, M2c), or both 3’pUTR and 5’UTR (M2d), or no UTR (M2e), or without the V5 tag (M2f). (b) Western blot analysis for V5, Mecp2 and Actin protein levels in GFP infected (control, CBA-GFP) WT neurons and Mecp2-/y (KO) neurons infected with CBA-Mecp2 and M2-Mecp2. Quantification was performed using densitometric analysis of Mecp2 relative to Actin signal and expressed in arbitrary units (n = 3) (c) Immunostaining of KO (control untreated and infected with M2-Mecp2 or CBA-Mecp2) and wild-type neurons for Mecp2 and TUBB3 (Tub). (d) qRT-PCR quantification of viral Mecp2 DNA copies in Mecp2 KO neurons relative to genomic DNA (n = 3). (e) Illustration of the experimental work-flow to study the RNA stability in KO and WT neurons (f) RNA stability of endogenous (in WT neurons) and viral (from the 5 different vectors described above in KO neurons) Mecp2 transcript determined by qRT-PCRs (n = 3, t = 300 min were normalized over t = 0 values and compared among different treatments). (g) RNA stability of viral (CBA-iMecp2-pUTR-pA) Mecp2 transcript in neurons derived from different genotypes: WT, KO and Mecp2+/- (Het) determined by qRT-PCRs (n = 3, t = 300 min were normalized over t = 0 values and compared among different treatments) (h) Illustration of the experimental work-flow to study translational efficiency. (i) qRT-PCR of viral and endogenous Mecp2 RNA in the ribosomal fraction normalized on the total RNA in WT and KO neurons (n = 4 endogenous Mecp2, n = 4 exogenous Mecp2 in KO neurons, n = 3 exogenous Mecp2 in WT neurons). (j) qRT-PCR of viral and endogenous Mecp2 RNA in the ribosomal fraction normalized on the total RNA in WT (n = 6) and KO neurons infected with 2 different viral Mecp2 construct with (CBA-iMecp2-pUTR-pA, n = 3) and without (CBA-iMecp2-pA, n = 3) the 3’-pUTR. Error bars, Standard Deviation (SD). **p<0.01, ***p<0.001, compared groups are indicated by black lines. ANOVA-one way, (b, f, g, i, j) and Tukey’s post hoc test. Scale bar: 100 µm (c).
