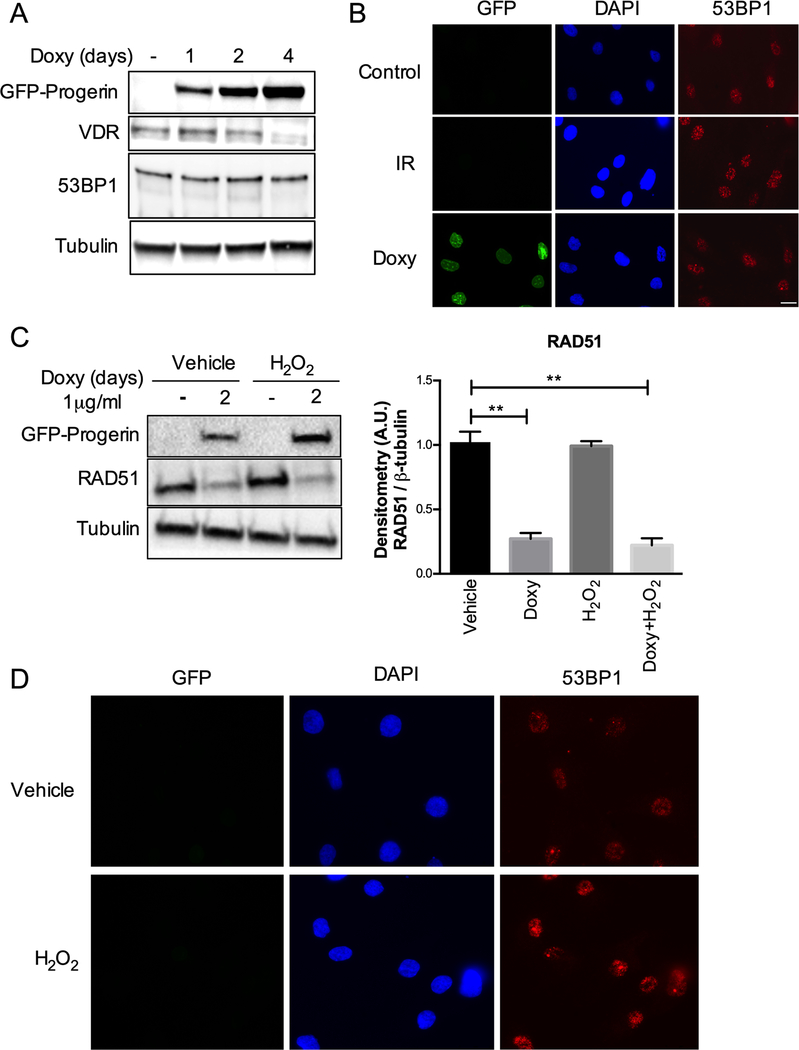
Figure 3. Effects of progerin on 53BP1 and of oxidative stress on RAD51.
(A) HDF-GFP-progerin cells induced to express progerin with Doxy for 1–4 days. The levels of VDR and 53BP1 are shown, with β-tubulin as loading control. Note the constant levels of 53BP1 upon progerin expression. (B) Immunofluorescence to monitor behavior of 53BP1. Control cells (not irradiated) show normal levels of 53BP1, which accumulate at foci of DNA damage upon ionizing radiation (IR). In progerin-expressing cells (Doxy), 53BP1 forms foci representing most likely recruitment of the protein to sites of DNA damage. (C) HDF-GFP-progerin cells treated with H2O2 and levels of RAD51 protein monitored by immunoblotting. Graph shows quantitation of densitometry of three biological repeats (average ± s.e.m.). Note the marked downregulation of RAD51 by doxycycline treatment (progerin expression) but not by H2O2 exposure. (D) Immunofluorescence in HDFs not expressing progerin but treated with H2O2 shows increased 53BP1 foci, consistent with oxidative stress causing DNA damage.

