

Abstract
Functional selectivity is the ligand-specific activation of certain signal transduction pathways at a receptor and has been described for G protein-coupled receptors. However, it has not yet been described for ligands interacting with integrins without αI domain. Here, we show by molecular dynamics simulations that four side chain-modified derivatives of tauroursodeoxycholic acid (TUDC), an agonist of α5β1 integrin, differentially shift the conformational equilibrium of α5β1 integrin towards the active state, in line with the extent of β1 integrin activation from immunostaining. Unlike TUDC, 24-nor-ursodeoxycholic acid (norUDCA)-induced β1 integrin activation triggered only transient activation of extracellular signal-regulated kinases and p38 mitogen-activated protein kinase and, consequently, only transient insertion of the bile acid transporter Bsep into the canalicular membrane, and did not involve activation of epidermal growth factor receptor. These results provide evidence that TUDC and norUDCA exert a functional selectivity at α5β1 integrin and may provide a rationale for differential therapeutic use of UDCA and norUDCA.
Subject terms: Computational biophysics, Integrins, Hepatocytes
Introduction
Functional selectivity is the ligand-specific activation of certain signal transduction pathways at a receptor that can signal through multiple pathways1. On the molecular level, a ligand likely achieves this type of differential activation by stabilizing only a specific subset of receptor conformations, in particular those that favor interactions with only a specific subset of downstream signaling molecules1. This phenomenon has so far been described in detail only for G protein-coupled receptors (GPCRs)2, but the observation that αMβ2 integrins respond differently to fibrinogen- and CD40L-binding has led to the suggestion that this model could be extended to integrins with an αI domain3,4. However, the phenomenon has not yet been described for ligands interacting with integrins lacking an αI domain. Furthermore, a direct connection between differentially ligand-induced integrin conformations and differences in signal transduction pathways downstream of the integrin has not yet been established.
We recently identified the hydrophilic bile acid tauroursodeoxycholic acid (TUDC) as a potent agonist of an α5β1 integrin-mediated signaling pathway towards choleresis5,8. α5β1 integrin is the predominant integrin isoform in the liver and lacks an αI domain6. After uptake into hepatocytes through the Na+/taurocholate cotransporting polypeptide (Ntcp), TUDC directly activates intracellular α5β1 integrins, followed by an activating phosphorylation of mitogen-activated protein kinases (MAPK) Erk-1/-2 and p38MAPK 5. These signaling events strongly resemble those initiated in response to hypoosmotic or insulin-induced hepatocyte swelling7–9. There, mechano/swelling-sensitive α5β1 integrins in the plasma membrane become activated and trigger FAK-/c-Src-/MAPK-dependent signaling towards choleresis with Bsep and Mrp2 insertion into the canalicular membrane7,10,11. Chemical modifications of the ursodeoxycholane scaffold in TUDC (Supplementary Fig. 1) either completely abolished activity on α5β1 integrin or led to a compound that inhibited the TUDC-induced β1 integrin activation (taurocholic acid (TC))5.
Here, we tested to what extent side chain-modified derivatives of TUDC (24-nor-ursodeoxycholic acid (norUDCA), its taurine conjugate (TnorUDCA), glycoursodeoxycholic acid (GUDC), and unconjugated UDCA; Supplementary Fig. 1) can directly activate α5β1 integrins and whether the signaling events downstream of integrin activation differ from those triggered by TUDC. To probe for differences in ligand-induced conformational changes in integrin at the atomistic level, we performed all-atom molecular dynamics (MD) simulations of α5β1 integrin bound to TUDC, norUDCA, TnorUDCA, GUDC, UDCA, or TC of, in total, 3.6 μs length. In parallel, we studied the extent to which norUDCA-, TnorUDCA-, GUDC-, or UDCA stimulate the activation of β1 integrins during perfusion of rat liver and compared the signaling events downstream of norUDCA-mediated integrin activation with TUDC-mediated integrin activation. Our results demonstrate that norUDCA directly activates α5β1 integrins in hepatocytes and provide evidence that TUDC and norUDCA exert a functional selectivity for certain signal transduction pathways in α5β1 integrin.
Results
In MD simulations norUDCA induces conformational changes in the α5β1 integrin headpiece that have been linked to integrin activation
We analyzed all-atom MD simulations of TUDC, norUDCA, TnorUDCA, GUDC, UDCA, and TC bound to the shallow crevice in the subunit interface of the ectodomain of α5β1 integrin for conformational changes in the headpiece region that govern integrin activation. We described these conformational changes by means of three geometric parameters: the kink angle in helix α1, the α7 tilt angle, and the β-propeller – βA domain distance (Figs. 1, 2; details in the Methods subsection “Analysis of MD trajectories”). For each complex, three replicates were simulated for 200 ns length to probe for the statistical significance and convergence of the simulation results (Fig. 1c–h). All systems were stable over the course of the simulation time, as demonstrated by the time courses of the root-mean-square deviation (RMSD) of the atomic positions in the βA domain and the full protein (Supplementary Fig. 2), as well as the domain-wise minimum, maximum and average RMSD values (Supplementary Table 1). MD simulations of TUDC- and TC-bound ectodomains served as references as they display the occurrence or absence of conformational changes when the ectodomain is bound to an activating or inhibitory bile acid, respectively5. Particularly, TUDC leads to a kink angle of helix α1 of 147.3 ± 0.1°, a tilt angle of helix α7 of 138.2 ± 0.1°, and a distance between the βA-domain and the β-propeller of 36.68 ± 0.01 Å, whereas TC leads to angles of 142.0 ± 0.1° and 126.6 ± 0.1°, respectively, and a distance of 35.77 ± 0.01 Å (Figs. 1c,h and 2c, Supplementary Table 2). norUDCA induces α1 kink and α7 tilt angles similar in magnitude as in the case of TUDC (149.2 ± 0.1° and 138.2 ± 0.1°, respectively), whereas the distance between β-propeller and βA-domain is ~0.6 Å smaller (Figs. 1d and 2a,c, Supplementary Table 2). These findings indicate that norUDCA can activate α5β1 in a similar manner as TUDC but with a lower efficacy. In comparison with norUDCA, for TnorUDCA- and GUDC-bound ectodomains, the α1 kink angle is decreased by ~6°, while the α7 tilt angle remains in the same range, being ~2° smaller. Furthermore, the β-propeller – βA domain distance is reduced by ~0.4 Å (Figs. 1e,f and 2c, Supplementary Table 2). Finally, for the UDCA-bound ectodomain, the α1 kink angle is 139.6 ± 0.1°, and the α7 tilt angle is 129.6 ± 0.1°; the β-propeller − βA domain distance is 35.80 ± 0.01 Å (Figs. 1g and 2c, Supplementary Table 2). These geometric parameters are more similar to those of TC than to those of any of the previously mentioned bile acids, indicating that UDCA, like TC5, cannot activate α5β1 integrins. Furthermore, by comparison, the above results for TnorUDCA- and GUDC indicate that the efficacy of these bile acids in activating α5β1 integrins is, at best, very weak. In all, the computational studies provide evidence that suggests that norUDCA can directly activate α5β1 integrins.
Figure 1.

Conformational changes in the α5β1 integrin headpiece. (a) Part of the α5β1 integrin headpiece in cartoon representation. Helices α1 and α7 are highlighted in orange and blue. The propeller-βA distance is measured between the respective centers of mass (pink circles). Colors of the domains are according to Supplementary Fig. 19B. (b) Close-up view of the βA domain with the docked TUDC structure (stick representation)5. This complex structure was used to generate other starting structures by modifying the bile acid. Angles measured during the course of the MD simulations: orange: α1 kink angle; blue: α7 tilt angle. Mg2+ ions are depicted as red spheres; the one at the MIDAS site is labeled M, the one at the ADMIDAS A. (c–h) α1 kink angle (orange), α7 tilt angle (blue), and propeller-βA distance (pink) during the course of three (color shades) MD simulations of each of the complexes between α5β1 integrin and (c) TUDC, (d) norUDCA, (e) TnorUDCA, (f) GUDC, (g) UDCA, and (h) TC. For clarity, the time course data (left) has been smoothed by Bezier curves. Relative frequencies of the parameters (right) are calculated for the last 100 ns of each simulation. The frequency distributions have been overlaid with Gaussians according to their means and standard deviations (black curves).
Figure 2.

Activation of α5β1 integrins in MD simulations compared to activation of αIIbβ3 integrin in crystal structures. (a) Structural overlay of the βA domain (transparent: starting structure; opaque: closest-to-average structure from the last 100 ns) by fitting on the β-propeller domain5. Pink arrows denote the positional shift of the βA domain relative to the β-propeller domain, resulting in an increased propeller-βA domain distance. (b) Overlay of the closed (lighter colors; PDB ID 3FCS) and open (darker colors; PDB ID 3FCU) conformations of the βA domain in αIIbβ3 integrins. Straightening of the α1 helix (orange) and tilting of the α7 helix (blue) are indicated by white arcs and bars. (c) Average of the α1 kink angle (yellow), α7 tilt angle (blue), and β-propeller – βA-domain distance (magenta) over three replicates of MD simulations versus the rank of the bile acids according to their agonist activity towards α5β1 integrin as observed in Fig. 3A-D and ref. 5. Dashed lines represent correlation lines; fit parameters are given in the figures. Vertical lines separate the dataset into inactive (left), weakly active (middle), and highly active (right) bile acids.
norUDCA activates β1 integrins in perfused rat liver
In isolated perfused rat liver, addition of norUDCA at a concentration of ≥ 20 µmol/l induces the appearance of the active conformation of β1 integrin after 15 min, whereas in the absence of norUDCA, active β1 integrin was only scarcely detectable (Fig. 3a). As described for TUDC5, β1 integrin activation was predominantly observed inside the hepatocyte (Fig. 3a, Supplementary Fig. 3). In contrast, active β1 integrin was only weakly detectable with TnorUDCA (≥ 20 µmol/l) and GUDC ( ≥ 20 µmol/l) (Fig. 3b,c). Perfusion with UDCA ( ≥ 20 µmol/l) induces a stronger appearance of the active conformation of β1 integrin than do TnorUDCA and GUDC (Fig. 3d). None of the bile acids had any effect on the immunostaining for total α5β1 integrins (Fig. 3e).
Figure 3.

Effect of norUDCA, TnorUDCA, GUDC, and UDCA on β1 integrin activation. Rat livers were perfused with (a) norUDCA, (b) TnorUDCA, (c) GUDC, and (d) UDCA for up to 60 min with the concentrations indicated. Liver samples were immunostained for the active conformation of β1 integrin (red). The scale bar corresponds to 50 µm. Representative pictures of at least three independent experiments are depicted. To enhance visibility of the images, the white point of all channels in the RGB color space was reduced from the standard value of 255 to a value of 128. For each image, pixel intensities are indicated as average ± SEM. NorUDCA and TnorUDCA triggered activation of the β1 integrin subunit within 15 min, with stronger effects observed with norUDCA. In contrast, equimolar concentrations of UDCA and GUDC were ineffective. Like TUDC (Fig. 4)5, norUDCA-induced β1 integrin activation occurred primarily in the intracellular compartment of hepatocytes. (e) Staining of total α5β1 integrin (red) and filamentous actin labeled with FITC-coupled phalloidin (green) at t = 0 min and t = 15 min after perfusion with norUDCA, TUDC, GUDC, and UDCA.
TUDC induces a stronger appearance of active β1 integrin than norUDCA
We compared the effect of norUDCA at 20 µmol/l in inducing the appearance of the active conformation of β1 integrin in isolated perfused rat liver to that of TUDC at equimolar concentration as a known activator of α5β1 integrin (Fig. 4)5. Whereas TUDC induced a pronounced and significant β1 integrin activation within 5 min, as shown by a β1 integrin fluorescence intensity of 906 ± 43% relative to unstimulated control, norUDCA activated β1 integrins with a lower effect (β1 integrin fluorescence intensity of 203 ± 10% relative to unstimulated control). After 5 and 15 min, β1 integrin fluorescence intensity was significantly higher in the presence of TUDC than in the presence of norUDCA. After 15 min, norUDCA-induced β1 integrin activation was 510% ± 116% of baseline (Fig. 4).
Figure 4.

Immunofluorescence staining and quantification of β1 integrin. (a) Rat livers were perfused with either norUDCA or TUDC (20 µmol/l each) for up to 15 min and immunostained for the active β1 integrin conformation and actin as given under “Experimental Procedures”. The scale bar corresponds to 20 µm. Representative pictures of three independent experiments are depicted. (b) β1 integrin fluorescence was quantified by using ImageJ analysis software. Whereas TUDC induced β1 integrin activation within 5 min, norUDCA activated β1 integrins with lower effect. *p < 0.05 denotes statistical significance compared with the unstimulated control; #p < 0.05 statistical significance between norUDCA and TUDC perfusion.
norUDCA induces integrin-dependent signaling cascades similar to TUDC
Like TUDC5, norUDCA (20 µmol/l) induced within 5 min phosphorylation of extracellular signal-regulated kinases Erk-1/-2, which was abolished in the presence of the RGD motif-containing hexapeptide GRGDSP (10 µmol/l) but not in the presence of the inactive control hexapeptide GRADSP (10 µmol/l) (Figs. 5 and 6). Erk-1/-2 phosphorylation due to norUDCA did not increase when phosphatases were inhibited by okadaic acid (5 nmol/l), in contrast to TUDC-induced Erk-1/-2 phosphorylation (Supplementary Fig. 4). norUDCA also increased activation of p38MAPK and the activating Src phosphorylation at tyrosine 418 in an RGD hexapeptide-sensitive way (Fig. 5, Supplementary Fig. 5). PP-2 (250 nmol/l)12, an inhibitor of Src kinase, largely abolished the norUDCA-induced Erk-1/-2 and p38MAPK activation (Fig. 5, Supplementary Fig. 6). Thus, norUDCA signaling to both Erk-1/-2 and p38MAPK involves integrins and Src. In order to examine a possible involvement of PI3-K in norUDCA-induced signaling, the specific inhibitor wortmannin (100 nmol/l) was preperfused. norUDCA-induced activation of Erk-1/2 was largely suppressed when wortmannin was present (Fig. 5, Supplementary Fig. 6). In contrast, activation of Src and p38MAPK was not inhibited by wortmannin (Fig. 5, Supplementary Fig. 6). These findings indicate that Src phosphorylation is upstream of PI3-K activation and that PI3-K is not involved in the signaling towards p38MAPK activation. In control perfusion experiments without addition of norUDCA, no effect on the phosphorylation of Erks, p38MAPK, or Src at tyrosine 418 was found (Supplementary Fig. 7). Next, we examined whether already the initial signaling pathways that usually follow integrin activation are differentially affected by TUDC or norUDCA. Perfusion with TUDC (20 µmol/l) induced a significant integrin-mediated FAKY397 autophosphorylation after 10 min (1.87 ± 0.24-fold amount of FAKY397-P) that lasted for up to 30 min compared to livers perfused with normoosmotic medium (Supplementary Fig. 8). In contrast, perfusion with norUDCA (20 µmol/l) led to an only transient FAKY397 autophosphorylation that was maximal after 5 min (1.73 ± 0.35-fold amount of FAKY397-P). Similar findings were obtained for other FAK phosphorylation sites, i.e. FAKY407, FAKY576/577, FAKY861, and FAKY925 (Supplementary Fig. 9).
Figure 5.

norUDCA-induced activation of Erk-1/-2, p38MAPK and Src. Rat livers were perfused with norUDCA (20 µmol/l) for up to 60 min. Liver samples were taken at the time points indicated. The integrin antagonistic peptide (GRGDSP, 10 µmol/l), the inactive control peptide (GRADSP, 10 µmol/l), the PI3-K inhibitor wortmannin (100 nmol/l), and the Src inhibitor PP-2 (250 nmol/l) were added 30 min prior to the addition of norUDCA. Activation of Erk-1/-2, p38MAPK and c-Src was analyzed by (a,b) Western blot using specific antibodies and (c,d) subsequent densitometric analysis. Total Erk-1/-2, total p38MAPK, and total c-Src served as respective loading control. Phosphorylation at t = 0 min was arbitrarily set as 1. Densitometric analyses (means ± SEM) and representative blots of at least three independent perfusion experiments are shown. *p < 0.05 statistical significance compared with the unstimulated control. #p < 0.05 statistical significance between norUDCA in the absence and presence of an inhibitor. norUDCA led to a significant activation of Erk-1/-2, p38 MAPK as well as c-Src in the perfused rat liver, which was inhibited by GRGDSP, whereas GRADSP had no effect. Phosphorylation of Erk-1/-2, p38MAPK, and c-Src was sensitive to PP-2, whereas wortmannin inhibited Erk-1/2 and c-Src activation. Blots were cropped to focus on the area of interest, and full-length blots are presented in Supplementary Figs. 5 and 6.
Figure 6.

Comparison between norUDCA- and TUDC-induced Erk-1/-2, p38MAPK and EGFR activation. Rat livers were perfused with norUDCA or TUDC (20 µmol/l each) for up to 60 min as described in “Experimental Procedures”. Liver samples were taken at the time points indicated. Phosphorylation of Erk-1/-2, p38MAPK, and EGFR tyrosine residues Tyr845, Tyr1045, and Tyr1173 was analyzed by (a) Western blot using specific antibodies and (b) subsequent densitometric analysis (black squares, norUDCA; gray squares, TUDC). Total Erk-1/-2, total p38MAPK, and total EGFR served as respective loading controls. Phosphorylation at t = 0 was arbitrarily set to 1. Data represent the mean (mean ± SEM) of at least three independent experiments; *p < 0.05 statistical significance compared with the unstimulated control. #p < 0.05 statistical significance between norUDCA and TUDC. Blots were cropped to focus on the area of interest, and full-length blots are presented in Supplementary Figure 10. TUDC led to activation of Erk-1/-2, p38MAPK, and EGFR, as indicated by phosphorylation of the EGFR tyrosine residues Tyr845 and Tyr1173. norUDCA induced a transient Erk-1/-2 phosphorylation and a weak p38MAPK activation. No EGFR activation was observed in norUDCA-perfused livers.
norUDCA does not induce epidermal growth factor receptor (EGFR)-dependent amplification of Erk-1/-2 and p38MAPK signaling
Dual activation of Erk-1/-2 and p38MAPK is involved in the stimulation of canalicular secretion by TUDC. In contrast to TUDC, the effect of norUDCA on Erk-1/-2 phosphorylation was transient and disappeared largely within 30 min of norUDCA exposure (Fig. 6, Supplementary Fig. 10). After 15 min, norUDCA-triggered p38MAPK activation was also significantly lower than TUDC-induced phosphorylation of p38MAPK (Fig. 6, Supplementary Fig. 10). Whereas TUDC induced phosphorylation of the EGFR tyrosine residues 845 and 1173, but not of Tyr1045 (Fig. 6, Supplementary Fig. 10), in line with previous data5, no activating phosphorylation of EGFR occurred in the presence of norUDCA (Fig. 6, Supplementary Fig. 10). TUDC-induced EGFR trans-activation requires an EGFR/c-Src association following Src activation. Compared to the TUDC-triggered Src activation, the norUDCA-induced activation of Src was significantly lower (Fig. 7, Supplementary Fig. 11). Immunoprecipitation studies of perfused liver samples revealed that EGFR/c-Src association was absent in norUDCA-perfused livers (Fig. 7, Supplementary Fig. 11).
Figure 7.
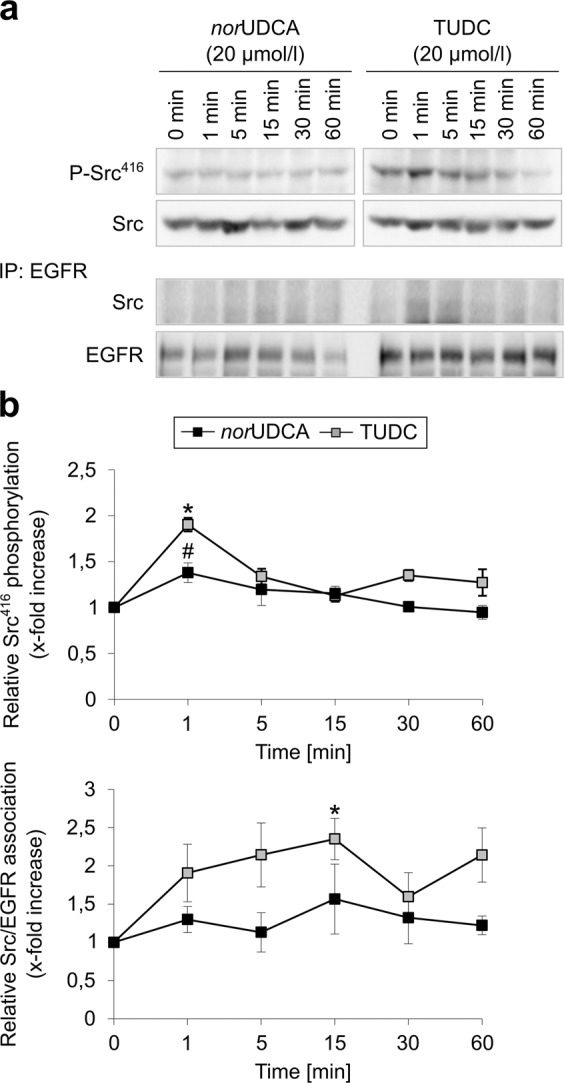
Comparison between norUDCA- and TUDC-induced c-Src activation and EGFR/c-Src association. Rat livers were perfused with norUDCA or TUDC (20 µmol/l each) for up to 60 min. Liver samples were taken at the time points indicated. Activation of c-Src was analyzed by (a) Western blot using specific antibodies and (b) subsequent densitometric analysis. Total c-Src served as respective loading control. EGFR was immunoprecipitated as described under “Experimental Procedures”. Samples were then analyzed for EGFR/c-Src association by detection of c-Src. Total EGFR served as a loading control. Phosphorylation at t = 0 min was set as 1. Densitometric analyses (means ± SEM) and representative blots of at least three independent perfusion experiments are shown. *p < 0.05 statistical significance compared with the unstimulated control. #p < 0.05 statistical significance between norUDCA and TUDC. Blots were cropped to focus on the area of interest, and full-length blots are presented in Supplementary Figure 11. TUDC led to a significantly more intense phosphorylation of c-Src and EGFR/c-Src association than norUDCA.
TUDC-induced dual activation of Erk-1/-2 and p38MAPK, and Bsep insertion into the canalicular membrane, are dependent on EGFR phosphorylation
The choleretic action of TUDC is largely due to an Erk-1/-2- and p38MAPK-dependent insertion of the intracellularly stored canalicular transporters Bsep and Mrp210,13 downstream of EGFR activation. The inhibitor of EGFR tyrosine kinase activity, AG1478, to a large extent abolished the TUDC-induced Erk-1/-2 and p38MAPK activation (Fig. 8, Supplementary Fig. 12). Immunofluorescence stains of the canalicular bile salt transporter Bsep as well as the tight junction complex protein ZO-1, which delineates the bile canaliculi, were analyzed by CLSM and a densitometric analysis procedure11,14–16. In liver tissue, ZO-1 is arranged along two lines, and canalicular transporters within the canalicular membrane are located between these lines (see Supplementary Fig. 13). During control conditions, Bsep was located predominantly in the canalicular membrane (Supplementary Fig. 13). Densitometric analysis after perfusion with TUDC (20 µmol/l) revealed significantly different Bsep fluorescence profiles already after 5 min (Fig. 8)10 (p < 0.05; F-test for differences in peak heights and variances of Gaussian fits to the data sets) and a narrowing of the fluorescence signal by 0.4 ± 0.04 µm, i.e., by ~30%, (determined from the difference in the full width at half maximum (FWHM) values of the fitted Gaussians) after 30 min. Like Erk-1/-2 and p38MAPK activation, Bsep insertion into the canalicular membrane was also inhibited by AG1478 (Fig. 8, FWHMt=0 min: 1.48 ± 0.03 µm vs. FWHMt=30 min: 1.51 ± 0.03 µm). ZO-1 immunostaining did not change under any condition (see Supplementary Fig. 13).
Figure 8.

TUDC-induced dual activation of Erk-1/-2 and p38MAPK and Bsep insertion into the canalicular membrane are dependent on EGFR phosphorylation. Rat livers were perfused with TUDC (20 µmol/l) for up to 60 min. When indicated, AG1478 (1 µmol/l) was added 30 min prior to TUDC to the perfusate. (a) Phosphorylation of Erk-1/-2 and p38MAPK was analyzed by use of specific antibodies. Total Erk-1/-2 or p38MAPK, respectively, served as loading controls. (b) Western blots were analyzed densitometrically. Phosphorylation level at t = 0 min was set to 1. Representative blots and statistics (mean ± SEM) of at least three independent perfusion experiments are shown. TUDC induced a significant increase in Erk-1/-2 and p38MAPK phosphorylation (*p < 0.05), which was significantly inhibited by AG1478 (#p < 0.05). (c) Cryosections from perfused rat liver were immunostained for Bsep and ZO-1 (see Supplementary Fig. 13), fluorescence images were recorded by confocal LSM (see Supplementary Fig. 13), and analyzed densitometrically. Blots were cropped to focus on the area of interest, and full-length blots are presented in Supplementary Figure 12. Under control conditions (black, t = 0 min), Bsep is largely localized between the linear ZO-1, but is also found inside the cells. Addition of TUDC (blue, t = 5 min; red, t = 30 min) results in the insertion of intracellular Bsep into the canalicular membrane, which was inhibited by AG1478. The fluorescence profiles depicted are statistically significantly (p < 0.05) different from each other with respect to variance and peak height.
norUDCA induces a transient insertion of Bsep into the canalicular membrane
TUDC has been shown to increase the capacity for TC excretion into bile10,17. As shown in Fig. 9, norUDCA (20 µmol/l) increased bile flow and stimulated a transient TC excretion within the first 10 min of perfusion, whereas the TUDC observed stimulation of TC excretion was prolonged10. Bsep is responsible for the bile salt-dependent bile flow and transports, among others, conjugates of cholic acid (CA) and chenodeoxycholic acid (CDCA), and the bile acid deoxycholic acid (DCA). In addition, it secretes ursodeoxycholic acid (UDCA) and its conjugates into bile18. Most of the Bsep immunofluorescence was found between the parallel rows of ZO-1 staining under control conditions, which indicates that Bsep is localized in the canalicular membrane. However, even under control conditions, there was some punctate Bsep staining in the cytosol, mainly in the subcanalicular region, suggestive for the presence of Bsep-containing vesicles inside the cell (Fig. 9). Addition of norUDCA (20 µmol/l) results within 5 min in the disappearance of intracellular Bsep, and Bsep staining was almost exclusively found in the canaliculi (Fig. 9). This is reflected in the fluorescence profile, which shows a significant increase in canalicular Bsep fluorescence intensity after 5 min of norUDCA addition (Fig. 9); in contrast to TUDC-induced Bsep insertion (Fig. 8), the increase vanished after 30 min, and a punctuated intracellular Bsep staining reappeared (Fig. 9). These findings suggest a norUDCA-induced transient translocation and insertion of intracellular Bsep into the canalicular membrane. In contrast, norUDCA has no effect on the distribution of the basolateral transporter Ntcp (see Supplementary Fig. 14). Subcellular Ntcp distribution in control and norUDCA (20 µmol/l)-perfused livers was analyzed and quantified by CLSM and densitometric fluorescence intensity analysis as described in the Methods section. For labeling of the plasma membrane, liver sections were stained with a specific antibody against the plasma membrane marker protein Na+/K+-ATPase. The immunofluorescence analysis shows that there was no obvious change in Ntcp and Na+/K+-ATPase distribution at the basolateral membrane within 30 min (see Supplementary Fig. 14).
Figure 9.

norUDCA induced increased bile flow and TC excretion in perfused rat liver. (a) Livers were preperfused in the presence of 10 µmol/l [3H]TC. Data are given as mean ± SEM from four different experiments. After a pre-perfusion period of 20 min, norUDCA (20 µmol/l) was added for 30 min. norUDCA increased bile flow over the complete perfusion period and excretion of TC within the first 10 min of perfusion. (b) Cryosections from perfused rat liver were immunostained for Bsep and ZO-1, fluorescence images were recorded by confocal LSM, and analyzed densitometrically. Representative pictures of at least three independent experiments are depicted. The scale bar corresponds to 5 µm. Under control conditions (black, t = 0 min), Bsep is largely localized between the linear ZO-1, but is also found inside the cells (white arrows). norUDCA (red, t = 5 min) led to the insertion of intracellular Bsep into the canalicular membrane. The fluorescence profiles depicted are statistically significantly (p < 0.05) different from each other with respect to variance and peak height. Under control conditions, ZO-1 fluorescence profiles show two peaks. Liver perfusion experiments with norUDCA resulted in no significant changes of ZO-1 fluorescence profiles with respect to the distance of the peaks and the variance of fluorescence profiles. Means ± SEM of 30 measurements in each of at least three individual experiments for each condition are shown.
TC inhibits norUDCA-induced α5β1 integrin activation
TC at a concentration of 100 µmol/l had no β1 integrin-activating activity but interfered with TUDC-induced α5β1 integrin activation5. Similarly, when norUDCA was added on top of TC (100 µmol/l), active β1 integrin was barely detectable in isolated perfused rat liver (Supplementary Fig. 15). This indicates that TC interferes with norUDCA-induced α5β1 integrin activation.
TUDC and norUDCA bind directly to α5β1 integrin with similar affinities
Inhibition (i.e., IC50 values) of α5β1 integrin binding to immobilized fibronectin by TUDC and norUDCA was determined using a standardized, competitive ELISA-based assay19 and Cilengitide20 as a control. TUDC and norUDCA showed similar IC50 values in the low millimolar range (Table 1, Supplementary Fig. 16), demonstrating a similar binding affinity of both compounds and confirming that the observed activation of α5β1 integrin results from direct binding of the bile acids to the MIDAS site in the integrin head group.
Table 1.
Affinities of TUDC and norUDCA and the control peptide towards the RGD-recognizing integrin α5β1 obtained from an ELISA-like solid-phase binding assay.
| Compound | Sequence | IC50a |
|---|---|---|
| TUDC | — | 4.01 (1.80…8.98)b |
| norUDCA | — | 3.93 (1.34…11.5)b |
| Control peptide Cilengitide | c(Arg-Gly-Asp-d-Phe-NMe-Val) | 15.4 (14.49…16.36)c |
aThe IC50 values were obtained from a sigmoidal fit to two independent data rows (serial dilutions). The 95% confidence interval is given in brackets.
bIn mM.
cIn nM.
Discussion
In this study, we addressed the question to what extent side chain-modified derivatives of TUDC (norUDCA, TnorUDCA, GUDC, UDCA) can directly activate α5β1 integrin and whether the signaling events downstream of integrin activation differ from those triggered by TUDC.
Applying all-atom MD simulations, the potential activity of norUDCA, TnorUDCA, GUDC, and UDCA was assessed on the basis of three geometric parameters, and compared to that of TUDC and TC investigated previously5,7. The geometric parameters were derived from crystal structures of the closed (PDB: 3FCU) and open (PDB: 3FCS) αIIbβ3 integrin headpiece (Fig. 2b)21, as well as based on previous simulation results5: the α1 kink angle, the α7 tilt angle and the propeller-βA distance. Although the crystal structure of the open α5β1 headpiece has remained elusive, it is likely that the conformational changes involved in α5β1 integrin activation are very similar to those observed for other integrin subtypes (Supplementary Fig. 17)22,23. Among the six bile acids tested, TUDC- and norUDCA-bound structures displayed on average significantly higher values for all three geometric parameters (Fig. 2, Supplementary Table 3). TnorUDCA- and GUDC-bound integrin displayed a larger α1 kink angle and, especially, α7 tilt angle than integrin bound to UDCA and TC but the propeller-βA distance was similar among all four of these bile acids. Hence, we classified TUDC and norUDCA as highly activating, TnorUDCA and GUDC as weakly activing, and UDCA and TC as inactive or inhibitory ligands, respectively. Note that larger conformational changes in the α5β1 integrin ectodomain, which have been linked to integrin activation21,23–25, cannot be expected to be observed during our sub-μs long MD simulations compared to integrin activation times in vivo26,27.
To evaluate the robustness of the predictions from our MD simulations, we correlated the mean values of the three geometric parameters measured in each triplet of MD simulations against the rank of the bile acids in terms of their activity (Fig. 2), as deduced from the amount of immunostained, active β1 integrin induced by the respective bile acid (Fig. 3). Accordingly, TUDC is the most active bile acid, followed by norUDCA, TnorUDCA, GUDC, UDCA, and TC. We obtained significant correlations between the average α1 kink angle (R2 = 0.66, p = 0.05), or the α7 tilt angle (R2 = 0.83, p = 0.01), and the rank (Fig. 2). Thus, the set of geometric parameters used for the analysis of the MD simulations was not only capable to distinguish between active and inactive bile acids but also captured more subtle differences in the activities. Therefore, in future studies, such MD simulations might serve as a “computational assay” to test potential candidate molecules for their ability to activate α5β1 integrin.
As predicted by MD simulations, norUDCA caused a dose-dependent activation of α5β1 integrins in hepatocytes (Fig. 3a), and this dose-dependent activation is weaker than the one observed with TUDC (Fig. 4a)5: While after addition of TUDC the active conformation of the β1 integrin subunit becomes markedly visible within 1 min, norUDCA reaches a similar extent of β1 integrin activation after 15 min (Figs. 3a and 4a). A standardized, competitive ELISA-based solid-phase assay revealed that TUDC and norUDCA directly bind to the MIDAS site in the integrin head group, confirming that the observed activation of α5β1 integrin results from direct binding of the bile acids, and that the binding affinities of both compounds are similar (Table 1, Supplementary Fig. 16). The latter finding, together with using for TUDC and norUDCA the same concentrations in all experiments, rules out that the different extent of activation of α5β1 integrin by the bile acids is caused by differential occupation of the binding site. The low affinities of both compounds are concordant with the fact that the compounds do not activate α5β1 integrin when located in the plasma membrane; extracellular TUDC and norUDCA concentrations in the perfusion experiments were at most 50 μM. Ntcp-transfected HepG2 cells stimulated with a TUDC concentration of 100 μM do not show active β1 integrin in the cell membrane either5. In contrast, intracellular bile acid concentrations can reach single digit mM concentrations, as estimated from intracellular bile acid contents for hepatocyte cultures28 or rat hepatoma cells29. The uncertainty in estimating intracellular bile acid concentrations is reflected, however, in that measurements of bile acid concentrations in human liver tissue30 together with those of intracellular water space in rat liver31 yielded bile acid concentrations about one order of magnitude smaller than the IC50 values. Finally, with respect to whether the low affinities might be indicative of non-specific binding, note that both RGD peptides and TC inhibit TUDC-induced activation of α5β1 integrin and the signal transduction pathways following integrin activation5. Here, we show that this also applies to norUDCA-induced activation of α5β1. We consider particularly the inhibitory effect of TC with respect to TUDC a consequence of competitive antagonism at the MIDAS because we find it difficult to grasp how two bile acids with very similar structures could cause opposing effects via nonspecific mechanisms.
Although the results of our MD simulations indicate that norUDCA is less potent than TUDC with respect to direct α5β1 integrin activation, additional kinetic reasons may contribute as well to this difference. norUDCA, unlike TUDC, is not readily taken up into the hepatocyte via Ntcp or other transport systems32, and the transbilayer transport rate of norCDCA, an epimer of norUDCA, is six-fold higher than of CDCA33, suggesting that norUDCA is passively transported across the sinusoidal membrane. Slow, passive sinusoidal uptake would then be opposed by a fast, active outward transport by a canalicular transporter, presumably Mrp234–37. Depending on the rates, this situation might prevent concentrating norUDCA inside the hepatocyte. For TUDC, a concentrative uptake into the hepatocyte was proposed as a likely requirement for α5β1 integrin activation5.
TUDC-mediated integrin activation is followed by a sustained dual activation of Erks and p38MAPK, which is the crucial downstream signaling event towards choleresis10,17. Such a sustained activation of Erks also occurs with lower and higher concentrations (10 µmol/l and 50 µmol/l) of TUDC (Supplementary Fig. 18), rendering a concentration effect unlikely. norUDCA also induced a similar but only transient dual activation of these MAPKs, which was sensitive to integrin inhibition by an RGD motif-containing hexapeptide (Figs. 5a,b and 6b, Supplementary Figs. 5, 6, 10). This transient MAPK activation might be a consequence of the weaker activation of α5β1 shown above. As norUDCA-induced Erk-1/-2 phosphorylation was not amplified when phosphatases were inhibited with okadaic acid (Supplementary Fig. 4), it is unlikely that the transient MAPK activation by norUDCA is mediated via activation of phosphatases. In this context, note that perfusion with TUDC caused a significant EGFR/c-Src association after 15 min (Fig. 7, Supplementary Fig. 11). By contrast, such an association was not observed following perfusion with norUDCA (Fig. 7, Supplementary Fig. 11). Taken together, our results thus suggest that a c-Src-dependent trans-activation of the EGFR is central for a sustained MAPK activation. At first glance, the suggested sustainer role of EGFR appears contradicted by the observation that AG1478, a selective inhibitor of EGFR tyrosine kinase activity38, abolished the TUDC-induced phosphorylation of Erk and p38MAPK (Fig. 8, Supplementary Fig. 12): If EGFR activation only sustained Erk activation, EGFR inhibition should not decrease the extent of TUDC-mediated Erk activation, but only change its time course. However, AG1478 treatment has been shown to compromise basal levels of EGFR phosphorylation39, and such a basal EGFR activity was suggested to be required for proper MAPK signaling40.
In line with the transient or sustained character of norUDCA-mediated and TUDC-mediated MAPK activation, respectively, norUDCA induced only a transient insertion of intracellular Bsep into the canalicular membrane, whereas TUDC-induced insertion of Bsep was sustained (Figs. 8 and 9). In line with this, norUDCA only transiently increased TC excretion into bile (Fig. 9a). However, as expected, norUDCA increased bile flow in a sustained way due to norUDCA excretion into bile and induction of a bicarbonate-rich hypercholeresis41,42. Dual activation of Erks and p38MAPK is required for the TUDC-induced stimulation of Bsep insertion into the canalicular membrane10. In line with this, inhibition of EGFR tyrosine kinase activity by AG1478 prevented Bsep insertion during perfusion with TUDC (Fig. 8c), again suggesting that (at least basal) EGFR activity is an essential requirement for dual MAPK signaling towards choleresis.
Inhibition of PI3-K by wortmannin abolished the norUDCA-induced phosphorylation of Erks, but not of p38MAPK, while inhibition of c-Src by PP-2 abolished phosphorylation of Erks and p38MAPK, suggesting that c-Src activation lies upstream of PI3-K activation. The PI3-K/Ras/Erk pathway has been described as essential for the choleretic effect of TUDC43. Whether c-Src directly activates PI3-K44, or indirectly via EGFR, was not addressed in this study. An earlier study suggested that genistein-sensitive tyrosine kinases such as EGFR are not involved in the activation of the PI3-K/Ras/Erk pathway by TUDC43. However, whether the Ras/Erk pathway becomes PI3-K-dependent also depends on the extent of EGFR activation45.
Notably, in an earlier study with TUDC7, inhibition of c-Src did not prevent Erk-1/-2 activation, but only delayed it by ~8 min. Hence, in view of the above results, inhibition of c-Src activity by PP-2 seems to prevent Erk-1/-2 activation only when norUDCA is used as an integrin agonist. Based on our and literature data, we therefore suggest the following ligand-dependent selectivity for signaling pathways induced by α5β1 integrin (Fig. 10): One of the first steps in integrin-mediated signaling is the recruitment of focal adhesion kinase (FAK)46 and its subsequent autophosphorylation, an event also observed during TUDC-mediated activation of α5β1 integrin7. Levels of autophosphorylated FAK (FAKY397-P) were shown to increase linearly with the amount of fibronectin-bound (i.e. active, signaling-competent) α5β147. Thus, a highly efficacious integrin activation as observed with TUDC5 would result in high FAKY397-P levels, whereas a less efficacious integrin activation as observed with norUDCA (this study) would result in lower FAKY397-P levels, as confirmed by densitometric analysis (Supplementary Fig. 8). FAKY397-P activates c-Src48,49, which in turn phosphorylates EGFR, and both the activated c-Src and EGFR mediate PI3-K activation48,50 and subsequent phosphorylation of Erk-1/-2. However, FAKY397-P can also directly activate PI3-K, independent of c-Src and the EGFR48. We now speculate that this direct, FAK-mediated activation of PI3-K is slower than the c-Src and EGFR-mediated PI3-K activation, and that only high FAKY397-P levels trigger this slow pathway. Hence, even when c-Src activity is inhibited by PP-2, a highly efficacious integrin activation by TUDC would lead to a pronounced FAK autophosphorylation and rescue Erk-1/-2 phosphorylation via a direct PI3-K activation, albeit with a time delay, as observed previously7. In contrast, a less efficacious integrin activation by norUDCA would lead to less FAK autophosphorylation and, thus, require activated c-Src in order to switch on the then necessary PI3-K signal to activate Erk-1/-2, which would occur more rapidly (this study). According to this model, inhibition of EGFR activity by AG1478 should not abolish the Erk response, if TUDC-mediated PI3-K activation occurred via the slow pathway. Regarding the above observation that AG1478 did abolish the TUDC-induced phosphorylation of Erk and p38MAPK, we can only speculate at present that apparently (at least a basal) EGFR activity is required for PI3-K to properly function in this pathway, although the details of this interplay remain elusive.
Figure 10.
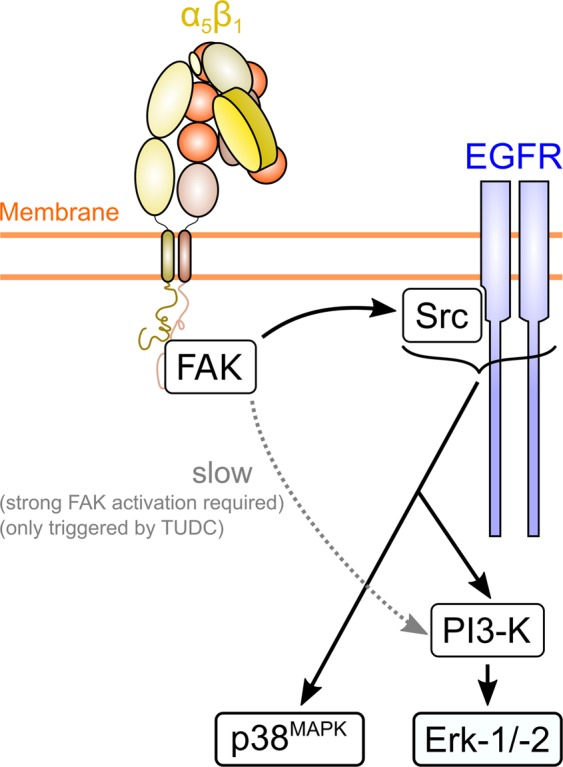
Model of α5β1 integrin activation-dependent differential bile acid signaling. Activation of α5β1 integrin with the less efficacious norUDCA results in the formation of FAKY397-P, which leads to c-Src- and PI3-K-dependent Erk-1/2 activation. When α5β1 integrin is activated by the more efficacious TUDC, higher levels of FAKY397-P result, which, in addition, trigger a slower activation of Erk-1/-2 via PI3-K in a c-Src-independent manner7.
Taken together, we demonstrated - to our knowledge for the first time - that norUDCA directly activates α5β1 integrins in hepatocytes and triggers short-term choleresis via a transient activation of MAPKs followed by a transient insertion of Bsep into the canalicular membrane in addition to the known bicarbonate-rich hypercholeresis. Furthermore, we provide evidence that TUDC and norUDCA exert a functional selectivity for certain signal transduction pathways in α5β1 integrin, a property – to our knowledge – not yet described for ligands interacting with integrins lacking an αI domain3. This functional selectivity may also provide a rationale for the differential therapeutic use of UDCA (which in vivo is rapidly conjugated to TUDC) and norUDCA (which is resistant to amidation with taurine) in primary biliary cholangitis (PBC) and primary sclerosing cholangitis (PSC), respectively42. Although both compounds trigger hypercholeresis, the underlying mechanisms are different. TUDC induces choleresis by stimulating hepatocellular bile acid secretion, whereas norUDCA induces a bicarbonate-rich hypercholeresis by cholehepatic shunting, but has no effect on hepatocellular bile acid secretion41,51. This may explain why norUDCA is superior to UDCA in the treatment of sclerosing cholangitis in Mdr2 knockout mice52.
Materials and Methods
Materials
The materials used were purchased as follows: Ocadaic acid was from Enzo Life Sciences (Lörrach, Germany). PP-2, H-Gly-Arg-Gly-Asp-Ser-Pro-OH (GRGDSP), and H-Gly-Arg-Ala-Asp-Ser-Pro-OH (GRADSP) were from Merck-Millipore (Darmstadt, Germany), FITC-coupled phalloidin, collagenase, insulin, and TUDC from Sigma Aldrich (Munich, Germany), penicillin/streptomycin and Fluoromount-G from Tocris/Biozol (Eching, Germany), fetal bovine serum (FBS) from Life Technologies GmbH (Darmstadt, Germany), cOmpleteTM protease inhibitor cocktail tablets and PhosSTOPTM phosphatase inhibitor cocktail tablets were from Roche Diagnostics (Mannheim, Germany) and William’s Medium E from Biochrom (Berlin, Germany). norUDCA was kindly provided by Dr. Falk Pharma (Freiburg, Germany). The Bsep antibody (K24)53 and the Ntcp antibody (K4)54 were generous gifts from Prof. Dr. B. Stieger (Kantonsspital Zürich, Switzerland). Antibodies recognizing zona occludens-1 (ZO-1, #33–9100), phospho-EGFR Tyr845 (#44–784), phospho-EGFR Tyr1173 (#44–794 G), and c-Src (#44–656) were from Life Technologies GmbH (Darmstadt, Germany). The antibodies raised against the α5β1 integrin dimer (AB1950) and the β1 integrin subunit active conformation (#MAB2079Z), phospho-Erk-1/-2 (#9106), phospho-p38MAPK (#9211), p38MAPK (#9228), phospho-EGFR Tyr1045 (#2237), phospho-Src-Tyr418 (#2101), phospho-FAK Tyr925 (#3284), and phospho-FAK Tyr576/577 (#3281) were from Cell Signaling Technology, Inc. (Danvers, USA), against Erk-1/-2 (#06–182), EGFR (#06–847, Western blot, WB), Na+/K+-ATPase (#05–369), Cy3-conjugated donkey anti-rabbit IgG (#AP182C), and FITC-conjugated donkey anti-mouse IgG (#AP192C) from Merck-Millipore (Darmstadt, Germany). The antibody against EGFR (sc-03) for immunoprecipitation (IP) studies was from Santa Cruz Biotechnology (Heidelberg, Germany). The polyclonal antibodies against phospho-FAK Tyr397 (#44–650 G), phospho-FAK Tyr407 (#44–624 G) and phospho-FAK Tyr861 (#44–626 G) were purchased from Thermo Fischer Scientific (Waltham, Massachusetts, USA). The monoclonal antibody against glyceraldehyde-3-phosphate dehydrogenase (GAPDH) was from Biodesign International (Saco, Maine, USA). Horseradish peroxidase-conjugated anti-mouse IgG (#1706516) and anti-rabbit IgG (#1721019) were from Bio-Rad Laboratories (Munich, Germany) and Dako (Hamburg, Germany). All other chemicals were from Merck-Millipore (Darmstadt, Germany) at the highest quality available.
Generation of α5β1 integrin-bile acid complex structures and molecular dynamics simulations
A detailed description of how the starting structures for the MD simulations of α5β1 integrin bound to either TUDC, norUDCA, TnorUDCA, GUDC, UDCA, or TC were generated and how MD simulations of in total 3.6 µs length of these systems were performed is provided in the Supplementary Text.
Analysis of trajectories from molecular dynamics simulations
MD trajectories were visually inspected for conformational changes in VMD55. Conformational changes that may result in integrin activation were evaluated based on three geometric parameters (Fig. 1a,b): Straightening of the α1 helix, tilting of the α7 helix, and the distance between the β-propeller domain in the α-subunit and the βA domain in the β-subunit. Straightening of the α1 helix was monitored through an increase of its kink angle (Fig. 1b). During αIIbβ3 integrin activation, this angle increases from ~144° to ~166°, as observed in crystal structures of the closed (PDB: 3FCU) and open (PDB: 3FCS) integrin21. Tilting of α7 was measured as the angle between the three points 1) ion at the “Adjacent to MIDAS” (ADMIDAS) site, 2) center of mass of the Cα atoms of the first four residues of the α7 helix, and 3) center of mass of the Cα atoms of the last four residues of the α7 helix (Fig. 1B). Upon activation of αIIbβ3 integrins, the α7 helix pivots laterally56 (increase of the α7 tilt angle from ~128° to ~133°), accompanied by a marked increase of B-factors in the region of the α7 helix23 (Supplementary Fig. 17). A larger tilt angle of the α7 helix thus represents a defined, activating conformational change, as does the observation of a higher helix mobility, which is required for subsequent steps in integrin activation. Finally, the distance of the centers of mass of the propeller domain in the α subunit and the βA domain in the β subunit was measured, as it had been shown to increase during TUDC-induced α5β1 integrin activation5. All MD trajectory analyses were performed using the programs ptraj from AmberTools 1.5 or cpptraj from AmberTools1357.
Liver perfusion
Livers from male Wistar rats (140–160 g) were perfused in a non-recirculating manner as described previously58. As a perfusion medium, the bicarbonate-buffered Krebs-Henseleit saline plus l-lactate (2.1 mmol/l) and pyruvate (0.3 mmol/l) gassed with 5% CO2 and 95% O2 at 37 °C was used (305 mosmol/l, normoosmotic). Inhibitors and bile acids were added to the influent perfusate by dissolution into the Krebs-Henseleit buffer. Viability of the perfused livers was assessed by measuring lactate dehydrogenase leakage into the perfusate. The portal pressure, the effluent K+ concentration, and pH were continuously monitored. In bile formation experiments, livers were perfused with 10 μmol/l [3H] taurocholate (1 μCi/l). Bile was collected at intervals of 2 min. Bile flow was assessed by gravimetry, assuming a specific mass of 1 g/ml. Taurocholate excretion into bile was determined by liquid scintillation counting of the radioactivity present in bile, based on the specific radioactivity of [3H] taurocholate in influent perfusate. To wash out endogenously formed bile acids and obtain a steady-state TC excretion, livers were preperfused for 20 min before experimental maneuvers were started. All experiments were approved by the responsible local authorities of the “Zentrale Einrichtung für Tierforschung und wissenschaftliche Tierschutzaufgaben” (ZETT) of the University of Düsseldorf and the “Landesamt für Natur, Umwelt und Verbraucherschutz Nordrhein-Westfalen” (LANUV, NRW) (file number: 84.02-04.2012A214). We confirm that all experiments were performed in accordance with relevant guidelines and regulations.
Immunofluorescence staining
Immunofluorescence staining was performed as described before5,16 (see Supplementary Text for a detailed protocol).
Densitometric fluorescence intensity analysis
(see Supplementary Text for a detailed protocol).
Immunoblot analysis
Immunoblot analysis was performed as described before16 (see Supplementary Text for a detailed protocol).
Immunoprecipitation
Immunoprecipitation was performed as described before16 (see Supplementary Text for a detailed protocol).
Integrin binding assay
The affinity and selectivity of bile acid derivatives were determined by a solid-phase binding assay applying a previously described protocol19 that involves coated extracellular matrix proteins and soluble integrins. Cilengitide20 (c(f(NMe)VRGD) (α5β1: IC50 = 15.4 nM) was used as internal standard. Flat-bottomed 96-well ELISA plates (BRAND, Wertheim, Germany) were coated overnight at 4 °C with ECM protein (1) (100 μL per well) in carbonate buffer (15 mM Na2CO3, 35 mM NaHCO3, pH 9.6). Each well was then washed with PBS-T buffer (phosphate-buffered saline/Tween 20, 137 mM NaCl, 2.7 mM KCl, 10 mM Na2HPO4, 2 mM KH2PO4, 0.01% Tween 20, pH 7.4; 3 × 200 µL) and blocked for 1 h at room temperature (RT) with TS-B buffer (Tris-saline/bovine serum albumin (BSA) buffer, 20 mM Tris-HCl, 150 mM NaCl, 1 mM CaCl2, 1 mM MgCl2, 1 mM MnCl2, pH 7.5, 1% BSA; 150 μL/well). Meanwhile, a dilution series of the compound and internal standard was prepared in an extra plate, ranging from 66 mM to 58 µM. After washing the assay plate three times with PBS-T (200 μL), 50 μL aliquots of the dilution series were transferred to each well from B-G in six appropriate concentrations. Well A was filled with 100 μL of TS-B buffer (blank), and well H was filled with 50 μL of TS-B buffer. Then, 50 μL of a solution of human integrin (2) in TS-B buffer was transferred to wells H–B and incubated for 1 h at RT. The plate was washed three times with PBS-T buffer, and then primary antibody (3) (100 μL per well) was added to the plate. After incubation for 1 h at RT, the plate was washed three times with PBS-T. Then, secondary peroxidase-conjugated antibody (4) (100 µL/well) was added to the plate and incubated for 45 min at RT. The plate was then washed three times with PBS-T, developed by the addition of SeramunBlau (50 μL/well, Seramun Diagnostic GmbH, Heidesee, Germany) and incubated for approx. 1 min at RT in the dark. The reaction was stopped with 3 M H2SO4 (50 µL/well), and the absorbance was measured at 450 nm with a plate reader (infinite M200 Pro, TECAN). The IC50 value (with 95% confidence interval) of each compound resulted from a sigmoidal fit to 32 data points, obtained from two serial dilution rows, by using the GraphPad Prism software package. All IC50 values determined were referenced to the affinity of the internal standard.
0.5 μg mL−1, human fibronectin, Sigma-Aldrich.
2.0 μg mL−1, human α5β1-integrin, R&D.
1.0 μg mL−1, mouse anti-human CD49e, BD Biosciences.
2.0 μg mL−1, anti-mouse IgG-POD, Sigma-Aldrich.
Statistical analysis
Statistical analysis of the data from MD simulations was performed in R59. Mean values and their respective standard errors were computed using the last 100 ns of each simulation. The statistical significance of differences in simulation means was assessed by Student’s t-test. p < 0.05 was considered statistically significant.
As to experimental work, unless stated otherwise in the respective subsections of the Materials and Methods section, results from at least three independent experiments are expressed as mean values ± SEM. n refers to the number of independent experiments. Differences between experimental groups were analyzed by Student’s t-test, one-way analysis of variance following Dunnett’s multiple comparison post hoc test, or two-way analysis of variance following Bonferroni’s multiple comparison post hoc test where appropriate (GraphPad Prism; GraphPad, La Jolla, USA; Microsoft Excel for Windows). p < 0.05 was considered statistically significant.
Supplementary information
Acknowledgements
We are grateful for computational support by the “Zentrum für Informations und Medientechnologie” at the Heinrich Heine University and the computing time provided by the John von Neumann Institute for Computing (NIC) to H.G. on the supercomputer JURECA at Jülich Supercomputing Centre (JSC) (user ID: HKF7). The authors thank Nicole Eichhorst and Janina Thies for their expert technical assistance. This study was supported by the German Research Foundation (Deutsche Forschungsgemeinschaft, DFG) through the Collaborative Research Center SFB 974 (‘Communication and Systems Relevance during Liver Damage and Regeneration’, Düsseldorf) and the Clinical Research Group KFO 217 (‘Hepatobiliary Transport in Health and Disease’, Düsseldorf). Funding by Deutsche Forschungsgemeinschaft (DFG) (INST 208/704–1 FUGG) to purchase the hybrid computer cluster used in this study is gratefully acknowledged.
Author contributions
M.B. performed MD simulations, analyzed data, wrote manuscript; A.S. performed experiments, analyzed data, wrote manuscript; N.Q. performed experiments, analyzed data; B.G. performed experiments, analyzed data; B.S.L. performed affinity determination, analyzed data; H.K. analyzed affinity data; H.G. designed study, analyzed data, wrote manuscript; D.H. designed study, analyzed data, wrote manuscript.
Data availability
All data generated or analyzed during this study are included in this published article (and its Supplementary Information file).
Competing interests
The authors declare no competing interests.
Footnotes
Publisher’s note Springer Nature remains neutral with regard to jurisdictional claims in published maps and institutional affiliations.
These author contributed equally: Michele Bonus and Annika Sommerfeld.
Contributor Information
Holger Gohlke, Email: gohlke@uni-duesseldorf.de.
Dieter Häussinger, Email: haeussin@uni-duesseldorf.de.
Supplementary information
is available for this paper at 10.1038/s41598-020-62326-y.
References
- 1.Urban JD, et al. Functional selectivity and classical concepts of quantitative pharmacology. J. Pharmacol. Exp. Ther. 2007;320:1–13. doi: 10.1124/jpet.106.104463. [DOI] [PubMed] [Google Scholar]
- 2.Violin JD, Lefkowitz RJ. Beta-arrestin-biased ligands at seven-transmembrane receptors. Trends Pharmacol. Sci. 2007;28:416–422. doi: 10.1016/j.tips.2007.06.006. [DOI] [PubMed] [Google Scholar]
- 3.Simon DI. Opening the field of integrin biology to “biased agonism”. Circ. Res. 2011;109:1199–1201. doi: 10.1161/CIRCRESAHA.111.257980. [DOI] [PMC free article] [PubMed] [Google Scholar]
- 4.Wolf D, et al. Binding of CD40L to Mac-1’s I-domain involves the EQLKKSKTL motif and mediates leukocyte recruitment and atherosclerosis–but does not affect immunity and thrombosis in mice. Circ. Res. 2011;109:1269–1279. doi: 10.1161/CIRCRESAHA.111.247684. [DOI] [PMC free article] [PubMed] [Google Scholar]
- 5.Gohlke H, Schmitz B, Sommerfeld A, Reinehr R, Häussinger D. α5β1-integrins are sensors for tauroursodeoxycholic acid in hepatocytes. Hepatology. 2013;57:1117–1129. doi: 10.1002/hep.25992. [DOI] [PubMed] [Google Scholar]
- 6.Volpes R, van den Oord JJ, Desmet VJ. Integrins as differential cell lineage markers of primary liver tumors. Am. J. Pathol. 1993;142:1483–1492. [PMC free article] [PubMed] [Google Scholar]
- 7.Häussinger D, et al. Involvement of Integrins and Src in Tauroursodeoxycholate-Induced and Swelling-Induced Choleresis. Gastroenterology. 2003;124:1476–1487. doi: 10.1016/S0016-5085(03)00274-9. [DOI] [PubMed] [Google Scholar]
- 8.Schliess F, Reissmann R, Reinehr R, vom Dahl S, Häussinger D. Involvement of Integrins and Src in Insulin Signaling toward Autophagic Proteolysis in Rat Liver. J. Biol. Chem. 2004;279:21294–21301. doi: 10.1074/jbc.M313901200. [DOI] [PubMed] [Google Scholar]
- 9.vom Dahl S, et al. Involvement of Integrins in Osmosensing and Signaling toward Autophagic Proteolysis in Rat Liver. J. Biol. Chem. 2003;278:27088–27095. doi: 10.1074/jbc.M210699200. [DOI] [PubMed] [Google Scholar]
- 10.Kurz, A. K., Graf, D., Schmitt, M., vom Dahl, S. & Häussinger, D. Tauroursodesoxycholate-Induced Choleresis Involves p38(MAPK) Activation and Translocation of the Bile Salt Export Pump in Rats. Gastroenterology121, 407–419, gast.2001.26262 (2001). [DOI] [PubMed]
- 11.Schmitt M, Kubitz R, Lizun S, Wettstein M, Häussinger D. Regulation of the Dynamic Localization of the Rat Bsep Gene-Encoded Bile Salt Export Pump by Anisoosmolarity. Hepatology. 2001;33:509–518. doi: 10.1053/jhep.2001.22648. [DOI] [PubMed] [Google Scholar]
- 12.Hanke JH, et al. Discovery of a novel, potent, and Src family-selective tyrosine kinase inhibitor. Study of Lck- and FynT-dependent T cell activation. J. Biol. Chem. 1996;271:695–701. doi: 10.1074/jbc.271.2.695. [DOI] [PubMed] [Google Scholar]
- 13.Beuers U, et al. Tauroursodeoxycholic acid inserts the apical conjugate export pump, Mrp2, into canalicular membranes and stimulates organic anion secretion by protein kinase C-dependent mechanisms in cholestatic rat liver. Hepatology. 2001;33:1206–1216. doi: 10.1053/jhep.2001.24034. [DOI] [PubMed] [Google Scholar]
- 14.Kubitz, R., D’Urso, D., Keppler, D. & Häussinger, D. Osmodependent Dynamic Localization of the Multidrug Resistance Protein 2 in the Rat Hepatocyte Canalicular Membrane. Gastroenterology113, 1438–1442, gast.1997.v113.pm9352844 (1997). [DOI] [PubMed]
- 15.Cantore M, Reinehr R, Sommerfeld A, Becker M, Häussinger D. The Src Family Kinase Fyn Mediates Hyperosmolarity-Induced Mrp2 and Bsep Retrieval from Canalicular Membrane. J. Biol. Chem. 2011;286:45014–45029. doi: 10.1074/jbc.M111.292896. [DOI] [PMC free article] [PubMed] [Google Scholar]
- 16.Sommerfeld A, Mayer PGK, Cantore M, Häussinger D. Regulation of Plasma Membrane Localization of the Na+-Taurocholate Cotransporting Polypeptide (Ntcp) by Hyperosmolarity and Tauroursodeoxycholate. J. Biol. Chem. 2015;290:24237–24254. doi: 10.1074/jbc.M115.666883. [DOI] [PMC free article] [PubMed] [Google Scholar]
- 17.Schliess F, Kurz AK, vom Dahl S, Häussinger D. Mitogen-Activated Protein Kinases Mediate the Stimulation of Bile Acid Secretion by Tauroursodeoxycholate in Rat Liver. Gastroenterology. 1997;113:1306–1314. doi: 10.1053/gast.1997.v113.pm9322526. [DOI] [PubMed] [Google Scholar]
- 18.Stieger B. Recent insights into the function and regulation of the bile salt export pump (ABCB11) Curr. Opin. Lipidol. 2009;20:176–181. doi: 10.1097/MOL.0b013e32832b677c. [DOI] [PubMed] [Google Scholar]
- 19.Bochen A, et al. Biselectivity of isoDGR peptides for fibronectin binding integrin subtypes alpha5beta1 and alphavbeta6: conformational control through flanking amino acids. J. Med. Chem. 2013;56:1509–1519. doi: 10.1021/jm301221x. [DOI] [PubMed] [Google Scholar]
- 20.Mas-Moruno C, Rechenmacher F, Kessler H. Cilengitide: the first anti-angiogenic small molecule drug candidate design, synthesis and clinical evaluation. Anticancer Agents Med. Chem. 2010;10:753–768. doi: 10.2174/187152010794728639. [DOI] [PMC free article] [PubMed] [Google Scholar]
- 21.Zhu J, et al. Structure of a Complete Integrin Ectodomain in a Physiologic Resting State and Activation and Deactivation by Applied Forces. Mol. Cell. 2008;32:849–861. doi: 10.1016/j.molcel.2008.11.018. [DOI] [PMC free article] [PubMed] [Google Scholar]
- 22.Van Agthoven JF, et al. Structural basis for pure antagonism of integrin αVβ3 by a high-affinity form of fibronectin. Nat. Struct. Mol. Biol. 2014;21:383–388. doi: 10.1038/nsmb.2797. [DOI] [PMC free article] [PubMed] [Google Scholar]
- 23.Zhu J, Zhu J, Springer TA. Complete integrin headpiece opening in eight steps. J. Cell Biol. 2013;201:1053–1068. doi: 10.1083/jcb.201212037. [DOI] [PMC free article] [PubMed] [Google Scholar]
- 24.Puklin-Faucher E, Vogel V. Integrin activation dynamics between the RGD-binding site and the headpiece hinge. J. Biol. Chem. 2009;284:36557–36568. doi: 10.1074/jbc.M109.041194. [DOI] [PMC free article] [PubMed] [Google Scholar]
- 25.Puklin-Faucher E, Gao M, Schulten K, Vogel V. How the headpiece hinge angle is opened: New insights into the dynamics of integrin activation. J. Cell Biol. 2006;175:349–360. doi: 10.1083/jcb.200602071. [DOI] [PMC free article] [PubMed] [Google Scholar]
- 26.Puklin-Faucher E, Sheetz MP. The mechanical integrin cycle. J. Cell Sci. 2009;122:179–186. doi: 10.1242/jcs.042127. [DOI] [PMC free article] [PubMed] [Google Scholar]
- 27.Craig D, Gao M, Schulten K, Vogel V. Structural insights into how the MIDAS ion stabilizes integrin binding to an RGD peptide under force. Structure. 2004;12:2049–2058. doi: 10.1016/j.str.2004.09.009. [DOI] [PubMed] [Google Scholar]
- 28.Nakazawa T, Hoshino M, Hayakawa T, Tanaka A, Ohiwa T. Vasopressin reduces taurochenodeoxycholate-induced hepatotoxicity by lowering the hepatocyte taurochenodeoxycholate content. J. Hepatol. 1996;25:739–747. doi: 10.1016/s0168-8278(96)80247-9. [DOI] [PubMed] [Google Scholar]
- 29.Agellon LB, Torchia EC. Intracellular transport of bile acids. Biochim. Biophys. Acta. 2000;1486:198–209. doi: 10.1016/s1388-1981(00)00057-3. [DOI] [PubMed] [Google Scholar]
- 30.Setchell KD, et al. Bile acid concentrations in human and rat liver tissue and in hepatocyte nuclei. Gastroenterology. 1997;112:226–235. doi: 10.1016/s0016-5085(97)70239-7. [DOI] [PubMed] [Google Scholar]
- 31.vom Dahl S, Hallbrucker C, Lang F, Häussinger D. Regulation of cell volume in the perfused rat liver by hormones. Biochem. J. 1991;280(Pt 1):105–109. doi: 10.1042/bj2800105. [DOI] [PMC free article] [PubMed] [Google Scholar]
- 32.König J, Klatt S, Dilger K, Fromm MF. Characterization of Ursodeoxycholic and Norursodeoxycholic Acid as Substrates of the Hepatic Uptake Transporters OATP1B1, OATP1B3, OATP2B1 and NTCP. Basic Clin. Pharmacol. Toxicol. 2012;111:81–86. doi: 10.1111/j.1742-7843.2012.00865.x. [DOI] [PubMed] [Google Scholar]
- 33.Ko J, et al. Effects of side chain length on ionization behavior and transbilayer transport of unconjugated dihydroxy bile acids: a comparison of nor-chenodeoxycholic acid and chenodeoxycholic acid. J. Lipid Res. 1994;35:883–892. [PubMed] [Google Scholar]
- 34.Jedlitschky G, et al. ATP-dependent transport of bilirubin glucuronides by the multidrug resistance protein MRP1 and its hepatocyte canalicular isoform MRP2. Biochem. J. 1997;327(Pt 1):305–310. doi: 10.1042/bj3270305. [DOI] [PMC free article] [PubMed] [Google Scholar]
- 35.Kamisako T, et al. Transport of monoglucuronosyl and bisglucuronosyl bilirubin by recombinant human and rat multidrug resistance protein 2. Hepatology. 1999;30:485–490. doi: 10.1002/hep.510300220. [DOI] [PubMed] [Google Scholar]
- 36.Cui Y, et al. Drug resistance and ATP-dependent conjugate transport mediated by the apical multidrug resistance protein, MRP2, permanently expressed in human and canine cells. Mol. Pharmacol. 1999;55:929–937. [PubMed] [Google Scholar]
- 37.Denk GU, et al. Conjugation is essential for the anticholestatic effect of NorUrsodeoxycholic acid in taurolithocholic acid-induced cholestasis in rat liver. Hepatology. 2010;52:1758–1768. doi: 10.1002/hep.23911. [DOI] [PubMed] [Google Scholar]
- 38.Norris RP, Freudzon M, Nikolaev VO, Jaffe LA. Epidermal growth factor receptor kinase activity is required for gap junction closure and for part of the decrease in ovarian follicle cGMP in response to LH. Reproduction. 2010;140:655–662. doi: 10.1530/REP-10-0288. [DOI] [PMC free article] [PubMed] [Google Scholar]
- 39.Rubio I, et al. Ras activation in response to phorbol ester proceeds independently of the EGFR via an unconventional nucleotide-exchange factor system in COS-7 cells. Biochem. J. 2006;398:243–256. doi: 10.1042/BJ20060160. [DOI] [PMC free article] [PubMed] [Google Scholar]
- 40.Berger C, Krengel U, Stang E, Moreno E, Madshus IH. Nimotuzumab and cetuximab block ligand-independent EGF receptor signaling efficiently at different concentrations. J. Immunother. 2011;34:550–555. doi: 10.1097/CJI.0b013e31822a5ca6. [DOI] [PubMed] [Google Scholar]
- 41.Hofmann AF, et al. Novel biotransformation and physiological properties of norursodeoxycholic acid in humans. Hepatology. 2005;42:1391–1398. doi: 10.1002/hep.20943. [DOI] [PubMed] [Google Scholar]
- 42.Trauner M, et al. Potential of nor-Ursodeoxycholic Acid in Cholestatic and Metabolic Disorders. Dig. Dis. 2015;33:433–439. doi: 10.1159/000371904. [DOI] [PubMed] [Google Scholar]
- 43.Kurz AK, et al. Phosphoinositide 3-kinase-dependent Ras activation by tauroursodesoxycholate in rat liver. Biochem. J. 2000;350(Pt 1):207–213. doi: 10.1042/bj3500207. [DOI] [PMC free article] [PubMed] [Google Scholar]
- 44.Kim N-G, Gumbiner BM. Adhesion to fibronectin regulates Hippo signaling via the FAK-Src-PI3K pathway. J. Cell Biol. 2015;210:503–515. doi: 10.1083/jcb.201501025. [DOI] [PMC free article] [PubMed] [Google Scholar]
- 45.Sampaio C, et al. Signal Strength Dictates Phosphoinositide 3-Kinase Contribution to Ras/Extracellular Signal-Regulated Kinase 1 and 2 Activation via Differential Gab1/Shp2 Recruitment: Consequences for Resistance to Epidermal Growth Factor Receptor Inhibition. Mol. Cell. Biol. 2008;28:587–600. doi: 10.1128/MCB.01318-07. [DOI] [PMC free article] [PubMed] [Google Scholar]
- 46.Clark EA, Brugge JS. Integrins and signal transduction pathways: the road taken. Science. 1995;268:233–239. doi: 10.1126/science.7716514. [DOI] [PubMed] [Google Scholar]
- 47.García AJ, Boettiger D. Integrin-fibronectin interactions at the cell-material interface: initial integrin binding and signaling. Biomaterials. 1999;20:2427–2433. doi: 10.1016/S0142-9612(99)00170-2. [DOI] [PubMed] [Google Scholar]
- 48.Mitra SK, Hanson DA, Schlaepfer DD. Focal adhesion kinase: in command and control of cell motility. Nature Reviews Molecular Cell Biology. 2005;6:56–68. doi: 10.1038/nrm1549. [DOI] [PubMed] [Google Scholar]
- 49.Huveneers S, Danen EHJ. Adhesion signaling - crosstalk between integrins, Src and Rho. J. Cell Sci. 2009;122:1059–1069. doi: 10.1242/jcs.039446. [DOI] [PubMed] [Google Scholar]
- 50.Shah BH, Neithardt A, Chu DB, Shah FB, Catt KJ. Role of EGF receptor transactivation in phosphoinositide 3-kinase-dependent activation of MAP kinase by GPCRs. J. Cell. Physiol. 2006;206:47–57. doi: 10.1002/jcp.20423. [DOI] [PubMed] [Google Scholar]
- 51.Yoon YB, et al. Effect of side-chain shortening on the physiologic properties of bile acids: hepatic transport and effect on biliary secretion of 23-nor-ursodeoxycholate in rodents. Gastroenterology. 1986;90:837–852. doi: 10.1016/0016-5085(86)90859-0. [DOI] [PubMed] [Google Scholar]
- 52.Fickert P, et al. 24-norUrsodeoxycholic Acid is Superior to Ursodeoxycholic Acid in the Treatment of Sclerosing Cholangitis in Mdr2 (Abcb4) Knockout Mice. Gastroenterology. 2006;130:465–481. doi: 10.1053/j.gastro.2005.10.018. [DOI] [PubMed] [Google Scholar]
- 53.Noe J, Stieger B, Meier PJ. Functional expression of the canalicular bile salt export pump of human liver. Gastroenterology. 2002;123:1659–1666. doi: 10.1053/gast.2002.36587. [DOI] [PubMed] [Google Scholar]
- 54.Stieger B, et al. In situ localization of the hepatocytic Na+/Taurocholate cotransporting polypeptide in rat liver. Gastroenterology. 1994;107:1781–1787. doi: 10.1016/0016-5085(94)90821-4. [DOI] [PubMed] [Google Scholar]
- 55.Humphrey W, Dalke A, Schulten K. VMD: visual molecular dynamics. J. Mol. Graphics. 1996;14(33-38):27–38. doi: 10.1016/0263-7855(96)00018-5. [DOI] [PubMed] [Google Scholar]
- 56.Xiao T, Takagi J, Coller BS, Wang J-H, Springer TA. Structural basis for allostery in integrins and binding to fibrinogen-mimetic therapeutics. Nature. 2004;432:59–67. doi: 10.1038/nature02976. [DOI] [PMC free article] [PubMed] [Google Scholar]
- 57.Roe DR, Cheatham TE., III. PTRAJ and CPPTRAJ: Software for Processing and Analysis of Molecular Dynamics Trajectory Data. J. Chem. Theory Comput. 2013;9:3084–3095. doi: 10.1021/ct400341p. [DOI] [PubMed] [Google Scholar]
- 58.Sies H. The use of perfusion of liver and other organs for the study of microsomal electron-transport and cytochrome P-450 systems. Methods Enzymol. 1978;52:48–59. doi: 10.1016/S0076-6879(78)52005-3. [DOI] [PubMed] [Google Scholar]
- 59.R: A language and environment for statistical computing (R Foundation for Statistical Computing, Vienna, Austria, 2010).
Associated Data
This section collects any data citations, data availability statements, or supplementary materials included in this article.
Supplementary Materials
Data Availability Statement
All data generated or analyzed during this study are included in this published article (and its Supplementary Information file).