

Abstract
Tracing the history of molecular changes in coronaviruses using phylogenetic methods can provide powerful insights into the patterns of modification to sequences that underlie alteration to selective pressure and molecular function in the SARS-CoV (severe acute respiratory syndrome coronavirus) genome. The topology and branch lengths of the phylogenetic relationships among the family Coronaviridae, including SARS-CoV, have been estimated using the replicase polyprotein. The spike protein fragments S1 (involved in receptor-binding) and S2 (involved in membrane fusion) have been found to have different mutation rates. Fragment S1 can be further divided into two regions (S1A, which comprises approximately the first 400 nucleotides, and S1B, comprising the next 280) that also show different rates of mutation. The phylogeny presented on the basis of S1B shows that SARS-CoV is closely related to MHV (murine hepatitis virus), which is known to bind the murine receptor CEACAM1. The predicted structure, accessibility and mutation rate of the S1B region is also presented. Because anti-SARS drugs based on S2 heptads have short half-lives and are difficult to manufacture, our findings suggest that the S1B region might be of interest for anti-SARS drug discovery.
Can phylogeneticists and bioinformaticians help virologists to tackle SARS-CoV (severe acute respiratory syndrome coronavirus)? Phylogenetic methodology has progressed almost beyond recognition in the past decade and the study of phylogenetic relationships among species is now a valuable source of information in a variety of biological fields. The widespread use of a reliable statistical formalisation in phylogenetic and bioinformatic studies is necessary to extract the maximum information from sequence data [1].
1. Models of virus evolution
Recent work, although reporting impressive insights into the mechanisms of pathogenesis of SARS-CoV, has assessed the phylogeny of proteins of this virus using overly simple algorithms 2, 3. The distance methods used to assess SARS-CoV phylogeny present several disadvantages. First, by converting a sequence alignment to pairwise distances we necessarily lose some of the evolutionary information contained within the analysed sequences [1]. Second, distance methods are known to compromise the accuracy of estimates of evolutionary divergence, which are fundamental to understanding the rate and mode of viral evolution. Third, there are no known methods to test evolutionary models and estimated trees produced using the pairwise distance methodology [1].
Here we use state-of-the-art phylogenetic methods to analyse all the available coronaviridae and SARs-CoV sequence datasets to gain an insight into the origin and evolution of SARS-CoV and to narrow down the list of potential regions of its genome that might be interesting targets for drug design.
The statistically most robust method that can be used to achieve these aims is to consider the phylogenetic inference problem in a likelihood framework, using a valid model of evolution for viral genomes [1]. The choice of such a model for single-stranded RNA virus genomes is difficult. A parametric model, based on chemical or biological properties of RNA, might underestimate or completely miss important unknown constraints; for example, packaging of single-stranded RNA genomes that requires interaction with coat proteins [4]. An alternative approach is to use empirical models that are generated through comparisons of observed sequences; for example, simply counting apparent replacements between closely related sequences. Given that sequence databases are biased towards mammalian and bacterial DNA sequences, there are relatively few coding single-stranded RNA sequences to be aligned, and non-coding RNA sequences, such as rRNA or tRNA, might be subjected to different selective (e.g. structural) constraints. Because the proteins encoded by RNA genes might be subjected to functional constraints in a similar manner to non-viral proteins, it might be better to use empirical amino acid substitution models that describe the probability of fixation of amino acid changes rather than RNA models. Furthermore, relative to primary structure, the secondary structure of homologous proteins persists long after any statistically significant sequence similarity has vanished; sequences with 25% amino acid identity probably have the same secondary structure [5]. Amino acid models of evolution that incorporate protein structural information perform better than simple amino acid models [6]. Moreover, selection pressures act on protein function, which in turn is closely related to structure. Therefore, incorporating structure information into evolutionary analysis can assist in incorporating selective constraints. Here, the programme Passml-TM, which implements protein secondary structure-based models of evolution, has been used for analyses 7, 8. The first undertaking is the determination and rooting of the coronavirus phylogeny, that is, the putative origin of the sequences of interest.
2. Rooting the Coronaviridae and SARS-CoV phylogenies
A large fraction (∼70%) of the SARS-CoV genome encodes a replicase polyprotein, which has significant sequence homology to all of the replicase polyproteins that have been sequenced to date from the order Nidovirales (comprising the Coronavirus, Torovirus, Okavirus and Arterivirus genera). Therefore, this protein is a good choice for investigating the phylogenetic relationships among the family Coronaviridae. Viral sequences have high mutation rates and, consequently, alignments are usually difficult to prepare. Here, ClustalW is applied using standard parameters [9], followed by careful refinement of the alignments both by eye and by using the protein secondary structural information for each nidovirus sequence as predicted by PHD (http://cubic.bioc.columbia.edu/predictprotein/) [10] and PSI-PRED (http://bioinf.cs.ucl.ac.uk/psipred) [11]. Figure 1 shows the maximum likelihood tree produced using a set of homologous replicases from five SARS-CoV strains, 12 other coronaviruses representing both groups 1 and 2 of the genus 2, 3, one torovirus (Breda virus) and one okavirus [yellow head (YH) virus], which were determined to most closely represent the consensus coronavirus sequence by a PSI-Blast search [12]. The coronavirus sequences allow the determination of the root of the SARS-CoV strains, whereas the torovirus and okavirus sequences provide insights into the rooting of the family Coronaviridae phylogeny, which is closer to group 1 than group 2 of the Coronavirus genus.
Figure 1.
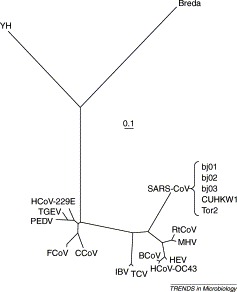
Maximum likelihood tree produced using Passml-TM [7] based on the replicase proteins from members of of the order Nidovirales, comprising 17 coronaviruses [from group 1: human coronavirus 229E (HCoV-229E), porcine epidemic diarrhea virus (PEDV), porcine transmissible gastroenteritis virus (TGEV), canine coronavirus (CCoV) and feline coronavirus (FCoV); from group 2: bovine coronavirus (BCoV), rat coronavirus (RtCoV), murine hepatitis virus (MHV), human coronavirus OC43 (HCoV-OC43) and porcine hemagglutinating encephalomyelitis virus (HEV); intermediate between groups 1 and 2: avian infectious bronchitis virus (IBV) and turkey coronavirus (TCV); and SARS-CoVs from strains Tor2, bj01, bj02, bj03 and CUHKW1], one torovirus (Breda) and one okavirus (yellow head virus, YH). The scale bar indicates evolutionary divergence corresponding to a mean of 0.1 amino acid replacements per site.
As found previously by Marra et al. [2] and Rota et al. [3], the root of SARS-CoV is closer to coronavirus group 2. All SARS-CoV strains are almost completely identical in sequence (∼99% DNA sequence homology) and therefore it is not possible to get any meaningful phylogeny within the SARS-CoV group. The avian infectious bronchitis virus (IBV), which causes respiratory disease in chickens, and the turkey virus (TCV), which causes enteric disease, are clustered together; their ancestor divides groups 1 and 2 of the mammal-infecting coronaviruses. The close clustering of the chicken and turkey viruses suggests that the difference between enteric and respiratory tropisms might require only a few amino acid changes. Experiments have shown that just two point mutations in the spike (S) glycoprotein can change porcine transmissible gastroenteritis coronavirus (TGEV), a mostly enteric virus that can kill piglets, into a non-deadly virus that excels at the respiratory route but replicates poorly in the gut 13, 14, 15. To infect enteric tract cells with TGEV, two different domains of the S protein of TGEV, mapping to between amino acids 522 and 744 and close to amino acid 219, are involved [13]. The first domain binds to aminopeptidase N (pAPN); many viruses use co-receptors, and it is probable that the second domain maps a co-receptor essential for the enteric tropism of TGEV 14, 15.
The clustering of murine hepatitis virus (MHV) and rat coronavirus (RtCoV) might reflect the relatively close proximity in which the hosts reside and perhaps the similarity of murine and rat target receptors. Note that MHV receptors, including CEACAM1, have recently been identified 16, 17. The clustering of the human OC43 (HCoV-OC43), bovine (BCoV) and porcine haemagglutinating encephalomyelitis (HEV) coronaviruses might reflect conditions contributing to cross-infection in farming. The Breda torovirus is enteric, whereas the YH okavirus infects gill tissue in prawns. This indicates that the switch between enteric and respiratory tropism is a general characteristic of the order Nidovirales.
3. Analysis of the spike protein
Coronaviruses attach to host cells through the S glycoprotein 15, 18. This protein is translated as a large polypeptide that is subsequently cleaved into a receptor-binding peripheral subunit (S1) that remains non-covalently associated with a fusion-inducing membrane-spanning (S2) fragment [18].
Studies have shown that the entry of the porcine coronavirus TGEV into cells is mediated by the interactions of S1 with pAPN, an ectoenzyme abundantly expressed at the apical membrane of enterocytes covering the villi of the small intestine [19]. The fact that the S protein mediates the first interaction of the virus with human cells suggests that it might represent an excellent target for effective anti-SARS-CoV drugs; unfortunately, structural information is only available for the 3CLpro proteinase, which is part of the coronavirus replication complex (PDB accessions 1Q2W, 1P9U, 1P9S and 1LVO) [20]. The S protein shows relatively high sequence homology within two of the major coronavirus groups (>60% within group 1; >38% within group 2), whereas the homology between groups is lower (15–21% between groups 1 and 2; 15–21% between SARS-CoV and group 1 or 2). Comparative sequence analysis between the SARS-CoV sequences and sequences from groups 1 and 2 of the coronavirus genus reveals three regions of varying sequence conservation: from amino acid positions 1 to ∼400, 401–680 and 681–1255. Interestingly, the first two regions correspond to the S1 fragment (we subsequently refer to these regions as S1A and S2A) and the third to the S2 fragment. Figure 2a shows a cartoon of the gene for the S protein. The region S1A is poorly conserved between groups 1 and 2 and SARS-CoV, whereas S1B is flanked by two very well conserved motifs making it easier to align the internal sequences. Notably, this region is homologous to a TGEV spike region that is reported to contain determinants for tissue tropism 13, 14, 15. The region S2 is more conserved than S1A and S1B and consequently the alignment is easily determined; Passml-TM, which uses the evolutionary relationships of the sequences analysed to improve its predictions of secondary structure and accessibility, predicts a transmembrane helix at location 1196–1218 of the S protein. The maximum likelihood trees of S1B and S2 are shown in Figures 2b and 2c, respectively. The length of the trees and the distances between sequences reflect the sequence homologies according to the model of evolution, explaining why the S2 tree is much shorter than S1B tree.
Figure 2.

(a) Schematic diagram of the spike protein gene showing S1A, S1B (faster evolving) and S2 (conserved) regions. The inferred transmembrane region is represented in black. The heptad repeats (r) and cysteine-rich domain (c) are also shown. Maximum likelihood trees of the (b) S1B and (c) S2 regions of the spike protein. The scale bars indicate the mean numbers of amino acid replacements per site. Species used include 17 coronaviruses [from group 1: human coronavirus 229E (HCoV-229E), porcine epidemic diarrhea virus (PEDV), porcine transmissible gastroenteritis virus (TGEV), canine coronavirus (CCoV) and feline coronavirus (FCoV); from group 2: bovine coronavirus (BCoV), rat coronavirus (RtCoV), murine hepatitis virus (MHV), human coronavirus OC43 (HCoV-OC43) and porcine hemagglutinating encephalomyelitis virus (HEV); intermediate between groups 1 and 2: avian infectious bronchitis virus (IBV) and turkey coronavirus (TCV); and SARS-CoVs from strains Tor2, bj01, bj02, bj03 and CUHKW1], one torovirus (Breda) and one okavirus (yellow head virus, YH). Coloured areas indicate coronavirus groups 1 (blue) and 2 (yellow). (d) Predicted structure and mutation rate for the SARS-CoV S1B region. Secondary structure has been predicted (row Pred) in three classes: helix (H), sheet (E) and coil (C). Accessibility has been predicted (row Acc) in three classes: buried (b), exposed (e) and intermediate (i). Mutation rates (row Mut) are partitioned into eight classes (classes 1–8 have relative rates of evolution 0.10, 0.27, 0.44, 0.64, 0.88, 1.19, 1.65 and 2.83, respectively), inferred using the empirical Bayes method [37]. The sequence homologous to the region 522–744 of the TGEV spike protein is shown in red. Maximum likelihood trees and mutation rate analyses were computed using Passml-TM [7].
The phylogenetic tree produced from the analysis of the spike S2 fragment from several coronaviruses indicates that SARS-CoV is closer to group 2 of the coronavirus genus than to group 1. Phylogenetic analysis of the S1 fragment from several coronaviruses indicates that SARS-CoV has an even closer relationship to group 2 viruses than the previous analysis suggests. Phylogenetic analysis of a 300 amino acid region at the terminus of S1, which we denote S1B, indicates that SARS-CoV belongs to group 2 and is closely related to MHV and RtCoV. The differences between these results might be a result of recombination events involving SARS-CoV or convergent evolution, or they might also be caused simply by chance; however, it is apparent that SARS-CoV is most closely related to group 2 of the coronavirus genus. Because the S1 fragment of MHV binds to CEACAM1, we suggest that the S1B region of the SARS-CoV spike might bind to a human CEACAM1 receptor instead of pAPN. Holmes and collaborators, who have identified receptors for MHV (murine CEACAM1a), HCoV-229E (human pAPN) and feline coronaviruses (feline pAPN) 16, 17, are currently investigating this hypothesis (K. Holmes, pers. commun.). In support of the proposal that S1B is involved in receptor-binding is the fact that this region is homologous to a domain of the TGEV S protein, which is located between amino acids 522 and 744 and is also involved in receptor-binding 13, 16.
Notably, TGEV mutants that lack sialic acid-binding activity contain single point mutations in the S protein (Cys155Phe, Met195Val, Arg196Ser, Asp208Asn or Leu209Pro) 21, 22. Sialic acid-binding activity might help TGEV to resist detergent-like substances encountered during gastrointestinal passage and therefore facilitate infection of the intestinal epithelium [23]. We found that only Cys155 is conserved in SARS-CoV; this is in agreement with clinical findings that show that 20–50% of SARS patients present gastrointestinal symptoms [24]. The low conservation of the S1A region among coronavirus sequences suggests that once more strains of SARS-CoV or other closely related species are available it will become possible to use innovative comparative sequence analyses to examine positive selection that acts in this region [1].
Several important functional determinants have been discovered in fragment S2. It contains a cytoplasmic tail enriched in cysteine residues (1217–1236; Figure 2a); this is a common feature among coronaviruses and appears to be related to membrane fusion [25]. Several authors have discovered that SARS-CoV S2 contains two conserved regions of heptad repeats (913–1000 and 1151–1185; Figure 2a) 26, 27 (see also a press release by W.R. Gallaher and R.F. Garry http://www.virology.net/sars/s2model.html). These heptads suggest that SARS-CoV uses mechanisms to gain entry to a cell that are similar to those used by human immunodeficiency virus (HIV), the virus that causes AIDS (acquired immunodeficiency syndrome), orthomyxoviruses and paramyxoviruses, and also Ebola. It is known that peptides derived from these repeat regions in HIV and the paramyxoviruses can specifically inhibit virus entry and subsequently viral replication [26]. Currently, SARS treatment is modeled after the drug known as T20 (http://www.hivmedicine.com/textbook/drugs/t20.htm). This drug is a complex peptide that is difficult to manufacture, has a short half-life in the human body and must be injected. This suggests that other regions of the genome, such as S1B, which might be of some interest for drug design, should be described. We report in Figure 2d the consensus protein structure estimate of S1B obtained using Passml-TM, PHD [10] and PSI-PRED [11]. Passml-TM also estimates the distribution of mutation rates along the protein and the sitewise mutation rate (Figure 2d).
4. Mutational spectra of SARS-CoV genomes
The SARS-CoV genome is AT rich (59%). Asymmetries in strand composition can reveal mutation bias (for example, cytosine deamination) or selection [28]. We found that the GC [(G−C)/(G+C)=0.02] and AT skew [(A−T)/(A+T)=0.037] in the SARS-CoV genome are smaller than those of the HIV genome (GC skew is 0.15 and AT skew is 0.23), which has a double-stranded RNA genome with a similar AT content. This suggests the existence of some selection on G and C distribution along the sequence to control the types of RNA secondary structure that form [29]. CG is the only dinucleotide statistically under-represented {f(CG)/(f(C)f(G)=0.46, where f(CG) is the frequency of CG dinucleotides and significance is assessed according to Refs. 30, 31}. Because this depletion is also found in the HIV genome but not in that of Tobacco mosaic virus, it might occur as a result of mutational bias in vertebrate cells.
Comparison of the mutation patterns in the SARS-CoV genome sequences from 16 patients shows that a large number (38/84) of the base substitutions detected at 84 sites occur within or near to single base and dinucleotide repeat stretches. Despite the absence of a pairing rule, the ratio of rates of transition and transversion mutations is ∼2, as is often found in double-stranded DNA. The low GC and AT skews and the low number of mutations suggest that evolvability of SARS-CoV might be restricted by selective constraints acting on the RNA structure and packaging of the genome, and therefore it might also be restricted by the low fitness of its mutational neighbours. Sequence features that form stems and loops that are potentially involved in coronavirus genome packaging have been described 32, 33. Mutational neighbours with different fitness might explain why, although some RNA viruses evolve at high rates, some RNA viruses are highly stable 34, 35.
Interestingly, the ease of tropism switching as exemplified by the closeness between turkey and chicken coronaviruses (Figure 1) is favoured by the large number of viral particles in each host, by their mutation rates, by the large populations of hosts (birds and other species) and by the aerial mode of viral spread (for instance, through sneezing and faeces). These factors suggest that birds might act as powerful engines for virus evolution.
5. Conclusion
In this review we have highlighted that the S1 and S2 fragments of the SARS-CoV S protein have different mutational patterns. On the basis of phylogenetic evidence (Figure 2b) and the homology with the TGEV 522–744 region, it is suggested that a short region of the S1 fragment, which we denote S1B, located at positions 400–680, might be of particular interest to virologists, structural biologists and biotechnologists. The sitewise secondary structure, solvent accessibility and mutation rate of this region have been estimated; our work in progress includes further structural characterization and fold family determination. At the moment, SARS appears to be under control despite doctors having neither drugs nor a vaccine to protect against it. Because it could reappear in the future, research should proceed and hopefully our findings might assist in maintaining a feed-forward loop on SARS-CoV research between bioinformatics analysis and experimental work from microbiologists and virologists. As a final comment, it is notable that, in all the phylogenies, human coronaviruses HCoV-229 and HCoV-OC43 always cluster with porcine coronaviruses. Because Ericsson and collaborators [36] reported the identification of two homologous human proteins that act as receptors for porcine endogenous retrovirus, the benefits and risks of porcine–human xenotransplantation should be carefully balanced.
Acknowledgements
We thank Rodrigo Lopez and Ivo Cozzani for helpful suggestions. P.L. was partially supported by a BBSRC grant. N.G. is supported by a Wellcome Trust Fellowship in Basic Biomedical Research.
References
- 1.Whelan S. Molecular phylogenetics: state-of-the-art methods for looking into the past. Trends Genet. 2001;17:262–272. doi: 10.1016/s0168-9525(01)02272-7. [DOI] [PubMed] [Google Scholar]
- 2.Marra M.A. The genome sequence of the SARS-associated coronavirus. Science. 2003;300:1399–1404. doi: 10.1126/science.1085953. [DOI] [PubMed] [Google Scholar]
- 3.Rota P.A. Characterization of a novel coronavirus associated with severe acute respiratory syndrome. Science. 2003;300:1394–1399. doi: 10.1126/science.1085952. [DOI] [PubMed] [Google Scholar]
- 4.Butler P.J.G. Self-assembly of tobacco mosaic virus: the role of an intermediate aggregate in generating both specificity and speed. Philos. Trans. R. Soc. Lond. B Biol. Sci. 1999;354:537–550. doi: 10.1098/rstb.1999.0405. [DOI] [PMC free article] [PubMed] [Google Scholar]
- 5.Russell R.B. Recognition of analogous and homologous protein folds: analysis of sequence and structure conservation. J. Mol. Biol. 1997;269:423–439. doi: 10.1006/jmbi.1997.1019. [DOI] [PubMed] [Google Scholar]
- 6.Thorne J.L. Combining protein evolution and secondary structure. Mol. Biol. Evol. 1996;13:666–673. doi: 10.1093/oxfordjournals.molbev.a025627. [DOI] [PubMed] [Google Scholar]
- 7.Liò P. Combining protein secondary structure prediction and evolutionary inference. Bioinformatics. 1998;14:726–733. doi: 10.1093/bioinformatics/14.8.726. [DOI] [PubMed] [Google Scholar]
- 8.Liò P., Goldman N. Using protein structural information in evolutionary inference: transmembrane proteins. Mol. Biol. Evol. 1999;16:1696–1710. doi: 10.1093/oxfordjournals.molbev.a026083. [DOI] [PubMed] [Google Scholar]
- 9.Thompson J.D. CLUSTAL W: improving the sensitivity of progressive multiple sequence alignment through sequence weighting, positions-specific gap penalties and weight matrix choice. Nucleic Acids Res. 1994;22:4673–4680. doi: 10.1093/nar/22.22.4673. [DOI] [PMC free article] [PubMed] [Google Scholar]
- 10.Rost B. Predict protein. Methods Enzymol. 1996;266:525–539. doi: 10.1016/s0076-6879(96)66033-9. [DOI] [PubMed] [Google Scholar]
- 11.McGuffin L.J. The PSIPRED protein structure prediction server. Bioinformatics. 2000;16:404–405. doi: 10.1093/bioinformatics/16.4.404. [DOI] [PubMed] [Google Scholar]
- 12.Altschul S.F., Koonin E.V. Iterated profile searches with PSI-BLAST - a tool for discovery in protein databases. Trends Biochem. Sci. 1998;23:444–447. doi: 10.1016/s0968-0004(98)01298-5. [DOI] [PubMed] [Google Scholar]
- 13.Ballesteros M.L. Two amino acid changes at the N-terminus of transmissible gastroenteritis coronavirus spike protein result in the loss of enteric tropism. Virology. 1997;227:378–388. doi: 10.1006/viro.1996.8344. [DOI] [PMC free article] [PubMed] [Google Scholar]
- 14.Godet M. Major receptor-binding and neutralization determinants are located within the same domain of the transmissible gastroenteritis virus (coronavirus) spike protein. J. Virol. 1994;68:8008–8016. doi: 10.1128/jvi.68.12.8008-8016.1994. [DOI] [PMC free article] [PubMed] [Google Scholar]
- 15.Sanchez C.M. Targeted recombination demonstrates that the spike gene of transmissible gastroenteritis coronavirus is a determinant of its enteric tropism and virulence. J. Virol. 1999;73:7607–7618. doi: 10.1128/jvi.73.9.7607-7618.1999. [DOI] [PMC free article] [PubMed] [Google Scholar]
- 16.Bonavia A. Identification of a receptor binding domain of the spike glycoprotein of human coronavirus HCoV-229E. J. Virol. 2003;77:2530–2538. doi: 10.1128/JVI.77.4.2530-2538.2003. [DOI] [PMC free article] [PubMed] [Google Scholar]
- 17.Zelus B.D. Conformational changes in the spike glycoprotein of murine coronavirus are induced at 37°C either by soluble murine CEACAM1 receptors or by pH 8. J. Virol. 2003;77:830–840. doi: 10.1128/JVI.77.2.830-840.2003. [DOI] [PMC free article] [PubMed] [Google Scholar]
- 18.Cavanagh D. The coronavirus surface glycoprotein. In: Siddell S.G., editor. The Coronaviridae. Plenum Press; 1995. pp. 73–115. [Google Scholar]
- 19.Benbacer L. Interspecies aminopeptidase-N chimeras reveal species-specific receptor recognition by canine coronavirus, feline infectious peritonitis virus, and transmissible gastroenteritis virus. J. Virol. 1997;71:734–737. doi: 10.1128/jvi.71.1.734-737.1997. [DOI] [PMC free article] [PubMed] [Google Scholar]
- 20.Anand K. Coronavirus main proteinase (3CLpro) structure: basis for design of anti-SARS drugs. Science. 2003;300:1763–1767. doi: 10.1126/science.1085658. [DOI] [PubMed] [Google Scholar]
- 21.Schwegmann-Wessels C. Binding of transmissible gastroenteritis coronavirus to cell surface sialoglycoproteins. J. Virol. 2002;76:6037–6043. doi: 10.1128/JVI.76.12.6037-6043.2002. [DOI] [PMC free article] [PubMed] [Google Scholar]
- 22.Krempl C. Characterization of the sialic acid binding activity of transmissible gastroenteritis coronavirus by analysis of haemagglutination-deficient mutants. J. Gen. Virol. 2000;81:489–496. doi: 10.1099/0022-1317-81-2-489. [DOI] [PubMed] [Google Scholar]
- 23.Krempl C. Point mutations in the S protein connect the sialic acid binding activity with the enteropathogenicity of transmissible gastroenteritis coronavirus. J. Virol. 1997;71:3285–3287. doi: 10.1128/jvi.71.4.3285-3287.1997. [DOI] [PMC free article] [PubMed] [Google Scholar]
- 24.Zhang J. Severe acute respiratory syndrome and its lesions in digestive system. World J. Gastroenterol. 2003;9:1135–1138. doi: 10.3748/wjg.v9.i6.1135. [DOI] [PMC free article] [PubMed] [Google Scholar]
- 25.Chang K.W. Coronavirus-induced membrane fusion requires the cysteine-rich domain in the spike protein. Virology. 2000;269:212–224. doi: 10.1006/viro.2000.0219. [DOI] [PMC free article] [PubMed] [Google Scholar]
- 26.Derdeyn C.A. Sensitivity of human immunodeficiency virus type 1 to fusion inhibitors targeted to the gp41 first heptad repeat involves distinct regions of gp41 and is consistently modulated by gp120 interactions with the coreceptor. J. Virol. 2001;75:8605–8614. doi: 10.1128/JVI.75.18.8605-8614.2001. [DOI] [PMC free article] [PubMed] [Google Scholar]
- 27.Kliger Y., Levanon E.Y. Cloaked similarity between HIV-1 and SARS-CoV suggests an anti-SARS strategy. BMC Microbiol. 2003;3:20–30. doi: 10.1186/1471-2180-3-20. [DOI] [PMC free article] [PubMed] [Google Scholar]
- 28.Frank A.C., Lobry J.R. Asymmetric substitution patterns: a review of possible underlying mutational or selective mechanisms. Gene. 1999;238:65–77. doi: 10.1016/s0378-1119(99)00297-8. [DOI] [PubMed] [Google Scholar]
- 29.Huynen M.A. Equal G and C contents in histone genes indicate selection pressures on mRNA secondary structure. J. Mol. Evol. 1992;34:280–291. doi: 10.1007/BF00160235. [DOI] [PubMed] [Google Scholar]
- 30.Karlin S. Comparative DNA analysis across diverse genomes. Annu. Rev. Genet. 1998;32:185–225. doi: 10.1146/annurev.genet.32.1.185. [DOI] [PubMed] [Google Scholar]
- 31.Karlin S., Mrazek J. Compositional differences within and between eukaryotic genomes. Proc. Natl. Acad. Sci. U. S. A. 1997;94:10227–10232. doi: 10.1073/pnas.94.19.10227. [DOI] [PMC free article] [PubMed] [Google Scholar]
- 32.Narayanan K. Nucleocapsid-independent specific viral RNA packaging via viral envelope protein and viral RNA signal. J. Virol. 2003;77:2922–2927. doi: 10.1128/JVI.77.5.2922-2927.2003. [DOI] [PMC free article] [PubMed] [Google Scholar]
- 33.Qin L. Identification of probable genomic packaging signal sequence from SARS-CoV genome by bioinformatics analysis. Acta Pharmacol. Sin. 2003;24:489–496. [PubMed] [Google Scholar]
- 34.Burch C.L., Chao L. Evolvability of an RNA virus is determined by its mutational neighbourhood. Nature. 2000;406:625–628. doi: 10.1038/35020564. [DOI] [PubMed] [Google Scholar]
- 35.Chao L. Evolution of sex and the molecular clock in RNA viruses. Gene. 1997;205:301–308. doi: 10.1016/s0378-1119(97)00405-8. [DOI] [PubMed] [Google Scholar]
- 36.Ericsson T.A. Identification of receptors for pig endogenous retrovirus. Proc. Natl. Acad. Sci. U. S. A. 2003;100:6759–6764. doi: 10.1073/pnas.1138025100. [DOI] [PMC free article] [PubMed] [Google Scholar]
- 37.Nielsen R., Yang Z. Likelihood models for detecting positively selected amino acid sites and applications to the HIV-1 envelope gene. Genetics. 1998;148:929–936. doi: 10.1093/genetics/148.3.929. [DOI] [PMC free article] [PubMed] [Google Scholar]