

Summary
High-performance liquid chromatography (HPLC) has proved extremely versatile over the past 25 yr for the isolation and purification of peptides varying widely in their sources, quantity and complexity. This article covers the major modes of HPLC utilized for peptides (size-exclusion, ion-exchange, and reversed-phase), as well as demonstrating the potential of a novel mixed-mode hydrophilic interaction/cation-exchange approach developed in this laboratory. In addition to the value of these HPLC modes for peptide separations, the value of various HPLC techniques for structural characterization of peptides and proteins will be addressed, e.g., assessment of oligomerization state of peptides/proteins by size-exclusion chromatography and monitoring the hydrophilicity/hydrophobicity of amphipathic α-helical peptides, a vital precursor for the development of novel antimicrobial peptides. The value of capillary electrophoresis for peptide separations is also demonstrated. Preparative reversed-phase chromatography purification protocols for sample loads of up to 200 mg on analytical columns and instrumentation are introduced for both peptides and recombinant proteins.
Key Words: Peptides, proteins, size-exclusion chromatography (SEC), anion-exchange chromatography (AEX), cation-exchange chromatography (CEX), mixed-mode hydrophilic interaction chromatography (HILIC)/cation-exchange chromatography (CEX), reversed-phase high-performance liquid chromatography (RP-HPLC), preparative RP-HPLC of peptides and proteins, amino acid side-chain hydrophilicity/hydrophobicity coefficients, amino acid α-helical propensity values, amino acid side-chain stability coefficients
Introduction
Scope of Chapter
The development of high-performance liquid chromatography (HPLC) packings and instrumentation over the past 25 yr has revolutionized the efficiency and speed of separation of molecules in general and peptides in particular. This development has also seen a tremendous output of published literature on the topic of HPLC of peptides, perhaps making the decision as to how best to approach a particular separation problem seem formidable to the novice, or even experienced HPLC user. Fortunately, regardless of whether high-performance approaches are utilized for routine peptide separations or for such state-of-the-art areas as proteomics, capillary methods, biospecific interactions, and so on, the fundamentals of chromatographic protocols remain the same. Thus, it is not the purpose of this chapter to present a comprehensive review of HPLC of peptides. Indeed, there is a wealth of relevant material accessible in the literature. For instance, several useful articles and reviews on HPLC of peptides can be found in refs. 1–4. In addition, refs. 5 – 8 represent excellent resource books in this area. Finally, ref. 9 offers an extensive source of information on the early development of HPLC of peptides.
This chapter is aimed at laboratory-based researchers, both experienced chromatographers and those with limited exposure to high-performance separation approaches, who wish to learn about peptide analysis by HPLC, based on representative examples from research carried out in our laboratory with general applicability. Standard analytical applications in HPLC of peptides will be stressed, together with novel approaches to separations and modest scale-up for preparative purification of peptides. In addition, the value of the complementary technique of capillary electrophoresis (CE) for peptide separations will be demonstrated. Finally, in order to maximize the “user friendliness” of this chapter, only nonspecialized columns, mobile phases, and instrumentation readily available and easily employed by the researcher are described.
Properties of Peptides and Proteins and Practical Implications
Properties of Amino Acids
The side-chains of amino acids are generally classified according to their polarity, i.e., nonpolar or hydrophobic vs polar or hydrophilic. Further, the polar side-chains are divided into three main groups: uncharged polar, positively charged, or basic side-chains, and negatively charged or acidic side-chains. Within any single group, there are considerable variations in the size, shape and properties of the side-chains. Peptides containing ionizable (acidic and basic) side-chains have a characteristic isoelectric point (pI) and the overall net charge and polarity of a peptide in aqueous solution will vary with pH. Thus, hydrophilicity/hydrophobicity, as well as the number of charged groups present, become important factors in the separation of peptides. Intrinsic amino acid side-chain hydrophilicity/hydrophobicity coefficients have been recently published (10), and these reversed-phase (RP)-HPLC derived values at pH 2.0 and pH 7.0 are shown in Table 1. “Intrinsic” implies the maximum possible hydrophilicity/hydrophobicity of side-chains in the absence of nearest-neighbor or conformational effects that would decrease the full expression of the side-chain hydrophilicity/hydrophobicity when the side-chain is in a polypeptide chain. Such a scale is the fundamental starting point for determining the parameters that affect side-chain hydrophobicity for quantifying such effects in peptides and proteins (e.g., the quantitative evaluation of the contribution of a specific amino side-chain to ligand–protein and protein–protein interactions and to protein folding and stability) and in aiding the development of protocols for optimum separation of polypeptides. The RP-HPLC-based approach to determining these intrinsic coefficients is described under Subheading 3.3.1
Table 1.
Hydrophilicity/Hydrophobicity Coefficients Determined at 25°C by Reversed-Phase High-Performance Liquid Chromatography of Model Peptides at pH 2.0 and 7.0a
| Amino acid Substitutionb | pH 2.0c
 (Gly)d (Gly)d
|
pH 7.0c
 (Gly)d (Gly)d
|
|---|---|---|
| Trp | 32.4 | 33.0 |
| Phe | 29.1 | 30.1 |
| n-Leu | 24.6 | 25.9 |
| Leu | 23.3 | 24.6 |
| Ile | 21.4 | 22.8 |
| Met | 15.7 | 17.3 |
| n-Val | 15.2 | 16.9 |
| Tyr | 14.7 | 16.0 |
| Val | 13.4 | 15.0 |
| Pro | 9.0 | 10.4 |
| Cys | 7.6 | 9.1 |
| Ala | 2.8 | 4.1 |
| Glu e | 2.8 |
 0.4
0.4
|
| Lys | 2.8 |
 2.0
2.0
|
| Thr | 2.3 | 4.1 |
| Asp | 1.6 |
 0.8
0.8
|
| Gln | 0.6 | 1.6 |
| Arg | 0.6 | 4.1 |
| Ser | 0.0 | 1.2 |
| His | 0.0 | 4.7 |
| Gly | 0.0 | 0.0 |
| Asn | -0.6 | 1.0 |
| Orn | -0.6 | -2.0 |
a Taken from ref. 10.
b The amino acid substitutions at position X in the peptide sequence Ac-X-G-A-K-G-A-G-V-G-L-amide; n-Leu, n-Val and Orn denote norleucine, norvaline and ornithine, respectively.
c Conditions: see Subheading 3.3.1.
d
 (Gly) denotes the change in retention time relative to the Gly-substituted peptide.
e Potentially charged residues (Asp, Glu, Arg, His, Lys, Orn) are in bold; the values between pH 2.0 and pH 7.0 that differ by more than 2 min are also in bold.
Peptide/Protein Conformation and Stability
Conformation can be an important factor in peptides as well as proteins and, thus, should always be a consideration when choosing the conditions for chromatography. Although secondary structure (e.g.,  -helix) is generally absent even in benign (nondenaturing) aqueous conditions for small peptides (up to about 10 residues), the potential for a defined secondary or tertiary structure increases with increasing peptide length and, for peptides containing more than 20–30 residues, folding to internalize hydrophobic residues is likely to become a significant conformational feature. Zhou et al. (11) reported a complete and accurate scale of the intrinsic
  -helical propensities of the 20 naturally occurring amino acids (Table
2) based on a synthetic model peptide approach whereby single amino acid substitutions were made in the center of the nonpolar face of an amphipathic α-helical peptide (Fig.
1) that is small, monomeric and noninteracting. As shown in Table
2, Ala has the highest side-chain α-helical propensity and Gly the lowest. A value for Pro could not be determined because the side-chain of this amino acid completely disrupts α-helical structure, even in the presence of helix inducing solvents such as trifluoroethanol (TFE). Such intrinsic propensity values provide a powerful tool for protein design as well as providing a guide to predicting the potential conformational status of a peptide during chromatography. The latter is particularly true of RP-HPLC because the nonpolar environment characteristic of this HPLC mode make it a strong inducer of α-helical structure in potentially α-helical amino acid sequences (12
–15).
-helical propensities of the 20 naturally occurring amino acids (Table
2) based on a synthetic model peptide approach whereby single amino acid substitutions were made in the center of the nonpolar face of an amphipathic α-helical peptide (Fig.
1) that is small, monomeric and noninteracting. As shown in Table
2, Ala has the highest side-chain α-helical propensity and Gly the lowest. A value for Pro could not be determined because the side-chain of this amino acid completely disrupts α-helical structure, even in the presence of helix inducing solvents such as trifluoroethanol (TFE). Such intrinsic propensity values provide a powerful tool for protein design as well as providing a guide to predicting the potential conformational status of a peptide during chromatography. The latter is particularly true of RP-HPLC because the nonpolar environment characteristic of this HPLC mode make it a strong inducer of α-helical structure in potentially α-helical amino acid sequences (12
–15).
Table 2.
α-Helical Propensities of Amino Acid Side-Chains in Peptides2
Amino acid
|
ΔΔG (kcal/mole)
|
|---|---|
| Ala |

|
| Arg |

|
| Leu |

|
| Lys |

|
| Met |

|
| Gln |

|
| Ile |

|
| Trp |

|
| Phe |

|
| Tyr |

|
| Cys |

|
| Val |

|
| Asn |

|
| Ser |

|
| His |

|
| Glu |

|
| Thr |

|
| Asp |

|
| Gly | 0 |
 Single amino acid substitution were made in the center of the non-polar face of model amphipathic α-helical peptide shown in Fig.
1.
Single amino acid substitution were made in the center of the non-polar face of model amphipathic α-helical peptide shown in Fig.
1.
 ΔΔG, taken as a measure of amino acid α-helical propensity, is the difference in free energy of α-helix formation (ΔG) for each substituted amino acid residue relative to Gly (ref.
11
).
ΔΔG, taken as a measure of amino acid α-helical propensity, is the difference in free energy of α-helix formation (ΔG) for each substituted amino acid residue relative to Gly (ref.
11
).
Fig. 1.
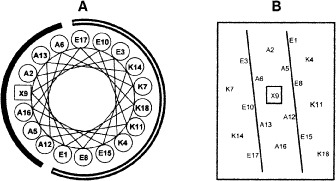
Amino acid sequence of model amphipathic α-helical peptide used for evaluation of α-helical propensities of amino acids. A, Helical wheel representation; B, helical net representation. Amino acid substitutions were made at position X9, in the center of the nonpolar face of the α-helix. The α-helical propensities generated from this model peptide are shown in Table 2. (Reproduced from ref. 11, with permission from Bentham Science.)
Interactions between hydrophobic side-chains are the most important factor in polypeptide folding and the subsequent stability of the final polypeptide conformation. Thus, knowledge of the contribution of individual amino acid side-chains in the hydrophobic core of a folded protein to peptide/protein conformation and stability is also of importance when considering the effect of the peptide/protein solubility, conformation, and interactions with the HPLC matrix during chromatography. Table 3 lists stability coefficients of amino acids generated from single amino acid substitutions in the “a” or “d” position of the central heptad of model α-helical coiled coils (heptad positions are denoted “abcdefg,” where positions “a” and “d” are the nonpolar positions responsible for the formation and stability of coiled-coils). Such coefficients allow an assessment of the effect of side-chain substitution in the hydrophobic core, as well as provide information on the effect of side-chain hydrophobicity and packing in the hydrophobic core. Although the values shown in Table 3 were derived from a coiled-coil model (16,17), we had previously shown that the relative contributions of nonpolar residues to protein stability in two-stranded α-helical coiled-coils showed an excellent linear correlation with the results obtained in globular proteins. In both protein types, the mutations were made in hydrophobic residues involved in the hydrophobic core, which is responsible for overall protein stability (18). This demonstrates the general applicability of these results to proteins in general.
Table 3.
Contribution of Amino Acid Side-Chains to Stability in the Hydrophobic Core of α-Helical Coiled-Coils3
Amino acid
|
ΔΔGu (Ala) (position a) (position a) |
ΔΔGu (Ala) (position d) (position d) |
|---|---|---|
| Val | 4.1 | 1.1 |
| Ile | 3.9 | 3.0 |
| Leu | 3.5 | 3.8 |
| Met | 3.4 | 3.2 |
| Phe | 3.0 | 1.2 |
| Tyr | 2.2 | 1.4 |
| Asn | 0.9 | -0.6 |
| Trp | 0.8 | -0.1 |
| Thr | 0.2 | -1.2 |
| Ala | 0.0 | 0.0 |
| Gln | -0.1 | 0.5 |
| Lys | -0.4 | -1.8 |
| Arg | -0.8 | -2.9 |
| His | -1.2 | -0.8 |
| Ser | -1.3 | -1.8 |
| Orn | -1.9 | -3.1 |
| Glu | -2.0 | -2.7 |
| Gly | -2.5 | -3.6 |
| Asp | -c | -1.8 |
 Amino acid residue (denoted X) substituted at position 19a of the sequence Ac-CGGEVGALKAQVGALQAQXGALQKEVGALKKEVGA LKK-amide or at position 22d of the sequence Ac-CGGEVGALKAEVGAL KAQIGAXQKQIGALQKEVGALKK-amide; oxidation of the peptides formed a disulfide-bridged homo-two-stranded α-helical coiled-coil.
 ΔΔGu (Ala) is the difference in the free energy of unfolding (ΔGu) relative to the Ala-substituted analog; a positive value indicates the substitution provides more stability relative to Ala; a negative value indicates the substitution is destabilizing relative to Ala.
 A value for the Asp side-chain could not be obtained as a result of its causing unfolding of the coiled-coil, i.e., it is more destabilizing than Gly.
Peptide Detection
Peptide bonds absorb light strongly in the far ultraviolet (UV) ( 220 nm), providing a convenient means of detection (generally at 210–220 nm). In addition, the aromatic side-chains of tyrosine, phenylalanine and tryptophan absorb light in the 250–290 nm UV range; it should be noted, however, that these aromatic residues are not present in all peptides.
HPLC Modes Used in Peptide Separations
The three major modes of HPLC traditionally employed in peptide separations utilize differences in peptide size (size-exclusion HPLC [SEC]), net charge (ion-exchange HPLC [IEX]), or hydrophobicity (RP-HPLC) (1 –8). Within these modes, mobile phase conditions may be manipulated to maximize the separation potential of a particular HPLC column. In addition, a novel mixed-mode approach to peptide separation termed hydrophilic interaction chromatography (HILIC)/cation-exchange chromatography (CEX) has also shown excellent potential as a complement to RP-HPLC in recent years (19 – 30).
HPLC Supports
Silica-based packings remain the most widely used for the major modes of HPLC, the rigidity of microparticulate silica allowing the use of high flow rates of mobile phases. In addition, favorable mass transfer characteristics allow rapid analyses to be performed. Because most silica-based packings are limited to a pH range of 2.0–8.0 as a result of silica dissolution in basic eluents, high-performance column packings based on organic polymers with a broad pH tolerance (e.g., cross-linked polystyrene-divinylbenzene) are also being increasingly introduced.
Size-Exclusion HPLC
In the past, the range of required fractionation for peptides (~100–6,000 Da) has tended toward the low end of the fractionation ability of commercial columns, designed mainly for protein separations. However, such columns have still proven useful in the early stages of a peptide purification protocol (i.e., in the early stages of a multi-step purification protocol) or for peptide/protein separations (2,17,31 – 34). The introduction of a size-exclusion column designed specifically for peptide separations (molecular weight range 100–7000) has raised the profile of this HPLC mode for peptide analysis in recent years (35).
Ion-Exchange HPLC
IEX has proven extremely useful for peptide separations since HPLC packings capable of retaining both basic (net positive charge) or acidic (net negative charge) peptides have been introduced. Both anion-exchange (AEX) (2,3,5,8,32,36
–
40) and cation-exchange (CEX) (2,3,5,8,31,32,34,36,38,41
–
45) HPLC have been employed for peptide and protein separations, negatively charged and positively charged solutes, respectively, being retained by these ion-exchange modes. Common anion-exchange packings consist of primary, secondary, and tertiary (weak AEX) or quaternary amine (strong AEX) groups adsorbed or covalently bound to a support. These positively charged packings will interact with acidic (negatively charged) peptide residues (aspartic and glutamic acid above ~pH 4.0), as well as the negatively charged C-terminal α-carboxyl group. Common cation-exchange packings consist of carboxyl (weak CEX) or sulfonate (strong CEX) groups bound to a support matrix. These negatively charged packings will interact with the basic (positively charged) residues (histidine, pH  ; arginine, pH
  , and lysine, pH
  ), as well as the positively charged N-terminal α-amino group. Should a choice need to be made concerning the type of ion-exchange column for general peptide applications, a strong cation-exchange column is recommended. The utility of such a column lies in its ability to retain its negatively charged character in the acidic and neutral pH range, which is due to the strongly acidic sulfonate functionality characteristic of such a packing. Most peptides are soluble at low pH, where the side-chain carboxyl groups of acidic residues (glutamic acid, aspartic acid) and the free C-terminal α-carboxyl group are protonated (i.e., uncharged), thus emphasizing any basic, positively charged character of the peptides. Ion-exchange columns have proven particularly useful in a multistep protocol for peptide separations, particularly prior to a final RP-HPLC purification and desalting step.
Reversed-Phase High-Performance Liquid Chromatography
RP-HPLC remains the most widely used mode of HPLC for peptide separations (1
–
8). It is generally superior to other HPLC modes in both speed and efficiency. In addition, the availability of volatile mobile phases makes it ideal for both analytical and preparative separations. The majority of researchers have tended to carry out HPLC below pH 3.0 to take advantage of acidic volatile mobile phases (particularly aqueous trifluoroacetic acid [TFA]/acetonitrile [CH CN] systems) (1
–
8). Such mobile phase volatility is particularly useful when carrying out preparative purification of peptides or when employing RP-HPLC as a final desalting/purification mode in a multistep protocol. Finally, acidic pH values prevent undesirable ionic interactions between positively charged amino acid residues and any underivatized silanol groups (negatively charged above pH values of 3.0–4.0) on silica-based packings (46), still the most widely used packing support for RP-HPLC of peptides. Favored RP-HPLC packings for the vast majority of peptide separations continue to be silica-based supports containing covalently bound octyl (C
CN] systems) (1
–
8). Such mobile phase volatility is particularly useful when carrying out preparative purification of peptides or when employing RP-HPLC as a final desalting/purification mode in a multistep protocol. Finally, acidic pH values prevent undesirable ionic interactions between positively charged amino acid residues and any underivatized silanol groups (negatively charged above pH values of 3.0–4.0) on silica-based packings (46), still the most widely used packing support for RP-HPLC of peptides. Favored RP-HPLC packings for the vast majority of peptide separations continue to be silica-based supports containing covalently bound octyl (C or octadecyl (C
 functionalities, with peptides being eluted from these hydrophobic stationary phases in order of increasing overall peptide hydrophobicity.
Hydrophilic Interaction/Cation-Exchange Chromatography
The term “hydrophilic interaction chromatography” was originally introduced to describe separations based on solute hydrophilicity (47), with solutes being eluted from the HILIC column in order of increasing hydrophilicity, i.e., the opposite of RP-HPLC elution behavior. This concept was taken a step further by our laboratory by taking advantage of the inherent hydrophilic character of ion-exchange, specifically strong cation-exchange, columns. Thus, HILIC/CEX combines the most advantageous aspects of two widely different separation mechanisms, i.e., a separation based on hydrophilicity/hydrophobicity differences between peptides overlaid on a separation based on net charge (19 – 30). Characteristic of HILIC/CEX separations is the presence of a high organic modifier concentration (generally, acetonitrile) to promote hydrophilic interactions between the solute and the hydrophilic/charged cation-exchange stationary phase. Peptides are then eluted from the column with a salt gradient. Generally, peptides are eluted in groups of peptides in order of increasing net positive charge. Within these groups, peptides are eluted in order of increasing hydrophilicity. Indeed, HILIC/CEX is basically CEX in the presence of high concentrations of acetonitrile (50–80%). HILIC/CEX is frequently an excellent complement to RP-HPLC. Indeed, it has rivaled or even exceeded RP-HPLC for specific peptide mixtures (4,20,27,28).
Capillary Electrophoresis
Although, as noted above, RP-HPLC remains the favored separation approach for peptides, CE has also proven itself as a peptide separation tool in its own right (48 – 56). CE, specifically capillary zone electrophoresis (CZE), exploits analyte charge or, more precisely, the mass-to-charge ratio. The value of these two peptide characteristics for peptide analysis in general, and peptide mapping in particular, has frequently been demonstrated (57 – 59), with RP-HPLC and CZE also proving to complement each other for a multistep approach to peptide separations (58,60 – 64 ).
Materials
Chemical and Solvents
Water is either obtained as HPLC-grade (BDH, Poole, UK; J. T. Baker, Phillipsburg, NJ; or EMD Chemical, Gibbstown, NJ) or purified by an E-pure water filtration device from Barnstead/Thermolyne (Dubuque, IA).
Reagent grade ortho-phosphoric acid (H
 PO
PO is obtained from Caledon Laboratories (Georgetown, Ontario, Canada) or Anachemia (Toronto, Ontario, Canada).
TFA is obtained from Hydrocarbon Products (River Edge, NJ) or Sigma-Aldrich (St. Louis, MO).
Pentafluoropropionic acid (PFPA) and heptafluorobutyric acid (HFBA) are obtained from Fluka (Buchs, Switzerland) or Sigma-Aldrich.
Triethylamine (TEA) is obtained from Anachemia (see Note 1).
Sodium chloride (NaCl) is obtained from Sigma-Aldrich or J.T. Baker.
Potassium chloride (KCl), potassium dihydrogen phosphate (KH
 PO
PO , and reagent-grade urea are obtained from BDH. Extraction of UV-absorbing contaminants from analytical-grade phosphate-based buffer salts has occasionally been required. We have routinely prepared a stock solution (e.g., 1 L of 1
  to 2
to 2  KH
KH PO
PO and added a chelating resin (e.g., BioRad Chelex-100; BioRad Lab, Richmond, CA), stirring for 1 h. The phosphate solution is then aliquoted, diluted as desired, and filtered through a 0.22-μm filter. Reagent-grade urea (much cheaper than highly purified urea) may be purified to a level suitable for HPLC in a straightforward procedure: following preparation of a concentrated urea solution (often 6
  to 8
to 8  range), the solution is stirred over a mixed-bed resin (e.g., BioRad AG 501-X8, 20 to 50 mesh) (10 g/L of solution) for 30–60 min; the resin is then removed by filtration through a sintered glass funnel and the supernatant subsequently filtered through a 0.22-μm filter.
Sodium perchlorate (NaClO
 is obtained from Sigma-Aldrich or BDH (see
Note 2).
is obtained from Sigma-Aldrich or BDH (see
Note 2).HPLC-grade acetonitrile (CH
 CN) is obtained from Fisher Scientific (Pittsburgh, PA) or EM Science (Gibbstown, NJ).
Dithioerythritol (DTE) is obtained from Fisher Scientific.
Columns and Capillaries
Except where stated otherwise, all column packings are based on microparticulate silica supports.
Size-Exclusion HPLC
Column 1: Superdex Peptide HR 10/30 (300
 10 mm inner diameter [ID]; non-silica-based support; separation range of 100–7000; Pharmacia Biotech, Baie d-Urf’e, Quebec, Canada). This column (and Columns 2 and 3) are fast protein liquid chromatography (FPLC) columns from Pharmacia with stationary phases packed into glass rather than stainless steel columns. Such columns work excellently well on HPLC equipment (as opposed to FPLC equipment) if column pressure restrictions are noted.
Column 2: Superdex 75 HR 10/30 (300
 10 mm ID; non-silica-based support; separation range of 3000–70,000 for globular proteins; Pharmacia Biotech, Baie d-Urf’e, Quebec, Canada).
Ion-Exchange HPLC
Column 3: Mono S HR 5/5 strong CEX column (50
 5 mm ID, non-silica-based support; 10 μm; Pharmacia, Dorval, Canada).
Column 4: Polysulfoethyl A strong CEX column (200
 2.1 mm ID; 5 μm particle size, 300 Å pore size; PolyLC, Columbia, MD).
Reversed-Phase HPLC
Column 5: Kromasil C
 (150
(150  2.1 mm ID; 5 μm, Å 100; Hichrom, Berkshire, UK).
Column 6: Zorbax Eclipse XDB-C
 (150
(150  2.1 mm I.D.; 5 μm, 80 Å; Agilent Technologies, Little Falls, DE); “XDB” denotes “extra dense bonding,” these columns being designed to be particularly stable at neutral pH and above (65,66), where dissolution of the silica matrix at neutral and (particularly) higher pH values has been previously problematic.
Column 7: Zorbax SB300-C
 (150
(150  2.1 mm ID; 5 μm, 300 Å; Agilent Technologies); “SB” denotes “stable bond,” these columns being designed to be particularly stable at highly acidic pH values (pH
  3.0) by shielding the siloxane bonds between the alkyl chains (C
 , in this case) and silanol groups of the silica matrix from hydrolysis (67,68).
Column 8: Zorbax SB300-C
 (150
(150  1 mm ID; 3.5 μm, 300 Å; Agilent Technologies).
Column 9: Zorbax SB300-C
 (250
(250  9.4 mm ID; 6.5 μm, 300 Å; Agilent Technologies).
Capillary Electrophoresis
Capillary 1: Uncoated capillaries of 60.2 cm  50 μm ID (50 cm effective length, i.e., length from injection point to detection point) are provided by Beckman-Coulter (Fullerton, CA).
Instrumentation
HPLC
Instrument 1: The majority of analytical HPLC runs were carried out on an Agilent 1100 Series liquid chromatograph from Agilent Technologies.
Instrument 2: Older runs were carried out on a Varian Vista Series 5000 liquid chromatograph (Varian, Walnut Creek, CA) coupled to a Hewlett-Packard (Avondale, PA) HP1040A detection system, disc drive, HP2225A Thinkjet printer and HP7460A plotter.
Instrument 3: Preparative HPLC runs were carried out on a Beckman-Coulter instrument, comprised of a System Gold 126 Solvent Module and a System Gold 166 Detector.
Capillary Electrophoresis
Instrument 4: CE runs were carried out on a Beckman-Coulter Capillary Electrophoresis System controlled by 32 karat software (Version 5.0).
Methods
Size-Exclusion HPLC
Aqueous SEC is generally employed for peptide/protein separations and/or molecular weight determinations. Unique tertiary or quaternary structures can be demonstrated by molecular weight determinations in the presence and absence of denaturants in SEC (17,35). Such applications require ideal SEC behavior, i.e., separations should be based solely on solute size. However, most modern high-performance SEC columns are anionic (i.e., carry a negative charge) to a greater or lesser extent (69). Such a property may lead to interaction with positively charged side-chains in peptides and proteins unless such undesirable electrostatic interactions are suppressed. Because electrostatic effects are minimized above an eluent ionic strength of about 0.05  , aqueous phosphate buffers (pH 5.0–7.5) containing 0.1–0.4
  salts are commonly employed as the mobile phase for SEC of peptides and proteins (2,3,5,8,69). Of course, peptide–protein or protein–protein interactions may be eliminated if the salt concentration is too high when electrostatic interactions are a dominating factor to the interaction. A mixture of five model synthetic peptide standards (10, 20, 30, 40, and 50 residues) with negligible secondary structure was developed both to detect nonideal retention behavior during SEC as well as to monitor suppression of such nonideal behavior with addition of salts (69). Different column materials can exhibit dramatically different amounts of nonideal behavior. These SEC peptide standards can be obtained from the Alberta Peptide Institute, University of Alberta, Edmonton, Alberta, Canada.
SEC of Peptides
Figure 2 (top panel) shows the elution profile of six peptides containing 4, 6, 8, 10, 14, and 20 residues on a Superdex Peptide column (Column 1) and Instrument 2.
The peptides are separated by isocratic elution with 50 m
 aqueous KH
 PO
PO , pH 7, containing 100 m
 KCl at a flow rate of 0.5 mL/min and room temperature.
The excellent resolution of the six peptides illustrates the value of this column for small peptide separations. In addition, an initial fractionation of complex peptide mixtures by this column should simplify subsequent IEX and/or RP-HPLC steps.
Figure 2 (bottom panel) shows the linear relationship between peptide size (number of residues) and distribution coefficient (K
 .
.K
 values are calculated from the expression K
 V
V /V
/V -V
-V , where V
 is the elution volume of the solute, V
 is the void volume of the packing (obtained from the elution volume of blue dextran), and V
 is the total accessible volume of the column (obtained from the elution volume of
  -mercaptoethanol).
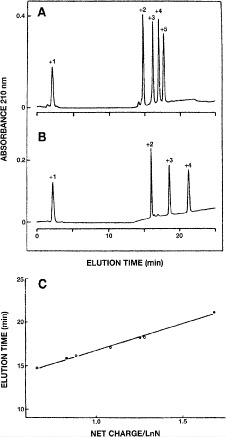
Fig. 2.

Size-exclusion chromatography of small peptides. Column and conditions described under Subheading
3.1.1. Top, elution profile of peptides; bottom, relationship between Log of the number of residues and K
 (distribution coefficient; see text in Subheading
3.1.1. for calculation). The sequences of the peptides are FIPK (4 residues); Ac-GGTAGG-amide (6 residues); PQSPESVD-amide (8 residues); LKAETEALKA (10 residues); Ac-TDDPASPQSPESVD-amide (14 residues); and IEALKCEIEALKAEIEALKA-amide (20 residues). (Adapted from ref.
35, with permission from Elsevier Science.)
(distribution coefficient; see text in Subheading
3.1.1. for calculation). The sequences of the peptides are FIPK (4 residues); Ac-GGTAGG-amide (6 residues); PQSPESVD-amide (8 residues); LKAETEALKA (10 residues); Ac-TDDPASPQSPESVD-amide (14 residues); and IEALKCEIEALKAEIEALKA-amide (20 residues). (Adapted from ref.
35, with permission from Elsevier Science.)
SEC Analysis of Peptide Oligomerization
Table 4 presents sequences of native regions and analogs of regions within the SARS-Coronavirus Spike S glycoprotein that form coiled-coil structures (70).
HRN 916–950 and HRC 1150–1185 represent native sequences within the coiled-coils (where HRN and HRC denote heptad repeat regions) at the N- and C-termini of a domain within the coronavirus S fusion protein.
The linker is attached to the native HRN sequence via a Cys-Gly-Gly spacer extension at the N-terminal of the HRN 916–950 sequence. The linker and this HRN sequence are mixed at a molar ratio of 1:4 in phosphate-buffered saline at pH 7.0, followed by incubation at room temperature for 4 h during which a covalent bond is formed between the sulfhydryl group in the Cys side-chain of the peptide and the bromoacetyl groups in the linker, producing a three-stranded peptide. DTE (5 m
 ) is then added to the reaction mixture and incubated at room temperature for 10 min, resulting in reduction of any disulfide-bridged peptides. The three-stranded peptide and monomeric peptides are subsequently separated by RP-HPLC and the three-stranded peptide (denoted as “HRN with linker” in Table
4) characterized by mass spectrometry.
) is then added to the reaction mixture and incubated at room temperature for 10 min, resulting in reduction of any disulfide-bridged peptides. The three-stranded peptide and monomeric peptides are subsequently separated by RP-HPLC and the three-stranded peptide (denoted as “HRN with linker” in Table
4) characterized by mass spectrometry.In Table 4, the peptide denoted HRN 916–950 (T923I, N937I) represents an analog of the native HRN sequence whereby Thr-923 and Asn-937 have been replaced by Ile in the hydrophobic core of the coiled-coil sequence.
In Table 4, HRN extended (902–950) represents the HRN 916–950 native sequence with the inclusion of two more native heptad sequences at the N-terminus.
The peptides in Table 4 are subjected to SEC on a Superdex 75 column (Column 2 on Instrument 1) by isocratic elution with 50 m
 aqueous phosphate buffer (NaH
 PO
PO /Na
/Na HPO
HPO containing 100 m
 NaCl at a flow-rate of 0.25 mL/min and at room temperature; sample mixtures contained 0.2 m
 of each peptide with 5 μL applied to the column.
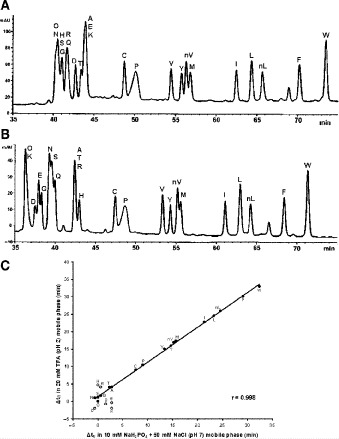
Figure 3A illustrates the elution profiles of a mixture of HRN 916–950 (monomer), HRN linked 3-stranded molecule and the complex of HRC 1150–1185 with HRN 916–950 (hexamer). Figure 3B shows the elution profiles of a mixture of HRN 916–950 (monomer), HRN 916–950 (T923I, N937I) (dimer), and HRN extended (902–950) (trimer). Figure 3C represents the log MW vs retention time plot (see Table 4 for values) resulting from observed peptide elution behavior.
As shown in Fig. 3, the native HRN 916–950 sequence is eluted as a random coil monomeric peptide during SEC. However, extending the native sequence by two heptads to form HRN extended (902–950) results in a stable, fully folded trimeric coiled-coil (Fig. 3B).
Attachment of the HRN 916–950 sequence to the linker (HRN with linker) also results in a stable, fully folded three-stranded coiled-coil (Fig. 3A).
Replacement of two polar residues, Thr and Asn, by the hydrophobic Ile residues in the native sequence (HRN 916–950) (T923I, N937I) results in a stable, fully folded dimeric coiled-coil (Fig. 3B). The Ile residues provide the additional stability in the hydrophobic core to stabilize the folded coiled-coil, but as a dimer.
Interestingly, although the native HRN 916–950 and HRC 1150–1185 sequences are eluted as unfolded, random coil peptides during SEC, a mixture of these two peptides produces a fully folded, α-helical six-helix bundle (i.e., a hexamer) (Fig. 3A).
Synthetic model amphipathic α-helical peptide standards designed to monitor the effect of SEC packings and mobile phases on peptide oligomerization have been previously described (35).
Table 4.
Size Exclusion/High Performance Liquid Chromatography Analysis of Peptide Oligomerization State4
| Peptide name | Oligomerization state | Sequenceb | MW | Retention time (min) |
|---|---|---|---|---|
| HRC 1150–1185 | monomer | a d a d a d a d a d | ||
| Ac-DISGINASVVNIQKEIDRLNEVAKNLNESLIDLQEL-amide | 4050 | |||
| HRN 916–950 | monomer | d a d a d a d a d a | ||
| Ac-IQESLTT STALGKLQDVVNQNAQALNTLVKQLSS-amide | 3756 | 53.6 | ||
| HRN 916–950 (T923I, N937I) | dimer | Ac-IQESLTTISTALGKLQDVVNQIAQALNTLVKQLSS-amide | 7534 | 48.2 |
HRN with linker 
|
3-stranded | Ac-CGGIQESLTTTSTALGK LQDVVNQNAQALNTLVKQLSS-amide | 12713 | 45.8 |
| HRN 902–950 | trimer | d a d a d a d a d a d a d a | ||
| Ac-QKQIANQFNKAISQIQESLTTTSTALGKLQDVVNQNAQALNTLVKQLSS-amide | 16068 | 43.2 | ||
| HRC 1150–1185 | hexamer | 23418 | 41.8 | |
| HRN 916–950 |
 The linker sequence is Ac-GK(X)GK(X)GK(X)G-amide, where X is –CO-CH
 -Br group attached to the
  -amino groups of lysine.
In the heptad repeat, denoted abcdefg, positions  and
and  in the hydrophobic core of the coiled-coil are underlined.
Fig. 3.

Size-exclusion chromatography analysis of oligomerization states of peptides. Column and conditions shown in Subheading
3.1.2. A,B, elution profiles of peptides; C, relationship between Log molecular weight of eluted species and their retention times. The sequences of the peptides are shown in Table
4.
molecular weight of eluted species and their retention times. The sequences of the peptides are shown in Table
4.
Ion-Exchange HPLC
The retention time of a peptide in either AEX or CEX will depend on a number of factors including buffer pH and the nature and ionic strength of the anion or cation employed for displacement of acidic (negatively charged) or basic (positively charged) peptides, respectively. Most ion-exchange separations are carried out using sodium or potassium ion as the cationic counterion and chloride ion as the anionic counterion. High-performance IEX packings tend to exhibit hydrophobic characteristics to varying degrees, perhaps resulting in significant peak broadening or even nonelution of peptides due to undesirable interactions with nonpolar residues in the peptide, which can be suppressed through the addition of an organic modifier (generally, 10–20% CH CN) to the mobile phase (42). Synthetic peptide standards are available to monitor such nonideal effects on CEX columns (sequences shown in Fig.
4 legend) and to gauge the level of organic modifier required for ideal (i.e., predictable) elution behavior of peptides on a specific column (42). These CEX peptide standards can be obtained from the Alberta Peptide Institute, University of Alberta, Edmonton, Alberta, Canada.
CN) to the mobile phase (42). Synthetic peptide standards are available to monitor such nonideal effects on CEX columns (sequences shown in Fig.
4 legend) and to gauge the level of organic modifier required for ideal (i.e., predictable) elution behavior of peptides on a specific column (42). These CEX peptide standards can be obtained from the Alberta Peptide Institute, University of Alberta, Edmonton, Alberta, Canada.
Fig. 4.
Strong cation-exchange chromatography of synthetic peptide standards. Column and conditions shown in Subheading
3.2.1. Top, elution profile of five synthetic size-exclusion standards (sequences: Ac-(GLGAKGAGVG) -amide, where
  , 2, 3, 4 or 5;
  ,
,  ,
,  ,
,  and
and  , respectively); middle, elution profile of four synthetic cation-exchange standards (sequences: Ac-GGGLGGAGGLK- amide
  , Ac-KYGLGGAGGLK-amide
  , Ac-GGALKALKGLK-amide
  and Ac-KYALKALKGLK-amide
  ; bottom, plot of observed peptide elution time versus peptide net charge, divided by the logarithm of the number of residues (LnN). (Adapted from ref.
42, with permission from Elsevier Science.)
; bottom, plot of observed peptide elution time versus peptide net charge, divided by the logarithm of the number of residues (LnN). (Adapted from ref.
42, with permission from Elsevier Science.)
Monitoring of Peptide Chain Length Effects on CEX Using Synthetic Peptide Standards
Two series of synthetic, positively charged peptide standards were subjected to CEX on a Mono S strong cation-exchange column (Column 3 on Instrument 2): a series of four 11-residue cation-exchange standards with net charges of
 ,
,  ,
,  , and
, and  ; and a series of five synthetic size-exclusion standards of 10, 20, 30, 40, and 50 residues in length (net charge of
  ,
,  ,
,  ,
,  , and
, and  , respectively). Note that the
  and
and  CEX standards both contain Tyr, allowing detection at 260–280 nm as well as 210 nm.
The peptides were eluted with a linear AB gradient (20 m
 salt/min following 10-min isocratic elution with eluent A) at a flow rate of 1 mL/min and a temperature of
  , where eluent A is 5 m
 KH
KH PO
PO , pH 6.5, and eluent B is eluent A containing 0.5
  NaCl, both eluents also containing 40% CH
 CN (see
Note 3).
CN (see
Note 3).In Fig. 4, similarly charged species are not necessarily eluted at similar times: the 50-residue peptide (
 ; Fig.
4A) is not retained as long as the 11-residue
; Fig.
4A) is not retained as long as the 11-residue  and
and  peptides (Fig.
4B); the 40-residue peptide (
peptides (Fig.
4B); the 40-residue peptide ( ; (Fig.
4A) is eluted prior to the 11-residue
; (Fig.
4A) is eluted prior to the 11-residue  peptide (G1101
Fig.
4B).
peptide (G1101
Fig.
4B).The comparative retention behavior of the peptides of different chain length and charge density is linearized by an elution time vs net charge/1nN plot (
 number of residues) (Fig.
4C). This simple linearization approach is important for the prediction of peptide retention behavior where the net charge is known.
number of residues) (Fig.
4C). This simple linearization approach is important for the prediction of peptide retention behavior where the net charge is known.
Reversed-Phase HPLC
In the authors’ experience, the best approach to most analytical peptide separations is to employ aqueous TFA to TFA/CH CN linear gradients (pH 2.0) at room temperature. Peptide resolution can be optimized by varying the steepness of the acetonitrile gradient (generally, 0.5–2.0% CH
 CN/min) and the volatility of TFA eliminates the need for subsequent sample desalting. TFA is also effective in separating complex peptide mixtures because of its ion-pairing properties. Peptides are charged molecules at most pH values and the presence of different counterions will influence their chromatographic behavior. Thus, anionic counterions (e.g.,
  , phosphate) will interact with the protonated basic (i.e., positively charged) residues of a peptide. In comparison, a cationic counterion (e.g., trimethylammonium, triethylammonium, tetrabutylammonium) will show an affinity for ionized carboxyl (i.e., negatively charged) groups. Recently, we determined the optimum TFA concentration for peptide separations to be 0.2–0.25% TFA, significantly higher than the traditionally employed concentration range of 0.05–0.1% (71).
Determination of Intrinsic Hydrophilicity/Hydrophobicity of Amino Acid Side-Chains by RP-HPLC of Model Peptides
A model peptide sequence is designed for quantitation of amino acid side-chain hydrophilicity/hydrophobicity in the absence of nearest-neighbor or conformational effects: Ac-X-G-A-K-G-A-G-V-G-L-amide, where X is substituted by the 20 amino acids plus norvaline (
 -Val), norleucine (
 -Leu) and ornithine (Orn) (10).
The peptides are eluted from a Kromasil C
 column (Column 5 on Instrument 1) at pH 2.0 by a linear AB gradient (0.25% CH
 CN/min) at a flow-rate of 0.3 mL/min and a temperature of 25°C, where eluent A is 20 m
 aqueous TFA, pH 2.0 containing 2% acetonitrile, and eluent B is 20 m
 TFA in CH
 CN (Fig.
5A). Some “wetting” of the stationary phase, particularly highly hydrophobic and high-ligand-density phases such as the Kromasil C
CN (Fig.
5A). Some “wetting” of the stationary phase, particularly highly hydrophobic and high-ligand-density phases such as the Kromasil C packing, is occasionally required to ensure reproducible results.
These same peptides are eluted from a Zorbax XDB-C
 column (Column 6) at pH 7.0 by a linear AB gradient (0.25% CH
 CN/min) at a flow-rate of 0.3 mL/min and a temperature of 25°C, where eluent A is 10 m
 aqueous NaH
 PO
PO , pH 7.0 and eluent B is eluent A containing 50% CH
 CN, both eluents also containing 50 m
 NaCl (Fig.
5B).
NaCl (Fig.
5B).The resulting intrinsic hydrophilicity/hydrophobicity coefficients are reported in Table 1 as Δt
 (Gly) values, where Δt
 (Gly) denotes the change in retention time relative to the Gly-substituted peptide. These coefficients are independent of pH, buffer conditions, ion-pairing reagents, or whether a C
 or C
or C column was used for 17 (uncharged) side-chains and are dependent on pH, buffer conditions, and ion-pairing reagents for potentially charged side-chains (Orn, Lys, His, Arg, Asp and Glu) (Fig.
5C). For a detailed discussion of the importance of these side-chain hydrophilicity/hydrophobicity coefficients in the peptide and protein field, together with validation of these values, see our recent publication (10).
column was used for 17 (uncharged) side-chains and are dependent on pH, buffer conditions, and ion-pairing reagents for potentially charged side-chains (Orn, Lys, His, Arg, Asp and Glu) (Fig.
5C). For a detailed discussion of the importance of these side-chain hydrophilicity/hydrophobicity coefficients in the peptide and protein field, together with validation of these values, see our recent publication (10).The correlation of the hydrophilicity/hydrophobicity values for the 17 uncharged side-chains at pH 2.0 and pH 7.0 was excellent as expected
 (10). The relative hydrophobicities of the acidic side-chains (Asp and Glu) decrease with an increase in pH due to deprotonation (ionization) of these side-chains at pH 7.0 (the pK
 of these side-chains is ~4.0), that is, they become negatively charged and more hydrophilic. In contrast, the His side-chain is essentially deprotonated at pH 7.0 (pK
 6.0) and thus no longer positively charged, i.e., its hydrophobicity increases dramatically. The dramatic increase in the hydrophobicity of the Arg side-chain with the change in pH from 2.0 to 7.0 is due to differences in effectiveness of the counterions TFA and H
 PO
PO anions to neutralize the positive charge of the Arg side-chain at pH 2.0 and pH 7.0, respectively. The H
 PO
PO anion more effectively neutralizes the positive charge at pH 7.0, thus increasing the relative hydrophobicity of the Arg side-chain. In the case of the alkyl amino groups on the side-chains of Orn and Lys, the increase in hydrophilicity (decrease in hydrophobicity) at pH 7.0 relative to pH 2.0 is again due to differences in the effectiveness of these two anions to ion-pair with these side-chains. The side-chains of Lys and Orn more effectively ion-pair with the TFA anion (hydrophobic ion-pairing reagent) than the H
 PO
PO ; thus, these side-chains are more hydrophobic at pH 2.0 than pH 7.0. The physicochemical properties of the guanidinium group of Arg and the alkyl amino groups of Lys and Orn are quite different. These results clearly demonstrate that Arg and Lys side-chains, although both positively charged at pH 2.0 and pH 7.0, behave differently with buffer anions, which affects their hydrophilicities/hydrophobicities differently. Thus, Arg and Lys residues on the surface of proteins should not be considered equivalent at neutral pH.
Fig. 5.
Determination of intrinsic hydrophilicity/hydrophobicity of amino acid side-chains by reversed-phase high-performance liquid chromatography of model peptides. Column and conditions shown in Subheading 3.3.1. A, pH 2.0 elution profile; B, pH 7.0 elution profile; C, correlation of amino acid side-chain coefficients obtained at pH 2.0 vs pH 7.0. Peptide sequences shown under Subheading 3.3.1.
Effect of Anionic Ion-Pairing Reagent Hydrophobicity on Selectivity of Peptide Separations
The perfluorinated homologous series of acids (TFA, PFPA, and HFBA) represents a useful series of anionic ion-pairing reagents used for peptide separations (72,73).
The order of counterion hydrophobicity is
 .
.RP-HPLC is applied to a mixture of three series of four synthetic peptides: a
 series (i.e., each peptide in the series has a net charge of
  ), a
), a  series, and a
  series (Table
5).
series (Table
5).As shown in Table 5, within each peptide series there is only a subtle increase in hydrophobicity between adjacent peptides: 1a
 1b
1b  1c
1c  1d (
1d ( series); 3a
  3b
3b  3c
3c  3d (
3d ( series); 5a
  5e
5e  5h
5h  5j (
5j ( series); this is particularly true of the
  and
and  series, where there is a difference of only one carbon atom between adjacent peptides.
The mixture of peptides is eluted from a Zorbax SB300-C
 column (Column 7 on Instrument 1) by a linear AB gradient (0.5% CH
 CN/min) at a flow rate of 0.3 mL/min and a temperature of 25°C, where eluent A is 30 m
 aqueous TFA, PFPA, or 10 m
 aqueous HFBA, pH 2.0 and eluent B is the corresponding reagent concentration in CH
 CN.
CN.As shown in Fig. 6, increasing counterion hydrophobicity (
 ) results in increasing peptide retention time; in addition, there is a general overall peak shape improvement with increasing counterion concentration (not shown).
As the hydrophobicity of the counterion increases, the relative hydrophobicity of the peptides is increasing in the order of
 peptides
  peptides
  peptides, resulting in a change in peptide elution order with increasing counterion hydrophobicity and culminating in the excellent resolution of all 12 peptides in the presence of 10 m
 HFBA whereby the peptides are separated by charged groups and hydrophobicity within these groups.
Table 5.
Sequences and Denotions of Synthetic Peptide Standards (see Subheading 3.3.2)5
Peptide Series
|
Peptide Denotion | Peptide Sequence
|
|---|---|---|

|
1a | Ac- G G G G G L G L G K – amide |
| 1b | Ac- G G A G G L G L G K – amide | |
| 1c | Ac- G G A A G L G L G K – amide | |
| 1d | Ac- G G V G G L G L G K – amide [3pt] | |

|
3a | Ac- G R G G K L G L G K – amide |
| 3b | Ac- G R A G K L G L G K – amide | |
| 3c | Ac- G R A A K L G L G K – amide | |
| 3d | Ac- G R V G K L G L G K – amide [3pt] | |

|
5a | NH - R R G G K L G L G K – amide - R R G G K L G L G K – amide |
| 5e | NH - R R V A K L G L G K – amide - R R V A K L G L G K – amide |
|
| 5h | NH - R R V V K L G L G K – amide - R R V V K L G L G K – amide |
|
| 5i | NH - R R I I K L G L G K – amide - R R I I K L G L G K – amide |
 The charge on the peptide is shown at pH 2.0.
The different amino acid substitutions are shown in bold letters.
Fig. 6.
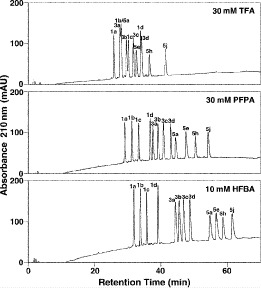
Effect of anionic ion-pairing reagent hydrophobicity on reversed-phase high-performance liquid chromatography of positively charged peptides. Column and conditions described under Subheading 3.3.2. Peptide sequences shown in Table 5. (Adapted from ref. 73, with permission from Elsevier Science.)
Effect of Temperature on RP-HPLC of Peptides
The effect of temperature on the elution behavior of a mixture of nine synthetic random coil peptides is shown in Fig. 7.
The nine 10-residue peptides each have a net charge of
 with just a subtle variation in hydrophobicity between adjacent peptides (Table
6). Indeed, there is generally a change of just one carbon atom between adjacent peptides of the
with just a subtle variation in hydrophobicity between adjacent peptides (Table
6). Indeed, there is generally a change of just one carbon atom between adjacent peptides of the  peptides; the only exceptions are peptides 3e and 3f, which have identical numbers of carbon atoms.
The peptides are eluted from a Zorbax SB300-C
 microbore column (Column 8 on Instrument 1) by a linear AB gradient (1% CH
 CN/min) at a flow rate of 0.1 mL/min and a temperature of
  , 25°C, and
  , where eluent A is 0.2% aqueous TFA, pH 2.0, and eluent B is 0.2% TFA in CH
 CN.
CN.The elution order of the peptides is based on their increasing hydrophobicity (
 ).
).As shown in Fig. 7, increasing temperature results in decreasing peptide retention time and a decrease in peak width. Such results reflect the general effects of increasing temperature, i.e., increased solubility of the solute in the mobile phase as the temperature rises as well as an increase in mass transfer between the mobile and stationary phases (74,75).
As shown in Fig. 7, an increase in temperature clearly improves overall peak resolution; indeed two pairs of peptides barely resolved as doublets at
 are baseline resolved at
  : 3d/3e and 3f/3g.
Fig. 7.
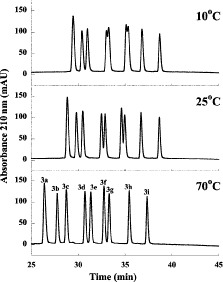
Effect of temperature on reversed-phase high-performance liquid chromato-graphy of peptides ( net charge). Column and conditions described under Subheading
3.3.3. Peptide sequences shown in Table
6.
net charge). Column and conditions described under Subheading
3.3.3. Peptide sequences shown in Table
6.
Table 6.
Sequences of Two-dimensional Cation-Exchange/Reversed-Phase Chromatography Peptide Standards6
| Peptide Standard | Net Charge | Change in Carbon atom Content | Peptide Sequence | Mass | Change in Mass |
|---|---|---|---|---|---|
| 1a | +1 | 0 | Ac-Gly-Gly-Gly-Gly-Gly-Leu-Gly-Leu-Gly-Lys-amide | 814 | 0 |
| 1b | +1 | 1 | Ac-Gly-Gly-Ala-Gly-Gly-Leu-Gly-Leu-Gly-Lys-amide | 828 | 14 |
| 1c | +1 | 2 | Ac-Gly-Gly-Ala-Ala-Gly-Leu-Gly-Leu-Gly-Lys-amide | 842 | 28 |
| 1d | +1 | 3 | Ac-Gly-Gly-Val-Gly-Gly-Leu-Gly-Leu-Gly-Lys-amide | 856 | 42 |
| 1e | +1 | 4 | Ac-Gly-Gly-Val-Ala-Gly-Leu-Gly-Leu-Gly-Lys-amide | 870 | 56 |
| 1f | +1 | 4 | Ac-Gly-Gly-Ile-Gly-Gly-Leu-Gly-Leu-Gly-Lys-amide | 870 | 56 |
| 1g | +1 | 5 | Ac-Gly-Gly-Ile-Ala-Gly-Leu-Gly-Leu-Gly-Lys-amide | 884 | 70 |
| 1h | +1 | 7 | Ac-Gly-Gly-Ile-Val-Gly-Leu-Gly-Leu-Gly-Lys-amide | 912 | 98 |
| 1i | +1 | 8 | Ac-Gly-Gly-Ile-Ile-Gly-Leu-Gly-Leu-Gly-Lys-amide | 926 | 112 |
| 2a | +2 | 0 | Gly-Gly-Gly-Gly-Gly-Leu-Gly-Leu-Gly-Lys-amide | 772 | 0 |
| 2b | +2 | 1 | Gly-Gly-Ala-Gly-Gly-Leu-Gly-Leu-Gly-Lys-amide | 786 | 14 |
| 2c | +2 | 2 | Gly-Gly-Ala-Ala-Gly-Leu-Gly-Leu-Gly-Lys-amide | 800 | 28 |
| 2d | +2 | 3 | Gly-Gly-Val-Gly-Gly-Leu-Gly-Leu-Gly-Lys-amide | 814 | 42 |
| 2e | +2 | 4 | Gly-Gly-Val-Ala-Gly-Leu-Gly-Leu-Gly-Lys-amide | 828 | 56 |
| 2f | +2 | 4 | Gly-Gly-Ile-Gly-Gly-Leu-Gly-Leu-Gly-Lys-amide | 828 | 56 |
| 2g | +2 | 5 | Gly-Gly-Ile-Ala-Gly-Leu-Gly-Leu-Gly-Lys-amide | 842 | 70 |
| 2h | +2 | 7 | Gly-Gly-Ile-Val-Gly-Leu-Gly-Leu-Gly-Lys-amide | 870 | 98 |
| 2i | +2 | 8 | Gly-Gly-Ile-Ile-Gly-Leu-Gly-Leu-Gly-Lys-amide | 884 | 112 |
| 3a | +3 | 0 | Gly-Gly-Gly-Gly-Lys-Leu-Gly-Leu-Gly-Lys-amide | 843 | 0 |
| 3b | +3 | 1 | Gly-Gly-Ala-Gly-Lys-Leu-Gly-Leu-Gly-Lys-amide | 857 | 14 |
| 3c | +3 | 2 | Gly-Gly-Ala-Ala-Lys-Leu-Gly-Leu-Gly-Lys-amide | 871 | 28 |
| 3d | +3 | 3 | Gly-Gly-Val-Gly-Lys-Leu-Gly-Leu-Gly-Lys-amide | 885 | 42 |
| 3e | +3 | 4 | Gly-Gly-Val-Ala-Lys-Leu-Gly-Leu-Gly-Lys-amide | 899 | 56 |
| 3f | +3 | 4 | Gly-Gly-Ile-Gly-Lys-Leu-Gly-Leu-Gly-Lys-amide | 899 | 56 |
| 3g | +3 | 5 | Gly-Gly-Ile-Ala-Lys-Leu-Gly-Leu-Gly-Lys-amide | 913 | 70 |
| 3h | +3 | 7 | Gly-Gly-Ile-Val-Lys-Leu-Gly-Leu-Gly-Lys-amide | 941 | 98 |
| 3i | +3 | 8 | Gly-Gly-Ile-Ile-Lys-Leu-Gly-Leu-Gly-Lys-amide | 955 | 112 |
Ac denotes α-acetyl; amide denotes Cα-amide. Standards in the  and
and  groups have a free α-amino group. Variations in composition of the peptide analogs are indicated in bold where the amino acid residues differ from 1a, 2a or 3a.
Effect of Temperature on RP-HPLC of Random Coil vs α-Helical Peptides
Figure 8 compares the RP-HPLC separation of random coil and α-helical l- or d-peptides around the optimum temperatures for overall separation of the peptide mixtures (76).
The synthetic random coil peptides have the sequence Ac-X-L-G-A-K-G-A-G-V-G-amide, where X is substituted with the 19 l- and d-amino acids and Gly.
The synthetic amphipathic α-helical peptides have the sequence Ac-E-A-E-K-A-A-K-E-X-E-K-A-A-K-E-A-E-K-amide, where X is substituted with the 19 l- and d-amino acids and Gly.
Mixtures of the peptides are subjected to RP-HPLC on a Zorbax SB300-C
 column (Column 7 on Instrument 1) using a linear AB gradient (0.5% CH
 CN/min) at a flow rate of 0.25 mL/min at various temperatures, where eluent A is 0.05% aqueous TFA and eluent B is 0.05% TFA in CH
 CN.
CN.The hydrophobicity of the RP-HPLC column, together with the nonpolar organic modifier (acetonitrile) in the mobile phase, will induce α-helical structure in peptides with that inherent α-helical potential (12 – 15). Thus, unlike random coil peptides, amphipathic
 -helical peptides will exhibit preferred binding for their nonpolar face with the hydrophobic stationary phase (12) (see
Note 4).
-helical peptides will exhibit preferred binding for their nonpolar face with the hydrophobic stationary phase (12) (see
Note 4).Both random coil and helical peptide analogs exhibited the trend of a reduction in retention time with increasing temperature
 . However, temperature has a greater effect on the l-/d-helical peptide analogs compared to the l-/d-random peptide analogs, likely due to differences in peptide structural changes with temperature variations (unfolding of the
  -helix with increasing temperature) (78).
As shown in Fig. 8, excellent separations of mixtures of l- and d-peptides are obtained at
 and
and  , respectively, in contrast to the presence of co-eluted peaks at higher and lower temperatures, indicated by the arrows.
Thus, in contrast to the optimum elution profiles in Fig. 8, the chromatograms at higher or lower temperature represent the sensitivity of a temperature variation approach to influence the selectivity of RP-HPLC for separation of peptides with conformational differences.
Fig. 8.
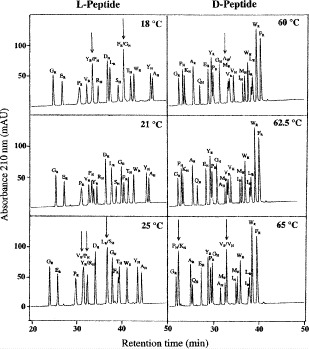
Effect of temperature on reversed-phase high-performance liquid chromato-graphy of random coil vs α-helical peptides. The subscript R and H denote random coil and helical peptides, respectively. Column, conditions, and peptide sequences described under Subheading 3.3.4. (Reproduced from ref. 76, with permission from Elsevier Science.
HILIC/CEX
It is important to note that different ion-exchange packings exhibit differing degrees of hydrophobic characteristics (42). In order to gain the full benefit of peptide separations by the HILIC mode in mixed-mode HILIC/CEX, it is important to overcome unwanted hydrophobic properties of the matrix with as low a level of organic modifier (CH CN) as possible, i.e., the ion-exchange matrix should be as hydrophilic as possible. In this way, there is a greater organic modifier range open to the researcher to effect mixed-mode HILIC/CEX peptide separations. Concomitant with this hydrophilic character, it is desirable for the column to retain even weakly charged species
  to obtain full benefit of retention based on ion-exchange as well as hydrophilic characteristics.
HILIC/CEX of Proteomic Peptide Standards
HILIC/CEX is applied to the separation of a mixture of three groups of synthetic model peptides designed as two-dimensional CEX/RP-HPLC peptide standards, i.e., proteomics standards (Table 6):
 ,
,  and
and  groups of peptides, each containing nine peptides, where peptide hydrophobicity increases in the order a
  b
b  c
c  d
d  e
e  f
f  g
g  h
h  i.
i.From Table 6, peptides within the
 ,
,  and (as noted above under Subheading
3.3.3.)
and (as noted above under Subheading
3.3.3.)  groups vary only subtly in hydrophobicity: in general, there is just a one-carbon difference between adjacent peptides except for peptide pairs 1e/1f, 2e/2f and 3e/3f which contain identical numbers of carbon atoms and for peptide pairs 1g/1h, 2g/2h and 3g/3h which differ by two carbon atoms.
The 27-peptide mixture was subjected to HILIC/CEX on a Polysulfoethyl A strong CEX column (Column 4 on Instrument 1) using a linear AB gradient (1 m
 NaClO
NaClO /min) at a flow-rate of 0.3 mL/min and a temperature of 25°C, where eluent A is 5 m
 aqueous triethylammonium phosphate, pH 4.5, and eluent B is eluent A plus 200 m
 NaClO
NaClO , both eluents also containing 60% (v/v) CH
 CN.
CN.NaClO
 is particularly useful for this mixed-mode approach as a result of its high solubility in organic modifier, which allows the use of high levels of organic modifier.
As shown in Fig. 9, an excellent separation of the 27-peptide mixture is obtained, with just the 1e/1f peptide pair not being completely resolved. Indeed, this separation is superior to that obtained by both RP-HPLC and CE (see Subheading 3.5).
The peptide separation shown in Fig. 9 is achieved by a mixed-mode or bidimensional mechanism: the three groups of peptides are separated by an ion-exchange mechanism (
 ); within these groups of peptides, the peptides are eluted in order of increasing hydrophilicity (decreasing hydrophobicity) by the HILIC mechanism. The high acetonitrile concentration during CEX promotes hydrophilic interactions with the hydrophilic CEX matrix. Thus, within each charged group of peptides, the most hydrophobic peptide is eluted first and the most hydrophilic peptide is eluted last, i.e., the opposite elution order to RP-HPLC. Compare the separation of the
  group by RP-HPLC (Fig.
7) vs HILIC/CEX (Fig.
9
).
group by RP-HPLC (Fig.
7) vs HILIC/CEX (Fig.
9
).
Fig. 9.
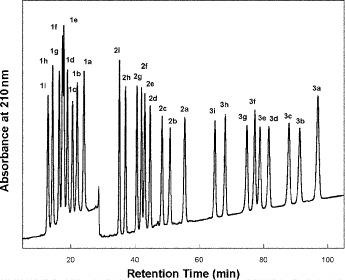
Hydrophilic interaction/cation-exchange chromatography of proteomic peptide standards. Column and conditions described under Subheading 3.4.1. Peptide sequences shown in Table 6.
Comparison of HILIC/CEX and RP-HPLC for Separation of Amphipathic  -Helical Peptides
Figure 10 compares RP-HPLC with HILIC/CEX for the separation of model amphipathic
 -helical peptides with the sequence Ac-K-W-K-S-F-L-K-T-F-K-X-A-V-K-T-V-L-H-T-A-L-K-A-I-S-S-amide, where X (in the center of the nonpolar face of the amphipathic
  -helix) is substituted by various l- and d-amino acids (29).
RP-HPLC (Fig. 10, top) is carried out on a Zorbax SB300-C
 column (Column 7 on Instrument 1) by a linear AB gradient (1% CH
 CN/min) at a flow rate of 0.3 mL/min and a temperature of
  , where eluent A is 0.05% aqueous TFA, pH 2, and eluent B is 0.05% TFA in CH
 CN.
CN.HILIC/CEX (Fig. 10, bottom) is carried out on a PolySulfoethyl A strong cation-exchange column (Column 4 on Instrument 1), by a linear AB salt gradient (5 m
 NaClO
NaClO to 250 m
 NaClO
NaClO in 50 min, i.e., 4.9 m
 NaClO
NaClO /min) at a flow-rate of 0.3 mL/min and temperature of
  , where eluent A is 5 m
 aqueous triethylammonium phosphate (TEAP), pH 4.5, containing 5 m
 NaClO
NaClO and eluent B is 5 m
 aqueous TEAP, pH 4.5, containing 250 m
 NaClO
NaClO , both eluents also containing 70% (v/v) CH
 CN (see
Note 5).
CN (see
Note 5).During RP-HPLC, the amphipathic
 -helical peptides will interact with the hydrophobic stationary phase through preferential binding with their hydrophobic faces; during HILIC/CEX, the peptides would be expected to interact with the hydrophilic stationary phase through preferential binding with their hydrophilic faces.
From Fig. 10, useful selectivity changes between RP-HPLC and HILIC/CEX of the peptides are apparent, underlining the complementary nature of these two HPLC modes.
In both RP-HPLC and HILIC/CEX, the peptides substituted by d-amino acids were always eluted earlier than their l-counterparts. This observation is likely due to disruption of the hydrophobic and hydrophilic preferred binding domains, respectively, by the introduction of a d-amino acid into an
 -helix otherwise comprised solely of l-amino acids (79,80).
Fig. 10.
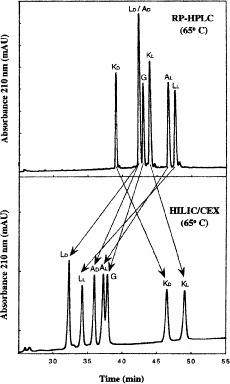
hydrophilic interaction/cation-exchange chromatography vs reversed-phase high-performance liquid chromatography of diastereomeric amphipathic  -helical peptides. Columns, conditions, and peptide sequences described under Subheading
3.4.2. (Adapted from ref.
29, with permission from Elsevier Science.)
-helical peptides. Columns, conditions, and peptide sequences described under Subheading
3.4.2. (Adapted from ref.
29, with permission from Elsevier Science.)
Monitoring the Hydrophilicity/Hydrophobicity of Amino Acid Side-Chains in the Nonpolar and Polar Faces of Amphipathic  -Helical Peptides
Figure 11 compares RP-HPLC and HILIC/CEX separations of amphipathic
 -helical peptides with amino acid substitutions made on the center of the hydrophobic face or hydrophilic face of the helix: Ac-K-W-K-S-F-L-K-T-F-K-X
 -A-X
-A-X -K-T-V-L-H-T-A-L-K-A-I-S-S-amide, where position X
 (in the center of the hydrophilic face;
  ) and position X
 (in the center of the hydrophobic face;
  ) are substituted by various l-amino acids (30).
The native peptide sequence, with Ser and Val at positions X
 and X
and X , respectively, is a biologically active amphipathic
  -helix (denoted V681) with potent antimicrobial and hemolytic properties (81,82).
The ability to monitor the hydrophilicity/hydrophobicity effects of amino acid substitutions in both the nonpolar and polar faces of potentially useful antimicrobial amphipathic
 -helical peptides is critical in the design process for such molecules.
The peptides are subjected to RP-HPLC by a linear AB gradient (1% CH
 CN/min) on a Zorbax SB300-C
 column (Column 7 on Instrument 1) at a flow-rate of 0.3 mL/min and room temperature, where eluent A is 0.05% aqueous TFA, pH 2, and eluent B is 0.05% TFA in CH
 CN.
CN.The peptides are subjected to HILIC/CEX on a PolySulfoethyl A strong cation-exchange column (Column 4 on Instrument 1), by a linear AB gradient (5 m
 NaClO
NaClO to 250 m
 NaClO
NaClO in 60 min, i.e., 4 m
 NaClO
NaClO /min) at a flow-rate of 0.3 mL/min and
  , where eluent A is 5 m
 aqueous TEAP, pH 4.5, containing 5 m
 NaClO
NaClO and eluent B is 5 m
 aqueous TEAP, pH 4.5, containing 250 m
 NaClO
NaClO , both buffers also containing 70% (v/v) CH
 CN.
CN.As shown in Fig. 11, RP-HPLC and HILIC/CEX are best suited for resolving amphipathic peptides were substitutions are made in the nonpolar and polar faces, respectively. Concomitantly, RP-HPLC and HILIC/CEX are best suited as monitors of hydrophilicity/hydrophobicity variations where amino acid substitutions were made in these respective faces.
Fig. 11.
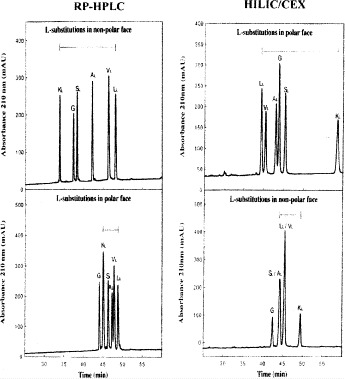
Hydrophilic interaction/cation-exchange chromatography vs reversed-phase high-performance liquid chromatography for monitoring hydrophilicity/hydrophobicity of amino acid side-chains of amphipathic  -helical peptides. Column, conditions, and peptide sequences described under Subheading
3.4.3. (Adapted from ref.
30, with permission from Elsevier Science.)
-helical peptides. Column, conditions, and peptide sequences described under Subheading
3.4.3. (Adapted from ref.
30, with permission from Elsevier Science.)
Capillary Electrophoresis
As noted above (Subheading 3.4.1.), a mixture of 27 peptides is designed as synthetic proteomic peptide standards. These peptides are comprised of three groups of nine 10-residue peptides (with net charges of
 ,
,  , and
, and  for all nine peptides within a group), the hydrophobicity of the nine peptides within a group varying only subtly between adjacent peptides. The sequences and characteristics of the peptide standards are shown and described in Table
6 and under Subheading
3.4.1.
for all nine peptides within a group), the hydrophobicity of the nine peptides within a group varying only subtly between adjacent peptides. The sequences and characteristics of the peptide standards are shown and described in Table
6 and under Subheading
3.4.1.Figure 12 shows the RP-HPLC separation of the peptide standards on a Zorbax SB300-C
 column (Column 8 on Instrument 1) obtained by a linear AB gradient (0.5% CH
 CN/min) at a flow rate of 0.3 mL/min and a temperature of
  , where eluent A is 20 m
 aqueous TFA, pH 2.0, and eluent B is 20 m
 TFA in 80% (v/v) aqueous CH
 CN.
CN.The conditions for RP-HPLC (an efficient ion-pairing reagent, relatively shallow gradient, high temperature, small packing particle size of 3.5 μm) are designed to optimize the separation. However, despite the reasonably satisfactory analytical elution profile, just 13 out of 27 peptides are well resolved. It is unlikely that this unidimensional approach to the separation of the peptides can be optimized further to achieve complete (or even near complete) resolution of all 27 peptides.
Figure 13 shows the separation of the 27 peptides by CE in analogous conditions to that of RP-HPLC (i.e., with aqueous TFA as the background electrolyte [BGE] in the absence or presence of CH
 CN, albeit in the absence of a hydrophobic surface (uncoated capillary).
Conditions for CE in Fig. 13: uncoated capillary (Capillary 1 on Instrument 4); BGE of 10 m
 aqueous TFA, adjusted to pH 2.0 with LiOH, with or without 25% (v/v) CH
 CN; applied voltage, 25 kV (direct polarity) with 5-min voltage ramp; temperature,
  ; UV absorption at 195 nm.
As shown in Fig. 13, both in the absence (top panel) and presence (bottom panel) of 25% CH
 CN, the peptides are separated according to their charge-to-mass ratio (capillary zone electrophoresis (CZE) mechanism), each peak representing nine co-migrated peptides. The mobility of these three groups of peptides is according to net charge, i.e., as expected, the
  group migrates faster than the
  group, which migrates faster than the
  group.
Figure 13 represents a unidimensional CE separation, where peptide separation is achieved/optimized via a single peptide property (charge) and via a single charge-based mechanism (CZE). This laboratory believes that the introduction of a hydrophobicity-based mechanism, to produce a bidimensional separation, would enable an effective peptide separation.
The 27 peptides were again subjected to CE under the following conditions: BGE of 0.4
 aqueous TFA, PFPA, or HFBA, adjusted to pH 2.0 with LiOH; remaining conditions as above.
As shown in Fig. 14, an excellent separation of the 27 peptides is now achieved, with increasing ion-pairing reagent hydrophobicity (TFA
 PFPA
PFPA  HFBA) resulting in improved resolution.
These separations represent bidimensional separations: peptides of the same length but different nominal charge are separated in order of decreasing charge (i.e.,
 peptides migrate the earliest and
  peptides migrate the last) according to a CZE mechanism; within each group of peptides, the peptides are separated in order of increasing hydrophobicity according to a hydrophobically mediated mechanism introduced by the anionic ion-pairing reagent, i.e., within each charged group of peptides, the most hydrophobic peptide is eluted last and the most hydrophilic peptide is eluted first., analogous to that seen in RP-HPLC (Fig.
7).
peptides migrate the last) according to a CZE mechanism; within each group of peptides, the peptides are separated in order of increasing hydrophobicity according to a hydrophobically mediated mechanism introduced by the anionic ion-pairing reagent, i.e., within each charged group of peptides, the most hydrophobic peptide is eluted last and the most hydrophilic peptide is eluted first., analogous to that seen in RP-HPLC (Fig.
7).This novel CE approach has been termed ion-interaction (II)CZE and is clearly superior to RP-HPLC (Fig. 12) for separation of these peptide standards. This CE approach also exhibits a much larger peak capacity than RP-HPLC, as seen by the large distance between the
 and
and  peptide groups, where peptides of different charge-to-mass ratios could be located.
It should be noted that only one pair of peptides with identical charge-to-mass ratios (denoted 1e/1f) was not resolved in the presence of 0.4
 HFBA. However, two other peptide pairs with identical charge-to-mass ratios (one pair in each of the
  and
and  peptides; 2e/2f and 3e/3f, respectively) are resolved under these conditions, a significant achievement when one considers that such separations were hitherto believed impossible.
Interestingly, as noted previously (Subheading 3.4.1.), the best overall resolution of the peptides within each group is achieved by HILIC/CEX. The high peak capacity of the II-CZE and HILIC/CEX approaches, coupled with their excellent resolution capabilities, again highlight their useful complementarity (and often superior separative effectiveness) to the ubiquitous RP-HPLC mode.
Fig. 12.
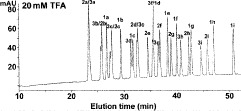
Reversed-phase high-performance liquid chromatography of proteomic peptide standards. Column and conditions described under Subheading 3.5. Peptide sequences shown in Table 6. (Adapted from ref. 56, with permission from Elsevier Science.)
Fig. 13.
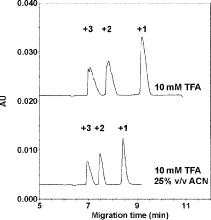
Capillary zone electrophoresis of proteomic peptide standards. Capillary and conditions described under Subheading 3.5. Peptide sequences shown in Table 6. (Reproduced from ref. 56, with permission from Elsevier Science.)
Fig. 14.
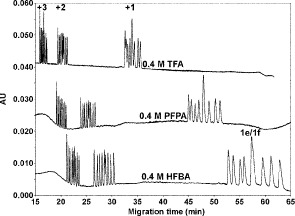
Ion-interaction capillary zone electrophoresis of proteomic peptide standards. Capillary and conditions described under Subheading 3.5. Peptide sequences shown in Table 6. (Reproduced from ref. 56, with permission from Elsevier Science.)
Preparative HPLC of Synthetic Peptides and Recombinant Proteins
The excellent resolving power and separation time of RP-HPLC, coupled with the availability of volatile mobile phases, has made this HPLC mode the favored method for preparative separations of peptides. Also, most researchers would likely wish to carry out both analytical and preparative peptide separations on analytical equipment and columns no longer than 250 mm and no larger diameters than 10 mm ID, avoiding the prohibitively expense scale-up costs in terms of equipment, larger columns and solvent consumption. It has long been a goal of this laboratory to develop novel one-step purification schemes to avoid loss of product yield frequently a feature of multistep protocols (e.g., SEC followed by IEX and RP-HPLC).
Preparative One-Step RP-HPLC of a Synthetic Amphipathic  -Helical Antimicrobial Peptide
Figure 15 shows the analytical RP-HPLC profile of a crude synthetic 26-residue amphipathic
 -helical antimicrobial peptide, with the sequence Ac-K-W-K-S-F-L-K-T-F-K-S-A-K-K-T-V-L-H-T-A-L-K-A-I-S-S-amide and all residues are d-amino acids (83).
The analytical run was carried out on a Zorbax SB300-C
 column (Column 7 on Instrument 1) by a linear AB gradient (1% CH
 CN/min) at a flow rate of 0.25 mL/min and room temperature, where eluent A is 0.2% aqueous TFA, pH 2.0, and eluent B is 0.2% TFA in CH
 CN.
CN.As shown in Fig. 15, the synthesis of the peptide by the solid-phase approach is successful; however, purification of the desired product from both hydrophilic and hydrophobic impurities is clearly necessary.
The synthetic crude peptide is applied (100 mg and 200 mg sample amounts) to a Zorbax SB300-C
 semipreparative RP-HPLC column (Column 9 on Instrument 3). A linear AB gradient (1% CH
 CN/min for 30 min, followed by 0.1% CH
 CN/min for 150 min, followed by 1% CH
 CN/min for 30 min) at a flow rate of 2 mL/min and room temperature, where eluent A is 0.2% aqueous TFA, pH 2, and eluent B is 0.2% TFA in CH
 CN. To design the gradient method, a “rule of thumb” has been developed. The researcher determines the percentage acetonitrile required to elute the peptide of interest by running the crude peptide on an analytical column at 1% CH
 CN per min. In the present case, the peptide of interest is eluted at 42% CH
 CN. To establish the percentage CH
 CN at which the 0.1% CH
 CN gradient begins, the rule of thumb is to start 12% below that required to elute the peptide in the 1% gradient run. Thus, the gradient for the preparative run is 0 to 30% acetonitrile at 1% acetonitrile/min (30% is 12% below 42%), then begin the gradient of 0.1% CH
 CN per min for 150 min (increase of 15% CH
 CN) followed by 1% CH
 CN per min for 30 min to wash the remaining hydrophobic impurities off the column.
Fractions are collected every 2 min and fraction analysis carried out under the same conditions described for Fig. 15. Fractions are repooled as hydrophilic impurities, pure product and hydrophobic impurities (Fig. 16A, B, and C, respectively). These three pools are then lyophilized, redissolved in water (10 mL) and reanalyzed by RP-HPLC (5 μL sample volumes; same conditions as described for Fig. 15).
Figure 16 shows the excellent product purity and yield obtained by this slow gradient approach to purification of the 200-mg sample load (Fig. 16B). Very little product is found in the hydrophilic fraction (Fig. 16 A) and hydrophobic fraction (Fig. 16 C).
Figure 17 illustrates fraction analyses of adjacent fractions at the beginning and end of product appearance for both the 100 mg (top panels) and 200 mg (bottom panels) sample amounts. Note that only one fraction for each sample amount contained overlapping product and hydrophilic impurities (Fr. 63 and Fr. 54 for 100-mg and 200-mg runs, respectively) or overlapping product and hydrophobic impurities (Fr. 75 and Fr. 71 for 100-mg and 200-mg runs, respectively), underlying the effectiveness of this slow gradient approach for resolution of desired peptide product from even closely structurally related synthetic impurities.
It should be noted that the greater the sample load, the sooner the appearance of desired peptide product eluted from the column, i.e., Fr. 54 for a 200-mg load vs Fr. 63 for a 100-mg load. In addition, the larger the load, the greater the number of fractions needed for product elution (13 fractions for the 100 mg load and 18 fractions for the 200-mg load).
The RP-HPLC column has the capacity for an even larger sample load than 200 mg. However, there is not sufficient material available to determine the maximum load on this column.
Fig. 15.
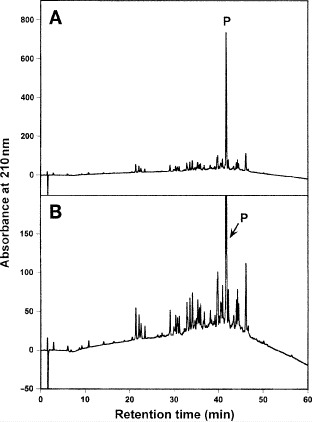
Analytical reversed-phase high-performance liquid chromatography profile of crude synthetic 26-residue amphipathic  -helical antimicrobial peptide. Column, conditions, and peptide sequence shown in Subheading
3.6.1. A, On-scale elution profile; B, fourfold expansion of elution profile. P denotes desired product.
-helical antimicrobial peptide. Column, conditions, and peptide sequence shown in Subheading
3.6.1. A, On-scale elution profile; B, fourfold expansion of elution profile. P denotes desired product.
Fig. 16.
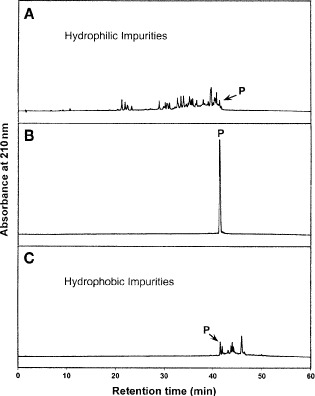
Pooled fractions following reversed-phase (RP)-high-performance liquid chromatography (HPLC) purification of 100 mg of crude synthetic 26-residue amphipathic  -helical antimicrobial peptide. Column, conditions, and peptide sequence described under Subheading
3.6.1. Analytical RP-HPLC elution profiles of pooled fractions: (A) pool of all fractions containing hydrophilic impurities, (B) pool of all fractions containing pure product, denoted P, and (C) pool of all fractions containing hydrophobic impurities.
-helical antimicrobial peptide. Column, conditions, and peptide sequence described under Subheading
3.6.1. Analytical RP-HPLC elution profiles of pooled fractions: (A) pool of all fractions containing hydrophilic impurities, (B) pool of all fractions containing pure product, denoted P, and (C) pool of all fractions containing hydrophobic impurities.
Fig. 17.
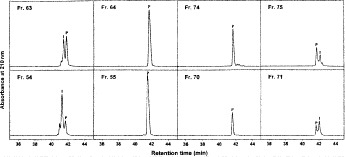
Fraction analysis of adjacent fractions at beginning and end of product appearance following preparative reversed-phase (RP)-high-performance liquid chromatography (HPLC) of 100 mg (top panels) and 200 mg (bottom panels) of synthetic 26-residue amphipathic  -helical antimicrobial peptide. Column, conditions of preparative RP-HPLC and fraction analysis, and peptide sequence described under Subheading
3.6.1. P denotes desired product.
-helical antimicrobial peptide. Column, conditions of preparative RP-HPLC and fraction analysis, and peptide sequence described under Subheading
3.6.1. P denotes desired product.
Preparative One-Step Purification of a Recombinant Protein From a Whole Cell Lysate
A truncated form (99 residues) of chicken skeletal
 -tropomyosin (denoted Tm1-99) is prepared as fusion protein containing a T7 tag (14 amino acids in length) at the N-terminus (84).
The construct is inserted into a pET3a vector and the fusion protein is subsequently overexpressed in Escherichia coli.
Following cell lysis, the cell contents are extracted with 0.1% aqueous TFA.
Figure 18 (top) presents an analytical RP-HPLC elution profile of the cell lysate. This profile is obtained on a Zorbax SB300-C
 column (Column 7 on Instrument 1) by a linear AB gradient (1% CH
 CN/min) at a flow rate of 0.3 mL/min and room temperature, where eluent A is 0.05% aqueous TFA, pH 2.0, and eluent B is 0.05% TFA in CH
 CN.
CN.As shown in Fig. 18 (top), the desired Tm1-99 product represented 3.2% of total contents of crude sample.
A sample volume of 4 mL is applied to a Zorbax SB300-C
 narrow bore column (Column 7 on Instrument 3) and subjected to a linear AB gradient (2% CH
 CN/min up to 24% CH
 CN, followed by 0.1% CH
 CN/min up to 40% CH
 CN; a rapid rise of 4% CH
 CN/min up to 60% CH
 CN was then followed by an isocratic wash with 60% aqueous CH
 CN) at a flow rate of 0.3 mL/min and room temperature, where eluent A is 0.05% aqueous TFA, pH 2, and eluent B is 0.05% TFA in CH
 CN.
CN.Fractions are collected every 2 min and analyzed by RP-HPLC on a Zorbax SB300-C
 column (Column 7 on Instrument 1) under the same conditions as for the analytical profile of the crude cell lysates (Fig.
18, top), save for a linear AB gradient of 2% CH
column (Column 7 on Instrument 1) under the same conditions as for the analytical profile of the crude cell lysates (Fig.
18, top), save for a linear AB gradient of 2% CH CN/min.
The fractions are pooled into hydrophilic impurities (Fig. 18, bottom left), purified product (Fig. 18, bottom middle), and hydrophobic impurities (Fig. 18, bottom right). These analytical profiles are obtained with the same column and conditions as the crude analytical profile (Fig. 18, top).
As shown in Fig. 18, the purified product had a purity of <95% and a yield of <90% recovery. This was in contrast with a 64% purity of Tm1-99 obtained by a one-step antibody affinity approach at one-tenth the recovery of the one-step RP-HPLC approach. Scale up of the affinity approach to produce enough semi-pure material (still requiring the final RP-HPLC step) of comparable purity and yield of the RP-HPLC-based protocol alone would certainly be prohibitively expensive.
Note that the same rule of thumb for the shallow gradient approach of 0.1% CH
 CN/min (as described for the 26-residue peptide (Subheading
3.6.1.) can be applied to the preparative purification of larger polypeptides and proteins.
CN/min (as described for the 26-residue peptide (Subheading
3.6.1.) can be applied to the preparative purification of larger polypeptides and proteins.
Fig. 18.
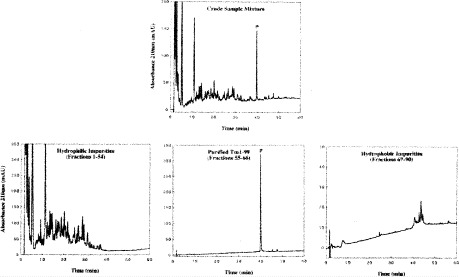
One-step preparative reversed-phase (RP)-high-performance liquid chromatography (HPLC) purification of a recombinant protein from a whole cell lysate. Top, analytical RP-HPLC profile of crude sample mixture. Bottom: pooled fractions following preparative purification of recombinant protein Tm 1–99. Column, conditions of analytical RP-HPLC, preparative RP-HPLC, and fraction analysis described under Subheading 3.6.2. P denotes desired product. (Reproduced from ref. 84, with permission from Elsevier Science.)
Alternative Preparative RP-HPLC Purification Approaches on Analytical Columns and Instrumentation
The slow gradient approach to preparative RP-HPLC of peptides and proteins described under Subheadings 3.6.1. and 3.6.2. produces excellent yields of purified samples. Indeed, we recommend this simple one-step RP-HPLC protocol for routine purification of relatively small sample quantities. However, for larger scale applications, where it is of particular importance to maximize, for cost purposes, yield of purified material per gram of RP-HPLC stationary phase, we wish to direct readers to our novel preparative approach termed sample displacement chromatography (SDC), characterized by the major separation process generally taking place in the absence of organic modifier concomitant with optimum utilization of RP-HPLC column capacity (85 – 89).
One-Step SDC of Peptides
Conventional reversed-phase SDC is conceived as a novel purification approach on high-performance analytical columns and instrumentation, where the only variable is sample load, i.e., without the addition of organic modifier or displacer (the latter being characteristic of traditional displacement chromatography (90)) to the mobile phase (85 – 89).
Because peptides favor an adsorption-desorption mechanism of interaction with a hydrophobic stationary phase, under normal analytical load conditions an organic modifier is typically required for their elution from a reversed-phase column. However, when such a column is subjected to high loading of a peptide mixture dissolved in a 100% aqueous mobile phase, e.g., 0.1% aqueous TFA, there is competition by the sample components for the adsorption sites on the reversed-phase sorbent, resulting in solute–solute displacement during washing with 100% aqueous mobile phase. A more hydrophobic peptide component competes more successfully for these sites than a less hydrophobic component, which is thus displaced ahead of the more hydrophobic solute, i.e., the sample components acts as their own displacers.
The SDC approach is thus simply an application of the well established general principles of displacement chromatography without the need for a separate displacer. This mode of operation, a hybrid scheme of frontal chromatography followed by elution, is characterized by a marked reduction in solvent consumption, minimal elution volumes, and the collection of fewer fractions for product isolation than in conventional RP-HPLC, with consequence reductions in time and handling.
Several successful SDC separations have been reported (85 – 89), including the purification of a therapeutically important synthetic peptide representing part of the sequence of luteinizing hormonereleasing hormone (LHRH) (88).
SDC has also been adapted to modular solid-phase extraction (SPE) technology for development of a rapid, simple and cost-effective procedure for the efficient and parallel purification of multiple peptide mixtures (91).
An interesting application of anion-exchange chromatography in sample displacement mode for protein purification has also been reported (92).
Two-Step SDC of Peptides
SDC methodology has been developed further to carry out preparative separations on analytical equipment and columns (15 cm in length) for sample loads
 200 mg (93).
Following sample loading of 10- or 11-residue bradykinin antagonists in 100% aqueous solvent (e.g., 0.05% aqueous TFA) at a concentration of 7–10 mg/mL (sample loads varying from 67 mg to 200 mg) onto a small C
 column(150
  4.6 mm ID, made up of 3
  50-mm columns attached in series), isocratic elution with aqueous CH
 CN at two concentrations is applied.
The first (lower) CH
 CN concentration displaces hydrophilic impurities off the column; the second (higher) CH
 CN concentration displaces pure product from the column. Hydrophobic impurities remain trapped on the column.
This modified SDC approach promises to allow great flexibility in purifying peptides, at high yield of pure product (<99% purity), and encompassing a range of sample hydrophobicities and sample loads.
Notes
Although highly pure TEA can be readily purchased, the authors’ laboratory has regularly used lesser-grade reagent (following distillation over ninhydrin, where necessary) with no discernible problems.
Occasionally, it has been necessary to remove UV-absorbing contaminants from reagent-grade NaClO
 by passing a stock solution of the salt through a preparative (e.g., 1 cm ID) RP-HPLC column (following filtration through a 0.22-μm filter).
The unusually high concentration of acetonitrile (40%) is required to eliminate nonideal behavior because of the considerable hydrophobic characteristics of the column packing. Other CEX packings are available that are hydrophilic and require considerably less acetonitrile or no acetonitrile in the mobile phase. In general, it is preferable to have each HPLC mode utilize just a single mechanism, i.e., ion-exchange mechanism only, in the absence of any nonspecific hydrophobic interactions which could complicate interpretation of results.
Fifty percent of all
 -helices in proteins are amphipathic (77).
In a similar manner to the effect of the hydrophobic environment characteristic of RP-HPLC in inducing helical structure in potential
 -helical peptides, the presence of a high concentration (70% in this case) of organic modifier in HILIC/CEX will also induce such structure.
Acknowledgment
This work was supported by a National Institutes of Health grant to R.S. Hodges (R01GM61855).
References
- 1.Dorsey J.G., Foley J.P., Cooper W.T., Barford R.A., Barth H.G. Liquid chromatography: theory and methodology. Anal. Chem. 1992;64:353–389. doi: 10.1021/ac00036a020. [DOI] [PubMed] [Google Scholar]
- 2.Mant, C. T., Zhou, N. E., and Hodges, R. S. (1992) Amino acids and peptides, in Chromatography, 5th ed. (Heftmann, E., ed.). Elsevier, Amsterdam, The Netherlands: pp. B75–B150.
- 3.Mant C.T., Hodges R.S. Analysis of peptides by HPLC. Methods Enzymol. 1996;271:3–50. doi: 10.1016/S0076-6879(96)71003-0. [DOI] [PubMed] [Google Scholar]
- 4.Mant C.T., Kondejewski L.H., Cachia P.J., Monera O.D., Hodges R.S. Analysis of synthetic peptides by high-performance liquid chromatography. Methods Enzymol. 1997;289:426–469. doi: 10.1016/S0076-6879(97)89058-1. [DOI] [PubMed] [Google Scholar]
- 5.Mant C.T., Hodges R.S., editors. HPLC of Peptides and Proteins: Separation, Analysis and Conformation. Boca Raton, FL.: CRC; 1991. [Google Scholar]
- 6.Hearn M.T.W., editor. HPLC of Proteins, Peptides and Polynucleotides: Contemporary Topics and Application. New York, NY.: VCH; 1991. [Google Scholar]
- 7.Cunico R.L., Gooding K.M., Wehr T., editors. Basic HPLC and CE of Biomolecules. Richmond, CA.: Bay Bioanalytical Laboratory; 1998. [Google Scholar]
- 8.Gooding K.M., Regnier F.E., editors. HPLC of Biological Macromolecules. 2nd ed. New York, NY.: Marcel Dekker; 2002. [Google Scholar]
- 9.Hancock, W. S. (ed.) (1984) Handbook of HPLC for the Separation of Amino Acids, Peptides and Proteins, Vols. I and II. CRC, Boca Raton, FL.
- 10.Kovacs J.M., Mant C.T., Hodges R.S. Determination of intrinsic hydrophilicity/hydrophobicity of amino acid side-chains in peptides in the absence of nearest-neighbor or conformational effects. Biopolymers (Peptide Science) 2006;84:283–297. doi: 10.1002/bip.20417. [DOI] [PMC free article] [PubMed] [Google Scholar]
- 11.Zhou N.E., Monera O.D., Kay C.M., Hodges R.S. α-Helical propensities of amino acids in the hydrophobic face of an amphipathic α-helix. Protein Pep. Lett. 1994;1:114–119. [Google Scholar]
- 12.Zhou N.E., Mant C.T., Hodges R.S. Effect of preferred binding domains on peptide retention behavior in reversed-phase chromatography: amphipathic α-helices. Peptide Res. 1990;3:8–20. [PubMed] [Google Scholar]
- 13.Blondelle S.E., Ostresh J.M., Houghten R.A., Pérez-Payá E. Induced conformational states of amphipathic peptides in aqueous/lipid environments. Biophys. J. 1995;68:351–359. doi: 10.1016/S0006-3495(95)80194-3. [DOI] [PMC free article] [PubMed] [Google Scholar]
- 14.Purcell A.W., Aguilar M.I., Wettenhall R.E.W., Hearn M.T.W. Induction of amphipathic helical peptide structures in RP-HPLC. Peptide Res. 1995;8:160–170. [PubMed] [Google Scholar]
- 15.Steer D.L., Thompson P.E., Blondelle S.E., Houghten R.A., Aguilar M.I. Comparison of the binding of α-helical and β-sheet peptides to a hydrophobic surface. J. Peptide Res. 1998;51:401–412. doi: 10.1111/j.1399-3011.1998.tb00638.x. [DOI] [PubMed] [Google Scholar]
- 16.Wagschal K., Tripet B., Lavigne P., Mant C., Hodges R.S. The role of position a in determining the stability and oligomerization state of α-helical coiled coils: 20 amino acid stability coefficients in the hydrophobic core of proteins. Protein Sci. 1999;8:2312–2329. doi: 10.1110/ps.8.11.2312. [DOI] [PMC free article] [PubMed] [Google Scholar]
- 17.Tripet B., Wagschal K., Lavigne P., Mant C.T., Hodges R.S. Effects of side-chain characteristics on stability and oligomerization state of a de novo-designed model coiled-coil: 20 amino acid substitutions in position “d.”. J. Mol. Biol. 2000;300:377–402. doi: 10.1006/jmbi.2000.3866. [DOI] [PubMed] [Google Scholar]
- 18.Hodges R.S., Zhou N.E., Kay C.M., Semchuk P.D. Synthetic model proteins: contribution of hydrophobic residues and disulfide bonds to protein stability. Peptide Res. 1990;3:123–137. [PubMed] [Google Scholar]
- 19.Zhu B.-Y., Mant C.T., Hodges R.S. Hydrophilic-interaction chromatography of peptides on hydrophilic and strong-cation-exchange columns. J. Chromatogr. 1991;548:13–24. doi: 10.1016/S0021-9673(01)88590-3. [DOI] [PubMed] [Google Scholar]
- 20.Zhu B.-Y., Mant C.T., Hodges R.S. Mixed-mode hydrophilic and ionic interaction chromatography rivals reversed-phase chromatography for the separation of peptides. J. Chromatogr. 1992;594:75–86. doi: 10.1016/0021-9673(92)80314-K. [DOI] [Google Scholar]
- 21.Lindner H., Sarg B., Meranes C., Helliger W. Separation of acetylated core histones by hydrophilic-interaction liquid chromatography. J. Chromatogr. A. 1996;743:137–144. doi: 10.1016/0021-9673(96)00131-8. [DOI] [PubMed] [Google Scholar]
- 22.Lindner H., Sarg B., Meraner C., Helliger W. Application of hydrophilic-interaction liquid chromatography to the separation of phosphorylated H1 histones. J. Chromatogr. A. 1997;782:55–62. doi: 10.1016/S0021-9673(97)00468-8. [DOI] [PubMed] [Google Scholar]
- 23.Mant C.T., Litowski J.R., Hodges R.S. Hydrophilic interaction/cation-exchange chromatography for separation of amphipathic α-helical peptides. J. Chromatogr. A. 1998;816:65–78. doi: 10.1016/S0021-9673(98)00507-X. [DOI] [PubMed] [Google Scholar]
- 24.Mant C.T., Kondejewski L.H., Hodges R.S. Hydrophilic interaction/cation-exchange chromatography for separation of cyclic peptides. J. Chromatogr. A. 1998;816:79–88. doi: 10.1016/S0021-9673(98)00508-1. [DOI] [PubMed] [Google Scholar]
- 25.Lindner H., Sarg B., Hoertnagl B., Helliger W. The microheterogeneity of the mammalian H1ô histone. Evidence for an age-dependent deamidation. J. Biol. Chem. 1998;273:13,324–13,330. doi: 10.1074/jbc.273.21.13324. [DOI] [PubMed] [Google Scholar]
- 26.Lindner H., Sarg B., Grunicke H., Helliger W. Age-dependent deamidation of H1ô histones in chromatin of mammalian tissues. J. Cancer Res. Clin. Oncol. 1999;125:182–186. doi: 10.1007/s004320050261. [DOI] [PMC free article] [PubMed] [Google Scholar]
- 27.Litowski J.R., Semchuk P.D., Mant C.T., Hodges R.S. Hydrophilic interaction/cation-exchange chromatography for the purification of synthetic peptides from closely related impurities: serine side-chain acetylated peptides. J. Peptide Res. 1999;54:1–11. doi: 10.1034/j.1399-3011.1999.00066.x. [DOI] [PubMed] [Google Scholar]
- 28.Mant, C. T. and Hodges, R. S. (2000) Liquid chromatography, in Encyclopedia of Separation Science (Wilson, I. D., Adland, T. R., Poole, C. F. and Cook, M., eds.), Academic: New York, pp. 3615–3626.
- 29.Hartmann E., Chen Y., Mant C.T., Jungbauer A., Hodges R.S. Comparison of reversed-phase liquid chromatography and hydrophilic interaction/cation-exchange chromatography for the separation of amphipathic α-helical peptides with L- and D-amino acid substitutions in the hydrophilic face. J. Chromatogr. A. 2003;1009:61–71. doi: 10.1016/S0021-9673(03)00620-4. [DOI] [PubMed] [Google Scholar]
- 30.Hodges R.S., Chen Y., Kopecky E., Hodges R.S. Monitoring the hydrophilicity/hydrophobicity of amino acid side-chains in the non-polar and polar faces of amphipathic α-helices by reversed-phase and hydrophilic interaction/cation-exchange chromatography. J. Chromatogr. A. 2004;1053:161–172. [PubMed] [Google Scholar]
- 31.Mant C.T., Hodges R.S. A general method for the separation of cyanagen bromide digests of proteins by high-performance liquid chromatography: rabbit skeletal troponin I. J. Chromatogr. 1985;326:349–356. doi: 10.1016/S0021-9673(01)87460-4. [DOI] [PubMed] [Google Scholar]
- 32.Mant C.T., Hodges R.S. Optimization of peptide separations in high-performance liquid chromatography. J. Liq. Chromatogr. 1989;12:139–172. doi: 10.1080/01483918908049194. [DOI] [Google Scholar]
- 33.Opiteck G.J., Jorgenson J.W., Anderegg R.J. Two-dimensional SEC-RPLC coupled to mass spectrometry for the analysis of peptides. Anal. Chem. 1997;69:2283–2291. doi: 10.1021/ac961156d. [DOI] [PubMed] [Google Scholar]
- 34.Liu H., Lin D., Yates J.R. Multidimensional separations for protein/peptide analysis in the post-genomic era. Biotechniques. 2002;32:898–911. doi: 10.2144/02324pt01. [DOI] [PubMed] [Google Scholar]
- 35.Mant C.T., Chao H., Hodges R.S. Effect of mobile phase on the oligomerization state of α-helical coiled-coil peptides during high-performance size-exclusion chromatography. J. Chromatogr. A. 1997;791:85–98. doi: 10.1016/S0021-9673(97)00767-X. [DOI] [PubMed] [Google Scholar]
- 36.Andrews P.C. Ion-exchange HPLC for peptide purification. Peptide Res. 1988;1:93–99. [PubMed] [Google Scholar]
- 37.Adachi T., Takayanagi H., Sharpe A.D. Ion-exchange high-performance liquid chromatographic separation of protein variants and isoforms on MCI GEL ProtEx stationary phases. J. Chromatogr. A. 1997;763:57–63. doi: 10.1016/S0021-9673(96)01012-6. [DOI] [PubMed] [Google Scholar]
- 38.Wagner K., Miliotis T., Marko-Varga G., Bischoff R., Unger K.K. An automated online multidimensional HPLC system for protein and peptide mapping with integrated sample preparation. Anal. Chem. 2002;74:809–820. doi: 10.1021/ac010627f. [DOI] [PubMed] [Google Scholar]
- 39.Kato Y., Nakamura K., Kitasuma T., Tsuda T., Hasegawa M., Sasaki H. Effect of chromatographic conditions on resolution in high-performance ion-exchange chromatography on macroporous anion-exchange resin. J. Chromatogr. A. 2004;1031:101–105. doi: 10.1016/j.chroma.2003.11.036. [DOI] [PubMed] [Google Scholar]
- 40.Andersen T., Pepaj M., Trones R., Lundanes E., Greibrokk T. Isoelectric point separation of proteins by capillary pH-gradient ion-exchange chromatography. J. Chromatogr. A. 2004;1025:217–226. doi: 10.1016/j.chroma.2003.10.093. [DOI] [PubMed] [Google Scholar]
- 41.Mant C.T., Hodges R.S. Separation of peptides by strong cation-exchange high-performance liquid chromatography. J. Chromatogr. 1985;327:147–155. doi: 10.1016/S0021-9673(01)81643-5. [DOI] [PubMed] [Google Scholar]
- 42.Burke T.W.L., Mant C.T., Black J.A., Hodges R.S. Strong cation-exchange high-performance liquid chromatography of peptides. Effect of non-specific hydrophobic interactions and linearization of peptide retention behaviour. J. Chromatogr. 1989;476:377–389. doi: 10.1016/S0021-9673(01)93883-X. [DOI] [PubMed] [Google Scholar]
- 43.Link A.J., Eng J., Schieltz D.M., et al. Direct analysis of protein complexes using mass spectrometry. Nat. Biotech. 1999;17:676–682. doi: 10.1038/10890. [DOI] [PubMed] [Google Scholar]
- 44.Peng J., Elias J.E., Thoreen C.C., Licklider L.J., Gygi S.P. Evaluation of multidimensional chromatography coupled with tandem mass spectrometry (LC/LC-MS/MS) for large-scale protein analysis: the yeast proteome. J. Proteome Res. 2003;2:43–50. doi: 10.1021/pr025556v. [DOI] [PubMed] [Google Scholar]
- 45.Kang X., Frey D.D. High-performance cation-exchange chromatofocusing of proteins. J. Chromatogr. A. 2003;991:117–128. doi: 10.1016/S0021-9673(03)00210-3. [DOI] [PubMed] [Google Scholar]
- 46.Mant C.T., Hodges R.S. Monitoring free silanols on reversed-phase supports with peptide standards. Chromatographia. 1987;24:805–814. doi: 10.1007/BF02688589. [DOI] [Google Scholar]
- 47.Alpert A.J. Hydrophilic-interaction chromatography for the separation of peptides, nucleic acids and other polar compounds. J. Chromatogr. 1990;499:177–196. doi: 10.1016/S0021-9673(00)96972-3. [DOI] [PubMed] [Google Scholar]
- 48.Thorsteinsdòttir M., Beijersten I., Westerlund D. Capillary electroseparations of enkephalin-related peptides and protein kinase A peptide substrates. Electrophoresis. 1995;16:564–573. doi: 10.1002/elps.1150160192. [DOI] [PubMed] [Google Scholar]
- 49.Kašičhka V. Capillary electrophoresis of peptides. Electrophoresis. 1999;20:3084–3105. doi: 10.1002/(SICI)1522-2683(19991001)20:15/16<3084::AID-ELPS3084>3.0.CO;2-4. [DOI] [PubMed] [Google Scholar]
- 50.Kašičhka V. Recent advances in capillary electrophoresis of peptides. Electrophoresis. 2001;22:4139–4162. doi: 10.1002/1522-2683(200111)22:19<4139::AID-ELPS4139>3.0.CO;2-G. [DOI] [PubMed] [Google Scholar]
- 51.Hu S., Dovichi N.J. Capillary electrophoresis for the analysis of biopolymers. Anal. Chem. 2002;74:2833–2850. doi: 10.1021/ac0202379. [DOI] [PubMed] [Google Scholar]
- 52.Popa T.V., Mant C.T., Hodges R.S. Capillary electrophoresis of synthetic peptide standards varying in charge and hydrophobicity. Electrophoresis. 2003;24:4197–4208. doi: 10.1002/elps.200305576. [DOI] [PubMed] [Google Scholar]
- 53.Popa T.V., Mant C.T., Hodges R.S. Capillary electrophoresis of amphipathic α-helical peptide diastereomers. Electrophoresis. 2004;25:94–107. doi: 10.1002/elps.200305654. [DOI] [PubMed] [Google Scholar]
- 54.Popa T.V., Mant C.T., Hodges R.S. Capillary electrophoresis of cationic random coil peptide standards: effect of anionic ion-pairing reagents and comparison with reversed-phase chromatography. Electrophoresis. 2004;25:1219–1229. doi: 10.1002/elps.200305889. [DOI] [PubMed] [Google Scholar]
- 55.Popa T.V., Mant C.T., Chen Y., Hodges R.S. Capillary zone electrophoresis (CZE) of α-helical diastereomeric peptide pairs using anionic ion-pairing reagents. J. Chromatogr. A. 2004;1043:113–122. doi: 10.1016/j.chroma.2004.04.029. [DOI] [PubMed] [Google Scholar]
- 56.Popa T.V., Mant C.T., Hodges R.S. Ion-interaction-capillary zone electrophoresis of cationic proteomic peptide standards. J. Chromatogr. A. 2006;1111:192–199. doi: 10.1016/j.chroma.2005.07.015. [DOI] [PMC free article] [PubMed] [Google Scholar]
- 57.Kornfelt T., Vinther A., Okafo G.N., Camilleri P. Improved peptide mapping using phytic acid as ion-pairing buffer additive in capillary electrophoresis. J. Chromatogr. A. 1996;726:223–228. doi: 10.1016/0021-9673(95)01044-0. [DOI] [PubMed] [Google Scholar]
- 58.Issaq H.J., Conrads T.P., Janini G.M., Veenstra T.D. Methods for fractionation, separation and profiling of proteins and peptides. Electrophoresis. 2002;23:3048–3061. doi: 10.1002/1522-2683(200209)23:17<3048::AID-ELPS3048>3.0.CO;2-L. [DOI] [PubMed] [Google Scholar]
- 59.Simò C., Cifuentes A. Capillary electrophoresis-mass spectrometry of peptides from enzymatic protein hydrolysis: simulation and optimization. Electrophoresis. 2003;24:834–842. doi: 10.1002/elps.200390105. [DOI] [PubMed] [Google Scholar]
- 60.Moore A.W., Jorgenson J.W. Rapid comprehensive two-dimensional separations of peptides via RPLC-optically gated capillary zone electrophoresis. Anal. Chem. 1995;67:3448–3455. doi: 10.1021/ac00115a013. [DOI] [PubMed] [Google Scholar]
- 61.Moore A.W., Jorgenson J.W. Comprehensive three-dimensional separation of peptides using size-exclusion chromatography/reversed-phase liquid chromatography/optically gated capillary zone electrophoresis. Anal. Chem. 1995;67:3456–3463. doi: 10.1021/ac00115a014. [DOI] [PubMed] [Google Scholar]
- 62.Lewis K.C., Opiteck G.J., Jorgenson J.W., Sheeley D.M. Comprehensive on-line RPLC-CZE-MS of peptides. J. Am. Soc. Mass Spectrom. 1997;8:495–500. doi: 10.1016/S1044-0305(97)00009-3. [DOI] [Google Scholar]
- 63.Isaaq H.J., Chan K.C., Janini G.M., Muschik G.M. A simple two-dimensional high performance liquid chromatography/high performance capillary electrophoresis set-up for the separation of complex mixtures. Electrophoresis. 1999;20:1533–1537. doi: 10.1002/(SICI)1522-2683(19990601)20:7<1533::AID-ELPS1533>3.0.CO;2-V. [DOI] [PubMed] [Google Scholar]
- 64.Isaaq H.J., Chan K.C., Cheng S.L., Qingbo L. Multidimensional high performance liquid chromatography-capillary electrophoresis separation of a protein digest: an update. Electrophoresis. 2001;22:1133–1135. doi: 10.1002/1522-2683()22:6<1133::AID-ELPS1133>3.0.CO;2-S. [DOI] [PubMed] [Google Scholar]
- 65.Kirkland J.J., Henderson J.W., De Stefano J.J., van Straten M.A., Claessens H.A. Stability of silica-based, endcapped columns with pH 7 and pH 11 mobile phases for reversed-phase high-performance liquid chromatography. J. Chromatogr. A. 1997;762:97–112. doi: 10.1016/S0021-9673(96)00945-4. [DOI] [PubMed] [Google Scholar]
- 66.Kirkland J.J., van Straten M.A., Claessens H.A. Reversed-phase high-performance liquid chromatography of basic compounds at pH 11 with silica-based packings. J. Chromatogr. A. 1998;797:111–120. doi: 10.1016/S0021-9673(97)00865-0. [DOI] [Google Scholar]
- 67.Kirkland J.J., Glajch J.L., Farlee R.D. Synthesis and characterization of highly stable bonded phases for high-performance liquid chromatography column packings. Anal. Chem. 1989;61:2–11. doi: 10.1021/ac00176a003. [DOI] [Google Scholar]
- 68.Boyes B.E., Walker D.G. Selectivity optimization of reversed-phase high-performance liquid chromatographic peptide and protein separations by varying bonded-phase functionality. J. Chromatogr. A. 1995;691:337–347. doi: 10.1016/0021-9673(95)92841-B. [DOI] [Google Scholar]
- 69.Mant C.T., Parker J.M.R., Hodges R.S. Size-exclusion HPLC of peptides: requirement for peptide standards to monitor non-ideal behavior. J. Chromatogr. 1987;397:99–112. doi: 10.1016/S0021-9673(01)84993-1. [DOI] [PubMed] [Google Scholar]
- 70.Tripet B., Howards M.W., Jobling M., Holmes R.K., Holmes K.V., Hodges R.S. Structural characterization of the SARS-coronavirus spike S fusion protein core. J. Biol. Chem. 2004;279:20,836–20,849. doi: 10.1074/jbc.M400759200. [DOI] [PMC free article] [PubMed] [Google Scholar]
- 71.Chen Y., Mehok A.R., Mant C.T., Hodges R.S. Optimum concentration of trifluoroacetic acid (TFA) for reversed-phase chromatography of peptides revisited. J. Chromatogr. A. 2004;1043:9–18. doi: 10.1016/j.chroma.2004.03.070. [DOI] [PubMed] [Google Scholar]
- 72.Shibue M., Mant C.T., Hodges R.S. The perchlorate anion is more effective than trifluoroacetate anion as a ion-pairing reagent for reversed-phase chromatography of peptides. J. Chromatogr. A. 2005;1080:49–57. doi: 10.1016/j.chroma.2005.02.063. [DOI] [PMC free article] [PubMed] [Google Scholar]
- 73.Shibue M., Mant C.T., Hodges R.S. Effect of anionic ion-pairing reagent concentration (1 mM–60 mM) on reversed-phase chromatography elution behavior of peptides. J. Chromatogr. A. 2005;1080:58–67. doi: 10.1016/j.chroma.2005.02.047. [DOI] [PMC free article] [PubMed] [Google Scholar]
- 74.Antia F.D., Horváth C. High-performance liquid chromatography at elevated temperatures: examination of conditions for the rapid separation of large molecules. J. Chromatogr. 1988;435:1–15. doi: 10.1016/S0021-9673(01)82158-0. [DOI] [Google Scholar]
- 75.Li J.W., Carr P.W. Evaluation of temperature effects on selectivity in RPLC separations using polybutadiene-coated zirconia. Anal. Chem. 1997;69:2202–2206. doi: 10.1021/ac9608681. [DOI] [PubMed] [Google Scholar]
- 76.Chen Y., Mant C.T., Hodges R.S. Temperature selectivity effects in reversed-phase liquid chromatography due to conformation differences between helical and non-helical peptides. J. Chromatogr. A. 2003;1010:45–61. doi: 10.1016/S0021-9673(03)00877-X. [DOI] [PubMed] [Google Scholar]
- 77.Cornette J.L., Cease K.B., Margalit H., Spouge J.L., Berzofsky J.A., DeLis C.D. Hydrophobicity scales and computational techniques for detecting amphipathic structures in proteins. J. Mol. Biol. 1987;195:659–685. doi: 10.1016/0022-2836(87)90189-6. [DOI] [PubMed] [Google Scholar]
- 78.Mant C.T., Chen Y., Hodges R.S. Temperature profiling of polypeptides in reversed-phase liquid chromatography: I. Monitoring of dimerization and unfolding of amphipathic α-helical peptides. J. Chromatogr. A. 2003;1009:29–43. doi: 10.1016/S0021-9673(03)00621-6. [DOI] [PubMed] [Google Scholar]
- 79.Rothemund S., Beyerman M., Krause E., et al. Structure effects of double D-amino acid replacements: a NMR and CD study using amphipathic model helices. Biochemistry. 1995;34:12,954–12,962. doi: 10.1021/bi00040a005. [DOI] [PubMed] [Google Scholar]
- 80.Chen Y., Mant C.T., Hodges R.S. Determination of stereochemistry stability coefficients of amino acid side-chains in an amphipathic α-helix. J. Peptide Res. 2002;59:18–33. doi: 10.1046/j.1397-002x.2001.10994.x. [DOI] [PubMed] [Google Scholar]
- 81.Zhang L., Benz R., Hancock R.E.W. Influence of proline residues on the antibacterial and synergistic activities of α-helical peptides. Biochemistry. 1998;38:8102–8111. doi: 10.1021/bi9904104. [DOI] [PubMed] [Google Scholar]
- 82.Zhang L., Falla T., Wu M., et al. Determinants of recombinant production of antimicrobial cationic peptides and creation of peptide variants in bacteria. Biochem. Biophys. Res. Commun. 1999;247:674–680. doi: 10.1006/bbrc.1998.8848. [DOI] [PubMed] [Google Scholar]
- 83.Chen Y., Vasil A.I., Rehaume L., et al. Comparison of biophysical and biological properties of α-helical enantiomeric antimicrobial peptides. Chem. Biol. Drug Design. 2006;67:162–173. doi: 10.1111/j.1747-0285.2006.00349.x. [DOI] [PMC free article] [PubMed] [Google Scholar]
- 84.Mills J.B., Mant C.T., Hodges R.S. One-step purification of recombinant proteins from a whole cell extract by reversed-phase high-performance liquid chromatography. J. Chromatogr. A. 2006;1133:248–253. doi: 10.1016/j.chroma.2006.08.042. [DOI] [PMC free article] [PubMed] [Google Scholar]
- 85.Hodges R.S., Burke T.W.L., Mant C.T. Preparative purification of peptides by reversed-phase chromatography: Sample displacement mode versus gradient elution mode. J. Chromatogr. 1988;444:349–362. doi: 10.1016/S0021-9673(01)94036-1. [DOI] [PubMed] [Google Scholar]
- 86.Burke T.W.L., Mant C.T., Hodges R.S. A novel approach to reversed-phase preparative high-performance liquid chromatography of peptides. J. Liq. Chromatogr. 1988;11:1229–1247. doi: 10.1080/01483918808067169. [DOI] [Google Scholar]
- 87.Hodges R.S., Burke T.W.L., Mant C.T. Multi-column reversed-phase sample displacement chromatography of peptides. J. Chromatogr. 1991;548:267–280. doi: 10.1016/S0021-9673(01)88608-8. [DOI] [PubMed] [Google Scholar]
- 88.Mant, C. T., Burke, T. W. L., Mendonca, A. J., and Hodges, R. S. (1992) Preparative reversed-phase sample displacement chromatography of peptides. Proceedings of the 9th International Symposium on Preparative and Industrial Chromatography, pp. 274–279.
- 89.Hodges, R. S., Burke, T. W. L., Mendonca, A. J., and Mant, C. T. (1993) Preparative reversed-phase sample displacement chromatography of peptides, in Chromatography in Biotechnology (Horváth, C. and Ettre, L. S., eds.), American Chemical Soc. Symposium Series 529, pp. 59–76.
- 90.Horváth Cs., Frenz J.H., El Rossi Z. Operating parameters in high-performance displacement chromatography. J. Chromatogr. 1983;255:273–293. doi: 10.1016/S0021-9673(01)88290-X. [DOI] [PubMed] [Google Scholar]
- 91.Husband D.L., Mant C.T., Hodges R.S. Development of simultaneous purification methodology for multiple synthetic peptides by reversed-phase sample displacement chromatography. J. Chromatogr. A. 2000;893:81–94. doi: 10.1016/S0021-9673(00)00751-2. [DOI] [PubMed] [Google Scholar]
- 92.Veeraragavan K., Bernier A., Braendli E. Sample displacement mode chromatography: purification of proteins by use of a high-performance anion-exchange column. J. Chromatogr. 1991;541:207–220. doi: 10.1016/S0021-9673(01)95993-X. [DOI] [Google Scholar]
- 93.Mehok A.R., Mant C.T., Gera L., Stewart J., Hodges R.S. Preparative reversed-phase chromatography of peptides: isocratic two-step elution system for high loads on analytical columns. J. Chromatogr. A. 2002;972:87–99. doi: 10.1016/S0021-9673(02)01076-2. [DOI] [PubMed] [Google Scholar]