Abstract
Binary Co4Sb12 skutterudite (also known as CoSb3) has been extensively studied; however, its mixed-anion counterparts remain largely unexplored in terms of their phase stability and thermoelectric properties. In the search for complex anionic analogs of the binary skutterudite, we begin by investigating the Co4Sb12–Co4Sn6Te6 pseudo-binary phase diagram. We observe no quaternary skutterudite phases and as such, focus our investigations on the ternary Co4Sn6Te6 via experimental phase boundary mapping, transport measurements, and first-principles calculations. Phase boundary mapping using traditional bulk syntheses reveals that the Co4Sn6Te6 exhibits electronic properties ranging from a degenerate p-type behavior to an intrinsic behavior. Under Sn-rich conditions, Hall measurements indicate degenerate p-type carrier concentrations and high hole mobility. The acceptor defect SnTe, and donor defects TeSn and Coi are the predominant defects and rationally correspond to regions of high Sn, Te, and Co, respectively. Consideration of the defect energetics indicates that p-type extrinsic doping is plausible; however, SnTe is likely a killer defect that limits n-type dopability. We find that the hole carrier concentration in Co4Sn6Te6 can be further optimized by extrinsic p-type doping under Sn-rich growth conditions.
1. Introduction
Skutterudites are one of the highest performing classes of thermoelectric materials, with figure of merit (zT) well in excess of unity.1–5 Despite the rich compositional landscape, much of this work has been focused on variations of the binary skutterudite Co4Sb12.6 Here we refer to this skutterudite as ☐Co4Sb12 for clarity, where ☐ refers to an interstitial void. This void space within Co4Sb12 has provided a path to lower the lattice thermal conductivity through the insertion of point defects.7–13 Traditionally, n-type Co4Sb12-based skutterudites have achieved a high zT due to their conduction band degeneracy, their high intrinsic mobility, and incorporation of phonon scattering sources to lower the natively high lattice thermal conductivity, yielding zT values up to 1.4.5 In contrast, p-type Co4Sb12-based skutterudites have shown less attractive electronic properties; peak zT values of 0.2–0.6 have been achieved through reduction of lattice thermal conductivity.8,14–17 Prior computational efforts have suggested that the valence band electronic structure can be radically altered through altering the anion chemistry.18
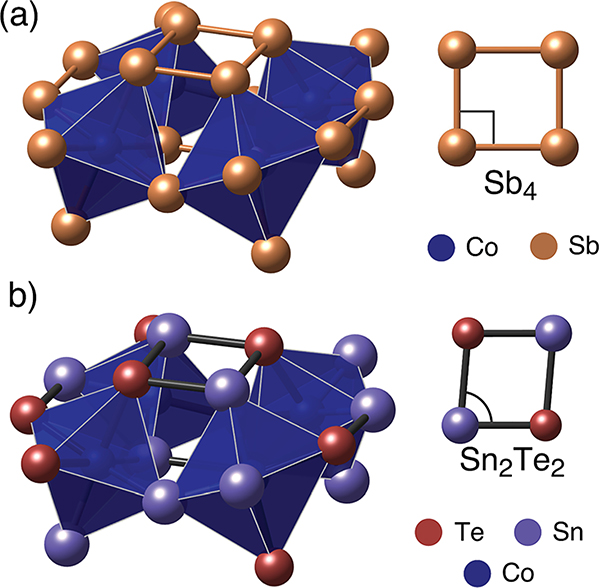
Mixed-anion skutterudites can be formed when the pnictogen (Pn) anion is replaced with equal parts of tetrel and chalcogen atoms. Generally, this unfilled skutterudite remains isoelectronic to its binary analog and takes the form of M4X6Y6 (where M = Co, Rh, Ir; X = Ge, Sn; Y = S, Se, Te).20,21 In this work, we specifically focus on the Co4Sn6Te6 ternary as it is chemically the closest to the Co4Sb12 binary skutterudite. The substitution of antimony with equal parts of group IV and VI elements causes the overall symmetry of the system to reduce from cubic to rhombohedral ( space group to ).22 This global distortion is a result of the replacement of the homo-nuclear Sb4 rectangular rings to hetero-nuclear Sn2Te2 rhomboidal rings (Fig. 1). It has also been theorized that the group IV anion has a stronger bond with the transition metal than the group VI anion, aiding in the reduction of symmetry.23–26
Fig. 1.
(a) Half-cell view of the cubic Co4Sb12 skutterudite structure. The homo-nuclear Sb4 rings are rectangular with an aspect ratio of ~0.95. (b) Half-cell view of the mixed-anion Co4Sn6Te6 skutterudite. The replacement of Sn and Te on the Sb sites causes the octahedron to distort and the symmetry of the system to decrease to rhombohedral. The anion rings shift from rectangular to rhomboidal to account for the variable anion species (Sn2Te2).19
To date, most work on mixed-anion skutterudites has been on undoped samples or motivated primarily by theory.10,20–22,27–36 For comparison, p-type Co4Sb12 has a band gap of 0.25 eV and a single Kane-like valence band at Γ with a light effective mass. This band dominates the upper 0.5 eV of the valence electronic structure; below this, a range of high effective mass bands can be found. Various calculated electronic band diagrams for Co4Sn6Te6 suggest that the splitting of the anion site increases the band gap to ~0.5 eV and increases the effective mass.18,35 The valence band structure changes significantly, as the lowlying bands move to within 200 meV of the band edge. Further alterations to the electronic structure can be made by the introduction of interstitial rattlers in the void, ☐Co4Sn6Te6 (☐ = Ca), which are expected to increase the band gap as well.37
Experimental studies on Co4Sn6Te6 reported much higher resistivity than its binary analog. Room temperature resistivity values for Co4Sn6Te6 range from 2000 to 5000 mΩ cm while those for Co4Sb12 range from roughly 33 to 100 mΩ cm.8,11,35,38 Prior Hall measurements are inconclusive as bipolar effects are potentially quite strong in such undoped materials.35 Extrinsic doping studies have not been reported to date on Co4Sn6Te6; n-type doping has been achieved in the analogous Co4Ge6Se6 via interstitial Ce and Yb.39 In addition, the ternary skutterudite intrinsically has a lower lattice thermal conductivity (3 W m−1 K−1)35 compared to its binary analog (6–8 W m−1 K−1).11
To date, the majority of the experimental Co4Sn6Te6 literature shows varying levels of impurity phases, suggesting a potentially narrow phase stability region.27,28,30,31,34–36 The presence of impurities coupled with the intrinsic transport behavior in prior samples suggests compensating defects. One strategy to understand the defects in Co4Sn6Te6 and their impact is phase boundary mapping; this is a synthetic procedure to pin a sample to a specific set of elemental chemical potentials during equilibration. In a ternary system, this implies that excess constituents are added until the desired phase exists in equilibrium with two impurity phases. By pinning the elemental chemical potentials, the intrinsic defect concentrations are thus fixed.40,41 Multiple studies of filled binary skutterudites, RxCo4Sb12 (R = In, Ga, Ce, Yb), have utilized this technique to increase the overall filling fraction, control the carrier concentration, and resolve discrepancies in the literature.3,42–44 For example, in the study of CexCo4Sb12, the three phase region Co4Sb12–CexCo4Sb12–CoSb2 turned out to be the relevant invariant point for maximizing the filling fraction. Regardless of the quantities of Co4Sb12 or CoSb2, the CexCo4Sb12 is invariant.3 Intermediate, single-phase compositions are in fact ambiguous in terms of their elemental chemical potentials and thus ambiguous in terms of their defect concentrations and synthetic repeatability. Thus, mapping the (multiple) compositional invariant points provides fundamental extrema and a deeper understanding of the single-phase region. To date, phase boundary mapping has been unexplored for Co4Sn6Te6.
In this work, we pave a path to understanding the phase stability and thermoelectric properties of the Co4Sn6Te6 skutterudite and its relationship with Co4Sb12. We begin by investigating the range of anion ring stoichiometries achievable in the Co–Sb–Sn–Te phase space. We then focus on the phase boundary mapping of the mixed-anion skutterudite by investigating the ternary phase space surrounding Co4Sn6Te6 through a combination of experiment and theory. We intentionally synthesized multi-component samples to yield a Co4Sn6Te6 matrix with compositions at phase boundary invariant points (i.e. phase boundary mapping). High temperature electronic transport measurements were performed for samples with compositions connected to the invariant points. These results were then mapped to calculations of native defects for invariant point compositions. Depending on the composition, we find that Co4Sn6Te6 can be synthesized as either an intrinsic semiconductor (e.g. Te-rich) or a degenerate p-type semimetal (e.g. Sn-rich). Our defect calculations agree with experiment, indicating that extrinsic degenerate p-type doping should be possible, owing to the absence of competing intrinsic defects. However, achieving n-type transport will require specific synthetic conditions to avoid compensating defects.
2. Methods
2.1. Experimental
All samples were produced by combining stoichiometric ratios of cobalt powder (Alfa, 99.998%), tin shot (Alfa, 99.99+%), antimony shot (Alfa, 99.999%), and tellurium lumps (Alfa, 99.999+%) in an argon glovebox. Sn/Te rich samples were formed using a SnTe precursor; the SnTe was formed via melting in an evacuated quartz ampoule at 850 °C. Mixtures were then milled in tungsten carbide SPEX vials for two hours in one hour increments under an argon atmosphere with a ball-to-mass ratio of approximately 3 : 1 and a ball diameter of 1/2 inch. The resulting powders were then annealed in evacuated fused-silica ampoules with a ramp rate of 5 °C min−1 to 625 °C, held at this temperature for 24 hours, and allowed to cool to room temperature. The annealed powders were then ground and sieved through a 106 micron mesh adhered to ASME Standard E-11. For compositions where transport measurements were performed, the annealed powders were then loaded into graphite dies and hot pressed under a uniaxial load of 80 MPa at 600 °C for roughly 6 hours under dynamic vacuum. Densities were measured via the Archimedes method with deionized water as the working fluid.
Powder X-ray diffraction (PXRD) data were obtained at room temperature using a Bruker D2 Phaser diffractometer in a θ–2θ configuration with a divergence slit of 1 mm and a tube Cu Kα radiation source. One sample was sent to the 11-BM beamline at the Advanced Photon Source of Argonne National Laboratory. Diffraction patterns were analyzed via Rietveld refinement using the TOPAS Academic software package.45 A FEI Quanta 600i environmental scanning electron microscope (ESEM) was utilized for imaging and determining the sample composition.
The Seebeck coefficient S was determined via the quasisteady slope method on a custom apparatus under high vacuum (<106 Torr) up to 300 °C. Both the Hall effect and electrical resistivity measurements were performed on a custom apparatus using the Van der Pauw method. Nichrome-wire pressure-assisted contacts were employed. The measurements were conducted under vacuum up to 300 °C.46
2.2. Computational
The formation energetics of native point defects in Co4Sn6Te6 are calculated with first-principles using density functional theory (DFT) in the standard supercell approach.47 The formation energy (ΔHD,q) of a point defect D in charge state q is calculated as follows:
| (1) |
where ED,q is the total energy of the supercell containing defect D in charge state q and EH is the energy of the host supercell. The chemical potential of element i is denoted as μi, and ni is the number of atoms of element i added (ni < 0) to or removed (ni > 0) from the supercell. EF is the Fermi energy. The supercell approach to calculate defect energetics suffers from finite size artifacts. The corrections for these are grouped into the Ecorr term and briefly discussed in the following paragraphs. A more detailed description of these corrections can be found elsewhere.47 Ecorr comprises all the finite-size corrections within the supercell approach. The following corrections are included in Ecorr: (1) image charge correction for charge defects, (2) potential alignment correction for charged defects, (3) band filling correction for shallow defects. The calculation setup and analyses are performed using a software package for automation of point defect calculations.48
To calculate the total energies of the supercells, the generalized gradient approximation (GGA) of Perdew–Burke–Ernzerhof (PBE)49 is utilized in the projector augmented wave (PAW) formalism as implemented in VASP software.50 An on-site correction of 3 eV in the form of Hubbard U in a rotationally invariant form51 is applied to the d orbitals of Co. The positions of the ions in the defect supercells are relaxed following the procedure used in ref. 52. The total energies of the relaxed defect supercells containing 96 atoms are calculated with a plane-wave energy cutoff of 340 eV and a Γ-centered Monkhorst pack k-point grid to sample the Brillouin zone.
The elemental chemical potential μi is expressed relative to the reference elemental phase as μi = μi0 + Δμi, where μi0 is the chemical potential of the reference phase (under standard conditions) and Δμi is the deviation from μi = μi0. Δμi = 0 corresponds to i-rich growth conditions. The reference elemental chemical potentials are fitted to a set of measured heats of formation at 300 K, using a procedure similar to that described in ref. 52. Using the fitted reference elemental chemical potentials is more accurate than simply using the 0 K DFT-calculated total energies as demonstrated in ref. 41 and 52. For a given compound, the bounds of Δμi is set by the region of phase stability.
Defect energetics of vacancies (VCo, VSn, VTe), antisites (SnTe, TeSn), and interstitials (Coi, Tei) in charge states q = −3, −2, −1, 0, 1, 2, and 3 are calculated. Vacancies and antisites derived from all unique Wyckoff positions in the crystal structure are considered in the calculations. The most likely sites for interstitials are identified by Voronoi tessellation as implemented in the software package.48 The position of the equilibrium Fermi energy at a given temperature is calculated self-consistently by establishing the charge neutrality conditions. Calculated valence band and conduction band density-of-states (DOS) effective masses of 0.170 eV and 4.514 eV, respectively, were used for calculations of hole and electron concentrations.
3. Experimental results
To investigate the opportunities available for mixed anion skutterudites, we begin by considering the Co–Sb–(SnTe)0.5 pseudo-ternary by synthesis of samples along the Co4Sb12–Co4Sn6Te6 pseudobinary line. From there, we specifically consider the ternary skutterudite, Co4Sn6Te6, through experimental phase boundary mapping, transport measurements, and calculation of the defect energetics. First principles defect calculations provide intrinsic defect levels and highlight growth conditions needed for successful extrinsic doping.
3.1. Co4Sb12–Co4Sn6Te6 pseudo-binary
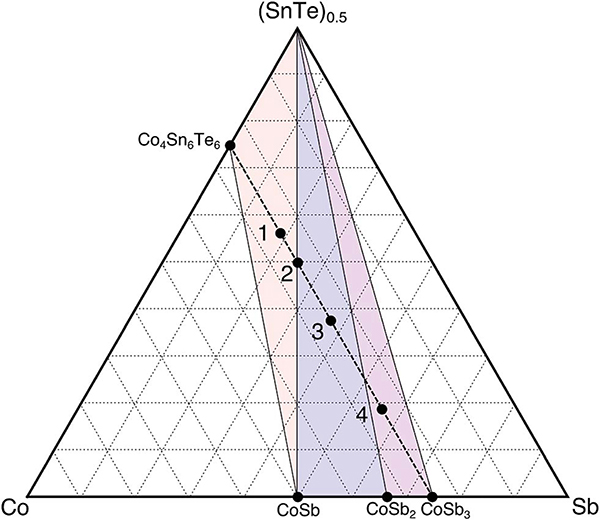
Samples with compositions Co4Sb12xSn6(1−x)Te6(1−x) (where x = 1/4, 1/3, 1/2, 3/4) were made to investigate if Sn, Sb, and Te could simultaneously be incorporated into the skutterudite anion rings. These compositions can be seen on the Co–Sb–(SnTe)0.5 pseudo-ternary in Fig. 2. Synthesis conditions were initially optimized for Co4Sn6Te6, with nominally phase pure samples characterized by lab PXRD and SEM (ES2†). Refinement of the X-ray diffraction patterns of samples across the pseudo-binary line (ES3†) does not suggest the presence of a new phase. For example, sample one separates into three phases (CoSb, SnTe, and Co4Sn6Te6) which is consistent with the suggested Alkemade lines defined in Fig. 2. These X-ray results allow us to map out the Alkemade lines relevant for this ternary space of interest, yielding the phase diagram presented in Fig. 2. From these experimental results, we conclude that the mixing of Sn, Sb, and Te on the ring sites is energetically unfavorable when compared to segregation into a mixture of binary and ternary end members. This suggested isothermal phase diagram is largely consistent with DFT phase stability calculations performed in this work (ESI ES4†). For both theory and experiment, SnTe is found to be an end-member of all available Alkemade triangles in the pseudo-ternary. This suggests that SnTe is a deep thermodynamic well. However, theory does not pick up the stability of CoSb2, as it is slightly above (0.039 meV per atom) the convex hull between CoSb and CoSb3.
Fig. 2.
Co–Sb–(SnTe)0.5 experimental ternary phase diagram: samples 1–4 are experimentally synthesized and lie along the Co4Sb12–Co4–Sn6Te6 pseudo-binary highlighted by the black dashed line. The nominal compositions of samples 1, 3 and 4 were chosen based on their potential anion ring ratios. The XRD results in Fig. ES1† allow us to define our Alkemade lines shown here by the encompassed colored triangles. We see no presence of a quaternary skutterudite in this phase space.
Thus, despite the known solubility of Sn and Te in the CoSb3 anionic sublattice, these results show that the simultaneous mixing of all three anions does not result in a skutterudite-like phase. This could be due to the bonding angles and therefore distortion of the ring network by the introduction of variable anions. In the Sn–Te rings, the acute Te–Sn–Te bond angles are compensated by obtuse bond angles in Sn–Te–Sn, yielding a near-rhombus geometry. In contrast, forming a SnSb2Te ring may induce significant bond strain as the bond angles are not complementary. Due to the lack of a quaternary skutterudite, we focus the remainder of this work on understanding the ternary phase space of the Co4Sn6Te6 skutterudite.
3.2. Co4Sn6Te6 ternary phase space
With this understanding of the Sn–Sb–Te ring chemistry and the strong driving force for segregation into Co4Sn6Te6, we focus our attention on the ternary Co–Sn–Te phase space. These efforts allow the identification of invariant points for phase boundary mapping.
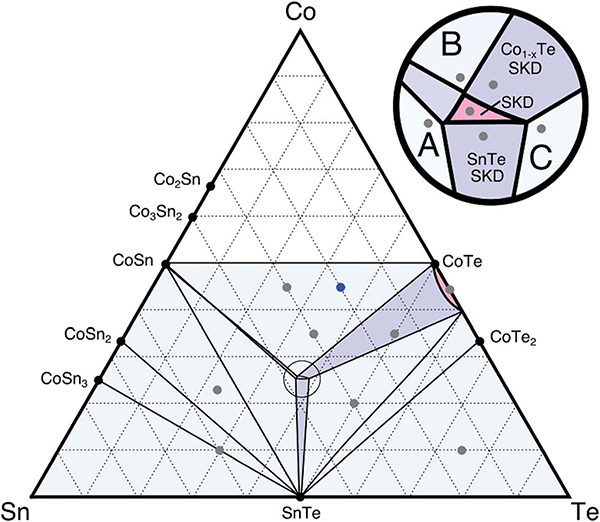
We begin by experimentally investigating the Co–Sn–Te phase space via traditional bulk synthesis. Using the methods described above, we synthesized various samples in the Co–Sn–Te ternary to map out the Alkemade lines of the system. This gives us a clearer understanding of the neighboring phases surrounding the Co4Sn6Te6 single-phase region. As seen in Fig. 3, the samples produced (as indicated by the grey and blue points on the ternary) define the competing phases via X-ray diffraction analysis. For example, Co9Sn4Te7 (blue point) diffraction spectra can be deconvoluted into the combined patterns of CoSn, Co1−xTe, and Co4Sn6Te6 from the Inorganic Crystallographic Structure Database (ICSD). Let Fig. 3 serve as a guide to the Co–Sn–Te phase space; however note that the widths of each region are not explored in this work. Although prior literature investigating the phases neighboring the mixed-anion skutterudite has been scarce, the prior work performed shows evidence of secondary phases of SnTe and possibly Co1−xTe.
Fig. 3.
A proposed Co–Sn–Te ternary phase diagram at 600 °C was generated experimentally using diffraction data (gray and blue points). The blue point was analyzed via synchrotron XRD (ES5†). One-, two-, and three-phase regions are pink, purple, and blue, respectively. Inset shows phases surrounding the ternary Co–Sn–Te skutterudite, which are the focus of our phase boundary mapping study. We omit Co-rich samples due to lack of phase equilibria with skutterudite.
Blue and purple regions in the diagram indicate three-phase and two-phase regions, respectively. Pink regions in the phase diagram indicate single-phase regions with some solubility observed. We find that CoTe is an off-stoichiometric compound, Co1−xTe, with a region of solubility along the Co–Te binary. Intentionally synthesizing a sample in the two-phase region connecting Co1−xTe and Co4Sn6Te6 only indicates the presence of these two phases. We note that again SnTe appears to be a dominating phase in this phase space as evidenced by the number of Alkemade lines connecting it to the neighboring phases. Of the eight possible Alkemade lines that could connect to SnTe, six compounds form pseudo-binaries with SnTe (minimum required is one). As a result, we can expect that the skutterudite may have a narrow stability region due to its competing neighboring phases.
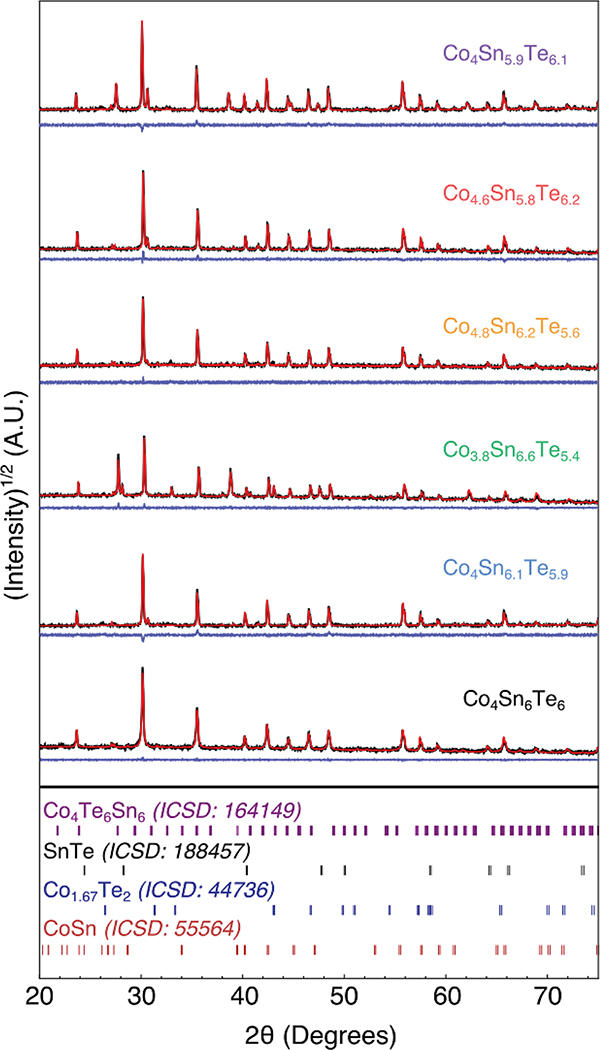
With a coarse understanding of the phase boundaries, we turn to a second set of samples that are presented in Fig. 4. These samples are closer to the skutterudite composition and exist within two- and three-phase regions neighboring the skutterudite phase. We produced samples in the three-phase regions (A, B, and C in the inset of Fig. 3) to determine the compositional invariant points of the single-phase region for Co4Sn6Te6. In addition, we made two samples in the two-phase regions. Efforts to make the sample in the two-phase region connecting Co4Sn6Te6 and CoSn yielded trace SnTe or Co1−xTe, suggesting that it has a narrow stability region. The X-ray diffraction data in Fig. 4 for these samples are consistent with the ternary in Fig. 3, thus verifying our suggested Alkemade lines. This set of samples allows us to begin investigating Co4Sn6Te6 through phase boundary mapping by determining the transport behavior of the invariant points.
Fig. 4.
TOPAS refined X-ray diffraction data for samples seen in the Fig. 3 inset. Nominal compositions have been colored to correspond to their transport data below. ICSD reference patterns are provided as stick plots. Experimental data, TOPAS fit and the difference profiles are shown (black, red, and blue respectively). Refinement values can be found in the ESI (ES6†). Intensity has been plotted on a square root scale to intensify the secondary peaks.
3.3. Transport
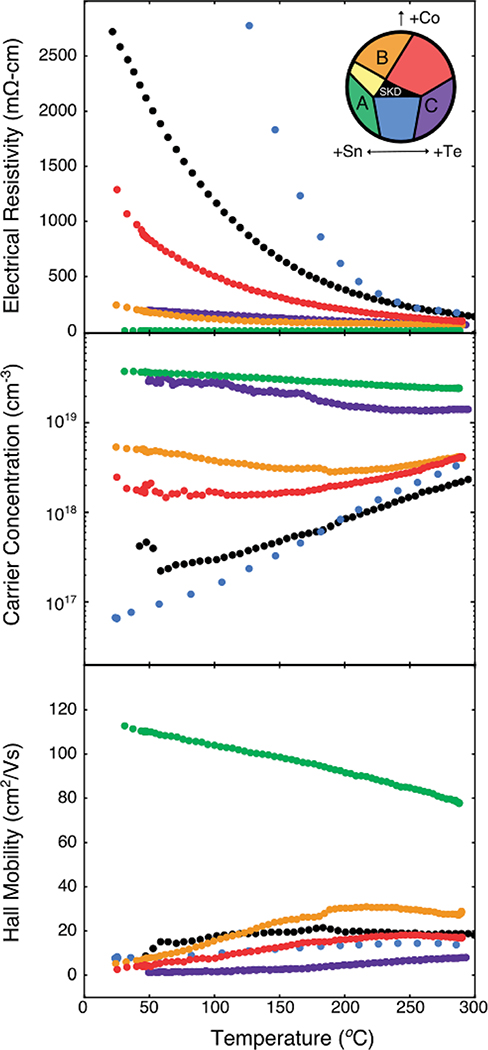
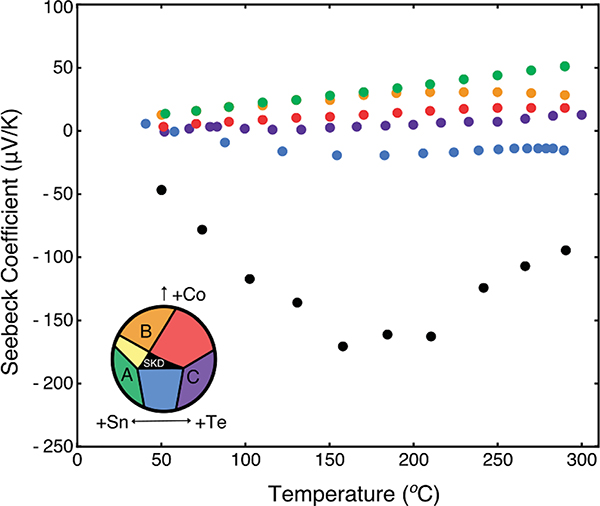
Electronic measurements were performed for this second set of samples neighboring the single-phase skutterudite region, and the results are shown in Fig. 5. Only the sample in region A shows a degenerate electronic behavior (1.5 mΩ cm at 300 K), with all other samples exhibiting room temperature resistivity values in excess of 100 mΩ cm. We observe promising mobility for this sample as well, with a room-temperature value of roughly 110 cm2 V−1 s−1 and a carrier concentration of 3 × 1019 cm−3. High temperature measurements of the resistivity and Hall coefficient reveal a gradual linear decay in mobility with increasing temperature, and the carrier concentration remains essentially constant. As such, it appears that the sample in region A, of composition Co3.8Sn6.6Te5.4, is a degenerate semiconductor with high electronic mobility likely limited by phonon scattering. Fig. 6 reveals that the Seebeck coefficient rises monotonically with increasing temperature. This, coupled with the temperature-independent carrier concentration, supports the claim that the sample is a degenerate semiconductor. Assuming a parabolic band model and single carrier type, we calculate the density of states effective mass of the valence band edge from this sample’s Seebeck data to be 0.10 me at 300 °C. However, the calculated effective mass increased with temperature, consistent with the Seebeck coefficient not linearly extrapolating to 0 uV K−1 at 0 K. These values are consistent with the calculated effective mass of 0.17 me from DFT. The observed mobility is also exceptionally consistent with prior studies of Co4Sb12 at similar carrier concentrations (with Br and Sn as a dopant). The effective masses are also similar; this suggests that the relaxation times in these two compounds are comparable.53
Fig. 5.
Resistivity, carrier concentration, and mobility data versus temperature. Transport data are color-coded with the regions observed in the inset in the resistivity plot. Note that this is the same compositional space as that observed in the inset of Fig. 3.
Fig. 6.
Seebeck data for samples around the single phase skutterudite region. We observe degenerate transport in the Sn-rich sample (shown in green). All other samples show an intrinsic transport behavior. The inset serves as a guide to which compositional region the sample exists.
All other compositions yield large resistivity values, indicating that these compositions may be intrinsic. Due to the intrinsic transport, a detailed analysis of the bipolar Hall and Seebeck coefficients would require further knowledge of the band structure and scattering rates for both charge carrier types. As such, further analysis is precluded. For example, the single band model for Hall mobility significantly underestimates the actual carrier mobility when minority carriers are present in a significant concentration. Bipolar effects are particularly pernicious to this material because of the massive difference in effective masses of the conduction and valence band edges, 4.5 me and 0.17 me, respectively. These intrinsic findings are consistent with the limited electronic measurements reported for this system. Zevalkink et. al. observed a high resistivity and mixed conduction behavior with the mixed-anion skutterudite (with trace SnTe).35
From these transport data, we see that preparing Co4Sn6Te6 in equilibrium with trace secondary phases via phase boundary mapping yields variable electronic properties without extrinsic doping. These data suggest the potential for p-type doping the mixed-anion skutterudite if grown under Sn-rich conditions, similar to the sample produced in region A. Te-rich conditions lead to intrinsic properties, as seen above from all non-A samples and those samples reported in the literature. From these experimental results, it is not yet clear if Te-rich conditions favor dopability.
4. Computational results
Native point defects play a critical role in determining properties of semiconductors including their dopability i.e. the achievable free carrier concentrations of a specific type (electrons or holes). The dopability of a semiconductor is largely determined by the formation energetics of native defects, which among other factors also depend on growth conditions. To further understand the experimentally observed variations in electronic properties and their dependence on the native defect chemistry and opportunities for extrinsic doping, we utilize first-principles defect calculations. In eqn (1) (see Computational methods), the dependence of defect formation energy (ΔHD,q) on growth conditions is determined through the chemical potentials (μi) of the elements. The phase stability region of Co4Sn6Te6 is defined by the bounds of μCo, μSn, and μTe. We begin by establishing the phase stability region of Co4Sn6Te6 in the Co–Sn–Te ternary chemical potential space. The variations in the defect energetics across this phase stability region are then examined. Subsequently, we identify opportunities for extrinsic doping under specific chemical potential conditions.
4.1. Phase stability in the chemical potential space
To understand the variations in the defect formation energetics with growth conditions, we need to establish the phase stability of Co4Sn6Te6 in the ternary Co–Sn–Te chemical potential space. Conventionally, the elemental chemical potential (μi) is expressed as a deviation from the reference elemental chemical potential. Mathematically, μi = μi0 + Δμi, where μi0 is the reference chemical potential and Δμi is the deviation from the reference potential. By definition, μi = μi0, when the growth conditions correspond to equilibrium with the corresponding elemental phase under standard conditions such that Δμi = 0. Therefore, Δμi = 0 corresponds to the most i-rich growth conditions; the more negative the value of Δμi, the more i-poor the growth conditions are. The bounds of Δμi define the region of phase stability; the upper and lower bounds of Δμi are set by the region of phase stability.
In the absence of any competing phases, the compositional phase diagram is simply defined by its elemental end members. This can be mapped to the chemical potential space shown in Fig. 7(a) as orthogonal planes. The planes are independent, as each phase only depends on a single element. Single-phase regions span the facets shown in Fig. 7(a). In this representation, no competing phases exist and thus the compositional phase diagram has a single three-phase region and three two-phase regions. The origin, where these three planes intersect, corresponds to the three-phase region in the compositional space. Similarly, the lines formed by pairwise plane intersections correlate to the two-phase regions in the compositional space.
Fig. 7.
Chemical potential map of Co–Sn–Te: (a) elemental chemical potential planes. Each plane corresponds to a pure elemental phase: Co (orange), Sn (purple), and Te (blue). The axes define the deviation from these reference planes. (b) Binary and ternary competing phases represent planes that intersect with the reference planes in (a). The skutterudite Co4Sn6Te6 exists as a small facet (labeled SKD) indicating limited compositional stability, consistent with experimental findings. (c) Zoomed view of the Co4Sn6Te6 stability region. The invariant three-phase points are labeled A, B, and C. At A, SKD is in equilibrium with SnTe and CoSn, at B, with CoSn and CoTe, and at C, with CoTe and SnTe. Coordinates for all three points can be found in the ESI (ES7†).
When we consider the competing phases in the Co–Sn–Te chemical space, Fig. 7(a) evolves significantly. Stable compounds exist as diagonal planes cutting through the elemental planes. These planes arise due to the relationship between Gibbs free energy (ΔG) and the available elemental chemical potentials (μi). Here, we utilize calculations of ΔHf as a low temperature proxy for ΔG as these results are obtained from first-principles ground-state DFT calculations. Since all chemical potential values are negative in the region shown, the ΔHf of compounds in this region must also be negative. With the addition of each compound, the corresponding plane serves to form a new facet in Fig. 7(b). These facets represent regions of single phase stability. For example, Co4Sn6Te6’s plane is given by 4ΔμCo + 6ΔμSn + 6ΔμTe = −4.06 × 16 (where ΔHf and Δμi values are determined via first-principles DFT calculations). Once again, two- and three-plane intersections (lines and points, respectively) translate to two- and three-phase regions in the compositional space. For example, point A in Fig. 7(c) corresponds to the three-phase region (CoSn, SnTe, and Co4Sn6Te6) in the compositional space, marked by A, in the Fig. 3 inset. We note that chemical potential space is often viewed as a projection along one axis; however, Fig. 7(b) presents an alternative view to highlight these planes.
Fig. 7(c) presents a zoomed version of the phase stability region of Co4Sn6Te6 in Fig. 7(b). The three-phase points within the stability region of Co4Sn6Te6 are marked A, B, and C. The invariant points A, B, and C in Fig. 7(c) can be mapped to the points marked A, B, and C in the compositional space in the Fig. 3 inset. Due to possible inaccuracies in calculating the phase stability of Co4Sn6Te6, we used the phase stability established by experiments (Fig. 3) to slightly adjust the total energies (~30 meV per atom) obtained from DFT calculations. The computed phase stability diagram with the adjusted phase stability overlay can be found in the ESI (ES7†). Despite these adjustments, the conclusions about the predominant defects and therefore, the dopability remain qualitatively unchanged.
Changes in elemental chemical potentials directly alter the defect formation energies (eqn (1)), and therefore, the defect and carrier concentrations. Thus, the electronic properties can be expected to vary across the phase stability region of Co4Sn6Te6. Experimentally, the synthesis of Co4Sn6Te6 in the single-phase region can lead to samples that are not unique under their chemical potential conditions (Fig. 7(c)). However, the three-phase points (A, B, C) correspond to unique growth conditions, thus, ensuring synthetic reproducibility. Probing these three-phase points using targeted synthesis is the core principle of phase boundary mapping. In the following sections, we examine how the defect energetics and dopability vary at the invariant three-phase points (A, B, and C).
4.2. Defect diagrams
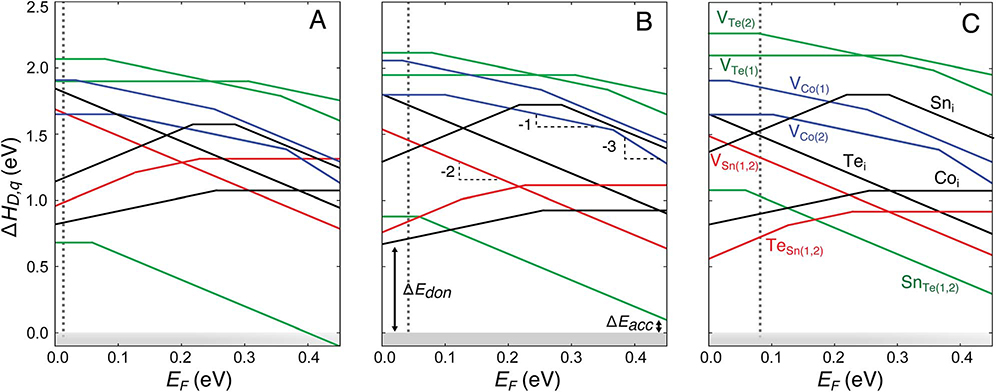
Defect energetics calculated from first-principles are typically presented in the form of defect diagrams i.e. defect formation energies (ΔHD,q) as a function of Fermi energy (EF), as shown in Fig. 8. For a given material, one calculates the defect formation energy (ΔH) of all defects of interest in all plausible charge states. The x-axis of the plot is the Fermi energy (EF), which spans from the valence band maximum (VBM, conventionally set to 0) to the conduction band minimum (CBM). Since the only EF-dependence in eqn (1) is linear, one can read the charge state off the plot according to the slope of each line. Defects with positive slopes act as donors while those with negative slopes are acceptors. For clarity, at any given EF, only the charge state of the defect that has the lowest formation energy is shown; consequently, the defect plots in Fig. 8 are the traces of the lowest-energy charge states. Charge transition levels (CTLs) are the points at which the energetically favorable charge state changes. For instance, the 0/1− CTL of SnTe is ~60 meV from the valence band maximum. A defect is a shallow donor or acceptor if either there are no CTLs inside the band gap or the CTL is within a few kBT of the relevant band edge. Therefore, at room temperature and above, SnTe behaves as a shallow acceptor.
Fig. 8.
Defect formation energy (ΔHD,q) as a function of the Fermi energy (EF) for Co4Sn6Te6 under growth conditions corresponding to the chemical potentials at points A, B, and C shown in Fig. 7(c) (A, B, and C, respectively). EF is referenced to the valence band maximum and ranges from 0 eV to the calculated band gap (0.45 eV). The dominant defects include antisites TeSn and SnTe and Co interstitials. The subscripts (1) and (2) refer to different Wyckoff positions. The dopability window for donors (ΔEdon) and acceptors (ΔEacc) is marked for growth conditions corresponding to the point B. Vertical dotted lines represent the equilibrium Fermi energy established by charge neutrality at T = 873 K.
The position of the equilibrium EF, the corresponding defect concentrations, and the free carrier concentrations at a given temperature are calculated self-consistently by establishing the charge neutrality conditions. For a given defect, all charge states are considered while establishing the charge neutrality conditions. The concentration of a defect D at a given temperature and EF is determined from Boltzmann statistics:
| (2) |
where [D] is the defect concentration, Ns is the concentration of possible lattice sites where the defect D can be formed, kB is the Boltzmann constant, and T is the temperature. Carrier concentrations are determined by using parabolic band approximations for both band edges. Effective masses used in the calculation of carrier concentrations are obtained from the DFT electronic structure obtained on a dense k-point grid. Calculated conduction and valence band effective masses for Co4Sn6Te6 are 4.514 me and 0.17 me, respectively, where me is the mass of an electron. In the following section, we examine the defect energetics at the invariant three-phase points (A, B, and C) and establish the equilibrium EF in each of these cases.
4.3. Defect energetics and equilibrium Fermi energy
The calculated formation energetics of native defects in Co4Sn6Te6 at the three invariant points (A, B, and C in Fig. 7) are presented in Fig. 8. At point A, corresponding to growth under relatively Sn-rich conditions, the predominant defect is the antisite SnTe, which is an acceptor defect. The equilibrium EF calculated from charge neutrality is 13 meV from the VBM (Fig. 9); consequently, Co4Sn6Te6 is p-type doped with a free hole concentration of ~2 × 1018 cm−3 at 873 K (sample pressing temperature). The predicted high hole concentration is consistent with the experimental observation of degenerate transport in samples grown under Sn-rich conditions. However, at a pressing temperature of 673 K, the predicted free hole concentration drops to 7 × 1017 cm−3. The highest hole concentration from self-doping is obtained under Sn-rich conditions i.e. near point A. Therefore, if one is strictly limited to self-doping, Sn-rich conditions are required to yield sufficiently high hole concentrations. While beneficial for p-type doping, the acceptor SnTe limits extrinsic n-type doping (see Section 4.4).
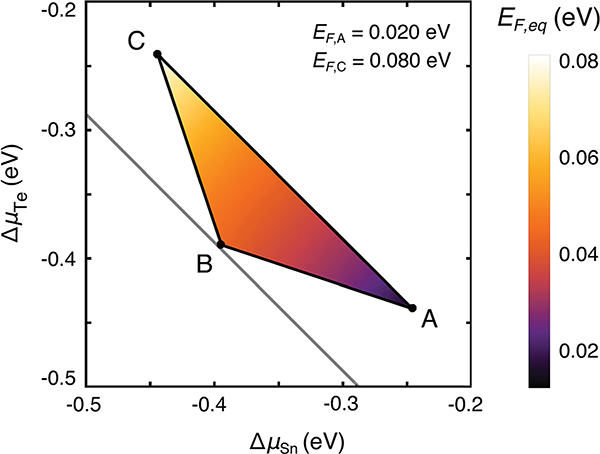
Fig. 9.
Equilibrium Fermi energy (EF,eq) in the phase stability region of Co4Sn6Te6, which is shown as a projection along the ΔμCo axis (projection direction indicated by an arrow in Fig. 7(b)). EF,eq is referenced to the valence band maximum. Points A, B, and C are the three-phase points shown in Fig. 7(c). The equilibrium EF lies below the midgap; Co4Sn6Te6 ranges between natively p-type and n-type doped in the singe-phase region and the three-phase points.
Using charge neutrality, the equilibrium EF can be determined at any point in the phase stability region of Co4Sn6Te6. Fig. 9 shows the equilibrium EF as a heat map within the phase stability region projected along the Co chemical potential axis (projection direction indicated by an arrow in Fig. 7). At point B, which corresponds to growth under Co-rich conditions, antisites SnTe (acceptor) and TeSn (donor) and Co interstitials are the relevant low formation energy defects. The formation of Co interstitials is energetically favorable because of the Co-rich conditions at point B. In Co4Sn6Te6, Co interstitials act as a donor, which is the expected behavior of cation interstitials. In contrast, the Co interstitial in CoSb3 was found to be an acceptor defect54 due to the unique distortions of the Sb4 rings that are absent in Co4Sn6Te6. We also considered Sn and Te interstitials but their formation is found to be energetically unfavorable.
From the different growth conditions compared to point A (Snrich), the equilibrium EF is ~50 meV from the VBM and Co4Sn6Te6 is self-doped n-type with an electron concentration of 9 × 1017 cm−3 at 873 K where the differences arise from the variable effective masses. Similarly, at point C, SnTe, TeSn, and Coi are the relevant low formation energy defects. Given the relatively Te-rich conditions at C, the antisite TeSn has lower formation energy compared to points A and B. The equilibrium EF at 873 K is roughly 80 meV from the VBM (Fig. 9), again resulting in a self-doped n-type material with an electron concentration of 6 × 1018 cm−3. The range of calculated carrier concentrations across the single-phase region is consistent with our experimental findings for samples exhibiting bipolar conduction. Therefore, within the phase stability region of Co4Sn6Te6, the equilibrium EF ranges from 13 meV (at A) to 80 meV (at C) from the VBM. The corresponding carrier concentrations range from 9 × 10¹⁷ e− cm−3 to 2 × 10¹⁸ h+ cm−3 at 873 K.
4.4. Assessing dopability
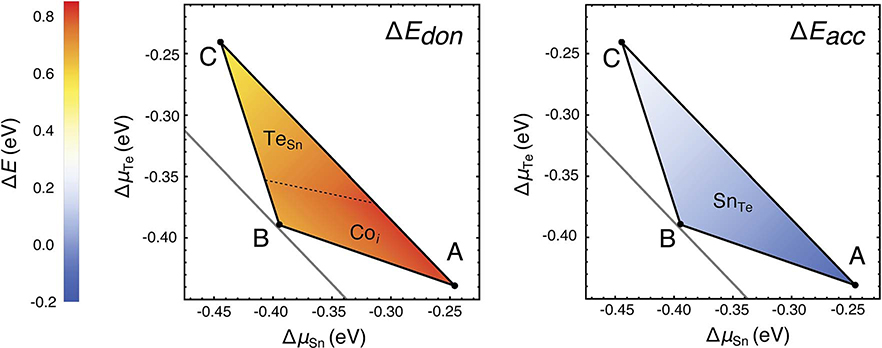
Based on the formation energetics of the native defects, we now assess the potential for extrinsic p- and n-type doping of Co4Sn6Te6 under various growth conditions i.e. different elemental chemical potentials in the phase stability region. When an extrinsic dopant is introduced, there will be charge compensation if an oppositely charged native defect intersects with the dopant defect. For instance, the dopability window for extrinsic p-type doping is set by the energetic room provided by the lowest energy donor at the VBM. See for example, ΔEdon labelled in Fig. 8(b) where the lowest energy donor is a Co interstitial and the trace of the Co interstitial defect at the VBM is 0.67 eV. Therefore, an appropriate extrinsic acceptor dopant whose trace at the VBM is below 0.67 eV will not suffer from hole compensation due to the Co interstitials and will likely be an effective p-type dopant. Similarly, the intercept of the lowest energy native acceptor defect at the CBM sets the dopability window (ΔEacc) for n-type doping.
As the defect energetics vary significantly within the stability region, we calculate ΔEdon and ΔEacc at all chemical potentials across the single-phase region (Fig. 10). The larger the value of ΔEdon, the higher the potential for introducing an effective p-type dopant. Similarly, the larger the value of ΔEacc, the higher the potential for extrinsic n-type doping. Note that the lowest energy donor that sets ΔEdon changes from Co interstitial to TeSn as we move from Sn-rich and Co-rich to Te-rich conditions. The dopability window ΔEdon is fairly large across the entire single-phase region, with the largest window of ~0.8 eV being present under Sn-rich growth conditions (point A). Extrinsic p-type doping is most promising under Sn-rich growth conditions. In contrast, the lowest energy acceptor is SnTe across the entire single-phase region. The low energy of SnTe limits ΔEacc to small positive or negative values. Consequently, efficient extrinsic n-type doping is predicted to be challenging for Co4Sn6Te6.
Fig. 10.
Donor (ΔEdon) and acceptor (ΔEacc) dopability windows in the phase stability region calculated from the defect diagrams. The dopability windows at A, B, and C can be directly inferred from the defects diagrams in Fig. 8. The predominant defects that set the dopability windows are labelled in the relevant regions of the phase stability; ΔEdon is set by TeSn and Coi while ΔEacc is determined solely by SnTe. A large dopability window indicates a higher potential for extrinsic doping. Given the large ΔEdon near A, the potential for extrinsic p-type doping is higher under Sn-rich growth conditions. The small or negative ΔEacc means that extrinsic n-type doping of Co4Sn6Te6 is challenging under any growth conditions.
5. Conclusions
Achieving superior thermoelectric performance for p-type skutterudites has long been challenging. In this foundational study, we consider the properties of mixed-anion skutterudites with a focus on phase stability and associated electronic defects. As evidenced by the alloying study between Co4Sb12 and Co4Sn6Te6, we established that there is a strong driving force for partitioning into the respective skutterudite end-member phases. We conclude that this is in part due to the anion framework not accommodating significant quantities of variable anions. The thermodynamic driving force to form SnTe may be too much to overcome when trying to establish a new phase in this quaternary system. Inspired by prior reports of the Co4Sn6Te6 electronic structure and inconclusive transport data, we established the ternary phase diagram, measured thermoelectric properties at the phase boundary invariant points, and conducted a study of the intrinsic defects. Phase boundary mapping established the presence of three invariant points that bound the single phase Co4Sn6Te6 region. Two of these invariant points reveal a highly compensated, intrinsic electronic behavior, while the Sn-rich third invariant point exhibits a degenerate p-type behavior (~2 × 10¹⁹ h+ cm−3). In the latter case, high room temperature mobility (>110 cm2 V−1 s−1) was observed, which decayed to 80 cm2 V−1 s−1 at 300 °C. To understand these results and the potential of extrinsic dopants, we turned to defect calculations. Our calculations revealed that SnTe, Coi, and TeSn are the most common defects, with SnTe driving the degenerate behavior under Sn-rich conditions. The defect calculations further revealed that extrinsic p-type doping is unlikely to be limited by donor counter-defects whereas n-type doping may be quite difficult to achieve. As such, future work on controlling the electronic properties of Co4Sn6Te6 through the introduction of a p-type dopant is promising.
Supplementary Material
Acknowledgements
This work was performed at the California Institute of Technology/Jet Propulsion Laboratory under contract with the National Aeronautics and Space Administration. This work was supported by the NASA Science Mission Directorate’s Radioisotope Power Systems Thermoelectric Technology Development Project under Grant/Contract/Agreement No. NNX16AT18H. We also acknowledge support from the National Science Foundation (NSF) (DMR grants 1729594 and 1555340). The research was performed using computational resources sponsored by the Department of Energy’s Office of Energy Efficiency and Renewable Energy located at the NREL. Use of the Advanced Photon Source at Argonne National Laboratory was supported by the U. S. Department of Energy, Office of Science, Office of Basic Energy Sciences, under Contract No. DE-AC02-06CH11357.
Footnotes
Conflicts of interest
There are no conflicts to declare.
Electronic supplementary information (ESI) available. See DOI: 10.1039/c8ta07539e
References
- 1.Snyder GJ and Toberer ES, Nat. Mater, 2008, 7, 105–114. [DOI] [PubMed] [Google Scholar]
- 2.Lamberton GA, Bhattacharya S, Littleton RT, Kaeser MA, Tedstrom RH, Tritt TM, Yang J, Nolas GS and Littleton IV RT, Appl. Phys. Lett, 2002, 80, 598–600. [Google Scholar]
- 3.Tang Y, Hanus R, Chen SW and Snyder GJ, Nat. Commun, 2015, 6, 1–7. [DOI] [PMC free article] [PubMed] [Google Scholar]
- 4.Nolas GS, Kaeser M, Littleton IV RT and Tritt TM, Appl. Phys. Lett, 2000, 77, 1855–1857. [Google Scholar]
- 5.Zhang L, Grytsiv A, Rogl P, Bauer E and Zehetbauer M, J. Phys. D: Appl. Phys, 2009, 42, 225405. [Google Scholar]
- 6.Snyder JG, Tang Y, Crawford CM and Toberer ES, Materials Aspect of Thermoelectricity, CRC Press, 1st edn, 2016, ch. 19. [Google Scholar]
- 7.Nolas GS, Fowler G and Yang J, J. Appl. Phys, 2006, 100, 043705. [Google Scholar]
- 8.Caillat T, Borshchevsky A, Fleurial J-P and Borshchevsky A, Appl. Phys. Lett, 1996, 80, 1013–1855. [Google Scholar]
- 9.Sales BC, Mandrus D and Williams RK, Science, 1996, 272, 1325–1328. [DOI] [PubMed] [Google Scholar]
- 10.Nolas GS, Morelli DT and Tritt TM, Annu. Rev. Mater. Sci, 1999, 29, 89–116. [Google Scholar]
- 11.Uher C, Semiconductors and Semimetals, Elsevier Ltd, 69th edn, 2001, ch. 5, pp. 139–253. [Google Scholar]
- 12.Sales BC, Mandrus D, Chakoumakos BC, Keppens V and Thompson JR, Phys. Rev. B: Condens. Matter Mater. Phys, 1997, 56, 15081–15089. [Google Scholar]
- 13.Toberer ES, Zevalkink A and Snyder GJ, J. Mater. Chem, 2011, 21, 15843. [Google Scholar]
- 14.Puyet M, Lenoir B, Dauscher A, Dehmas M, Stiewe C and Müller E, J. Appl. Phys, 2004, 95, 4852. [Google Scholar]
- 15.Park K-H, Kim I-H, Choi S-M, Seo W-S, Cheong D-I and Kang H, J. Electron. Mater, 2013, 42, 1377–1381. [Google Scholar]
- 16.Sharp JW, Jones EC, Williams RK, Martin PM and Sales BC, J. Appl. Phys, 1995, 78, 1013–4442. [Google Scholar]
- 17.Mallik RC, Anbalagan R, Raut KK, Bali A, Royanian E, Bauer E, Rogl G and Rogl P, J. Phys.: Condens. Matter, 2013, 25, 105701–105710. [DOI] [PubMed] [Google Scholar]
- 18.Volja D, Kozinsky B, Li A, Wee D, Marzari N and Fornari M, Phys. Rev. B: Condens. Matter Mater. Phys, 2012, 85, 245211. [Google Scholar]
- 19.Momma K and Izumi F, J. Appl. Crystallogr, 2008, 41, 653–658. [Google Scholar]
- 20.Korenstein R, Soled S, Wold A and Collin G, Inorg. Chem, 1977, 16, 2344–2346. [Google Scholar]
- 21.Nagamoto Y, Tanaka K and Koyanagi T, XVI ICT ‘97. Proceedings ICT’97. 16th International Conference on Thermoelectrics (Cat. No.97TH8291), 1997, pp. 330–333. [Google Scholar]
- 22.Laufek F, Návrátil J and Goliáš V, Powder Diffr, 2008, 23, 15–19. [Google Scholar]
- 23.Partik M and Lutz HD, Phys. Chem. Miner, 1999, 27, 41–46. [Google Scholar]
- 24.Vaqueiro P, Sobany GG, Powell AV and Knight KS, J. Solid State Chem, 2006, 179, 2047–2053. [Google Scholar]
- 25.Bertini L and Cenedese S, Phys. Status Solidi RRL, 2007, 1, 244–246. [Google Scholar]
- 26.Kaltzoglou A, Powell AV, Knight KS and Vaqueiro P, J. Solid State Chem, 2013, 198, 525–531. [Google Scholar]
- 27.Nolas GS, Yang J and Ertenberg RW, Phys. Rev. B: Condens. Matter Mater. Phys, 2003, 68, 193206. [Google Scholar]
- 28.Navrátil J, Plecháček T, Beneš L, Drašar Č and Laufek F, J. Electron. Mater, 2010, 39, 1880–1884. [Google Scholar]
- 29.Navrátil J, Plecháček T, Beneš L and Vlček M, Chalcogenide Lett, 2004, 1, 73–76. [Google Scholar]
- 30.Vaqueiro P and Sobany GG, Mater. Res. Soc. Symp. Proc, 2008, 1044, U05–U08. [Google Scholar]
- 31.Vaqueiro P, Sobany GG and Stindl M, J. Solid State Chem, 2008, 181, 768–776. [Google Scholar]
- 32.Laufek F, Navrátil J, Plášil J, Plecháček T and Drašar Č, J. Alloys Compd, 2009, 479, 102–106. [Google Scholar]
- 33.Chi H, Kim H, Thomas JC, Su X, Stackhouse S, Kaviany M, Van Der Ven A, Tang X and Uher C, Phys. Rev. B: Condens. Matter Mater. Phys, 2012, 86, 1–7. [Google Scholar]
- 34.Wei K, Dong Y, Puneet P, Tritt TM and Nolas GS, J. Alloys Compd, 2014, 614, 330–333. [Google Scholar]
- 35.Zevalkink A, Star K, Aydemir U, Snyder GJ, Fleurial J-P, Bux S, Vo T and von Allmen P, J. Appl. Phys, 2015, 118, 035107. [Google Scholar]
- 36.Liang Y, Fang B, Zhu XM and Liang MM, IOP Conf. Ser.: Mater. Sci. Eng, 2017, 182, 012012. [Google Scholar]
- 37.Bang S, Wee D, Li A, Fornari M and Kozinsky B, J. Appl. Phys, 2016, 119, 205102. [Google Scholar]
- 38.Navrátil J, Plechá T, Drašar Č, Vl M, Beneš L and Laufek F, 6th European Conference on Thermoelectrics, 2009, pp. 1–5. [Google Scholar]
- 39.Dong Y, Wei K and Nolas GS, Phys. Rev. B: Condens. Matter Mater. Phys, 2013, 87, 1–5. [Google Scholar]
- 40.Ohno S, Aydemir U, Amsler M, Pöhls JH, Chanakian S, Zevalkink A, White MA, Bux SK, Wolverton C and Snyder GJ, Adv. Funct. Mater, 2017, 27, 1–10. [Google Scholar]
- 41.Ohno S, Imasato K, Anand S, Tamaki H, Kang SD, Gorai P, Sato HK, Toberer ES, Kanno T and Snyder GJ, Joule, 2017, 1–14. [Google Scholar]
- 42.Tseng S.-m., Chen S.-w., Chang J.-s., Tang Y and Snyder GJ, Metall. Mater. Trans. E, 2015, 2, 236–249. [Google Scholar]
- 43.Tang Y, wen Chen S and Snyder GJ, J. Materiomics, 2015, 1, 75–84. [Google Scholar]
- 44.Qiu Y, Xi L, Shi X, Qiu P, Zhang W, Chen L, Salvador JR, Cho JY, Yang J, Chien YC, Chen SW, Tang Y and Snyder GJ, Adv. Funct. Mater, 2013, 23, 3194–3203. [Google Scholar]
- 45.Perl J, Shin J, Schümann J, Faddegon B and Paganetti H, Med. Phys, 2012, 39, 6818–6837. [DOI] [PMC free article] [PubMed] [Google Scholar]
- 46.Borup KA, Toberer ES, Zoltan LD, Nakatsukasa G, Errico M, Fleurial J-P, Iversen BB and Snyder GJ, Rev. Sci. Instrum, 2012, 83, 123902. [DOI] [PubMed] [Google Scholar]
- 47.Lany S and Zunger A, Phys. Rev. B: Condens. Matter Mater. Phys, 2008, 78, 235104. [Google Scholar]
- 48.Goyal A, Gorai P, Peng H, Lany S and Stevanović VS, Comput. Mater. Sci, 2016, 130, 1. [Google Scholar]
- 49.Perdew JP, Burke K and Ernzerhof M, Phys. Rev. Lett, 1996, 77, 3865. [DOI] [PubMed] [Google Scholar]
- 50.Kresse G and Furthmüller J, Phys. Rev. B: Condens. Matter Mater. Phys, 1996, 54, 11169. [DOI] [PubMed] [Google Scholar]
- 51.Dudarev SL, Botton GA, Savrasov SY, Humphreys CJ and Sutton AP, Phys. Rev. B: Condens. Matter Mater. Phys, 1998, 57, 1505. [Google Scholar]
- 52.Gorai P, Ortiz BR, Toberer ES and Stevanović V, J. Mater. Chem. A, 2018, 6, 13806. [DOI] [PMC free article] [PubMed] [Google Scholar]
- 53.Ortiz BR, Crawford CM, McKinney RW, Parilla PA and Toberer ES, J. Mater. Chem. A, 2016, 4, 8444–8450. [Google Scholar]
- 54.Li G, Bajaj S, Aydemir U, Hao S, Xiao H, Goddard WA, Zhai P, Zhang Q and Snyder GJ, Chem. Mater, 2016, 28, 2172. [Google Scholar]
Associated Data
This section collects any data citations, data availability statements, or supplementary materials included in this article.


