Abstract
Biosensor for the detection of virus was developed by utilizing plasmonic peak shift phenomenon of the gold nanoparticles and viral infection mechanism of hemagglutinin on virus and sialic acid on animal cells. The plasmonic peak of the colloidal gold nanoparticles changes with the aggregation of the particles due to the plasmonic interaction between nearby particles and the color of the colloidal nanoparticle solution changes from wine red to purple. Sialic acid reduced and stabilized colloidal gold nanoparticle aggregation is induced by the addition of viral particles in the solution due to the hemagglutinin-sialic acid interaction. In this work, sialic acid reduced and stabilized gold nanoparticles (d = 20.1 ± 1.8 nm) were synthesized by a simple one-pot, green method without chemically modifying sialic acid. The gold nanoparticles showed target-specific aggregation with viral particles via hemagglutinin-sialic acid binding. A linear correlation was observed between the change in optical density and dilution of chemically inactivated influenza B virus species. The detection limit of the virus dilution (hemagglutinination assay titer, 512) was shown to be 0.156 vol% and the upper limit of the linearity can be extended with the use of more sialic acid-gold nanoparticles.
Key words: Biosensor, Sialic acid, Gold nanoparticle, Viral detection, Colorimetric measurement
Introduction
Metallic nanoparticles absorb and scatter with great efficiency when interacting with light. This strong interaction between metallic nanoparticles and light occurs because the oscillating electromagnetic field of light initiates the coherent oscillation of the free electrons of the metallic nanoparticles. This oscillation is termed the surface plasmon resonance (SPR). SPR results in dipole oscillation along the direction of the electric field of light (Fig. 1) . The amplitude of the oscillation reaches the maximum at certain frequency of light and it is dependent on the particle size, shape, and refractive index of the solution. For noble metallic nanoparticles, the SPR-induced strong absorption or scattering of light can be easily measured by UV-Vis absorption spectrometer.
Fig. 1.

Schematic illustration of surface plasmon resonance of gold nanoparticles due to collective oscillation of surface electrons by incident light of appropriate wavelengths
The SPR band position relies strongly on the size and shape of individual nanoparticles and interparticle distance [1, 2]. Gold nanoparticles typically display an SPR band at around 520 nm. The assembly or aggregation of the metallic nanoparticles usually results in a red shift of the plasmonic band. This SPR band shift can be easily observed by naked eyes with the color of the colloidal gold solution changing from red to purple to blue. Kreibig et al. showed the relationship of SPR band position and interparticle distance decades ago [3]. The interparticle distance-dependent SPR band shift is attributed to the electric dipole-dipole interactions and coupling between plasmons of the neighboring particles in the aggregates. When the interparticle distance is greater than the average particle diameter (dispersed state), the SPR band appears to be red, whereas the color turns to blue when the interparticle distance decreases to less than the average particle diameter (aggregated state).
This phenomenon has been well adopted in various detection schemes with specific targeting elements decorated on the nanoparticle surface for the targets of interest, such as polynucleotides [4, 5], enzymes and proteins [6, 7], cells [8], and heavy metals [9]. In this chapter, we describe a method to develop the gold nanoparticles for the colorimetric detection of influenza virus based on the interaction between hemagglutinin, a protein expressed on the viral surface, and sialic acid, utilized as a surface stabilizing ligand on gold nanoparticles through a simple one-pot synthesis [10].
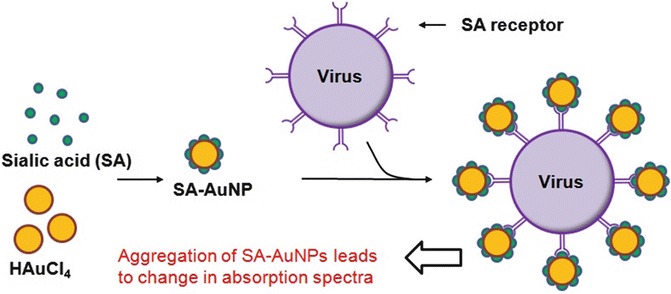
Sialic acid is a surface ligand presented on the surface of lung epithelial cells and it is recognized as the primary binding site for influenza virus. Hemagglutinin is a surface protein on various viral species that binds to sialic acid on targeted cell surface for the viral infection process [11]. The binding of viral proteins to sialic acid has been studied for various pathogenic viruses , such as influenza virus [11–13], human parainfluenza virus [14], human coronavirus [15, 16], and a specific serotype of rhinovirus [17]. Based on the binding capability of sialic acid to certain viruses, it is possible to design a colorimetric sensor for detecting virus using self-reporting plasmonic nanoparticles, which display plasmon shift upon binding to viral particles (Fig. 2). Such a quick and user-friendly detection method based on the binding between hemagglutinin on the influenza virus surface and sialic acid on the gold nanoparticle surface provides an effective means to identify individuals or animals infected with virus, and can help with early therapeutic intervention and reduce the spread of infection.
Fig. 2.

Detection scheme of viral particles based on the aggregation of SA-AuNPs on the virus surface through sialic acid-hemagglutinin binding
Materials
Equipment
IKAMAG® Safety Control heating magnetic stirrer (IKA).
Eppendorf bench-top centrifuge (Model 5424).
Nanotrac particle size analyzer (Microtrac).
Ocean Optics USB 4000 UV-Vis spectrometer.
Millipore Milli-DI System.
Sialic Acid and Gelatin Gold Nanoparticle Synthesis
1.25 mM N-acetylneuraminic acid (SA) (Catalogue No. A2388, Sigma-Aldrich, St. Louis, MO) was prepared in DI water.
0.1 wt% gelatin (Catalogue No. 53028, Sigma-Aldrich, St. Louis, MO) was prepared in DI water.
1 M sodium hydroxide (Catalogue No. S5881, Sigma-Aldrich, St. Louis, MO) was prepared in DI water.
0.02 M chloroauric acid (HAuCl4) (Catalogue No. 254169, Sigma-Aldrich, St. Louis, MO) was prepared in DI water.
Influenza Virus Deactivation
Dulbecco’s Modified Eagle Media (DMEM) (Catalogue No. 11965, Life Technology, Grand Island, NY) was used for the culture of virus.
Fetal Bovine Serum (FBS) (Catalogue No. 16000-044, Life Technology, Grand Island, NY) was added to 10% in DMEM.
β-propiolactone (Catalogue No. P5648, Sigma-Aldrich, St. Louis, MO) was added to 0.05% of final concentration in the viral solution.
Methods
Sialic Acid Gold Nanoparticle ( SA-AuNP) Synthesis
Ten milliliter of 1.25 mM sialic acid (SA) solution was prepared in DI water at room temperature. The SA solution was mixed with 250 μL of 0.02 M HAuCl4 followed by the addition of 50 μL 1 M NaOH in 20 mL glass vial (see Note 1).
The mixture was then stirred and heated for 80 °C at 20 × g for 15 min on a heating magnetic stirrer. The color of the solution changed from yellow to a dark red wine.
After the solution was cooled to room temperature, the gold nanoparticles were washed twice by centrifugation at 4500 × g) using a bench-top centrifuge (Eppendorf 5424) for 20 min. After the centrifugation, supernatant was removed and the dark red pellet was suspended in DI water and stored until further use.
Influenza Virus Inactivation
Virus solution was provided in 10% FBS containing DMEM and it was inactivated by the addition of β-propiolactone (final concentration of 0.05%) for 1 h at 37 °C.
Inactivated virus was stored at −20 °C until further use.
Particle Size Analysis
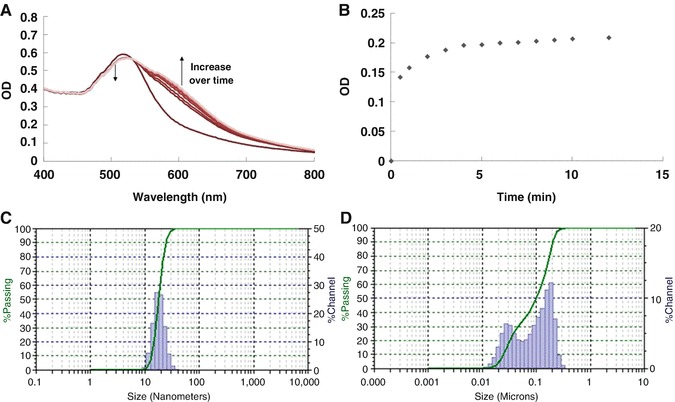
Particle size analysis was performed on a Nanotrac particle size analyzer (Microtrac) with a built-in liquid sample holder. The concentration of the sample was adjusted for the optimal measurement condition. Three 30-s measurements were averaged for particle size determination, with results shown in Fig. 3c.
Fig. 3.

Typical results of the UV-V is spectroscopic results and particle size analysis results of SA-AuNP before and after virus incubation. UV-Vis absorption spectra measured at 0, 0.5, 1, 2, 3, 4, 5, 6, 7, 8, 9, 10, and 12 min after the addition of 1.25 vol% influenza B/Victoria . (a) Typical UV-Vis spectral change of SA-AuNP solution after the addition of the virus, (b) change of OD610 over time, (c) particle size analysis result measured before the virus addition, and (d) particle size analysis result measured after the addition of 1.25 vol% influenza B/Victoria
Determination of SA-AuNP Concentration
To determine the concentration of the SA-AuNPs solution, the volume-density method was used based on the assumption of face-centered cubic (fcc) gold structure and 100% reaction yield. First, the following equation was used to calculate the number of gold atoms in a gold nanoparticle.
(N = number of atoms in a gold nanoparticle, ρ = density of fcc gold (19.3 g/cm3), r = radius of nanoparticle (10.05 nm), N A is Avogadro’s number, and M is gold atom’s atomic weight (196.97 g/mol).
The calculation result yielded ~250,000 gold atoms in 20.1 nm spherical-shaped gold nanoparticles. Since the initial concentration of HAuCl4 is 0.5 mM, the final SA-AuNP concentration is 2 nM when resuspended in the same volume of DI water.
UV-Vis Measurements
Five hundred microliter of the solution containing SA-AuNP with or without virus was added into the 1 cm path length quartz cuvette and placed in the cuvette holder of the UV-Vis spectrometer (Ocean Optics USB 4000 UV-Vis spectrometer). Then the UV-Vis spectrum was measured immediately. Results are shown in Fig. 3a, b.
Particle Size Analysis Measurements of SA-AuNP with Virus
Particle size of the SA-AuNP with virus was measured in the same way as described in Subheading 3.3. In short, the solution containing virus incubated SA-AuNP was placed in the built-in liquid sample holder of the particle size analyzer (Microtrac). The sample concentration was adjusted for the optimum result, as shown in Fig. 3d.
Colorimetric Detection of Viral Particles
Five hundred microliter of SA-AuNP solution was mixed with different dilutions of influenza virus solution and immediately added to a 1-cm path length quartz cuvette.
The cuvette was then placed in UV-Vis spectrometer (USB 4000, Ocean Optics) and absorption spectra were measured every minute until a plateau was reached.
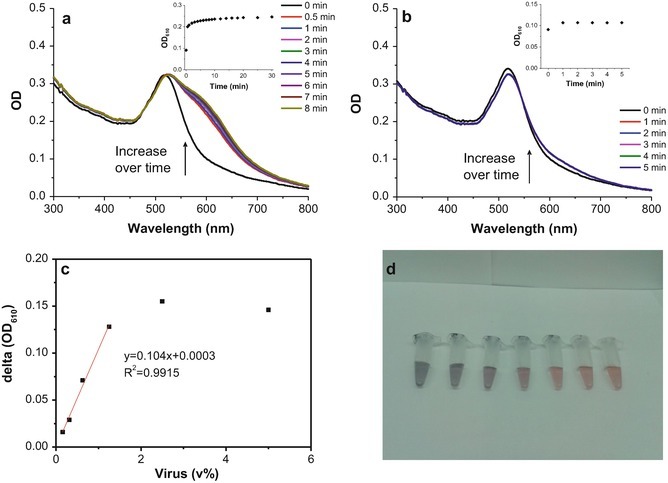
In a typical experiment, it was observed that the absorption spectrum of SA-AuNPs solution changed immediately after the addition of influenza B/Victoria solution, with increasing OD value at 600–610 nm and decreasing OD value at 510 nm over time. The spectrum becomes stabilized after several minutes, as shown in Fig. 4. The absorbance of 0.4 nM SA-AuNPs solution was measured upon the addition of different dilutions of influenza B/Victoria. We observe that, when the virus concentration was <1.25 vol%, there was a linear correlation between the change of OD value (ΔOD) and the amount of added virus solution, with the detection limit estimated as 0.09 vol%. The final solutions after each test illustrated the gradual change of color from red to purple as the amount of virus solution increased (photograph in Fig. 4) .
Fig. 4.

(a) Absorption spectra of 0.4 nM SA-AuNPs over time after the addition of 2.5 vol% influenza B/Victoria solution; inset, OD610 value change. (b) Absorption spectra of 0.4 nM SA-AuNPs over time after the addition of 0.156 vol% virus solution; inset, change in OD610. (c) Change in OD610 value after reaching plateau for different dilutions of virus. A linear correlation is observed for dilutions <1.25 vol% virus. (d) Photograph of SA-AuNPs with different dilutions of virus, 5, 2.5, 1.25, 0.625, 0.3125, 0.156, and 0 vol% from left to right, respectively
Increasing the Linear Dynamic Range of Virus Measurements
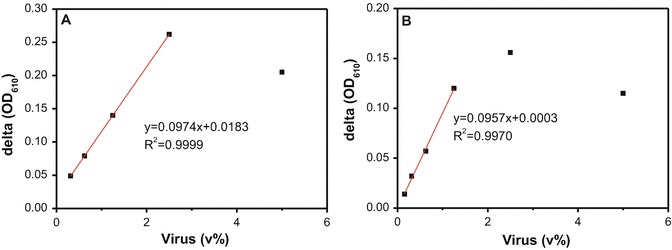
To increase the linear range of ΔOD vs. concentration of added virus solution, we used a higher concentration of SA-AuNP solution (0.8 nM) to conduct the similar tests, with results shown in Fig. 5a. It was observed that the linear range of ΔOD vs. concentration of added virus solution was extended to 2.5 vol% of virus in the solution. These results illustrate the importance of using a large amount of SA-AuNPs in the solution for virus detection when applying this scheme. We note that this method can also detect another virus subtype, influenza B/Yamagata. Results obtained from the influenza B/Yamagata solutions are similar to those of influenza B/Victoria and shown in Fig. 5b.
Fig. 5.

(a) Change in OD610 measured for 0.8 nM SA-AuNP solution after the addition of influenza B/Victoria. A linear correlation is observed for dilutions <2.5 vol% virus. (b) Change in OD610 measured for 0.4 nM SA-AuNP solution after the addition of influenza B/Yamagata. A linear correlation is observed for dilutions <1.25 vol% virus
In conclusion, we demonstrate a simple method to synthesize gold nanoparticles using sialic acid as both the reducing agent and the stabilizing agent. Experimental results support the hypothesis that sialic acid molecules on SA-AuNP surface interact with viral envelope protein hemagglutinin, causing a colorimetric change of the SA-AuNP solution. The resulting SA-AuNPs can readily detect influenza B virus (HA titer of 512) diluted to 0.156 vol%. The method is effective for different influenza B lineages (Victoria and Yamagata) .
Notes
The amount of 1 M NaOH can be varied in the range of 20–100 μL to achieve the best results, as the local deionized water may have slightly different pH values.
Acknowledgment
P.Z. acknowledges support from the National Science Foundation (CBET-0931677/1065633). A.A.W. acknowledges National Institute of Health (R01AI089450 from NIAID) for support.
Contributor Information
Avraham Rasooly, Phone: +11+1240-276-6196, Email: Rasoolya@mail.nih.gov.
Ben Prickril, Phone: +11240-276-5794, Email: prickril@mail.nih.edu.
Peng Zhang, Email: zhangph@ucmail.uc.edu.
References
- 1.Zhong Z, Patskovskyy S, Bouvrette P, Luong JHT, Gedanken A. The surface chemistry of Au colloids and their interactions with functional amino acids. J Phys Chem B. 2004;108:4046–4052. doi: 10.1021/jp037056a. [DOI] [Google Scholar]
- 2.Link S, El-Sayed MA. Size and temperature dependence of the plasmon absorption of colloidal gold nanoparticles. J Phys Chem B. 1999;103:4212–4217. doi: 10.1021/jp984796o. [DOI] [Google Scholar]
- 3.Kreibig U, Genzel L. Optical absorption of small metallic particles. Surf Sci. 1985;156:678–700. doi: 10.1016/0039-6028(85)90239-0. [DOI] [Google Scholar]
- 4.Elghanian R, Storhoff JJ, Mucic RC, Letsinger RL, Mirkin CA. Selective colorimetric detection of polynucleotides based on the distance-dependent optical properties of gold nanoparticles. Science. 1997;277:1078–1081. doi: 10.1126/science.277.5329.1078. [DOI] [PubMed] [Google Scholar]
- 5.Storhoff JJ, Marla SS, Bao P, Hagenow S, Mehta H, Lucas A, Garimella V, Patno T, Buckingham W, Cork W, Müller UR. Gold nanoparticle-based detection of genomic DNA targets on microarrays using a novel optical detection system. Biosens Bioelectron. 2004;19:875–883. doi: 10.1016/j.bios.2003.08.014. [DOI] [PubMed] [Google Scholar]
- 6.Thanh NTK, Rosenzweig Z. Development of an aggregation-based immunoassay for anti-protein a using gold nanoparticles. Anal Chem. 2002;74:1624–1628. doi: 10.1021/ac011127p. [DOI] [PubMed] [Google Scholar]
- 7.Pavlov V, Xiao Y, Shlyahovsky B, Willner I. Aptamer-functionalized Au nanoparticles for the amplified optical detection of thrombin. J Am Chem Soc. 2004;126:11768–11769. doi: 10.1021/ja046970u. [DOI] [PubMed] [Google Scholar]
- 8.Medley CD, Smith JE, Tang Z, Wu Y, Bamrungsap S, Tan W. Gold nanoparticle-based colorimetric assay for the direct detection of cancerous cells. Anal Chem. 2008;80:1067–1072. doi: 10.1021/ac702037y. [DOI] [PubMed] [Google Scholar]
- 9.Darbha GK, Singh AK, Rai US, Yu E, Yu H, Chandra Ray P. Selective detection of mercury (II) ion using nonlinear optical properties of gold nanoparticles. J Am Chem Soc. 2008;130:8038–8043. doi: 10.1021/ja801412b. [DOI] [PMC free article] [PubMed] [Google Scholar]
- 10.Lee C, Gaston MA, Weiss AA, Zhang P. Colorimetric viral detection based on sialic acid stabilized gold nanoparticles. Biosens Bioelectron. 2013;42:236–241. doi: 10.1016/j.bios.2012.10.067. [DOI] [PMC free article] [PubMed] [Google Scholar]
- 11.Sauter NK, Hanson JE, Glick GD, Brown JH, Crowther RL, Park SJ, Skehel JJ, Wiley DC. Binding of influenza virus hemagglutinin to analogs of its cell-surface receptor, sialic acid: analysis by proton nuclear magnetic resonance spectroscopy and X-ray crystallography. Biochemistry. 1992;31:9609–9621. doi: 10.1021/bi00155a013. [DOI] [PubMed] [Google Scholar]
- 12.Varghese JN, Colman PM, van Donkelaar A, Blick TJ, Sahasrabudhe A, McKimm-Breschkin JL. Structural evidence for a second sialic acid binding site in avian influenza virus neuraminidases. Proc Natl Acad Sci U S A. 1997;94:11808–11812. doi: 10.1073/pnas.94.22.11808. [DOI] [PMC free article] [PubMed] [Google Scholar]
- 13.Weis W, Brown JH, Cusack S, Paulson JC, Skehel JJ, Wiley DC. Structure of the influenza virus haemagglutinin complexed with its receptor, sialic acid. Nature. 1988;333:426–431. doi: 10.1038/333426a0. [DOI] [PubMed] [Google Scholar]
- 14.Suzuki T, Portner A, Scroggs RA, Uchikawa M, Koyama N, Matsuo K, Suzuki Y, Takimoto T. Receptor specificities of human respiroviruses. J Virol. 2001;75:4604–4613. doi: 10.1128/JVI.75.10.4604-4613.2001. [DOI] [PMC free article] [PubMed] [Google Scholar]
- 15.Vlasak R, Luytjes W, Spaan W, Palese P. Human and bovine coronaviruses recognize sialic acid-containing receptors similar to those of influenza C viruses. Proc Natl Acad Sci U S A. 1988;85:4526–4529. doi: 10.1073/pnas.85.12.4526. [DOI] [PMC free article] [PubMed] [Google Scholar]
- 16.Kunkel F, Herrler G. Structural and functional analysis of the surface protein of human coronavirus OC43. Virology. 1993;195:195–202. doi: 10.1006/viro.1993.1360. [DOI] [PMC free article] [PubMed] [Google Scholar]
- 17.Uncapher CR, DeWitt CM, Colonno RJ. The major and minor group receptor families contain all but one human rhinovirus serotype. Virology. 1991;180:814–817. doi: 10.1016/0042-6822(91)90098-V. [DOI] [PubMed] [Google Scholar]


