

Abstract
The objective of this study was to evaluate the association between carbon nanotube and nanofiber (CNT/F) exposure and ex vivo responses of whole blood challenged with secondary stimulants, adjusting for potential confounders, in a cross-sectional study of 102 workers. Multi-day exposure was measured by CNT/F structure count (SC) and elemental carbon (EC) air concentrations. Demographic, lifestyle and other occupational covariate data were obtained via questionnaire. Whole blood collected from each participant was incubated for 18 hours with and without two microbial stimulants (lipopolysaccharide/LPS and staphylococcal enterotoxin type B/SEB) using TruCulture technology to evaluate immune cell activity. Following incubation, supernatants were preserved and analyzed for protein concentrations. The stimulant:null response ratio for each individual protein was analyzed using multiple linear regression, followed by principal component (PC) analysis to determine whether patterns of protein response were related to CNT/F exposure. Adjusting for confounders, CNT/F metrics (most strongly, the SC-based) were significantly (p<0.05) inversely associated with stimulant:null ratios of several individual biomarkers: GM-CSF, IFN-γ, interleukin (IL)-2, IL-4, IL-5, IL-10, IL-17, and IL-23. CNT/F metrics were significantly inversely associated with PC1 (a weighted mean of most biomarkers, explaining 25% of the variance in the protein ratios) and PC2 (a biomarker contrast, explaining 14%). Among other occupational exposures, only solvent exposure was significant (inversely related to PC2). CNT/F exposure metrics were uniquely related to stimulant responses in challenged whole blood, illustrating reduced responsiveness to a secondary stimulus. This approach, if replicated in other exposed populations, may present a relatively sensitive method to evaluate human response to CNT/F or other occupational exposures.
Keywords: Carbon nanotubes, Carbon nanofibers, immunosuppression, immunology, epidemiology, nanomaterials, nanotechnology
Introduction
Occupational exposures to engineered nanomaterials are an emerging concern, given evidence from animal toxicology studies of their potentially hazardous effects. Carbon nanotubes and nanofibers (CNT/F), in particular, have been observed in animal models to cause persistent pulmonary inflammation, granulomatosis, fibrosis (Lam et al. 2006; Oberdorster et al. 2015) and possibly cancer (Sargent et al. 2014; Grosse et al. 2014; Kasai et al. 2016). In addition, immunosuppression, neuroinflammation, and cardiovascular effects, such as endothelial dysfunction, may occur from systemic inflammation following inhalation exposure (Mitchell et al. 2009, Aragon et al. 2017, Erdely et al. 2009, Aragon et al. 2016).
Several epidemiologic investigations, consisting of small, primarily cross-sectional studies, have been initiated in CNT/F workplaces worldwide, including in Asia (Liou et al. 2012; Liao et al. 2014; Lee et al. 2015), Europe, including Russia (Fatkhutdinova et al. 2016, Vlaanderen et al. 2017), and North America (Beard et al. 2018; Schubauer-Berigan et al. 2018). These studies have evaluated associations between CNT/F exposure (or its surrogates) and clinically relevant health metrics (e.g., pulmonary function, respiratory symptoms and illnesses, blood pressure or heart rate, and hematology) or circulating serum or plasma biomarkers of early effect (related to immune function, oxidative stress, inflammation, fibrosis, or coagulation). No consistent patterns have yet emerged among these studies. The limited sensitivity of measurements of circulating biomarkers in the context of a cross-sectional design, together with the generally low level of exposures and relatively short duration of exposure in these workforces, may hamper the ability to observe associations. Furthermore, static (circulating) baseline levels do not reflect the response potential of immune cells.
Recently, a novel functional immune response assay [TruCulture™ (Myriad RBM, Austin, TX, USA)] was developed to evaluate the response of circulating whole blood components ex vivo to a microbial challenge (Mueller et al. 2012; Duffy et al. 2014; 2017), producing interpretable patterns. The TruCulture assay integrates responses from all blood components, although most are expected to represent a direct or indirect response to leukocyte stimulation. This assay was found to be a sensitive measure of systemic immune function in an animal model of pulmonary welding fume exposure (Erdely et al. 2014). We hypothesized that TruCulture would provide a more sensitive way of measuring possible CNT/F effects on immunological response than evaluating a similar panel of circulating cytokines, within the context of a cross-sectional study. For example, many of the important inflammatory markers [e.g., interleukins (IL)-2, -4, -5, -6] were undetectable in the blood of workers in our recent study of CNT/F-exposed workers (Beard et al. 2018). However, when exposed to an external challenge (e.g., microbial surface endotoxins), the function of these ILs—and any impact upon them of CNT/F exposure—might be elucidated.
The context of this investigation was a cross-sectional study of workers employed at 12 facilities that make or use CNT/F in the U.S. Detailed facility exposure assessment and the associations of CNT/F exposure with clinically relevant metrics and circulating blood and sputum biomarkers have been previously described (Dahm et al. 2018, Schubauer-Berigan et al. 2018, Beard et al. 2018). This study describes results of an experiment conducted concomitantly with the earlier investigations. The primary study aim was to evaluate the association between occupational CNT/F exposure and chemokine and cytokine profile responses of collected circulating whole blood challenged ex vivo with secondary stimulants, while adjusting for important confounders. Based on in vivo studies of CNT exposure resulting in suppressed immune function (Mitchell et al. 2009), combined with our studies suggesting systemic immune suppression following metal-rich particulate exposure (Erdely et al. 2014; Zeidler-Erdely et al. 2012), we hypothesized that workers would exhibit evidence of potential immune suppression with increasing exposure to CNT/F. A secondary aim was to utilize pathway analysis to provide context for patterns of leukocyte responses that were associated with CNT/F exposure and other factors significantly associated with leukocyte responses.
Materials and Methods
This study was approved by the Institutional Review Board of the National Institute for Occupational Safety and Health (NIOSH, protocol #12-DSHEFS-05XP). All participants provided written informed consent to participate in this study.
Field methods
Participant selection
The selection of companies and workers for participation in the study is described elsewhere (Schubauer-Berigan et al. 2018). Briefly, companies making or using CNT/F in the U.S. were approached to participate in the study (80% agreed), and all workers1 employed at these facilities were recruited for the study (75% consented). Of 108 workers in the study, 102 (94%) consented to provide blood for the study (Beard et al. 2018). Demographic, lifestyle, medical, and other occupational exposure data were obtained via questionnaire.
CNT/F exposure assessment
Multi-day exposure was measured by CNT/F structure count (SC) and elemental carbon (EC) air concentrations, as described in Dahm et al. (2018). In brief, personal aerosol samples were collected for EC at the respirable and inhalable aerosol size fractions. Respirable samples were collected using 25-mm cassettes with quartz fiber filters (QFF; SKC Inc., Eighty Four, PA, USA) attached to a GK 2.69 BGI cyclones (BGI Inc., Waltham, MA, USA), while inhalable samples were collected using open-faced 25-mm cassettes and QFFs (SKC Inc.). The airborne mass concentration of EC was measured using the NIOSH Manual of Analytical Methods (NMAM) Method 5040 (NIOSH, 2006a), based on a thermal-optical analysis technique for organic and elemental carbon.
Additional personal samples were collected at the inhalable aerosol size fraction using open-faced 25-mm cassettes with mixed cellulose ester filters (0.8 μm pore size; SKC Inc.) to measure the CNT/F SC. The samples were analyzed on a JEOL2100F transmission electron microscope [(TEM) JEOL USA, Inc., Peabody, MA, USA] using a modified NMAM 7402, asbestos by TEM (NIOSH, 2006b; Birch et al., 2017). Modifications relate to counting CNT/F particles, which were observed mainly as agglomerated structures rather than individual fibers. Most agglomerated CNT/F particles were roughly spherical (i.e., the longest dimension was no more than two times the length of the orthogonal dimension); therefore, the maximum crosswise dimension was used to categorize the structure’s size. The counted CNT/F structures were placed into six discrete size-bins which included a single CNT/F fiber bin, CNT/F structure agglomerates with ‘diameters’ (maximum crosswise dimension) <1 μm, agglomerates with diameters between 1 to <2 μm, agglomerates between 2 to <5 μm, agglomerates between 5 to<10 μm, and agglomerates with diameters >10 μm. All structures, agglomerated or single fibers, were counted as one CNT/F structure. Based on the total number of CNT/F structures counted, and the collected air volume, the total CNT/F SC per cm3 concentration (s/cm3) was calculated.
Biospecimen collection
Sputum was induced (for 92 consenting participants) via inhalation of isotonic saline aerosol and was processed in the field for the determination of the presence of CNT/F (Schubauer-Berigan et al. 2018). Whole blood was collected for all 102 participants by venipuncture, and 4 mL was placed into lithium heparin tubes, which were inverted 10 times. Aliquots of 1 mL each were immediately transferred to two TruCulture assay tubes (one null and one stimulant for each worker). Each stimulant tube contained two microbial stimulants [lipopolysaccharide (LPS) and staphylococcal enterotoxin type (B/SEB)]. These stimulants were selected to provide potential insight into innate and adaptive immune responses. TruCulture tubes were mixed by inverting and incubated at 37ºC for 18 hours. After incubation (mean 18.0, standard deviation 0.09 hours), supernatants were collected, preserved at −20 ºC, and shipped on dry ice to the NIOSH laboratory, where they were preserved frozen. While the components of the media in the TruCulture tube were proprietary, we had direct communication with the manufacturer to ensure reproducibility during the study. Stimulant stocks were re-tested by the manufacturer prior to production of each set of TruCulture tubes. Consistency in handling and shipping the tubes to the various worksites was necessary as the culture medium was designed to work outside a CO2 incubator, meaning prolonged dry ice shipping could cause acidification of the media. We observed cellular stimulation (compared to the null tubes) in 100% of participating workers, suggesting proper media handling throughout the study.
Laboratory methods
Dark-field microscopy was used to detect the presence or absence of CNT/F in sputum, as described in Schubauer-Berigan et al. (2018). After all blood specimens from the workers participating from 12 CNT/F-handling companies were collected, the frozen TruCulture supernatants were sent for analysis by the contract laboratory (Myriad RBM). Cytokine and chemokine levels were measured to evaluate immune cell activity. The biomarkers included in the panel are described in Suppl. Table 1.
Statistical analysis
Biomarker selection
In the TruCulture assay, each person serves as his or her own ‘control’, through the use of both stimulant and null response tubes. To normalize stimulant to the individual null (baseline) response, we used the stimulant:null biomarker ratios, as they should be more informative than subtraction (of null from stimulant biomarker response) for outcomes in which the scale ranges over several orders of magnitude. Furthermore, the ratio (‘fold-change’) was described as an important metric in the foundational study of the TruCulture assay (Duffy et al. 2014). For the 30% of null tube responses that were below the detection limit for the assay, a value of half the lowest detectable value in the sample set was used in calculating the ratio. Biomarkers that were considered unresponsive (i.e., the stimulant:null ratio had both a coefficient of variation of <30% and a median value of <1.3) were excluded from further analysis.
Descriptive analysis
Descriptive information (e.g., percentages, means, median) was calculated for key demographic and lifestyle variables. In an initial analysis, the untransformed biomarkers were evaluated individually in a statistical model estimating their least-square means by tertiles (cutpoints were 0.00252 and 0.0651 structures/cm3) of maximum daily CNT/F SC concentration [measured by TEM; Dahm et al. 2018], adjusting for age, sex, and race (Neter et al. 1996).
Regression modelling of individual biomarkers with CNT and other occupational, demographic, and lifestyle variables
Each biomarker ratio was transformed to improve normality, with selection based on Box-Cox analysis to the nearest 0.25 exponent (Neter et al. 1996). Multiple linear regression was used to model each transformed biomarker’s association with CNT/F SC concentrations, adjusting for age (the variable most consistently associated with biomarker values).
Regression modeling of principal components of biomarkers with CNT and other occupational, demographic, and lifestyle variables
Principal component (PC) analysis was used as a method of multivariate analysis to evaluate the overall patterns of stimulant:null response for the group of 31 proteins. First, each transformed biomarker ratio was standardized to have a mean=0 and standard deviation=1. PC analysis was conducting using the group of standardized, transformed biomarkers. Multiple linear regression was then used to determine whether the each of the first two PCs (i.e., those associated with the largest percentage of the sample variation) were related to CNT/F exposure. The modeling approach evaluated potential confounders of the association between CNT/F and PCs from among the group of covariates most strongly associated with these PCs: age (treated as continuous), sex, race (non-Hispanic whites compared to Hispanics and those of other or multiple races), self-reported upper respiratory infection (‘current cold’), NSAID use, alcohol consumption level, and self-reported current exposure to ‘other’ nanomaterials or solvents. Variables were retained in the model if their exclusion resulted in a >10% change in the beta for the best-fitting CNT/F metric (maximum SC concentration). For the adjusted models of the first two PCs, we evaluated the fits of all available CNT/F metrics (Dahm et al 2018, Schubauer-Berigan et al. 2018): presence/absence of CNT/F in sputum, duration of employment handling CNT/F, multi-day mean EC concentrations at the respirable and inhalable size fractions, multiday maximum SC concentration, and multiday mean SC concentration at six structure size cutpoints: single fibers, <1 µm, <2 µm, <5 µm, <10 µm, and total. All analyses above were conducted using SAS ver. 9.4 (Cary, NC, USA).
Pathway Analysis
The functional and comparison analyses were generated through the use of Ingenuity Pathway Analysis (https://www.qiagenbioinformatics.com/products/ingenuity-pathway-analysis/) as previously described (Erdely et al. 2012). The beta:standard error ratio and p-value of the regression coefficient for each of the 31 transformed biomarker ratios, identified by their UniProt ID, were uploaded into the application and a core analysis was done. Each identifier was mapped to its corresponding object in Ingenuity’s Knowledge Base. Analysis criteria utilized included no p-value cutoff (to determine general relationships of effects), as well as use of a p<0.05 cutoff. The Functional Analysis identified the biological functions and/or diseases that were most significant for the data set. Canonical pathways analysis identified the pathways from the Ingenuity Pathway Analysis library of canonical pathways that were most significant for the data set. With the limited data set available for analysis, the pathway analysis was performed not to provide a deep insight into the biological outcomes, but to simply group observed responses with respect to particular exposures and demographics to understand how major biological changes varied among the groups.
Results
Descriptive results
The demographic, medical, and lifestyle-related characteristics of the 102 workers who provided blood for the TruCulture assay have been described previously (Table 1 of Beard et al. 2018), and a brief overview is provided in Table 1. The majority of the participants were male (80%) and non-Hispanic white (81%). The median age was 45. The mean and median of the multiday maximum SC concentrations were 0.219 and 0.0087 structure/cm3, respectively. Of the 46 biomarkers evaluated, 15 did not demonstrate a response in the TruCulture model sufficient for further analysis2. The remaining biomarker stimulant:null mean response ratios varied by four orders of magnitude (Table 2).
Table 1.
Characteristics of 102 cross-sectional study participants in TruCulture assay
| Characteristic | Group | N(%) |
|---|---|---|
| Sex | Male | 82(80%) |
| Female | 20(20%) | |
| Ethnicity and Race | Non-Hispanic White alone | 83(81%) |
| Non-Hispanic Asian alone | 9(9%) | |
| African-American, American Indian/Alaska Native, Multiple races, and Hispanic combined | 10(10%) | |
| Age(years) | <25 | 5(5%) |
| 25-<35 | 32(31%) | |
| 35-<45 | 14(14%) | |
| 45-<55 | 26(25%) | |
| 55-<65 | 20(20%) | |
| 65-<75 | 5(5%) | |
| Highest education level | High school, Trade or vocational | 13(13%) |
| Some college | 20(20%) | |
| College graduate | 29(28%) | |
| Postgraduate | 40(39%) | |
| Cigarette smoking status | Never | 63(62%) |
| Former | 24(24%) | |
| Current | 15(15%) | |
| Alcohol - current drinks per week | 0 | 35(34%) |
| 1-<5 | 34(33%) | |
| 5-<10 | 14(14%) | |
| 10-<15 | 14(14%) | |
| ≥15 | 5(5%) | |
| Carbon nanotube exposure (structure count concentrations in air) | 0-<0.00252 structures/cm3 | 34(33%) |
| 0.00252-<0.0651 structures/cm3 | 34(33%) | |
| ≥0.0651 structures/cm3 | 34(33%) | |
| Current solvent exposure | No | 48(47%) |
| Yes | 54(53%) | |
| Current ‘other nano’ exposure | No | 86(84%) |
| Yes | 16(16%) | |
| Recent NSAID use | No | 75(74%) |
| Yes | 27(26%) |
Table 2.
Biomarker stimulant:null (S:N) ratio characteristics among 102 workers in CNT/F study, for 31 biomarkers exhibiting a coefficient of variation of >30% or a median value >1.3.
| Biomarker* | S:N mean | S:N standard deviation | S:N range | S:N best Box-Cox transform k† | p-value for Shapiro-Wilk W for normality of transformed S:N |
|---|---|---|---|---|---|
| GM-CSF | 23.2 | 19.8 | 1.0, 105 | 0.25 | 0.49 |
| Haptoglobin | 5.78 | 18.0 | 0.019, 122 | 0 | <0.0001 |
| IFN-γ | 3560 | 3580 | 20, 2.29E4 | 0.25 | 0.95 |
| IL-1α | 368 | 554 | 1.6, 3.07E3 | 0.25 | 0.0028 |
| IL-1β | 4000 | 3010 | 136, 1.78E4 | 0.25 | 0.061 |
| IL-1ra | 10.1 | 3.94 | 2.8, 24.9 | 0.25 | 0.59 |
| IL-2 | 484 | 563 | 4.3, 2.84E3 | 0.25 | 0.16 |
| IL-3 | 47.5 | 19.0 | 6.9, 95.4 | 1 | 0.71 |
| IL-4 | 70.4 | 53.7 | 8.1, 385 | 0.25 | 0.21 |
| IL-5 | 10.7 | 11.3 | 1.0, 65.7 | 0 | 0.0076 |
| IL-6 | 5.24E4 | 2.30E4 | 3.41E3, 6.5E4 | 0.5 | 0.21 |
| IL-7 | 80.4 | 40.5 | 8.24, 145 | 1 | <0.0001 |
| IL-8 | 3970 | 2910 | 2.15E3, 5.12E3 | 0.25 | 0.52 |
| IL-10 | 980 | 603 | 77.7, 3.91E3 | 0.25 | 0.59 |
| IL-12p40 | 47.0 | 21.7 | 6.3, 153 | 0.25 | 0.27 |
| IL-12p70 | 8.37 | 7.81 | 1.0, 54.7 | 0.25 | 0.015 |
| IL-15 | 3.12 | 0.96 | 1.3, 5.8 | 0 | 0.38 |
| IL-17 | 57.5 | 61.3 | 2.2, 338 | 0.25 | 0.074 |
| IL-18 | 2.96 | 1.03 | 1.3, 7.5 | 0 | 0.38 |
| IL-23 | 12.8 | 8.14 | 1.2, 53.5 | 0.25 | 0.013 |
| MCP1 | 56.1 | 58.4 | 6.2, 440 | 0 | 0.85 |
| MIP1α | 1.13E4 | 8.28E3 | 8.26E3, 1.54E4 | 0 | 0.36 |
| MIP1β | 4670 | 2390 | 650, 1.29E4 | 0.5 | 0.70 |
| MMP9 | 6.37 | 2.41 | 3.5, 19.1 | -1 | 0.91 |
| SCF | 4.72 | 1.95 | 0.98, 10.8 | 0.25 | 0.83 |
| TIMP1 | 1.44 | 0.226 | 0.98, 2.2 | 1 | 0.14 |
| TNFα | 5780 | 4050 | 997, 2.18E4 | 0 | 0.078 |
| TNFβ | 91.5 | 53.2 | 8.3, 187 | 0.75 | <0.0001 |
| TNFR2 | 3.18 | 0.893 | 1.4, 5.5 | 1 | 0.025 |
| VEGF | 2.23 | 1.01 | 0.67, 5.84 | 0 | 0.58 |
| vWF | 1.30 | 0.61 | 0.53, 5.15 | -0.5 | 0.52 |
Biomarker descriptions are given in Suppl. Table 1
Where Box-Cox transform t(b) of biomarker ratio b is defined as: t(b)=(bk-1)/k for k≠0 and t(b)=ln(b) for k=0.
The least-squares means of individual biomarker ratio levels stratified by tertiles of CNT/F structure counts are shown in Fig. 1, ordered by biomarker ratio mean values in order to facilitate the data presentation. Exposures were stratified into three categories, by tertile: tertile 1 [max TEM; <0.0025 structure/cm3], tertile 2 [max TEM; 0.0025 - <0.065 structure/cm3], and tertile 3 [max TEM; ≥0.065 structure/cm3]. Workers in the lowest exposure tertile tended to have higher biomarker ratio levels than those in the higher-exposed tertiles, which is consistent with a reduced leukocyte responsiveness. Significant differences (p<0.05) were observed for Haptoglobin, IL-1β, IL-1ra, IL-3, IL-10, IL-12p40, IL-15, IL-18, IL-23, MMP9, SCF, TIMP1, VEGF, and vWF.
Fig. 1.
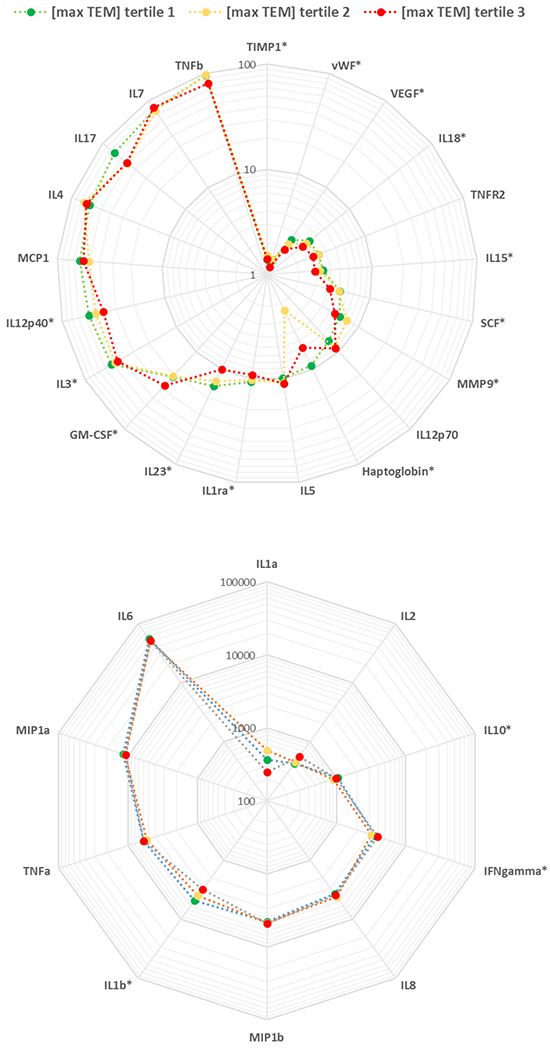
Spider plot of untransformed biomarker ratios by CNT structure count concentration tertile (TEM max). The radial axis of the plot represents the biomarker response (i.e., the mean value of stimulant:null ratios for the group of workers in each CNT exposure tertile), and the biomarkers are ordered by their mean biomarker response across the entire group of workers.
* Untransformed biomarker ratio was significantly different among tertiles of exposure (p<0.05)
Associations of individual biomarkers with CNT and other occupational, demographic, and lifestyle variables
In continuous linear regression models of each individual transformed biomarker response, age and female sex tended to be inversely associated with many of the biomarkers (Fig. 2, Suppl. Table 2). Non-Hispanic white workers tended to have higher biomarker responses than workers of other races or Hispanic ethnicity. Most lifestyle-related factors were not significantly associated with biomarkers; however, alcohol consumption tended to be positively associated with many biomarker responses. Using NSAIDs and hypertensive medication were significantly positively and inversely (respectively) associated with several biomarker responses. Among occupational exposures other than CNT/F, only current solvent and ‘other’ nanomaterial exposure were significantly associated (inversely and positively, respectively), with many of the biomarker responses. Among the CNT/F metrics, TEM-based SC concentrations showed the strongest associations with biomarker responses, with sputum CNT/F detection and duration of employment with CNT/F also significantly inversely associated with several biomarkers (Fig. 2). Several biomarker response ratios were related to no occupational variables: IL-1α, IL-1β, IL-7, IL-18, MIP1β, TIMP1, TNFα, and VEGF.
Fig. 2.
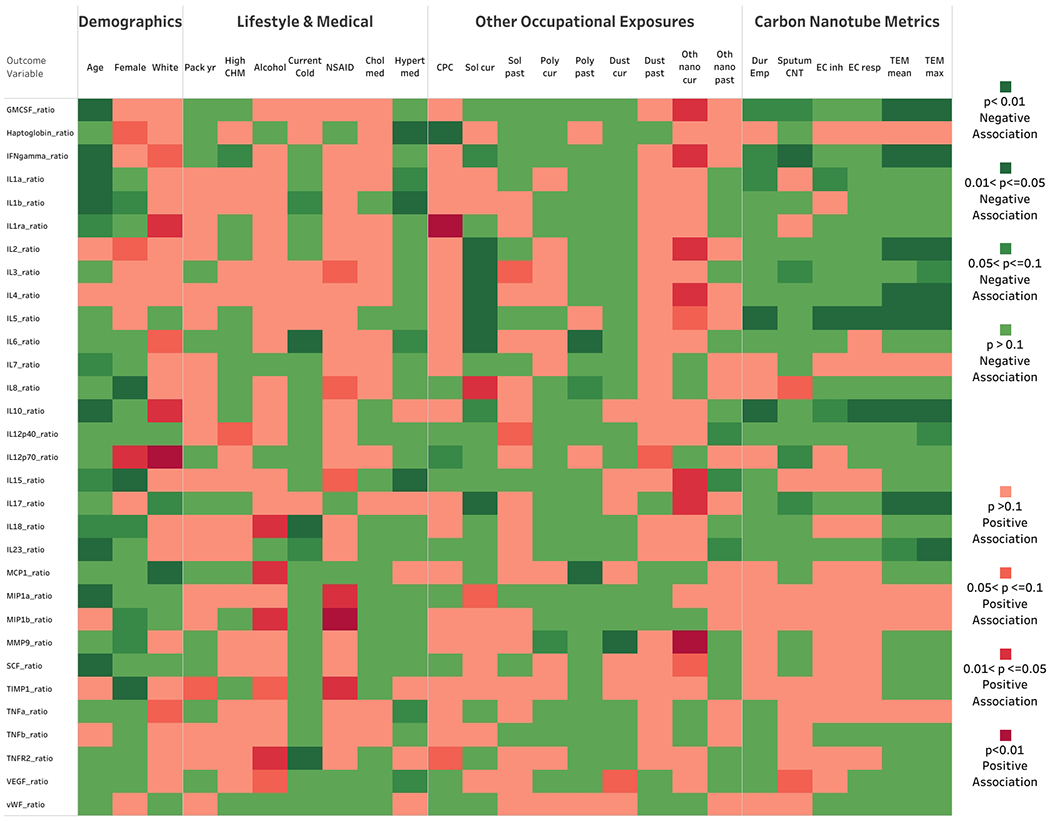
Heat map of the association of demographic, lifestyle, and occupational variables with transformed inflammatory biomarker response ratios.
Associations of principal components of biomarkers with CNT and other occupational, demographic, and lifestyle variables
The first six principal components explained 62% of the variation in biomarker responses (Table 3). PC1 (explaining 25.2%) appears to correspond to a weighted mean of all individual biomarkers except Haptoglobin, TNFβ, and vWF. PC2 (explaining 13.5%) represents a contrast between GM-CSF, IFN-γ, IL-2—IL-5, IL-10, IL-17, and IL-12p70 vs IL-1α, IL-1β, IL-7, IL-8, IL-12p40, IL-15, IL-23, MIP1α, SCF, TNFα, and VEGF. In multivariable modeling of PC1, the final model adjusted for age, race, and alcohol consumption level. For PC2, the final model adjusted only for current exposure to solvents. The CNT/F structure counts were significantly inversely associated with both PC1 and PC2 (Table 4), after adjusting for confounding. Nearly all CNT/F exposure metrics were inversely associated with PC1 and PC2. The maximum multiday CNT/F structure count concentrations (TEM-max) were most strongly associated, and EC metrics were least strongly associated, with these PCs. Examination of the importance of structure size concentration shows similar fit across the size bins, with a slightly improved fit in the <2µm structure size bin (Table 4). CNT/F in sputum was of borderline significance in its association with PC2.
Table 3.
Eigenvalues (proportion of variance explained) and eigenvectors for principal components (PC) 1–6 of 31 normalized, transformed biomarker ratios, with positive (>0.10) and negative (<−0.10) loadings for each PC highlighted in red and green, respectively.
| PC1 | PC2 | PC3 | PC4 | PC5 | PC6 | |
|---|---|---|---|---|---|---|
| Eigenvalue | 0.252 | 0.135 | 0.087 | 0.054 | 0.050 | 0.038 |
| GM_CSF | 0.1806 | 0.2986 | −0.0082 | −0.1514 | −0.1308 | 0.1669 |
| Haptoglobin | −0.0103 | 0.0158 | −0.0865 | −0.2198 | 0.2686 | −0.0016 |
| IFN-γ | 0.1971 | 0.2712 | −0.1935 | −0.0652 | −0.1328 | 0.1277 |
| IL-1α | 0.2093 | −0.1097 | −0.0716 | 0.1074 | 0.1498 | 0.1518 |
| IL-1β | 0.2725 | −0.1505 | −0.1086 | −0.1254 | 0.0327 | 0.1124 |
| IL-1ra | 0.2456 | 0.0251 | −0.1024 | 0.1878 | 0.2135 | −0.1045 |
| IL-2 | 0.0943 | 0.3828 | 0.0809 | −0.0184 | −0.0830 | −0.1046 |
| IL-3 | 0.1638 | 0.1403 | −0.1906 | 0.2698 | 0.0158 | 0.2457 |
| IL-4 | 0.1381 | 0.3585 | 0.0080 | −0.0044 | 0.0127 | −0.1580 |
| IL5 | 0.0955 | 0.3748 | 0.0241 | −0.0011 | 0.0087 | −0.0888 |
| IL-6 | 0.2592 | −0.0606 | −0.1091 | 0.1449 | −0.0740 | −0.0097 |
| IL-7 | 0.0701 | −0.1006 | −0.1721 | 0.4770 | −0.0512 | 0.2287 |
| IL-8 | 0.1099 | −0.1930 | 0.2179 | 0.1717 | −0.4130 | 0.0104 |
| IL-10 | 0.1574 | 0.2512 | 0.0894 | 0.1577 | 0.1520 | −0.1306 |
| IL-12p40 | 0.2666 | −0.1126 | −0.1221 | −0.1356 | 0.0154 | −0.1031 |
| IL-12p70 | 0.0939 | 0.1225 | −0.3440 | −0.0699 | −0.3050 | 0.0051 |
| IL-15 | 0.2616 | −0.1180 | 0.0539 | −0.1729 | 0.0841 | −0.0782 |
| IL-17 | 0.1009 | 0.2954 | 0.1286 | −0.2116 | −0.0303 | 0.3153 |
| IL-18 | 0.2256 | −0.0519 | −0.0071 | 0.0866 | 0.2426 | 0.1040 |
| IL-23 | 0.2527 | −0.1490 | −0.0557 | −0.1436 | 0.0284 | −0.0902 |
| MIP1α | 0.2107 | −0.1240 | 0.2047 | −0.1826 | −0.2674 | 0.0448 |
| MIP1β | 0.1623 | −0.0719 | 0.2168 | 0.1771 | −0.3381 | −0.0978 |
| MMP9 | 0.2009 | −0.0835 | 0.0379 | −0.1412 | −0.0229 | −0.2387 |
| MCP1 | 0.1226 | 0.0460 | 0.3517 | 0.1571 | −0.0017 | 0.1346 |
| SCF | 0.2655 | −0.1175 | 0.0161 | −0.2352 | 0.0780 | 0.1463 |
| TIMP1 | 0.0990 | −0.0063 | 0.4512 | 0.0418 | 0.1902 | −0.1643 |
| TNFα | 0.1706 | −0.1097 | −0.2093 | 0.2004 | −0.2020 | −0.1155 |
| TNFβ | 0.0148 | 0.0756 | −0.2514 | 0.2063 | 0.1850 | −0.4869 |
| TNFR2 | 0.2140 | 0.0265 | 0.3014 | 0.2235 | 0.2017 | −0.0665 |
| VEGF | 0.1480 | −0.1754 | −0.1230 | −0.2414 | 0.0544 | −0.1660 |
| vWF | 0.0228 | −0.0768 | −0.0191 | 0.0479 | 0.3267 | 0.4278 |
Table 4.
Beta, standard error, and p for different CNT/F metrics for multivariable models of the first two principal components of 31 biomarker response ratios measured among 108 workers.
| CNT/F exposure metric§ | Principal Component 1 | Principal Component 2 | ||||
|---|---|---|---|---|---|---|
| β* | SE(β) | p | β† | SE(β) | p | |
| CNT/F in sputum | −0.221 | 0.757 | 0.771 | −1.02 | 0.547 | 0.066 |
| [max total] SC/cm3 | −0.717 | 0.340 | 0.037 | −0.587 | 0.253 | 0.022 |
| [mean total] SC/cm3 | −1.02 | 0.554 | 0.070 | −0.856 | 0.413 | 0.041 |
| [mean <10µm] SC/cm3 | −1.09 | 0.591 | 0.069 | −0.928 | 0.440 | 0.038 |
| [mean <5µm] SC/cm3 | −1.52 | 0.825 | 0.069 | −1.32 | 0.614 | 0.034 |
| [mean <2µm] SC/cm3 | −2.44 | 1.30 | 0.064 | −2.25 | 0.956 | 0.021 |
| [mean <1µm] SC/cm3 | −2.50 | 1.35 | 0.067 | −2.34 | 0.990 | 0.020 |
| [mean SF] SC/cm3 | −2.32 | 1.35 | 0.089 | −2.35 | 0.995 | 0.020 |
| [EC-inhalable] µg/m3 | 6.98E-4 | 6.34E-3 | 0.912 | −6.58E-03 | 4.74E-03 | 0.168 |
| [EC-respirable] µg/m3 | −0.0182 | 0.0529 | 0.731 | −0.0647 | 0.0394 | 0.104 |
| CNT/F employment duration (years) | −0.0666 | 0.0668 | 0.321 | −0.0442 | 0.0518 | 0.396 |
Abbreviations: CNT/F-carbon nanotubes and nanofibers; EC-elemental carbon; SC-structure counts; SE-standard error; SF-single fiber
[max total] and [mean total] are multiday maximum and mean, respectively, concentrations of all structure sizes; [mean <n] are multiday mean concentrations of structure sizes <n µm
Model adjusted for age, race, and alcohol consumption levels
Model adjusted for current solvent exposure
Pathway analysis
The pathway analysis was conducted on the significant inverse associations of age, current solvent exposure, and the carbon nanotube metric of TEM-max. The analysis provided insight into how the altered mediators grouped with respect to potentially associated biological ramifications. Focusing on TEM-max initially, the most significant canonical pathways were ‘role of cytokines mediating communication between immune cells’ (Suppl. Fig. 1) and ‘communication between innate and adaptive immune cells’. The results indicated a generalized inhibition of all leukocyte responses when challenged with a secondary stimulus (Suppl. Fig. 1). The analysis of the reduced responsiveness revealed profoundly inhibited categories of biological functions (p ≤ 1× 10⁻¹⁶), related primarily to molecular and cellular functions, including cell-to-cell signaling and interaction, cellular growth and proliferation, cellular development, cellular movement, inflammatory response, immune cell trafficking and hematological system development and function. The results were consistent whether or not the p<0.05 cutoff was used (Fig. 3a,b). Similar to TEM-max, both age and current solvent use were inversely associated with responses from challenged circulating whole blood. Comparison analysis highlighted the strong inverse associations with age, current solvent use, and TEM-max for many annotations (e.g., ‘stimulation of cells’) of the categories of leukocyte function indicated above, following stimulation with a secondary stimulus (Fig. 3a, 3b). Further analysis of the mediators reaching significance at p<0.05 indicated that age and current solvent use overlapped partially with effects seen with TEM-max but did not mutually overlap (Fig. 3b, 3c). Evaluation of the comparative analysis of the diseases and biological functions for the mediators reaching significance indicated that current solvent use more specifically related to effects on lymphocyte function than did age and TEM-max, which related to general leukocyte function (Fig. 3b).
Fig. 3.
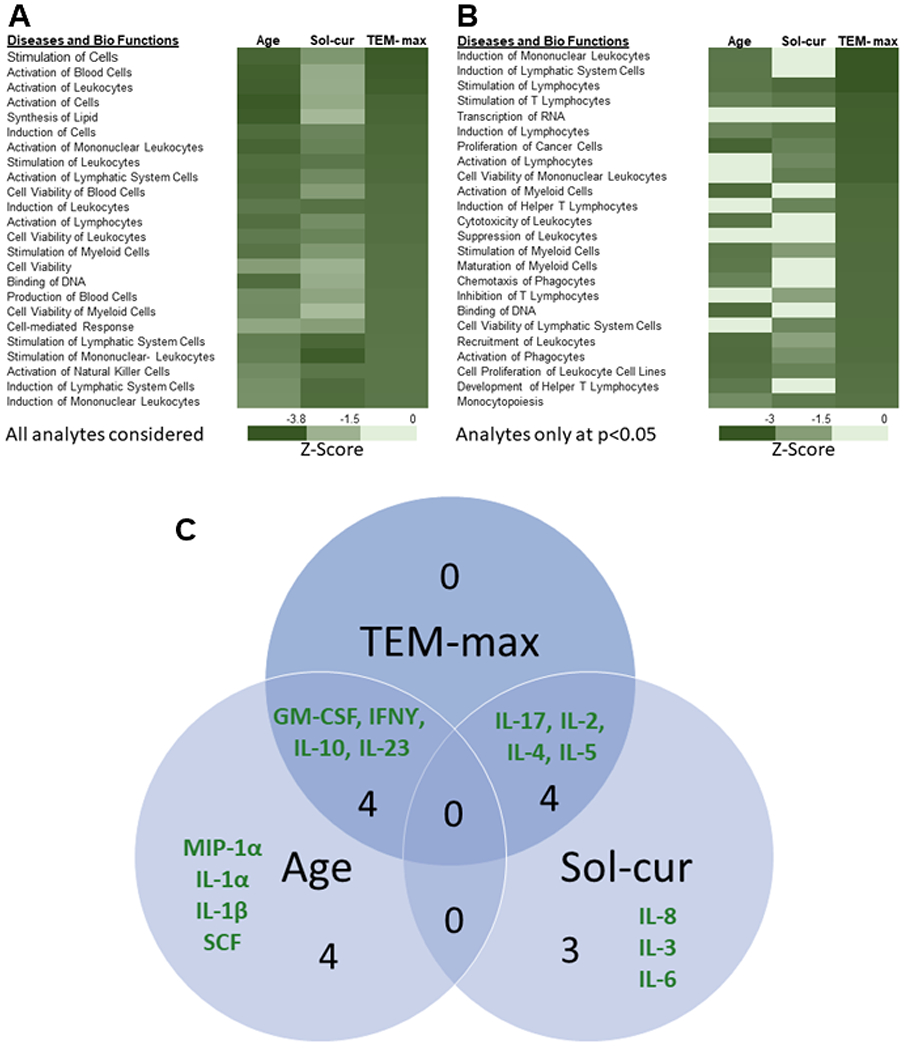
Results of the comparative analysis for age, current solvent use (Sol-cur), and TEM-max. Comparative analysis of Diseases and Bio Functions considering all analytes (Fig. 3a) and only the analytes reaching significance at p<0.05 (Fig. 3b) were sorted in descending order from the most significant inverse association, represented by z-score, to TEM-max. Results of the specific analytes reaching significance for each measure and the interaction with TEM-max was represented in the Venn diagram (Fig. 3c).
Discussion
We conducted our study of functional immune response in a cross-section of workers from 12 different U.S. facilities exhibiting generally low levels of exposure to carbon nanotubes or nanofibers (Dahm et al. 2018). Immune function is difficult to characterize (and its measurement to standardize) in a healthy human population; there is interest in using functional response assays to understand the range of normal patterns of whole blood responses to external challenges, be they microbial, allergenic, toxic, or carcinogenic (Mueller et al. 2012; Duffy et al. 2014; 2017). In previous studies, two microbial stimulants were found to elicit a robust ex vivo immune response (measured via a pre-determined group of 46 inflammatory cytokines and chemokines) in a group of young, healthy volunteers (Duffy et al. 2014). In our study of ex vivo whole blood response among 102 workers at companies handling CNT/F, we observed that these microbial stimulants elicited a sufficient response, as measured by a group of 31 inflammatory biomarkers, to permit examination of potential associations of CNT/F exposure with immune function. The group of 15 excluded biomarkers (for lack of responsiveness in the TruCulture assay) includes most biomarkers that were cardiovascular in nature. Duffy et al. (2014) also reported unresponsiveness of BDNF, Eotaxin-1, Factor VII, ICAM-1, and MMP-3. The lack of responsiveness of the cardiovascular biomarkers is perhaps unsurprising, in an assay specifically challenging immune response. The biomarkers showing highest loading on the first two principal components for the present study were broadly similar to those in the study of healthy young volunteers (Fig. 2 of Duffy et al. 2014).
Two previous studies have assessed immune function with respect to age, sex, and genetics in humans and social status in other primates (Snyder-Mackler et al. 2016; Piasecka et al. 2018). To our knowledge, this is the first report of the association of a large number of occupational and environmental factors, as well as demographic and lifestyle factors, with functional immune response using the TruCulture assay. In our group of CNT/F workers, we observed (Fig. 2) that individual biomarker responses were most strongly associated with age (inversely), female sex (mostly inversely), and white/non-Hispanic race/ethnicity (mostly positively). Smoking pack-years showed little association, while alcohol consumption was positively associated, with several biomarkers (significantly, with IL-18, MCP-1, MIP-1β, and TNFR2). Of the medical factors, current cold and current use of anti-hypertensive medication were inversely associated, while NSAID use was positively associated, with immune response. The occupational exposure metrics most related (inversely) to immune response were current solvent exposure and the TEM-based SC concentrations (particularly the multi-day maximum metric, TEM-max). Self-reported ‘other’ nanomaterial exposure was positively associated with several biomarker ratios. In the principal component analysis, adjusting for important confounders, the structure count concentration metrics were significantly inversely associated with PC-1 (representing a weighted average of most of the biomarkers) and with PC-2 (representing a biomarker contrast). Of the other covariates, only age was significantly (and was inversely) associated with PC-1, indicating a generalized immune (e.g., innate and adaptive) effect, and female sex and solvent exposure were significantly (and inversely) associated with PC-2, suggesting a greater effect on adaptive immune responses. We found that the magnitude of decrease in the weighted sum of immune response biomarkers (i.e., PC-1) associated with a one-unit increase in the maximum multi-day SC concentration was similar to that associated with a ten-year increase in age. The significant inverse association of CNT/F SC concentration with both PC-1 and PC-2 was robust to the choice of covariates included in the model (data not shown).
Many of the cytokines included in this immune response assay have also been evaluated as circulating biomarkers, in both this and other worker populations exposed to CNT/F (Table 5). In general, the interleukins showed more responsiveness (i.e., significant associations with CNT/F metrics) in the TruCulture assay than in circulating blood. For example, ILs-2, −4, and −5 were found to be inversely associated with CNT/F in the former while largely undetectable in the latter (Beard et al. 2018). On the other hand, the TruCulture assay was less sensitive for the cardiovascular markers fibrinogen, ICAM-1, VCAM-1, vWF and for CRP than were found in studies of circulating biomarkers (Liou et al. 2012, Liao et al. 2014, Vlaanderen et al. 2017, Kuijpers et al. 2018). Interestingly, the inflammatory biomarkers in one study (Fatkhutdinova et al. 2016) showed consistent positive associations with CNT/F, whereas the associations following ex vivo stimulations were inverse in the present study (Table 5). These results complement those found in rodents exposed to welding fume, a pulmonary exposure that caused systemic inflammation and reduced responsiveness of circulating leukocytes challenged with a secondary stimulant (Erdely et al. 2011; 2014), which may suggest a general mechanism of pulmonary-derived systemic effects.
Table 5.
Comparison of associationsa between CNT/F exposure and blood biomarkers measured in previous studies and the current study (adapted from Beard et al. 2018).
| Liou et al. (2012) | Liao et al. (2014) | Fatkhutdinova et al. (2016) | Kuijpers et al. (2018); Vlaanderen et al. (2017) | Beard et al. 2018; Current study | |||
|---|---|---|---|---|---|---|---|
| Biomarkerb | Cross-sectional, circulating | Longitudinal, circulating | Cross-sectional, circulating | Cross-sectional, circulating | Repeated, circulating | Cross-sectional, circulating | Cross-sectional, stimulated |
| Inflammation | |||||||
| CRP | ↑ | ― | ― | ↑ | c | ||
| Eotaxin-1 | ― | ― | ↓ | c | |||
| GMCSF | ― | ↓ | |||||
| Haptoglobin | ― | ||||||
| IFNγ | ― | ↓ | |||||
| IL1α | ― | ||||||
| IL1β | ↑ | ― | ― | ||||
| IL1ra | ― | ― | |||||
| IL2 | ― | c | ↓ | ||||
| IL3 | ― | ||||||
| IL4 | ↑ | c | ↓ | ||||
| IL5 | ― | c | ↓ | ||||
| IL6 | ― | ― | ― | ― | c | ― | |
| IL7 | ― | ― | |||||
| IL8 | ― | ― | ↑ | ↓ | ― | ||
| IL10 | ↑ | ― | ↓ | ||||
| IL12p40 | ― | ||||||
| IL12p70 | ― | ||||||
| IL15 | ― | ||||||
| IL17 | ↓ | ||||||
| IL18 | ― | ||||||
| IL23 | ↓ | ||||||
| MIP1α | ― | ||||||
| MIP1β | ― | ||||||
| MMP9 | ― | ||||||
| MCP1 | ↓ | ― | |||||
| SCF | ― | ||||||
| TIMP1 | ― | ||||||
| TNFα | ↑ | ― | ― | c | ― | ||
| TNFβ | ― | ― | |||||
| TNFR2 | ― | ||||||
| Cardiovascular | |||||||
| Fibrinogen | ↑ | ― | ― | ― | ↓, ↑ | c | |
| ICAM-1 | ↑ | ― | ↑ | ↑ | ↑ | c | |
| VCAM-1 | ― | ↑ | ― | ― | ↑ | c | |
| VEGF | ― | ― | |||||
| vWF | ― | ― | ↓ | ― | |||
Abbreviations: CNT/F, carbon nanotube or nanofiber.
↓ indicates an inverse association, ↑ indicates a positive association, and ― indicates no association
See Suppl. Table 1 for definitions of biomarker abbreviations
Excluded from the analysis because biomarker was insufficiently responsive
It is well-established that a pulmonary exposure can result in adverse systemic effects including cardiovascular, immune, and neurological dysfunction. A primary mechanism leading to dysfunction is systemic inflammation/oxidative stress initiated by target organ responses with greater susceptibility in compromised populations. In this study of CNT/F workers, specifically when evaluating the TEM-based structure count concentrations as a metric of exposure, the ability of circulating leukocytes to respond to a secondary stimulus was inhibited with increasing exposure, suggesting underlying immunosuppression. The results do not specifically indicate disease but suggest increased susceptibility from decreased leukocyte function. As an example, welders exhibit increased frequency, severity, and duration of infection, together with indications of biomarkers associated with immunosuppression in cross-sectional or panel studies (IARC 2018). These epidemiological findings were supported by in vivo infectivity models with mechanistic studies suggesting reduced functionality of circulating and local immune cells (Zeidler-Erdely et al. 2012). In terms of TEM-based CNT/F exposure metrics, the integration of results of the 31 analytes available for pathway analysis indicated a generalized immune suppression with lack of specificity for any specific cell type, very similar to that observed for increasing age. Increased oxidative stress in the circulating leukocytes was a proposed mechanism for the reduced leukocyte responsiveness in the animal model of welding fume exposure (Erdely et al. 2014). Associations of systemic oxidative stress biomarkers with CNT/F exposure were observed for this specific cohort (Beard 2018) and in other human CNT studies (Lee 2015, Liou 2012, Liao 2014), providing a potential mechanistic link to the observed effects.
Among non-CNT/F occupational exposures, current solvent exposure was most strongly (and inversely) related to immune response. The solvents most frequently reported by this group of workers were alcohol (30%), acetone (25%), toluene (11%), and methyl ethyl ketone (10%), while 19% reported exposure to at least one other solvent type. A systematic review of toluene’s immunotoxicological effects (in the context of 20 high-interest chemicals) concluded that it showed evidence of immunosuppression based on cytokine responses (Veraldi et al. 2006). Pathway analysis revealed the reduced ability of circulating leukocytes to adequately produce cytokines in response to a secondary stimulus was suggestive of immunosuppression. For current solvent use, results were more specific to effects related to lymphocytes, consistent with other evaluations of solvent exposures (Savitz et al. 1997; Godderis et al. 2012). The pathway analysis was in agreement with the inverse association with current solvent use and PC2, which had positive associations with cytokines specific to adaptive immunity (e.g., IL-2, IL-4, IL-5, IL-17, etc.,). These results highlight the utility of using stimulants that challenge both the innate and adaptive immune response. Immunosuppressive responses have been noted from occupational exposure to trichloroethylene (Bassig et al. 2013; Walker et al. 2016), which was not used by any workers in our study. It is notable that all the small group of workers (n=16) with current exposure to ‘other’ (non-CNT/F) engineered nanomaterials were also currently exposed to solvents; however, these exposures showed opposite patterns of association with most individual biomarkers, which clouds interpretation of this finding.
Strengths of this study include the broad inclusion of many different types of CNT/F workers, a multi-metric and multi-day exposure assessment methodology for CNT/F, and use of a regression approach across a range of exposures, which may be more sensitive than comparing exposed to unexposed workers. We were able to thoroughly evaluate confounding potential (although little was in evidence). There are several limitations of this study: most prominently, the study is cross-sectional in nature, which greatly hampers causal interpretation of any of the exposures examined in this study. However, it is notable that few other covariates besides CNT/F exposures were significantly associated with the immune assay responsiveness. The sample size was relatively small (in particular, among women and Hispanic workers or those of races other than white) and exposures were low, which led to low power, as has been noted in the other studies of this same population (Beard et al. 2018; Schubauer-Berigan et al. 2018). The solvent exposure, medication use, and medical condition variables were all based on self-report; however, the reported solvent exposures were corroborated by industrial hygiene observations during the study, despite the lack of exposure measurement data. One potential limitation is whether assay responsiveness of the individual biomarkers (e.g., as exemplified by Duffy et al. 2014) was related to our findings: we observed no correlation between the mean untransformed biomarker ratio level and either loading onto the first principal component (of the standardized, transformed variable), or to the p value of the association of the transformed biomarker with CNT/F exposure (Spearman p-value = 0.65 and 0.63, respectively).
In conclusion, this novel approach suggests that greater sensitivity in evaluating immunological effects of exposure to CNT/F may be elicited by evaluating the response ex vivo of whole blood stimulated by external challenge agents. Ex vivo stimulation permits the evaluation of functional responses of potential underlying effects of exposure that traditional cytokine panels cannot measure. We found suggestive evidence that CNT/F exposure metrics (in particular, CNT/F structure counts) may be associated with a dampened responsiveness of the immune system, at a level roughly equivalent to the effects of increased age in this group of workers. We recommend that functional immune response assays be evaluated in other groups of similarly exposed workers to determine the generalizability of these findings.
Supplementary Material
Acknowledgements
The authors thank the companies and workers who participated in the study, as well as JD Beard, ME Birch, D Booher, M de Perio, V Burkel, J Clark, KL Dunn, DE Evans, J Fernback, Robert Mercer, and C Striley, and D Trout for assistance with field or laboratory work. We thank X Duan for her assistance in preparing Fig. 2. R Stratton of Myriad RBM coordinated laboratory analyses using the TruCulture assay.
Disclaimer and Funding
The findings and conclusions in this report are those of the authors and do not necessarily represent the official position of the National Institute for Occupational Safety and Health (NIOSH), Centers for Disease Control and Prevention (CDC). Mention of any company name or product does not constitute endorsement by NIOSH/CDC. This research was supported by an Interagency Agreement with the National Institute of Environmental Health Sciences (AES 12029-001) and by the NIOSH Nanotechnology Research Center.
Footnotes
Disclosure of interest
The authors report no conflict of interest.
For one large facility, due to logistical constraints, a subset of workers representing a range of tasks and exposure potential was invited.
AAT, A2Macro, B2M, BDNF, C3, CRP, Eotaxin, FactorVII, Fibrinogen, FRTN, ICAM, MMP3, RANTES, VCAM, VDBP
References
- Aragon MJ, Topper L, Tyler CR, Sanchez B, Zychowski K, Young T, Herbert G, et al. 2017. “Serum-Borne Bioactivity Caused by Pulmonary Multiwalled Carbon Nanotubes Induces Neuroinflammation via Blood-Brain Barrier Impairment.” Proceedings of the National Academy of Sciences 7;114: E1968–E1976. [DOI] [PMC free article] [PubMed] [Google Scholar]
- Aragon M, Erdely A, Bishop L, Salmen R, Weaver J, Liu J, Hall P, et al. 2016. “MMP-9-dependent Serum-Borne Bioactivity Caused by Multiwalled Carbon Nanotube Exposure Induces Vascular Dysfunction via the CD36 Scavenger Receptor.” Toxicological Sciences 150: 488–498. [DOI] [PMC free article] [PubMed] [Google Scholar]
- Bassig BA, Zhang L, Tang X, Vermeulen R, Shen M, Smith MT, Qiu C, et al. 2013. “Occupational Exposure to Trichloroethylene and Serum Concentrations of IL-6, IL-10, and TNF-alpha.” Environmental and Molecular Mutagenesis 54: 450–454. [DOI] [PMC free article] [PubMed] [Google Scholar]
- Beard JD, Erdely A, Dahm MM, de Perio MA, Birch ME, Evans DE, Fernback JE, et al. 2018. “Carbon Nanotube and Nanofiber Exposure and Sputum and Blood Biomarkers of Early Effect among U.S. Workers.” Environment International 116: 214–228. [DOI] [PMC free article] [PubMed] [Google Scholar]
- Birch ME, et al. , 2017. Analysis of Carbon Nanotubes and Nanofibers on Mixed Cellulose Ester Filters by Transmission Electron Microscopy Chapter CH in: NIOSH Manual of Analytical Methods (NMAM), 5th ed. U.S. Department of Health and Human Services, Centers for Disease Control and Prevention, National Institute for Occupational Safety and Health, DHHS (NIOSH), Cincinnati, OH. [Google Scholar]
- Dahm MM, Schubauer-Berigan MK, Evans DE, Birch ME, Bertke S, Beard JD, Erdely A, Fernback JE, Mercer RR, and Grinshpun SA. 2018. “Exposure Assessments for a Cross-Sectional Epidemiologic Study of US Carbon Nanotube and Nanofiber Workers.” International Journal of Hygiene and Environmental Health. 221: 429–440. [DOI] [PubMed] [Google Scholar]
- Duffy D, Rouilly V, Libri V, Hasan M, Beitz B, David M, Urriutia A, et al. 2014. “Functional Analysis via Standardized Whole-Blood Stimulation Systems Defines the Boundaries of a Healthy Immune Response to Complex Stimuli.” Immunity 40: 436–450. [DOI] [PubMed] [Google Scholar]
- Duffy D, Rouilly V, Braudeau C, Corbiere V, Djebali R, Ungeheuer MN, Josien R, et al. 2017. “Standardized Whole Blood Stimulation Improves Immunomonitoring of Induced Immune Responses in Multi-Center Study.” Clinical Immunology 183: 325–335. [DOI] [PubMed] [Google Scholar]
- Erdely A, Salmen-Muniz R, Liston A, Hulderman T, Zeidler-Erdely PC, Antonini JM, and Simeonova PP. 2011. “Relationship between Pulmonary and Systemic Markers of Exposure to Multiple Types of Welding Particulate Matter.” Toxicology 287: 153–159. [DOI] [PubMed] [Google Scholar]
- Erdely A, Antonini JM, Salmen-Muniz R, Liston A, Hulderman T, Simeonova PP, Kashon ML, et al. 2012. “Type I Interferon and Pattern Recognition Receptor Signaling Following Particulate Matter Inhalation.” Particle and Fibre Toxicology 9:25. [DOI] [PMC free article] [PubMed] [Google Scholar]
- Erdely A, Antonini JM, Young SH, Kashon ML, Gu JK, Hulderman T, Salmen R, Meighan T, Roberts JR, and Zeidler-Erdely PC PC. 2014. “Oxidative Stress and Reduced Responsiveness of Challenged Circulating Leukocytes Following Pulmonary Instillation of Metal-Rich Particulate Matter in Rats.” Particle and Fibre Toxicology 11:34. [DOI] [PMC free article] [PubMed] [Google Scholar]
- Erdely A, Hulderman T, Salmen R, Liston A, Zeidler-Erdely PC, Schwegler-Berry D, Castranova V, et al. 2009. “Cross-talk between Lung and Systemic Circulation during Carbon Nanotube Respiratory Exposure. Potential Biomarkers.” Nano Letters 9: 36–43. [DOI] [PubMed] [Google Scholar]
- Fatkhutdinova LM, Khaliullin TO, Vasil’yeva OL, Zalyalov RR, Mustafin IG, Kisin ER, Birch ME, Yanamala N, and Shvedova AA. 2016. “Fibrosis Biomarkers in Workers Exposed to MWCNTs.” Toxicology and Applied Pharmacology 299: 125–131. [DOI] [PMC free article] [PubMed] [Google Scholar]
- Godderis L, De Raedt K, Tabish AM, Poels K, Maertens N, De Ruyck K, Bulterys S, Thierens H, and Viaene MK. 2012. “Epigenetic Changes in Lymphocytes of Solvent-Exposed Individuals. Epigenomics 4: 269–277. [DOI] [PubMed] [Google Scholar]
- Grosse Y, Loomis D, Guyton KZ, Lauby-Secretan B, El Ghissassi F, Bouvard V, Benbrahim-Tallaa L, et al. 2014. “Carcinogenicity of Fluoro-Edenite, Silicon Carbide Fibres and Whiskers, and Carbon Nanotubes.” The Lancet Oncology 15: 1427–1428. [DOI] [PubMed] [Google Scholar]
- International Agency for Research on Cancer (IARC). 2018. Volume 118: welding, indium tin oxide, molybdenum trioxide IARC Working Group; Lyon, France; 21-28 March, 2017 IARC Monogr Eval Carcinog Risks Hum. 312 pp. [PMC free article] [PubMed] [Google Scholar]
- Kasai T, Umeda Y, Ohnishi M, Mine T, Kondo H, Takeuchi T, Matsumoto M, and Fukushima S. 2016. “Lung Carcinogenicity of Inhaled Multi-Walled Carbon Nanotube in Rats.” Particle and Fibre Toxicology 13: 53. [DOI] [PMC free article] [PubMed] [Google Scholar]
- Kuijpers E, Pronk A, Kleeman R, Vlaanderen J, Lan Q, Rothman N, Silverman D, Hoet P, Godderis L, and Vermeulen R. 2018. “Cardiovascular Effects among Workers Exposed to Multiwalled Carbon Nanotubes.” Occupational and Environmental Medicine 75: 351–358. [DOI] [PubMed] [Google Scholar]
- Lam CW, James JT, McCluskey R, Arepalli S, Hunter RL. 2006. “A Review of Carbon Nanotube Toxicity and Assessment of Potential Occupational and Environmental Health Risks.” Critical Reviews in Toxicology 36: 189–217. [DOI] [PubMed] [Google Scholar]
- Lee JS, Choi YC, Sin JH, Lee JH, Lee Y, Park SY, Baek JE, Park JD, Ahn K, and Yu IJ. 2015. “Health Surveillance Study of Workers Who Manufacture Multi-Walled Carbon Nanotubes.” Nanotoxicology 9: 802–811. [DOI] [PubMed] [Google Scholar]
- Liao HY, Chung YT, Lai CH, Wang SL, Chiang HC, Li LA, Tsou TC, et al. 2014. “Six-Month Follow-Up Study of Health Markers of Nanomaterials among Workers Handling Engineered Nanomaterials.” Nanotoxicology 8:100–110. [DOI] [PubMed] [Google Scholar]
- Liou SH, Tsou TC, Wang SL, Li LA, Chiang HC, Li WF, Lin PP, et al. 2012. “Epidemiological Study of Health Hazards among Workers Handling Engineered Nanomaterials.” Journal of Nanoparticle Research 4: 878. [Google Scholar]
- Snyder-Mackler N, Sanz J, Kohn JN, Brinkworth JF, Morrow S, Shaver AO, Grenier JC, et al. 2016. “Social Status Alters Immune Regulation and Response to Infection in Macaques.” Science 354(6315): 1041–1045. [DOI] [PMC free article] [PubMed] [Google Scholar]
- Mitchell LA, Lauer FT, Burchiel SW, McDonald JD. 2009. “Mechanisms for How Inhaled Multiwalled Carbon Nanotubes Suppress Systemic Immune Function in Mice.” Nature Nanotechnology 4: 451–456. [DOI] [PMC free article] [PubMed] [Google Scholar]
- Mueller SC, Marz R, Schmolz M, and Drewelow B. 2012. “Intraindividual Long Term Stability and Response Corridors of Cytokines in Healthy Volunteers Detected by a Standardized Whole-Blood Culture System for Bedside Application.” BMC Medical Research Methodology 12: 112. [DOI] [PMC free article] [PubMed] [Google Scholar]
- Neter J, Kutner MH, Nachtsheim CJ, and Wasserman W. 1996. Applied Linear Statistical Models. 4th ed. Chicago: Irwin. [Google Scholar]
- National Institute for Occupational Safety and Health (NIOSH). 2006a. Manual of Analytical Methods. Method 5040 Diesel Particulate Matter (as Elemental Carbon) In: Schlecht PC, O’Connor PF (Eds.), NIOSH Method of Analytical Methods, 4th ed. Department of Health and Human Services, Public Health Service, Centers for Disease Control and Prevention, National Institute for Occupational Safety and Health. DHHS (NIOSH), Cincinnati, OH: Publication 94–113 Issue 1. [Google Scholar]
- National Institute for Occupational Safety and Health (NIOSH). 2006b. Manual of Analytical Methods. Method 7402 Asbestos by TEM In: Schlecht PC, O’Connor PF (Eds.), NIOSH Method of Analytical Methods, 4th ed. Department of Health and Human Services, Public Health Service, Centers for Disease Control and Prevention, National Institute for Occupational Safety and Health. DHHS (NIOSH), Cincinnati, OH: Publication 94–113 Issue 1. [Google Scholar]
- Oberdorster G, Castranova V, Asgharian B, and Sayre P. 2015. “Inhalation Exposure to Carbon Nanotubes (Cnt) and Carbon Nanofibers (Cnf): Methodology and Dosimetry.” Journal of Toxicology and Environmental Health B Critical Reviews 18: 121−212. [DOI] [PMC free article] [PubMed] [Google Scholar]
- Piasecka B, Duffy D, Urrutia A, Quach H, Patin E, Posseme C, Bergstedt J, et al. 2018. “Distinctive Roles of Age, Sex, and Genetics in Shaping Transcriptional Variation of Human Immune Responses to Microbial Challenges.” Proceedings of the National Academy of Sciences U S A. 115: E488–E497. [DOI] [PMC free article] [PubMed] [Google Scholar]
- Sargent LM, Porter DW, Staska LM, Hubbs AF, Lowry DT, Battelli L, Siegrist KJ, et al. 2014. “Promotion of Lung Adenocarcinoma Following Inhalation Exposure to Multi-Walled Carbon Nanotubes.” Particle and Fibre Toxicology 11:3. [DOI] [PMC free article] [PubMed] [Google Scholar]
- Savitz DA, and Andrews KW. 1997. “Review of Epidemiologic Evidence on Benzene and Lymphatic and Hematopoietic Cancers.” American Journal of Industrial Medicine 31: 287–295. [DOI] [PubMed] [Google Scholar]
- Schubauer-Berigan MK, Dahm MM, Erdely A, Beard JD, Birch ME, Evans DE, Fernback JE, et al. 2018. “Association of Pulmonary, Cardiovascular, and Hematologic Metrics with Carbon Nanotube and Nanofiber Exposure among U.S. Workers: a Cross-Sectional Study.” Particle and Fibre Toxicology 15: 22. [DOI] [PMC free article] [PubMed] [Google Scholar]
- Stapleton PA, Minarchick VC, Cumpston AM, McKinney W, Chen BT, Sager TM, Frazer DG, et al. 2012. “Impairment of Coronary Arteriolar Endothelium-Dependent Dilation after Multi-Walled Carbon Nanotube Inhalation: a Time-course Study.” International Journal of Molecular Science 13: 13781–13803. [DOI] [PMC free article] [PubMed] [Google Scholar]
- Veraldi A, Costantini AS, Bolejack V, Miligi L, Vineis V, van Loveren H. 2006. “Immunotoxic Effects of Chemicals: a Matrix for Occupational and Environmental Epidemiologic Studies.” American Journal of Industrial Medicine 49: 1046–1055. [DOI] [PubMed] [Google Scholar]
- Vlaanderen J, Pronk A, Rothman N, Hildesheim A, Silverman D, Dean Hosgood H, Spaan S, et al. 2017. “A Cross-Sectional Study of Changes in Markers of Immunological Effects and Lung Health Due to Exposure to Multi-Walled Carbon Nanotubes.” Nanotoxicology 11: 395–404. [DOI] [PubMed] [Google Scholar]
- Walker DI, Uppal K, Zhang L, Vermeulen R, Smith M, Hu W, Purdue MP, et al. 2016. “High-Resolution Metabolomics of Occupational Exposure to Trichloroethylene.” International Journal of Epidemiology 45: 1517–1527. [DOI] [PMC free article] [PubMed] [Google Scholar]
- Zeidler-Erdely PC, Erdely A, Antonini JM. Immunotoxicology of arc welding fume: worker and experimental animal studies. J Immunotoxicol. 2012. Oct-Dec;9(4):411–25. [DOI] [PMC free article] [PubMed] [Google Scholar]
Associated Data
This section collects any data citations, data availability statements, or supplementary materials included in this article.