Abstract
A fundamental understanding of confined water is crucial for developing selective ion transport and water purification membranes, yet the roles of nanopore geometry and functionality on confined water dynamics remain unresolved. We report the synthesis of perdeuterated ionic alkylsulfonate amphiphiles and their water-induced self-assembly into lyotropic liquid crystal (LLC) mesophases with well-defined, convex sulfonate-lined nanopores. Quasielastic neutron scattering (QENS) measurements demonstrate that the water self-diffusion coefficients within these sulfonate-lined convex nanopores depend on the hydration level and amphiphile counterion identity (H+, K+, NMe4+). The consistency of the observed counterion-dependent water dynamics with those of carboxylate LLCs is rationalized on the basis of similarities in the counterion spatial distributions in the water-filled channels, which we deduce from electron density maps derived from small-angle X-ray scattering (SAXS) analyses. These findings indicate that water diffusion is systematically faster in sulfonate-lined nanopores as compared to carboxylate-lined pores due to weaker water interactions with the softer and more hydrophobic–SO3− functionalities. These molecular-level insights into the relationships between convex pore wall chemical functionalities, hydrated counterions, and confined water diffusion may inform future development of new nanoporous media.
Graphical Abstract
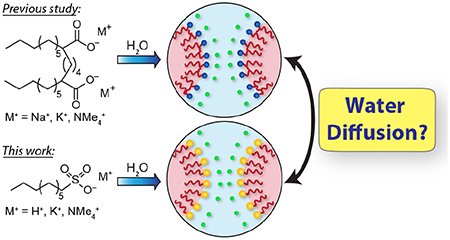
Introduction
Myriad useful and anomalous properties of bulk water stem from its unique hydrogen-bonding network,1, 2 yet confinement between interfaces dramatically alters both water structure3 and dynamics.4–6 Understanding how water dynamics are affected by the molecular details of its confining matrix is a central issue in optimizing the selective transport of ions or water through porous polymer membranes.7–10 For example, sulfonated ionomers have emerged as attractive materials for both proton exchange membranes (PEMs) and water purification media in spite of their apparently orthogonal performance requirements. PEMs such as Nafion11 and other sulfonated ionomers12, 13 must facilitate rapid water-mediated H+ conductivity, while limiting water diffusivity through relatively large aqueous nanopores (~5 nm diameter)14 lined with superacidic functional groups. Conversely, structurally similar sulfonate ionomers9, 15, 16 such as Nexar17 used for water purification membranes must permit rapid water transport while simultaneously inhibiting ionic mobility. Numerous studies have investigated water dynamics within sulfonate ionomer membranes,7, 18–24 yet the variable pore sizes and ill-defined pore connectivities11, 14, 25, 26 of these materials obscure definitive correlations between the effects of pore chemistry and geometry on water dynamics and ultimate membrane performance.27
Lyotropic liquid crystal (LLCs), which derive from water-driven self-assembly of molecular amphiphiles, feature structurally well-defined and nearly monodisperse nanopores of tunable diameters (d ~ 1–5 nm) lined with chemical functionalities specified by the surfactant headgroups (Figure 1).28 These attributes render them attractive media for fundamental studies of confined water29, 30 and practical membrane applications.31–33 The long-range crystallographic order of LLCs enables unambiguous identification of their supramolecular structures by small-angle X-ray scattering (SAXS),34 the details of which may be visualized by reconstructing real-space electron density maps.30, 35, 36 The groups of Gin37–40 and Osuji41–43 have demonstrated scalable fabrication of LLC filtration membranes with <2 nm pores, yet fundamental comparisons between the filtration performance of these various membranes are obscured by differences in pore geometries (concave versus convex) and pore functionalities, which include imidazolium,37 alkylphosphonium,38, 39 alkylammonium,40 sulfonate,41 and carboxylate42, 43 moieties. Recent work by Jackson et al. demonstrated higher water-mediated H+ conductivities of alkylsulfonic acid LLCs in convex as opposed to concave ~2 nm pores, with conductivities of convex LLCs comparable to fully-hydrated Nafion (~5 nm concave pores) under similar conditions.44 Deeper insights into this surprising observation motivate detailed studies of the roles of pore structure and chemical functionalities on confined water dynamics reported here.
Figure 1.
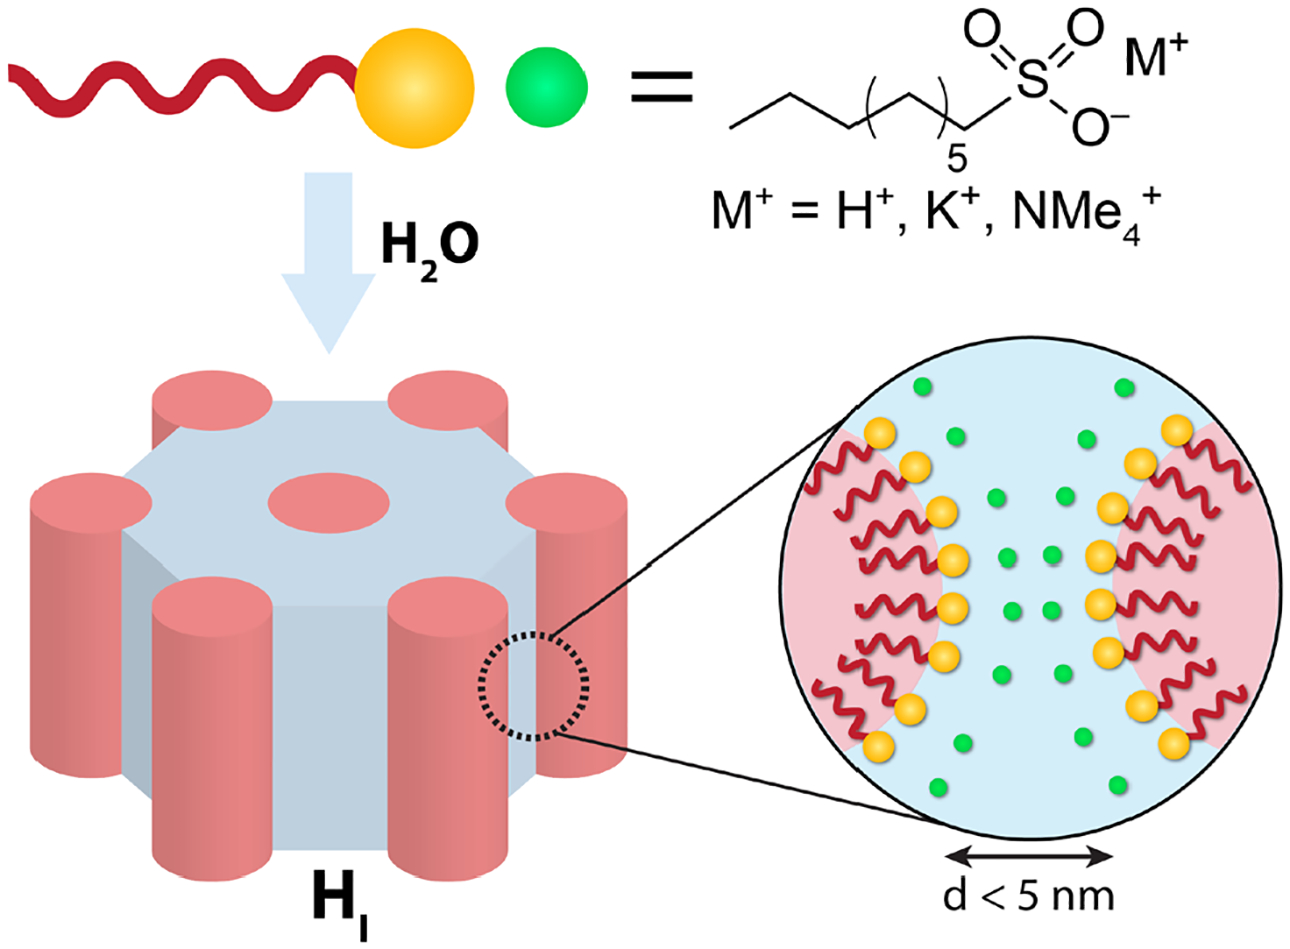
Water–induced self–assembly of perdeuterated, ionic n-alkylsulfonate surfactants yields LLCs such as hexagonally-packed cylinders (HI) with well-defined convex aqueous nanochannels, which are lined with −SO3− headgroup functionalities and filled with hydrated surfactant counterions. The nanoscopic dimensions and curvatures of the aqueous nanochannels depend on both hydration (w0) and surfactant molecular structure.
Despite various theoretical and experimental investigations, the effect of LLC interfacial chemical functionalities on confined water diffusion remains unclear. McDaniel et al.6 used molecular dynamics (MD) simulations of gemini (“twin head-twin tail”) disodium dicarboxylate and bis(sulfonate) surfactant LLCs to show that water diffusion depends most sensitively on pore diameter (which is coupled to amphiphile hydration in LLCs), followed by amphiphile headgroup identity, and then pore interfacial curvature. They observed somewhat slower water diffusion in sulfonate-lined pores than in their carboxylated counterparts, although their simulations did not consider differences in headgroup-counterion association and their consequences for counterion distribution within the pores. Subsequent MD simulations45 and experiments30 explored the roles of surfactant hydration and counterion identity (Na+, K+, NMe4+) on water dynamics in the convex nanopores of gemini dicarboxylate LLCs. These studies established that counterion identity and their spatial distribution within an ionic nanochannel strongly impact water diffusion. In contrast to earlier predictions by McDaniel et al.,6 water diffusion in dicarboxylate LLCs is much slower that that reported for convex perfluorooctanesulfonic acid (PFOS) LLCs.29 This discrepancy, which could be ascribed to the inexact nature of this comparison due to differences in the PFOS proton counterion or its fluorinated surfactant tail, motivates a careful assessment of the relationship between headgroup chemistry, counterion identity, and confined water diffusion.
Herein, we measure directly the water self-diffusion coefficients in the convex nanopores of alkylsulfonate LLCs as a function of their hydration levels and counterion identities. We first describe the synthesis of new perdeuterated sulfonate amphiphiles with varied counterions (H+, K+, NMe4+) and assess their LLC phase behaviors by SAXS. Using quasielastic neutron scattering (QENS), we measure the dynamic structure factor S(q,E), from which we isolate contributions from water translational dynamics to determine the water self-diffusion coefficient <D>. These data demonstrate that water diffusivity depends primarily on the hydration level of the LLC, with a weaker dependence on counterion identity such that at all hydrations. At a fixed hydration and counterion identity, sulfonated LLCs exhibit larger <D> values than carboxylate LLCs, in discord with simulations.6 However, the counterion-dependent trend in water diffusion concurs with that experimentally determined for carboxylate LLCs with similar pore diameters.30 We rationalize these findings in terms of the similarities in the counterion distributions in carboxylate and sulfonate LLCs based on SAXS analyses, which implies that difference in water diffusivity stem from differences in water-carboxylate versus water-sulfonate pore wall interactions. We also find that water diffusion in LLCs with convex nanopores is more sensitive to pore chemistry than previously reported for concave confinement,46 suggesting the importance of nanopore geometry in future design of nanoporous media.
Experimental Methods
Materials and Methods.
1-bromononane–d19 (98% D) and tetramethylammonium–d12 hydroxide pentahydrate (N(CD3)4OD•5D2O, 98% D), were purchased from CDN Isotopes (Quebec, Canada) and Cambridge Isotope Laboratories (Cambridge, MA), respectively. High purity D2O (99.9% D), reagent grade solvents, and all other materials were purchased from Sigma-Aldrich (Milwaukee, WI) and used as received unless otherwise noted. Type I ultra-pure water was obtained from a Thermo Scientific Barnstead NANOpure™ system (18.2 MΩ resistance) and sparged with N2(g) prior to use. High purity niobium foil (0.025 ± 0.015 mm thick, 99.8%) was purchased from Alfa Aesar.
A Bruker Avance III HD AM-400 with a BBO SmartProbe was used to record 2H NMR spectra and 13C NMR spectra were recorded on a Bruker Avance III HD 500 MHz spectrometer with a TCI cryoprobe housed in the LeClaire-Dow Instrumentation Facility at the University of Minnesota-Twin Cities. The 2H spectra were recorded in the CH3OH and referenced relative to the residual deuterated solvent peak, while the 13C spectra were recorded in CD3OD and referenced to the solvent peak. Atlantic Microlab, Inc. (Norcross, GA, USA) performed combustion elemental analyses (C, H, N, and S).
Deuterated Surfactant Synthesis.
Detailed synthetic procedures for perdeuterated alkylsulfonate amphiphiles are given in the Supporting Information and are briefly summarized here. Adapting an synthetic approach,44 Sodium 1-nonanesulfonate-d19 (SO3Nad) was obtained by refluxing 1-bromononane-d19 with Na2SO3(aq) with EtOH, followed by recrystallization from H2O. Acidification of SO3Nad with HCl(g) in Et2O yielded 1-nonanesulfonic acid (SO3Hd). Safety Note: HCl(g) and SO3Hd are both extremely corrosive and must be handled in a fume hood with adequate ventilation with appropriate personal protective equipment, including nitrile gloves to mitigate skin exposure. SO3Hd was subsequently deprotonated using either K2CO3(s) or N(CD3)4OH(aq) to afford the perdeuterated SO3Kd and SO3NMe4d amphiphiles. These surfactants were azeotropically freeze-dried from C6H6 to minimize the residual H2O content. Isolated surfactant hydrates were subjected to elemental analyses to confirm their elemental purities and to estimate residual H2O content. Surfactants used to prepare fully deuterated LLC samples (deuterated surfactant in D2O) for QENS background subtraction were subsequently freeze-dried from D2O to minimize incoherent scattering from residual H2O. Elemental analyses data are provided below, wherein deuterium is analyzed as hydrogen.
Anal. Calc. for SO3Hd: C9D19SO3H•0.4H2O: C, 46.07; H, 8.95; S, 13.67; Found: C, 46.08; H, 9.20; S, 14.06. For the background sample: Anal. Calc.: C9D19SO3H•0.72 D2O: C, 44.96; H, 9.00; S, 13.34; Found: C, 44.96; H, 8.91; S, 13.74.
Anal. Calc. for SO3Kd: C9D19SO3K•0.2H2O: C, 40.16; H, 7.26; S, 11.91. Found: C, 40.08; H, 7.11; S, 11.96. For the background sample: Anal. Calc.: C9D19SO3K•0.2 D2O: C, 40.20; H, 7.26; S, 11.92; Found: C, 40.20; H, 7.14; S, 12.03.
Anal. Calc. for SO3NMe4d: C13D31SO3N•0.38H2O: C, 48.87; H, 10.01; S, 10.03; N, 4.38. Found: C, 48.47; H, 9.69; S, 10.53; N, 3.99. For the background sample: Anal. Calc.: C13D31SO3N•0 D2O: C, 49.94; H, 9.98; S, 10.25; N, 4.48. Found: C, 49.91; H, 9.86; S, 10.49; N, 4.24.
Surfactant LLC Sample Preparation.
LLC samples were prepared by massing ~600 mg of surfactant hydrate into 1 dram vials in an argon-filled glovebox to mitigate adventitious atmospheric moisture uptake. For each surfactant and hydration level, two sets of QENS samples were prepared outside of the glovebox: (1) a sample hydrated with H2O for data collection and (2) a sample hydrated with D2O for background subtraction. By explicitly incorporating the residual water content determined by elemental analysis, we prepared LLC samples of a desired headgroup hydration number
by massing precise amounts of Type I ultrapure H2O or high-purity D2O. Samples were homogenized using iterative cycles of high-speed centrifugation (4996 × g) and hand-mixing with a spatula. As prepared LLC samples were stored in Teflon-capped vials sealed with Parafilm to avoid dehydration (a decrease in w0) and allowed to rest at least 24 h prior to X-ray analyses to relax residual stresses in the materials.
Small-angle X-ray Scattering (SAXS).
Both laboratory source and synchrotron SAXS were used to determine the morphologies of all LLC samples. We used lab-source SAXS analyses to confirm each LLC sample morphology prior to loading them into sealed sample holders for subsequent QENS analyses (vide infra). The Supporting Information explicitly provides these SAXS analysis conditions. Small portions of each LLC sample were set aside for high-resolution SAXS studies at the 12-ID-B beamline of the Advanced Photon Source (APS; Argonne, IL, U.S.A.) using a beam energy of 14.00 keV (λ = 0.8856 Å) and a 2.027 m sample-to-detector distance. LLC samples were hermetically sealed in alodined aluminum DSC pans and exposed for 0.1 s at 298 K. Small- and wide-angle X-ray scattering patterns were recorded simultaneously on a Pilatus 2M detector (25.4 cm × 28.9 cm rectangular area) with 1475 × 1679 pixel resolution. The acquired SAXS patterns were calibrated using a silver behenate standard (d100 = 58.38 Å) and azimuthally integrated to generate I(q) v. q intensity profiles using the DataSqueeze47 software package. Morphological assignments were made by comparing observed peak positions with those calculated for a specified unit cell symmetry. Full indexing for the somewhat unusual SO3Kd ribbon (RI) phase at w0 = 6 is given in Table S1. Safety Note: Institutional radiation safety protocols were followed to mitigate exposure to X-rays, an ionizing radiation that presents significant safety hazards.
Real-space Electron Density Reconstructions.
Detailed procedures have been reported previously30, 35, 36, 44, 48–50 and are summarized here. We used the JANA200651 software program to perform a Le Bail refinement of the synchrotron SAXS data in order to extract the structure factor intensities (|Fh|) for each scattering peak in the 1D-SAXS I(2θ) v. 2θ profile. These |Fh| values were used as inputs for the charge-flipping algorithm SUPERFLIP52, 53 to generate real-space electron density contour maps, which were visualized and analyzed with the VESTA software package54 to estimate the aqueous channel diameter and counterion distributions therein. Further details, including the figures of merit for the electron density reconstructions (Table S2) and SUPERFLIP input files, are provided in the Supporting Information.
Quasielastic Neutron Scattering (QENS).
Perdeuterated sulfonate LLCs were loaded into instrument-specific aluminum flat plate cells (3 cm × 5 cm) with a sample thickness of 100 μm to ensure ≥ 90% neutron beam transmission, so multiple-scattering effects could be neglected. SO3Hd LLCs were enclosed in niobium foil packets to prevent sample cell corrosion by these highly acidic LLCs. Niobium foil was chosen for its high corrosion resistance55 and low neutron incoherent scattering cross-section.56 Aluminum sample cells were then sealed using an indium wire O-ring under hydraulic compression with a force of 1000 psi at 25°C and bolted shut.
QENS data were collected on the Backscattering Spectrometer (BASIS, BL-2) at the Spallation Neutron Source (SNS), Oak Ridge National Laboratory (Oak Ridge, USA). Safety Note: All National Laboratory Radiation safety protocols were followed to mitigate exposure to neutron radiation, which presents significant human health hazards. We used the same data collection and analysis procedures to those described in an earlier study.30 The incident neutron wavelength was set to λ = 6.274 Å, resulting in a range of accessible energy transfers −120 < E < 120 μeV with 3.5 μeV resolution. QENS data were collected between 0.2 ≤ q ≤ 2.0 Å−1 and binned in 0.2 Å−1 increments, with the reported q-values corresponding to the middle of these binned groups. Data for each sample prepared using H2O were first collected at 298 K to measure Sexpt(q,E) and then at 50 K to obtain the sample-dependent instrument resolution function, R(q,E). Perdeuterated background LLCs samples prepared using D2O were only measured at 298 K to obtain Sbackground(q,E). Data acquisition times were set to ~6 h per scan to achieve data of good statistical quality with the available beam power.
Per our earlier report,30 vanadium-normalized QENS spectra were fit with the Mantid software suite (http://dx.doi.org/10.5286/software/mantid)57 using:
| (1) |
S(q,E) is the QENS spectra for the H2O-hydrated LLC. The elastic scattering intensity δ(E) is weighted by the function a(q), while the quasielastic scattering intensity modeled by the Fourier transform of a Kohlrausch-Williams-Watts (KWW) stretched exponential function is weighted by the function A(q). The elastic and quasielastic contributions were convoluted with the resolution function R(q,E). Sbackground(q,E) is weighted by a scaling factor bw and C(q) is a linear background term. A sequential fit to Eq. (1) at each q-value was first performed to obtain initial values for the six fitting parameters bw(q), C(q), a(q), A(q), τ(q), and β(q). The values from the sequential fit were only used as inputs for a global, simultaneous fit of all data 0.2 Å−1 ≤ q ≤ 1.4 Å−1 and −120 < E < 120 μeV, in which β and bw were treated as a q-independent variables that were optimized over the entire q-range. Note that several other studies of confined water dynamics have treated β as a q-independent variable.4, 10, 46, 58 As noted in our previous study,30 we were unable to achieve good global fits to the data when including q > 1.4 Å−1 due to substantial attenuation of S(q,E) caused by the flat-plate sample cell. Table S3 gives representative values obtained from a global fit to Eq. (1) for each system. The optimized values for bw approximately correspond to the mass ratio of the H2O LLC QENS sample and the D2O LLC background sample, as expected. While treating bw as a q-dependent variable yields slightly lower χ2 values in the global fit, the water self-diffusion coefficients obtained by both methods are within the estimated error of our fitting protocol. We validated our treatment of β as a q-independent variable by performing a sequential fit to determine β(q) with bw fixed at its optimized value. Consistent with previous studies of confined water dynamics,5, 10, 30, 46, 58 the β-values are relatively q-independent with relative standard deviations σβ/βavg < 12% (Figure S1). Note that using the β-values from Figure S1 and the corresponding τ-values, we recover the same water self-diffusion coefficients within our estimated uncertainty.
We performed five separate global fits of the QENS data to Eq. (1) using different initial inputs and averaged the resulting water self-diffusion coefficients. The relative standard deviations were < 10%, which we take to be the fractional error of our fitting protocol.
We additionally performed elastic intensity scans on both cooling and heating SO3NMe4d at w0 = 6. Note that the heating ramp was performed after holding this sample at 50 K for 6 h to acquire the instrument resolution function R(q,E). Data were collected at 2 K increments over the range 298 K ≥ T ≥ 236 K and at T = 200, 170, 140, 100, and 50 K with a set cooling rate of 5 K/min and temperature control ±1 K. Samples were equilibrated for 2 min after reaching the target temperature and data was acquired for 5 min. The proton mean-squared displacement () was determined using the q-dependent elastic intensity measured over the full q-range (0.04 Å−2 < q2 < 4.00 Å−2) per Equation 2:
| (2) |
where I(q) is the elastic intensity at a given temperature normalized by the elastic intensity obtained at 50 K, I0(q), where protons are completely immobile within the BASIS time window.
Results and Analysis
QENS is a well-established incoherent neutron scattering technique that measures μeV to meV energy transfers resulting from atomic motion over a range of scattering wavevectors. The resulting dynamic structure factor S(q,E) contains contributions from translational, rotational, and vibrational dynamics. While the anomalously large incoherent scattering cross-section of 1H enables direct measurement of confined water dynamics in inorganic structures,4, 5, 46, 58, 59 studies of hydrated soft materials typically require a perdeuterated confining matrix to isolate the quasielastic signal of water.30, 60, 61
Amphiphile Synthesis and LLC Phase Behavior.
To minimize contributions of surfactant dynamics to the desired S(q,E) for H2O from QENS measurements, perdeuterated single-tail, ionic sulfonate amphiphiles were synthesized per the route depicted in Scheme 1. Sodium 1-nonanesulfonate-d19 was obtained as a highly crystalline solid from the reaction of Na2SO3(aq) with 1-bromononane-d19 in EtOH (see Supporting Information for detailed synthetic procedures). Protonation of this reaction product with HCl(g) in diethyl ether yielded nonanesulfonic acid (SO3Hd) in high yields. Deprotonation of SO3Hd with either K2CO3(s) or N(CD3)4OH(aq) in CH3OH yielded the perdeuterated sulfonate salts SO3Kd and SO3NMe4d, respectively. After azeotropic freeze-drying from benzene, deuterated amphiphiles were isolated as hydrates and subjected to elemental analysis to confirm their purities. The reported deviation between the calculated elemental composition for SO3NMe4d and that observed in elemental analysis, as well as the 2H NMR integration of the NMe4+ deuteron peak relative to that of the terminal methyl group (see Supporting Information for 2H NMR data), are consistent with ~90% deprotonation. Accounting for the residual water content estimated from elemental analysis, we prepared LLCs with targeted headgroup hydration levels, w0 = (total moles water)/(moles −SO3− headgroup) per the approach described in Supporting Information.
Scheme 1.
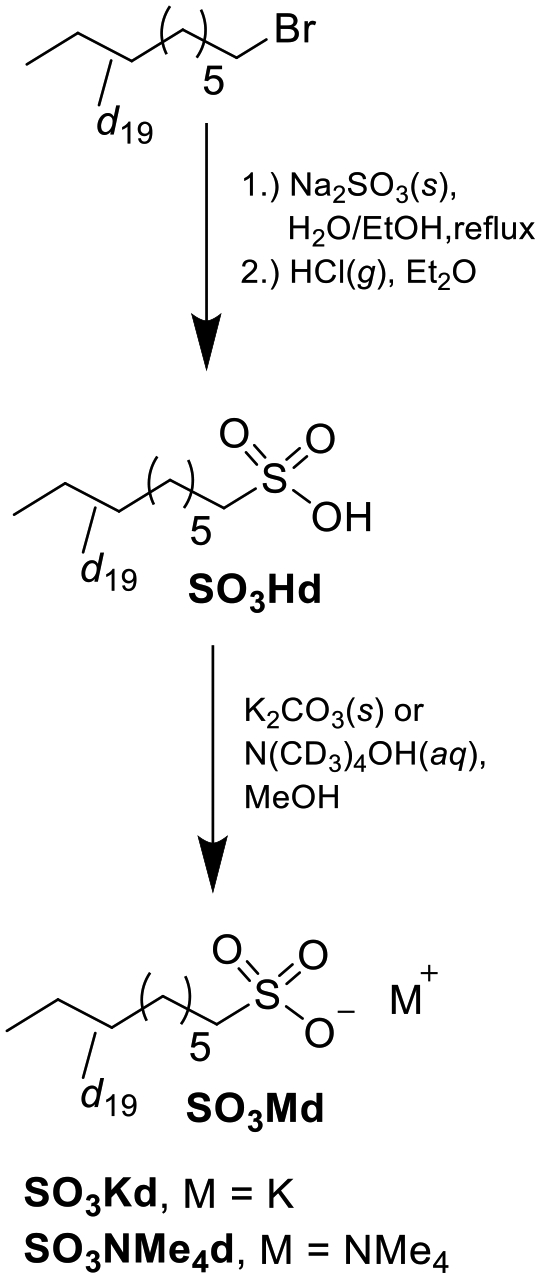
Synthesis of Perdeuterated Alkylsulfonate Amphiphiles (SO3Md) for QENS Studies
We used synchrotron SAXS to determine the supramolecular LLC morphologies of SO3Hd (Figure 2A), SO3NMe4d (Figure 2B), and SO3Kd (Figure 2C) prior to QENS analyses. Unless otherwise noted, sulfonate amphiphiles formed structurally identical LLC mesophases on hydration with H2O or D2O. At w0 = 6.5 in H2O, SO3Hd forms stiff, non-birefringent double gyroid (G) phase (Ia3(−)d symmetry) LLCs with unit cell parameter a = 71.2 Å (q* = 0.0882 Å−1).34 However, SO3Hd LLCs formed at the same w0 in D2O are soft and birefringent lamellar (Lα) phases with interlayer spacings of 27.8 Å. SAXS analyses of birefringent, stringy SO3Hd LLCs at w0 = 15 indicate formation of a hexagonally-packed cylindrical micelles (HI) phase (p6mm symmetry) with center-to-center distances of 37.8 Å. The birefringent SO3NMe4d LLCs at w0 = 6 exhibit SAXS signatures for Lα + HI phase coexistence with Lα spacings of 23.3 Å and HI intercylinder distances of 33.0 Å. Further hydration of SO3NMe4d to w0 = 12 and 15 affords stiff, non-birefringent A15 micellar packings (Pn3(−)n symmetry)48 with unit cell parameters a = 73.0 Å and 74.2 Å, respectively. The SAXS patterns of birefringent SO3Kd LLCs at w0 = 6 reveal a centered rectangular 2D packing of cylindrical micelles62, 63 (RI, C2mm symmetry, see Table S1 for detailed indexing) with a = 28.5 Å and b = 86.6 Å and b/a ~ 3.0. We observe HI phase LLCs for SO3K at w0 = 15 in H2O with micelle center-to-center distances of 36.7 Å (q* = 0.198 Å−1), while the same LLC hydrated with D2O yields a fluid isotropic (L1) phase with a broad correlation peak at q* = 0.198 Å−1. In all cases, the general phase progression towards more highly curved hydrophobic interfaces with increasing w0 demonstrates that these are Type I or ‘normal’ LLCs, in which water is confined within convex nanopores lined with sulfonate chemical functionalities (Figure 1).
Figure 2.
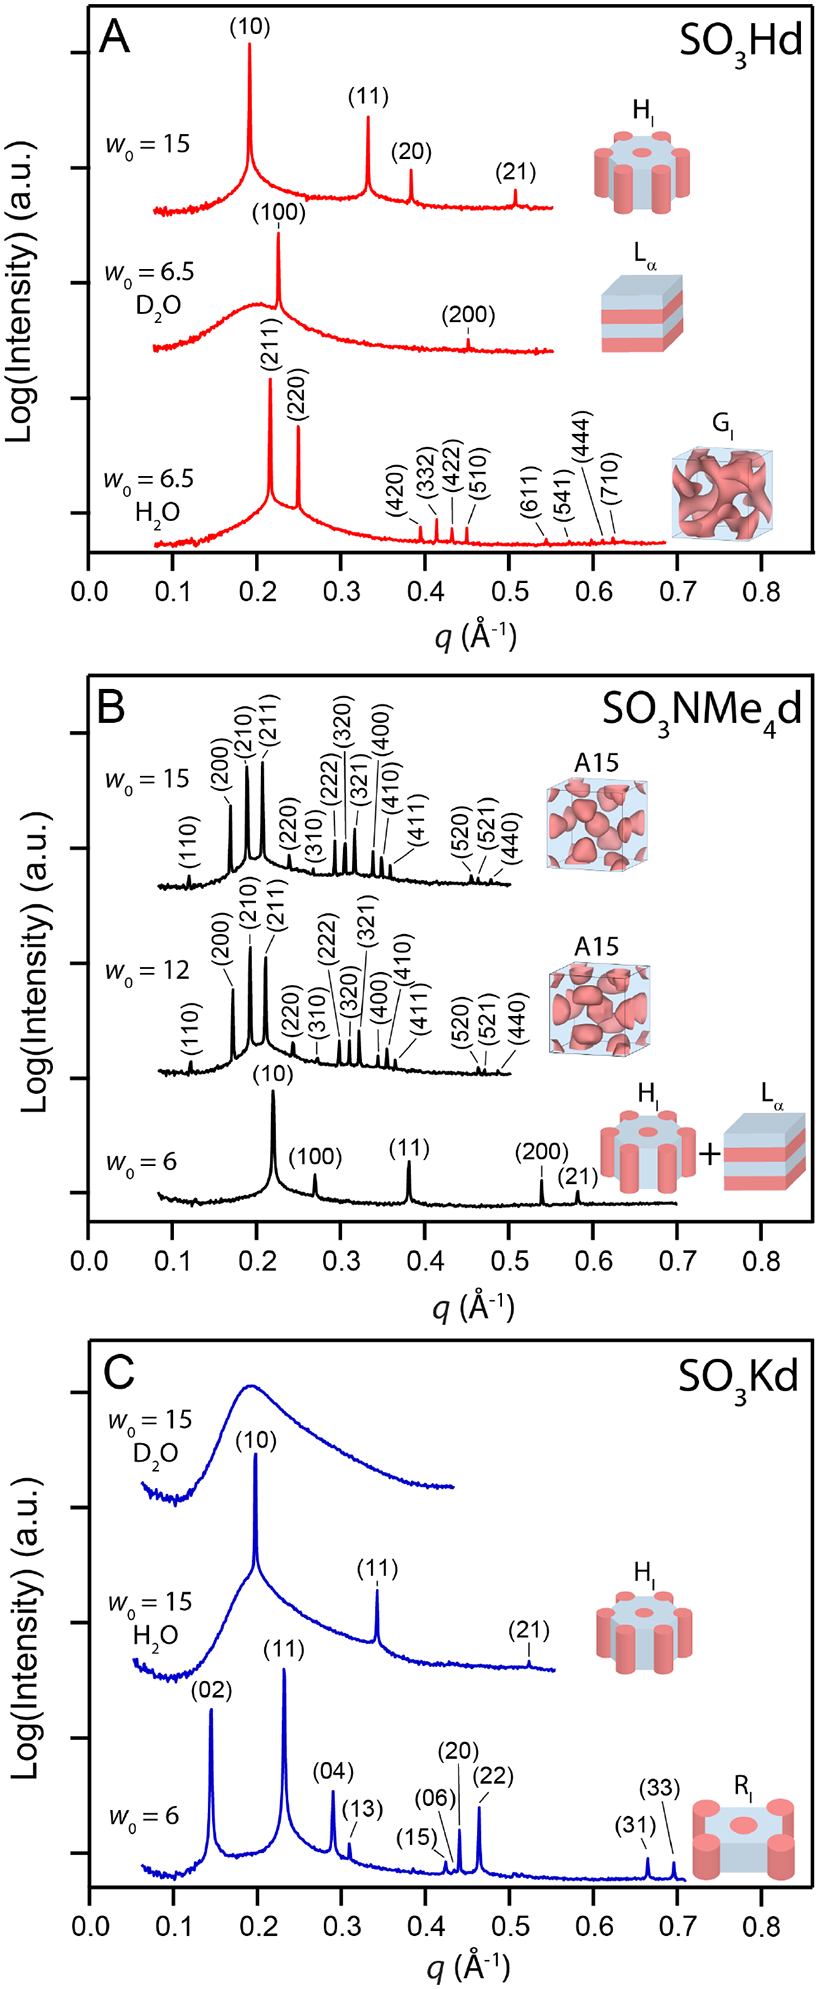
Synchrotron small-angle X-ray scattering (SAXS) intensity I(q) versus scattering wavevector q profiles at 25°C reveal the counterion–dependent aqueous LLC phase behaviors of alkylsulfonate surfactants: (A) SO3Hd forms a normal double gyroid (GI) network at w0 = 6.5 in H2O and lamellae (Lα) at this same w0 in D2O, and a hexagonally-packed cylinders (HI) phase at w0 = 15. (B) SO3NMe4d exhibits two phase HI/Lα coexistence at w0 = 6 and normal Frank-Kasper A15 micellar packings at w0’s = 12 & 15. (C) SO3Kd at w0 = 6 forms a normal ribbon phase (RI) and at w0 = 15 forms a HI phase in H2O and a fluid isotropic phase (L1) in D2O. Miller indices listed correspond to the expected reflections for each morphology.
QENS Measurement and Data Fitting.
We used QENS to measure the dynamic structure factor S(q,E) (Figure 3) for LLC samples formed in H2O. We observe a quasielastic peak that broadens and decreases in intensity at higher q-values, with some attenuation of S(q,E) at q = 1.5 and 1.7 Å−1 as an artifact of the flat-plate QENS sample holder employed for these measurements. The measured S(q,E) contains contributions from five different components: (1) a linear background due to vibrational dynamics that are faster than the instrument resolution, (2) elastic intensity arising from differences in coherent contrast (e.g. SANS) between the QENS sample comprising deuterated amphiphile in H2O and the background LLC sample made in D2O, (3) elastic intensity from any water molecules that are immobile over the timescale set by the instrument resolution function, (4) quasielastic signal from deuterated amphiphile dynamics, and (5) quasielastic signal from water dynamics, which we sought to isolate.
Figure 3.
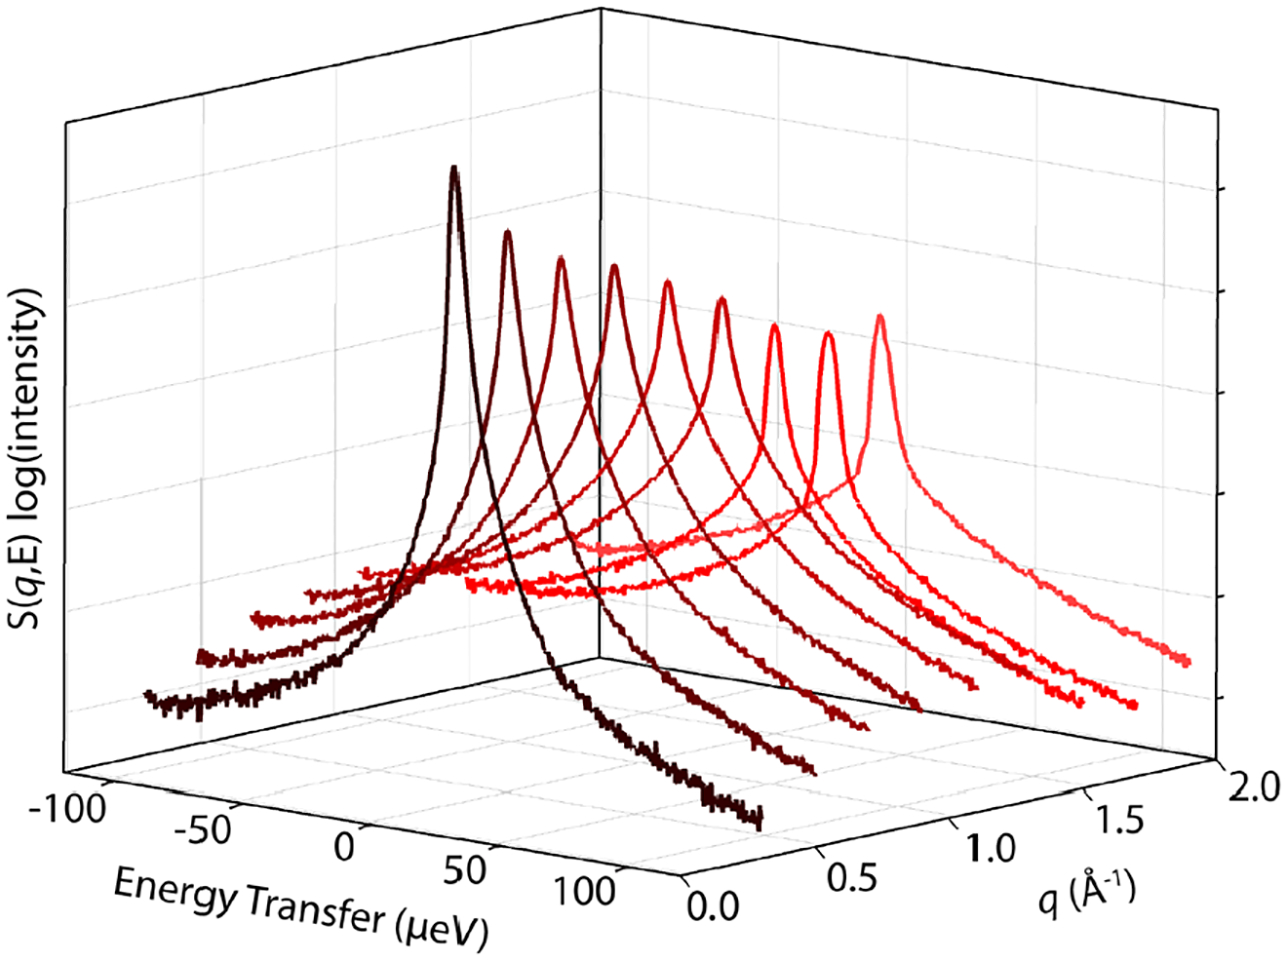
Vanadium-normalized QENS spectra for SO3NMe4d at w0 = 6 depicting S(q,E) on a log(intensity) scale versus energy transfer, E, as a function of scattering wave vector, q, at 298 K. The decreased intensity at q = 1.5 and 1.7 Å−1 stems from a sample holder artifact.
To isolate the quasielastic scattering from water, we fit S(q,E) using our previously reported30 four-component model given in Eq. (1) as depicted in Figure 4 and described in the Experimental Methods Section (see Table S3 for QENS data fitting parameters). We approximate vibrational dynamics using a linear background. We used a single d-function to fit both elastic contributions to S(q,E) (e.g. SANS and immobile H2O molecules). In addition to synthesizing perdeuterated amphiphiles, LLC samples formed in D2O were used as a background to subtract the contributions from surfactant dynamics to S(q,E). The experimentally-measured Sbackground(q,E) was weighted by a background scaling factor bw. As noted in our previous study of water dynamics in alkylcarboxylate LLCs,30 excess elastic intensity in our samples caused by the LLC morphology and its SANS peaks cannot be removed with our background subtraction procedure, as the perdeuterated background sample exhibits significantly lower coherent contrast. Our treatment of the surfactant background assumes similar deuterated surfactant dynamics in S(q,E) and Sbackground(q,E), which may no longer be valid if LLC phase behavior changes upon replacement of H2O with D2O. Fitting S(q,E) without Sbackground(q,E) for the cases of SO3Hd at w0 = 6.5 (GI in H2O → Lα to D2O) and SO3Kd at w0 = 15 (HI in H2O → L1 in D2O) only changes our calculated water self-diffusion coefficients (vide infra) by ≤13% and thus does not alter any of our qualitative conclusions.
Figure 4.
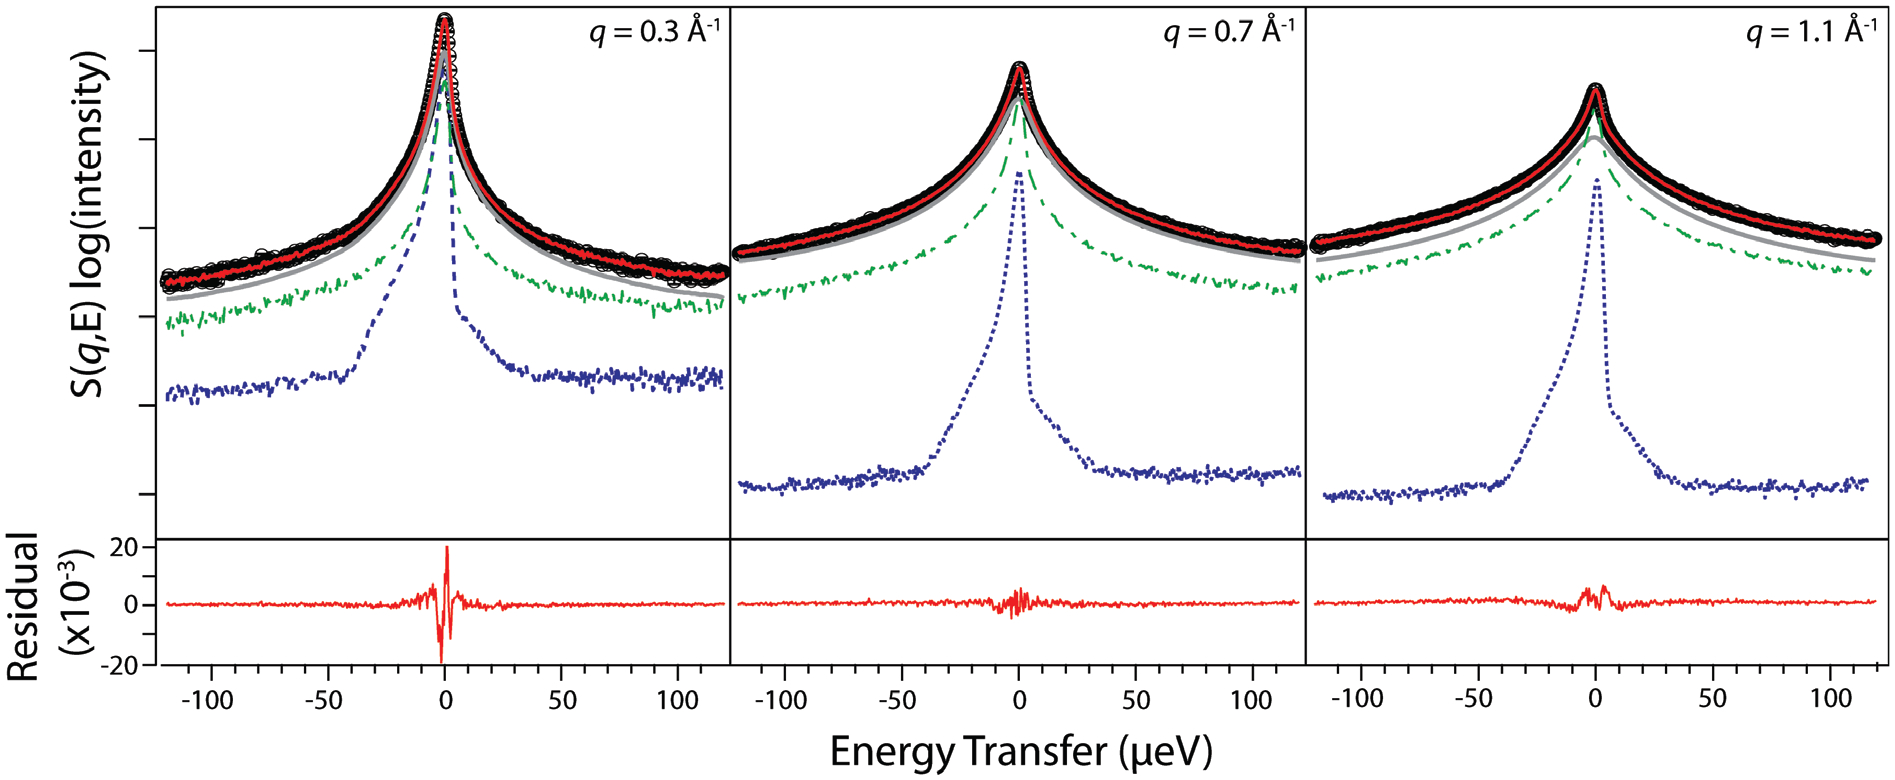
Representative QENS spectra (thick black circles) and a global fit to Eq. (1) (solid red line) for SO3NMe4d at w0 = 6 for q = 0.3, 0.7, and 1.1 Å−1 presented on a log(intensity) scale, along with the four components of each experimental data fit: a linear background term that is below the cut-off of the graph, a δ-function (dashed blue line), the scaled D2O background (dash-dot dark green line), and a stretched exponential FT-KWW function (solid gray line). As indicated in Eq. (1), the d and stretched exponential functions are convoluted with a sample-dependent resolution function. The residual (solid red line) below the graphs is on a linear scale and originates from the excess elastic intensity resulting from Bragg scattering from the underlying LLC morphology not captured by the fit.
Using the relaxing cage model (RCM) developed to analyze heterogeneous dynamics in supercooled water,4, 59, 64–66 we fit the remaining water quasielastic contributions using the Fourier transform of a Kohlraush-Williams-Watts (FT-KWW) stretched exponential to determine the q-dependent cage relaxation time τ and the stretching/compressing exponent β. Note that while previous simulations by Trigg et al. demonstrated that water diffusion is highly sensitive to pore size dispersity,27 our use of a FT-KWW function allows us to account for spatially heterogeneous water dynamics and extract an average water self-diffusion coefficient (<D>). Our four-component model fits the data with χ2 < 5 (Table S3). As noted previously,30 the observed residual stems from the inability of a single δ-function (convoluted with the instrument resolution function) to completely capture the elastic intensity arising from two different sources: (1) water molecules immobile over the timescale set by the instrument resolution and (2) Bragg peaks from the underlying LLC morphology that cannot be removed through the background subtraction protocol. The residual is most pronounced at low q-values (Figure 4), where the Bragg scattering from our samples is strongest (Figure 2). Adding another d-function to the fitting routine did not significantly improve the fit quality. We note that a similar QENS data analysis approach for structurally homologous alkylcarboxylate LLCs was well-corroborated by MD simulations,45 indicating that strong coherent scattering does not prevent extraction of water self-diffusion coefficients. In view of these caveats, we emphasize that the present work focuses on qualitative trends in water dynamics.
QENS Data Analysis.
Both hydration level and counterion identity affect the FT-KWW stretched exponential fitting parameters. The cage relaxation time τ decreases as a function of q, with anomalously large τ values at low q from the residual elastic intensity not captured in our fit (Table S3). At a constant headgroup hydration (w0), we generally observe the largest τ values for SO3NMe4d, followed by SO3Hd and then SO3Kd. We observe lower τ values as w0 increases for a given counterion. From global fits of the data, the q-independent β ≈ 0.6–0.8 generally increases with hydration (Figure S1), indicating more homogeneous water dynamics at higher w0. The RCM fitting parameters τ and β can be combined yield an average relaxation time (<τβ>) via Equation 3:59
| (3) |
In the “decoupling approximation,” the intermediate scattering function (ISF) determined by QENS is approximated as the product of the translational ISF and the rotational ISF, wherein the low q QENS signal is dominated by the translational ISF.65, 67 MD simulations have explicitly validated the decoupling approximation for water confined in gemini dicarboxylate LLCs for w0 ≥ 3 and q ≤ 1.3 Å−1.68 If water were exhibiting diffusive translational dynamics, the average relaxation time (1/<τβ>) would scale linearly with q2.5, 46, 58, 59 A power-law fit of qγ ~ 1/<τβ> over the range 0.2 Å−1 ≤ q ≤ 1.2 Å−1 reveals power law scaling exponents (γ) of ~2 with two exceptions (Figure S2 and Table 1). SO3Hd exhibits γ = 3.3 at w0 = 6.5 and γ = 2.4 at higher w0. We attribute this result to increased elastic intensity at low q from the spatially periodic SO3Hd LLC morphology (see Figure 2 for SAXS data). This elastic intensity cannot be completely captured by the δ-function in our QENS fitting protocol and thus artificially decreases 1/<τβ> at low q as visualized in Figure S2. Excluding the lowest q bin and fitting SO3Hd at w0 = 15 over the range 0.4 Å−1 ≤ q ≤ 1.2 Å−1 yields γ = 2.2; whereas the stronger SANS signal at w0 = 6.5 leads to γ = 2.1 only over the range 0.6 Å−1 ≤ q ≤ 1.2 Å−1. Note that we recover the same value for the water self-diffusion coefficient (vide infra) whether the low q data for SO3Hd is included or excluded.
Table 1.
Hydration, Counterion, and Surfactant Headgroup Affect Water Dynamics
| Amphiphile | Hydration | Morphologyc | Nanopore Diameter (Å)d | γf | <D> (cm2/s)g (x 106) | DBulk/<D>h |
|---|---|---|---|---|---|---|
| SO3Hd | w0 = 6.5 | GI | 14 | 3.3 | 4.2 ± 0.4 | 5.5 |
| SO3Hd | w0 = 15 | HI | 20 | 2.4 | 7.9 ± 0.8 | 2.9 |
| SO3Kd | w0 = 6 | RI | 17 [10]e | 2.0 | 5.6 ± 0.6 | 4.1 |
| 62 [01]e | ||||||
| 24 [11]e | ||||||
| SO3Kd | w0 = 15 | HI | 25 | 2.0 | 11 ± 1.1 | 2.1 |
| SO3NMe4d | w0 = 6 | Lα+ HI | 19d | 1.9 | 2.0 ± 0.2 | 12 |
| SO3NMe4d | w0 = 12 | A15 | 39 [111]e | 2.0 | 5.4 ± 0.5 | 4.3 |
| SO3NMe4d | w0 = 15 | A15 | 41 [111]e | 1.9 | 6.5 ± 0.7 | 3.5 |
| CO2Na-74da | w0 = 6 | GI | 13 | 0.65 ± 0.07 | 35 | |
| CO2Na-74da | w0 = 15 | HI | 20 | 5.2 ± 0.5 | 4.4 | |
| CO2K-74da | w0 = 6 | GI | 13 | 2.1 ± 0.2 | 11 | |
| CO2K-74da | w0 = 15 | HI | 20 | 7.2 ± 0.7 | 3.2 | |
| CO2NMe4-74da | w0 = 6 | GI | 15 | 0.72 ± 0.07 | 32 | |
| CO2NMe4-74da | w0 = 15 | HI | 23 | 4.o ± 0.4 | 5.8 | |
| C8F17SO3Hb | w0 = 5.4 | Lα | 18 | 1.3 | ||
| C8F17SO3Hb | w0 = 8.8 | Cubic | 19 | 1.2 | ||
| C8F17SO3Hb | w0 = 14.7 | HI | 23 | 1.0 |
Water dynamics in gemini dicarboxylate LLCs determined using QENS.30
LLC morphologies were determined using synchrotron SAXS (Figure 2).
Water nanopore diameters were estimated along the specified unit-cell vector [hkl] using electron density map reconstructions (see Supporting Information). For GI and HI phases from this study and Ref[30], nanopore diameters are along [111] and [11], respectively. The nanopore diameter listed for SO3NMe4d at w0 = 6 is for the HI phase.
There several different micelle-micelle distances in the RI and A15 phases that could be defined as the convex pore diameter.
Power law scaling exponent for 1/<τβ> versus q over the range 0.2 Å−1 ≤ q ≤ 1.2 Å−1.
The water self-diffusion constant determined by a linear least-squares regression of 1/<τβ> versus q2 as depicted in Figure 5. The error on this value is ~10% (see Experimental Methods for error estimation).
Measure of confinement-induced change in water dynamics compared to bulk water using DBulk = 23 × 10−6 cm2/s from PFG-NMR measurements.70
As the majority of our data do follow the expected γ ~ 2 scaling and many other studies of confined water have observed diffusive dynamics,5, 46, 58, 59 we then determined the water self-diffusion coefficient (<D>) using a linear least-squares regression of 1/<τβ> versus q2 over the range 0.2 Å−1 ≤ q ≤ 1.2 Å−1 with R2 ≥ 0.97 (Figure 5a at low w0 and Figure 5b at high w0, see Table S3 for R2 values). Taking into account the estimated ±10% uncertainty in <D> from our fitting protocol (see Experimental Methods) and systematic errors in applying the standard QENS analyses to LLC confined water,68 we focus primarily on the qualitative effects of hydration, counterion, and surfactant headgroup on confined water diffusion.
Figure 5.
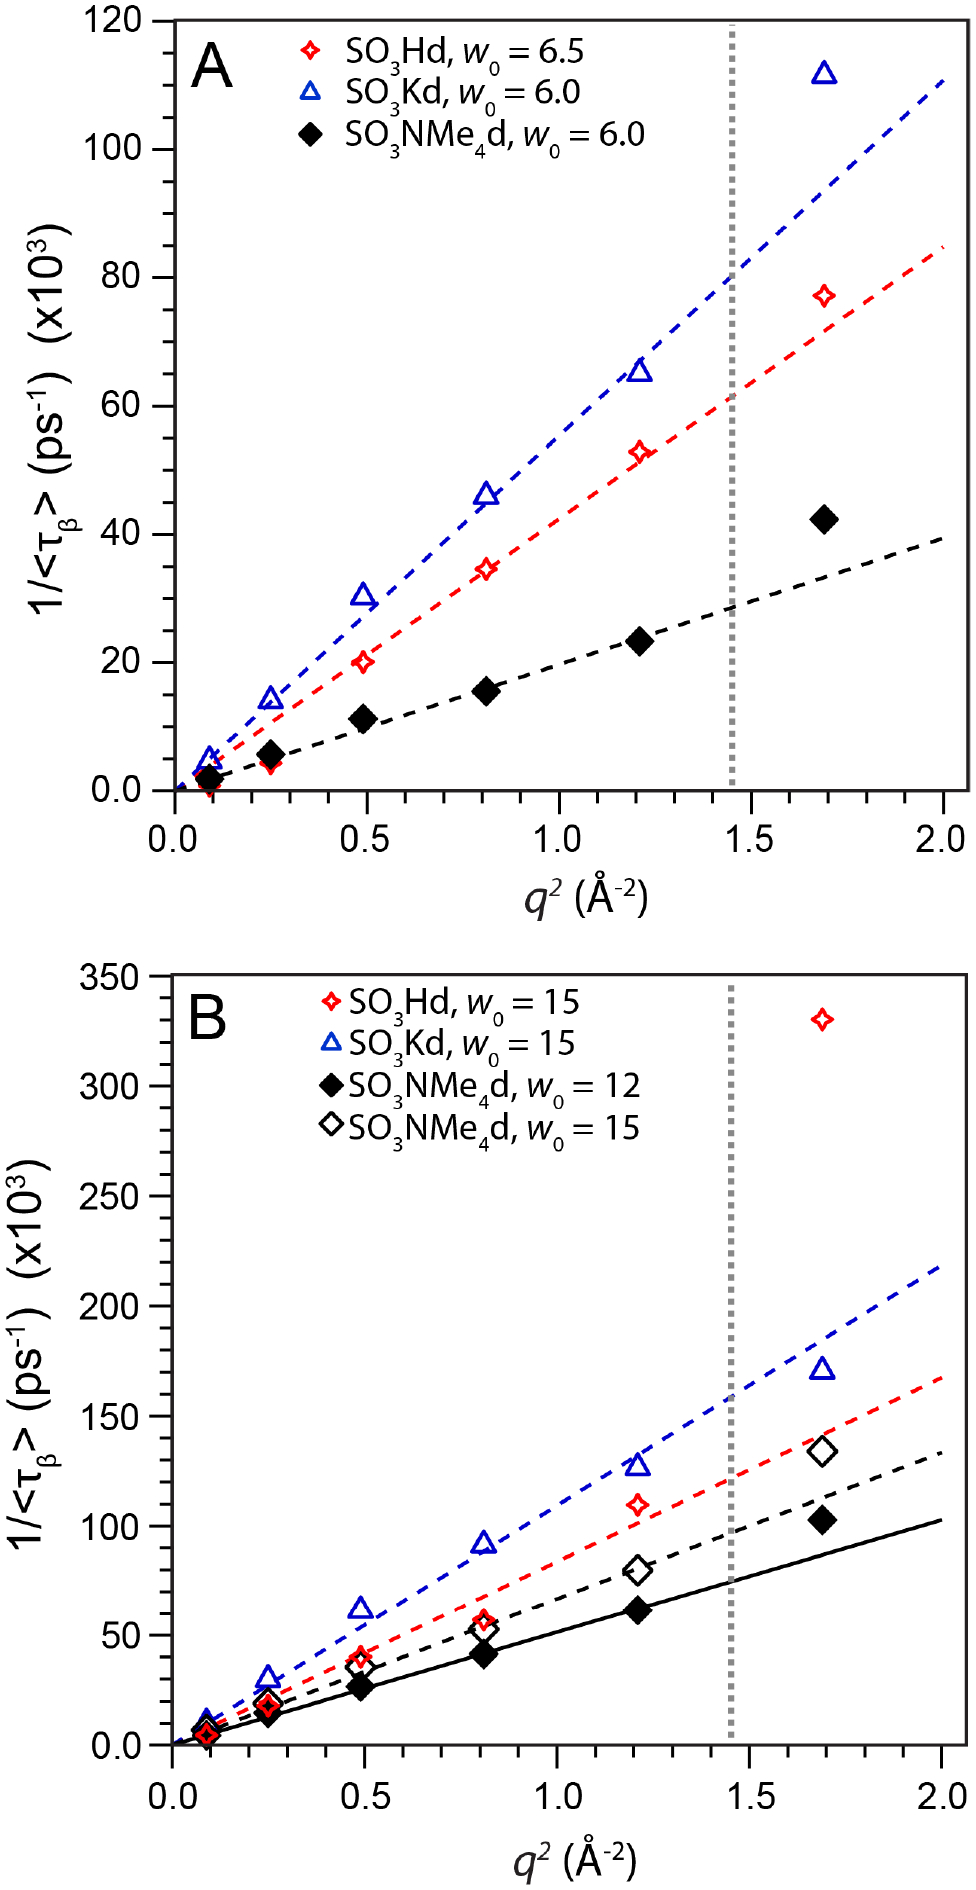
Plots of 1/<τβ> versus q2 (vertical gray line indicates the data cut off at q2 = 1.44 Å−2), from which the average water self-diffusion coefficient <D> is calculated as the slope of a linear least-squares regression fit (see Table S3 for R2 values). Water translational dynamics increase in the order NMe4+ > H+ > K+ at both (A) low w0 and (B) high w0, with faster water diffusion at high w0. We attribute the anomalously large 1/<τβ> value of SO3Hd at w0 = 15 and q = 1.69 Å−2 in panel (B) to signal attenuation from the QENS sample holder.
Headgroup hydration state and counterion identity affect <D> (Figure 6A and Table 1). As quantified by the ratio of bulk water self-diffusion to that in the LLCs (DBulk/<D>), water diffusion decreases by a factor of 2–3.5 upon confinement within sulfonate-lined LLCs at w0 = 15. We observe a modest counterion dependence with the decreasing water self-diffusion in the order . Water dynamics are significantly slower at w0 ~ 6 with DBulk/<D> values ranging 4.1–11. While the counterion dependence of water diffusion is more pronounced at this low hydration, the same qualitative trend is observed.
Figure 6.
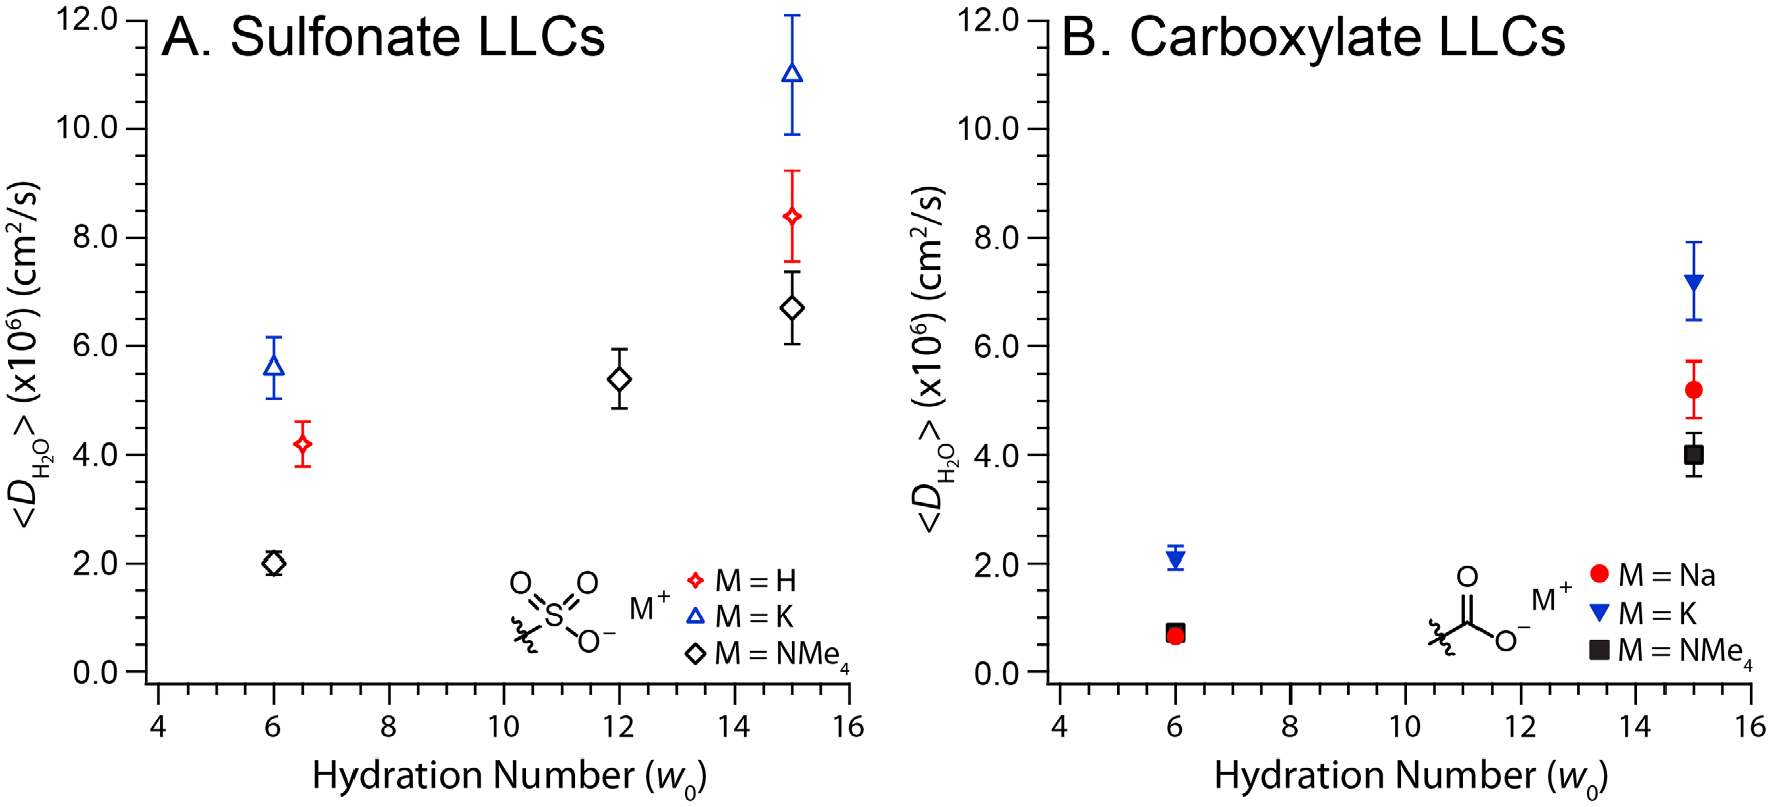
Comparison of the water self-diffusion coefficients (<D>) calculated from a global fit to Eq. (1) for (A) sulfonate and (B) carboxylate LLCs30 with various counterions and headgroup hydrations (w0). Error bars represent the estimated ±10% uncertainty in the value of <D>.
Role of convex nanopore interfacial chemistry is apparent in comparing <D> for sulfonate LLCs (Figure 6A) to those reported for carboxylate LLCs30 (Figure 6B). We refer to the gemini dicarboxylate LLCs using the nomenclature CO2M-74d, where M is the surfactant counterion identity (e.g. Na+, K+, NMe4+). SAXS analyses30 of CO2M-74d LLCs at w0’s = 6 & 15 indicate convex nanopores with comparable diameters to those in our current study (see Table 1 for structural information). As carboxylate and sulfonate LLCs differ somewhat in their exact morphologies and consequent convex pore structures, we focus on qualitative comparisons of the water dynamics in pores lined with these two headgroup chemistries. For the same counterions at w0 = 15, water diffusion is more bulk-like for sulfonate LLCs and yields DBulk/<D> values that are 1.5 times smaller than their carboxylate analogs:
| DBulk/<D>, w0 = 15 | Headgroup | ||
| −SO3− | −CO2− | ||
| Counterion | NMe4+ | 3.5 | 5.8 |
| K+ | 2.1 | 3.2 | |
The difference between headgroup chemistries becomes sharper at lower headgroup hydrations, with a 2.7-fold decrease in DBulk/<D> at w0 = 6 for SO3Kd and SO3NMe4d compared to CO2K-74d and CO2NMe4-74d, respectively:
| DBulk/<D>, w0 = 6 | Headgroup | ||
| −SO3− | −CO2− | ||
| Counterion | NMe4+ | 12 | 32 |
| K+ | 4.1 | 11 | |
On maintaining a constant w0 and counterion identity, replacement of carboxylate groups with sulfonate functionalities systematically increases confined water diffusion.
We conducted elastic intensity scans to investigate further understand how headgroup chemistry affects confined water dynamics. We obtained the hydrogen atom mean-square displacement (<u2x(T)>, Figure 7) for SO3NMe4d at w0 = 6 by fitting the q-dependence of the elastic intensity from 298 to 50 K (see Experimental Methods for more details). This value quantifies the magnitude of H-atom vibrations perpendicular to the hydrogen-bonding axis,71 which we previously correlated with the physical volume excluded by counterion in the aqueous channel.30 The <u2x(298 K)> = 0.14 Å2 measured for SO3NMe4d is smaller than 0.23 Å2 observed for bulk water71 and comparable to those measured for water confined in inorganic matrices.5, 58, 72 The value for SO3NMe4d is almost identical to <u2x(298 K)> = 0.13 Å2 obtained for CO2NMe4-74d30 at w0 = 6, suggesting a similar extent of counterion distribution in the water-filled pores despite the differences in headgroup chemistry.
Figure 7.
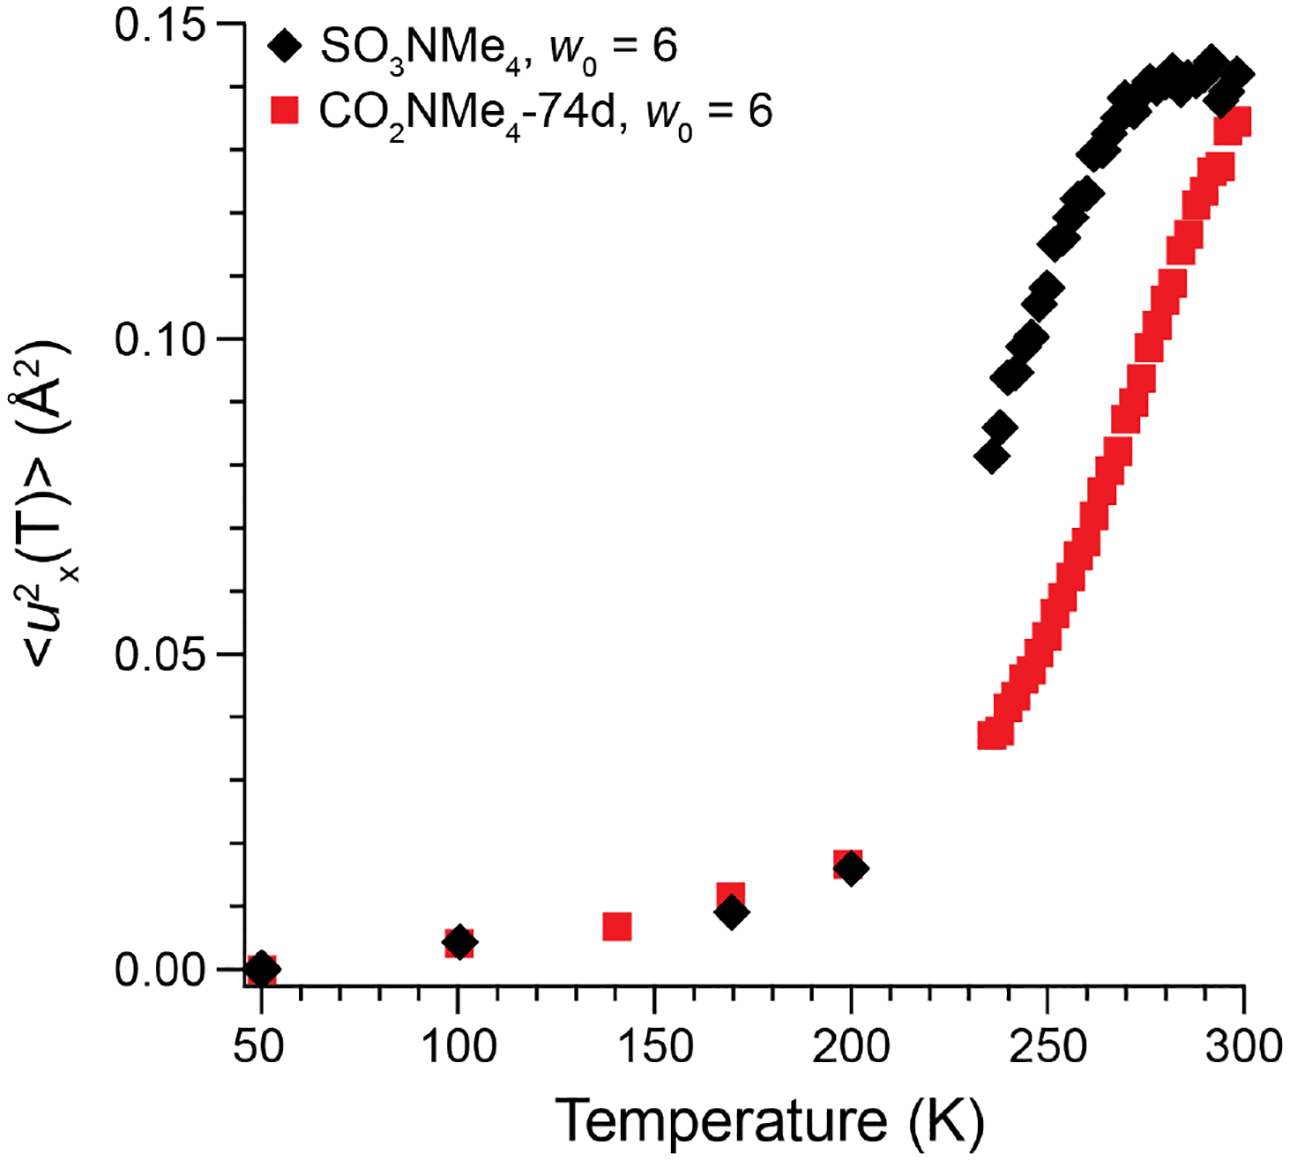
Overlay of the temperature-dependent H-atom mean-squared displacements calculated from Eq. (2) for SO3NMe4d (black diamonds) and CO2NMe4-74d30 (red squares) at w0 = 6 upon cooling to 50 K. We assume complete dynamical arrest at 50 K (i.e. <u2x (50 K)> = 0). Both carboxylate and sulfonate LLCs exhibit almost identical values of <u2x(T)> at 298 K despite their different surfactant headgroup chemistries.
Cooling SO3NMe4d yields a continuous decrease in <u2x(T)>, indicating that crystallization of any bulk-like water is suppressed under these experimental conditions (see Experimental Methods). Similar observations have been noted in studies of water confined in supported lipid bilayers.73 After holding the sample at 50 K for approximately 6 h to obtain R(q,E) and then reheating to 298 K, we observe a discontinuous increase in elastic intensity at 260 K. We attribute this hysteresis in <u2x(T)> to the melting of water that had crystallized within the LLC morphology during the extended time at cryogenic temperatures. Under analogous experimental conditions, SO3NMe4d yields comparatively larger <u2x(T)> values than CO2NMe4-74d. Based on conclusions by Faraone et al.46 for water confined in concave silica nanopores, we speculate that the more hydrophobic SO3− headgroup disrupts interfacial water structure and leads to a larger fraction of mobile water molecules at sub-ambient temperatures.
Discussion
Confinement within convex, sub-5 nm sulfonate-lined nanopores of aqueous LLCs perturbs the observed water dynamics. Diffusion is reduced compared to bulk water and the β-values from FT-KWW fits indicate a distribution of relaxation times across the aqueous channel. Water diffusion depends primarily upon the hydration level of the LLC system, but also on nanopore chemical functionalities.
Previous simulations45 and QENS experiments30 explored the roles of hydration level and surfactant counterion identity (Na+, K+, NMe4+) on water dynamics in CO2M-74d carboxylate LLCs (Figure 6B). Three related factors were invoked to account for the observed counterion-specific water dynamics: (1) water-cation electrostatic attractions, (2) counterion excluded volume, and (3) water-headgroup attractions. The high charge density of “hard” cations such as Na+ decreases water diffusion due to water-cation attractions,74 while the large physical size of “soft” cations such as NMe4+ decreases water diffusion due to their large excluded volume. Counterion pairing with a carboxylate headgroup increases in the order NMe4+ < K+ < Na+ (vide infra),75 directly leading to the strongest water-carboxylate headgroup attractions for CO2NMe4-74d and weakest for CO2Na-74d. The balance between these three effects leads to at w0 = 15. Observations in aqueous salt solutions45 suggest this trend to be hydration independent, however QENS analyses revealed the trend at w0 = 6 in these carboxylate LLCs. Detailed SAXS analyses of the LLCs demonstrated localization of the NMe4+ ions at the aqueous channel center, which decreases their excluded volume and increases water diffusion compared to the more homogeneously distributed Na+ ions. While these results indicate counterion distribution within an ionic nanopore influences confined water dynamics, they provide no insights into the impact of surfactant headgroup on counterion location and the consequent water dynamics.
In order to assess the convex pore dimensions (see Table 1) and counterion spatial distributions therein, we generated real-space electron density maps (90% isosurfaces) of these LLC morphologies (Figure 8) from the SAXS data in Figure 2 using a previously established methodology.30, 35, 36, 44, 48–50 We refer the interested reader to the detail of this method given the Experimental Methods Section and Supporting Information. The electron density map for SO3NMe4d A15 phase LLCs at w0 = 12 (Figure 8A) reveals the expected tetrahedral close packing of highly faceted micelles nested in a water matrix that has been documented elsewhere.48 The water confinement diameter varies widely in this morphology, ranging from ~16 Å between adjacent face-centered micelles to ~40 Å between micellar interfaces along the cubic unit cell diagonal ([111] direction; Table 1). The electron density profile along [111] exhibits a depression in the electron density at the center of the aqueous channel indicative of NMe4+ counterion localization (Figure 8E).30, 36 We observe a similar signature of NMe4+ localization at w0 = 15 (Figure S3). Analysis of the SO3NMe4d HI phase electron density map at the lower hydration w0 = 6 shows 19 Å water nanopores with marked decrease in electron density adjacent to the micellar interfaces (Figure 8C–E), which we interpret as NMe4+ localization near the sulfonate headgroups (see Figure S4C for additional evidence). These interpretations of the ion distributions within the LLC nanochannels are further supported by comparisons of the SO3NMe4d electron density maps with those of the SO3Hd HI and GI p hases (Figures S4 and S5, respectively). The SO3Hd LLCs show no signatures of counterion localization as the electron density differences between the H2O molecules and hydrated protons (e.g., H(H2O)n+) are too small to appreciably impact the SAXS intensity profile. SO3Kd electron density maps indicate K+ ion localization with higher electron densities between the flat interfaces of adjacent micelles in the RI phase and a distinct peak in the electron density at the center of the 25 Å water nanopores of the HI phase (Figure S6).
Figure 8.
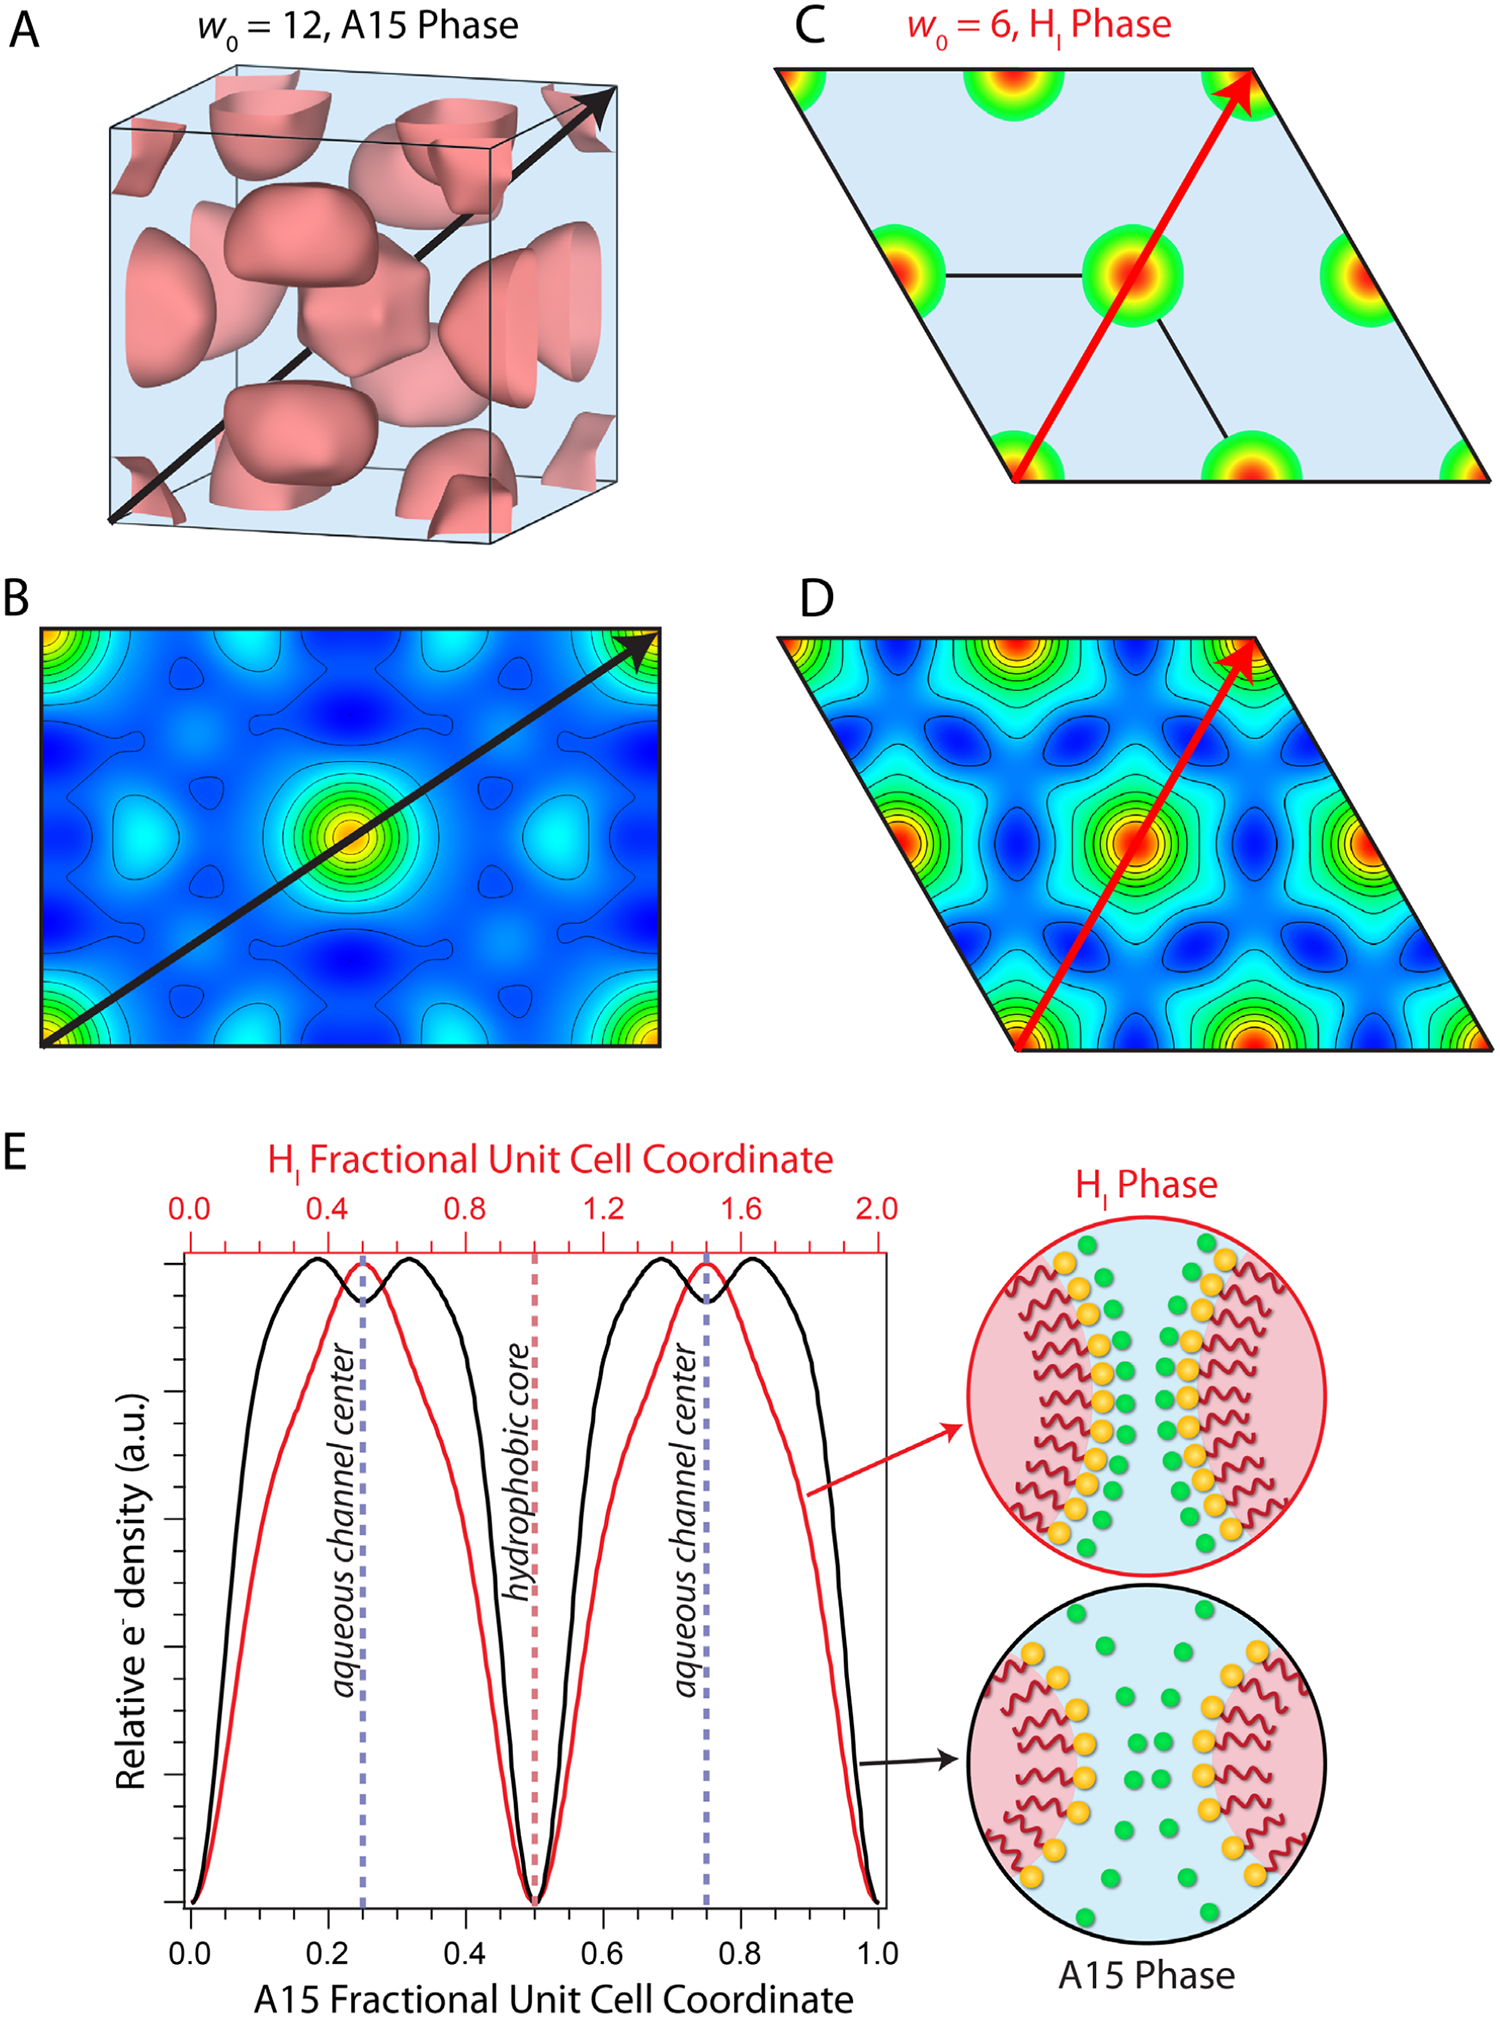
Electron density maps derived from SAXS data for SO3NMe4d LLCs reveal that hydration level (w0) affects NMe4+ ion localization. (A) 90% isosurface of the A15 phase unit cell at w0 = 12 with polyhedral micelles (pink) surrounded by a water matrix. (B) 2D electron density map of the (110)-plane in which (A) black lines indicate 10% increments in the relative electron density. (C) 2 × 2 supercell of the HI phase (01)-plane at w0 = 6 showing cylindrical micelles in a water matrix (blue), with the edge of the micelles corresponding to the 90% isosurface. (D) 2D electron density map of (C) with lines indicating 10% increments in the relative electron density. (E) Linear electron density profile plotted as relative electron density versus fractional unit cell coordinate for the [111] direction of the A15 (110) plane (black trace; black arrow in A and B) and the [11] direction of the HI (01) plane (red trace; red arrow in C and D). The marked decrease in electron density at the HI phase micellar interface and depleted electron density at the center of the A15 phase aqueous channel indicate NMe4+ ion localization, as depicted schematically.
Conventional wisdom regarding micellar solutions suggests that counterion distributions can be rationalized solely through headgroup-counterion pairing, yet counterion distributions within a convex ionic nanopore additionally depend on electrostatic repulsion between adjacent counterion clouds. On the basis of matching charge densities,76, 77 one would expect a “hard” carboxylate headgroup to exhibit stronger pairing with counterions of decreasing radius (e.g. NMe4+ << Cs+ < K+ < Na+ < Li+ < H+) and a “soft” sulfonate headgroup to display the reversed order of pairing preference. Contrary to this expectation, the flatter LLC interfaces of SO3Kd than SO3NMe4d at a given hydration imply tighter ion pairing for K+ than NMe4+. We attribute this observation to long-range electrostatic correlations between the more point-like K+ ions.78 While strong ion pairing explains NMe4+ localization at the sulfonate-lined interface at low hydrations, the relatively low electrostatic penalty for placing “soft” NMe4+ ions in close proximity facilitates ion pair dissociation in SO3NMe4d at w0 = 12 (Figure 8E) and 15 (Figure S3). We analogously reported highly dissociated NMe4+ ions in carboxylate LLCs.30 The K+ and NMe4+ counterion distributions within sulfonate LLCs are thus more similar to their carboxylated counterparts than would be anticipated by considering headgroup-counterion dissociation alone.
The similar counterion distributions within the water-filled pores of both LLC systems preserve the relative contributions of water-counterion attractions, counterion excluded volume, and water-headgroup attractions. Consequently, we rationalize the slower water diffusion for NMe4+ than for K+ in both CO2M-74d and SO3Md LLCs in terms of the larger excluded volume of NMe4+ counterions and increased water-headgroup attractions that overwhelm the K+ cation-water attractions. Our results also indicate that H(H2O)n+ decreases water diffusion more than K+ but less than NMe4+, however, we are unable to determine whether this effect is due to the size (and charge density) of the protonated water clusters or their spatial distribution.
These similar structural features between these convex pore morphologies of LLCs also enable direct comparisons of effect of different pore wall chemistries on confined water diffusion. For a given counterion and hydration level, the water self-diffusion coefficient is up to 2.7 times greater in sulfonate LLCs than in their carboxylate analogues (Figure 6). We attribute the systematically faster water diffusion for the “softer” sulfonate headgroup to decreased water-headgroup electrostatic attractions (Figure 9). While our experimental observations conflict with previous MD predictions,6 comparisons to QENS studies of perfluorooctane sulfonic acid (PFOS) LLCs29, 69 further support our interpretation. Berrod et al. observed almost bulk-like water diffusion with DBulk/<D> = 1.3 at w0 = 5.4 in a PFOS Lα phase and DBulk/<D> = 1.0 at w0 = 14.7 in a convex PFOS HI phase (Table 1). By comparison, the increased headgroup charge density of SO3Hd leads to slower water diffusion with DBulk/<D> = 5.5 at w0 = 6.5 and DBulk/<D> = 2.9 at w0 = 15. In contrast to previous studies of concave silica nanopores,46 our results clearly demonstrate that, even at ambient temperatures convex nanopore interfacial chemistry strongly influences confined water diffusion.
Figure 9.
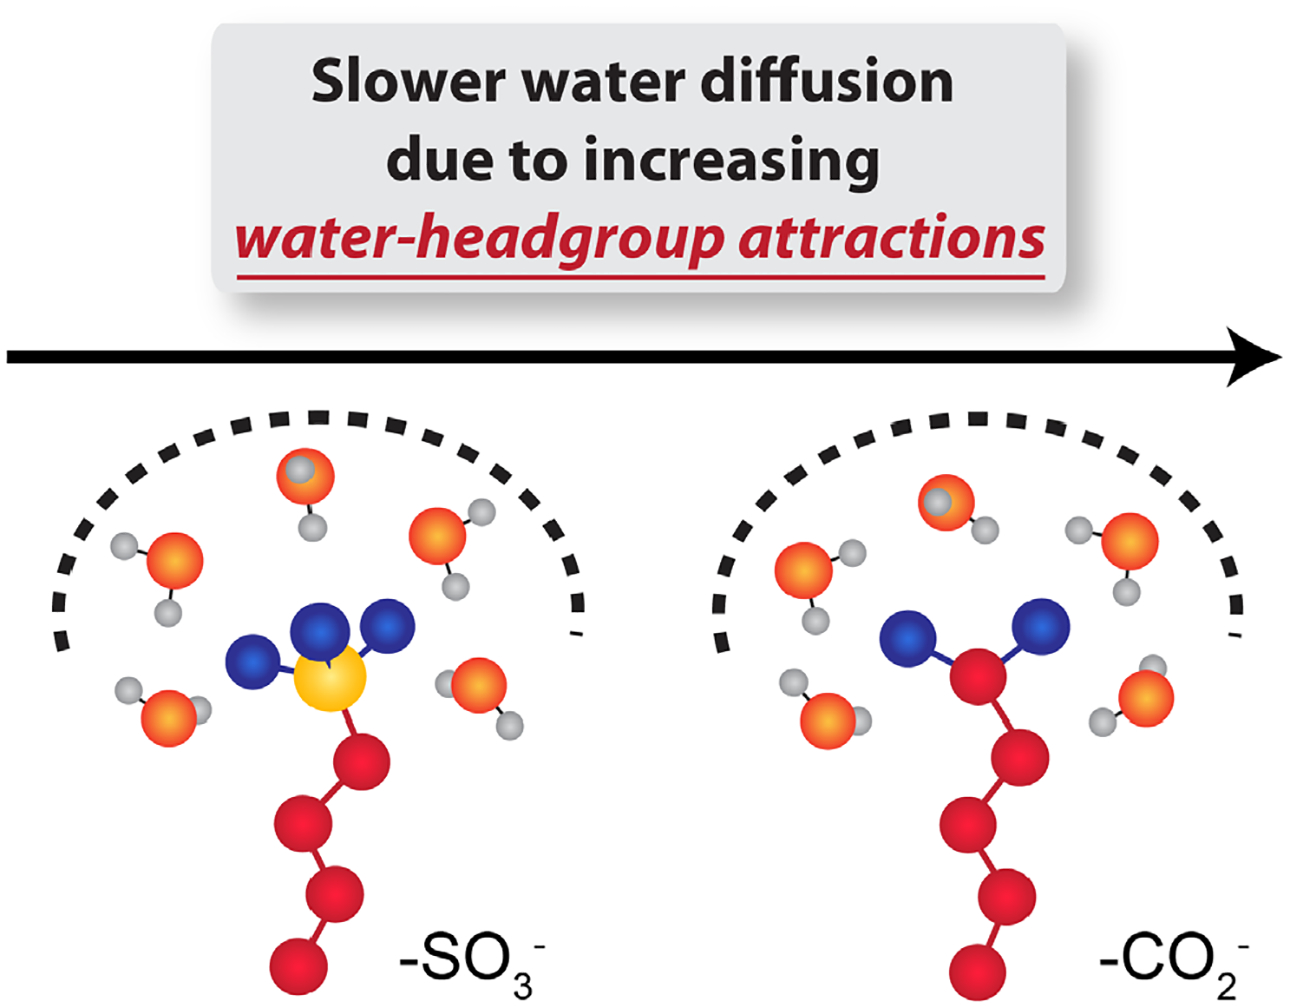
Surfactant headgroup functionalities primarily affect water dynamics via water-headgroup attractions such that the lower charge density of the sulfonate headgroup leads to weaker electrostatic correlations with hydration waters, thus enabling faster water diffusion compared to the harder and more hydrophilic carboxylate headgroup that tends to tightly bind water.
Beyond interfacial chemistry, pore curvature is an important consideration in designing membranes with enhanced performances. We recently demonstrated that sulfonate LLCs with convex nanopores display water-mediated H+ conductivities that are more than 2-fold higher than concave nanopores of the same confinement diameter due to enhanced headgroup-counterion dissociation.44 In the context of the current study, we would anticipate that increased counterion dissociation in convex pores would lead to slower water diffusion. However, we are unable to compare our present results to benchmark studies of water diffusion in the concave nanopools of sodium bis(2-ethylhexyl) sulfosuccinate (Na-AOT) reverse micelles.60, 61 Beyond the obvious differences in surfactant structure and counterion identity, direct comparisons of water diffusion in convex and concave nanopores may be inherently problematic due to coupling with the dynamics of the surrounding matrix.79, 80 Thus future explorations of this dynamical coupling that isolate the effect of pore interfacial curvature on confined water dynamics are warranted.
Conclusion
Self-assembled LLCs furnish a well-defined and tunable molecular platform for fundamental studies of confined water dynamics. QENS analyses of perdeuterated sulfonate LLCs indicate that confined water diffusion in these convex nanopores depends primarily on the hydration level, with increasing sensitivity to interfacial chemistry as the pore (confinement) diameter decreases. Counterions perturb water dynamics through water-cation attractions and by excluding volume, both of which depend on the physical size of counterions and their spatial distributions. Despite expected differences in headgroup-counterion pairing, we surprisingly recover similar counterion-dependent water dynamics in sulfonate LLCs as those previously reported for carboxylate LLCs. Experimentally-derived electron density maps demonstrate that, unlike in dilute micellar solutions, counterion distributions within an ionic nanopore depend on both counterion-headgroup pairing and electrostatic correlations between adjacent counterion clouds. The relatively similar spatial distributions of counterions in sulfonate and carboxylate LLCs underlie the similarity in their counterion-dependent water dynamics. Weaker water-headgroup attractions for sulfonate LLCs result in systematically faster water diffusion compared to carboxylate LLCs. Additionally, these results demonstrate that water dynamics in convex nanopores are more sensitive to interfacial chemical functionalities than previously concluded from concave confining environments.46, 81 Judicious designs of nanoporous media for selective water and ion transport applications should incorporate both pore curvature and interfacial chemistry as key parameters for tuning confined water dynamics for optimal performance.
Supplementary Material
Acknowledgment
We gratefully acknowledge financial support for the experimental data acquisition portions of this work from the U.S. Department of Energy Basic Energy Sciences (DOE BES) grant DE-SC0010328 (S.K. and M.K.M.), and support from National Science Foundation grant NSF-1608115 (A.J. and G.L.J) for the data analysis portions. G.L.J. also acknowledges a National Defense Science and Engineering Graduate (NDSEG) Fellowship from the U.S. Department of Defense. Synchrotron SAXS analyses were conducted at Sector 12 of the Advanced Photon Source at Argonne National Laboratory, which is supported through the U.S. DOE Contract DE-AC02-06CH11357 under GUP-45013 and GUP-48102. This research used resources at the Spallation Neutron Source, a DOE Office of Science User Facility operated by the Oak Ridge National Laboratory. Portions of this work were also carried out in the Characterization Facility, University of Minnesota, which receives partial support from NSF through the MRSEC program under Award Number DMR-1420013. Research reported in this publication was supported by the Office of the Director, National Institutes of Health under Award Number S10OD011952. The content is solely the responsibility of the authors and does not necessarily represent the official views of the National Institutes of Health. We thank the Rick Goyette for logistical support during our BASIS measurement and Dr. Jose M. Borreguero for help with the MANTID program. We are also grateful to Prof. Arun Yethiraj, Dr. Sriteja Mantha, and Dr. Kenneth W. Herwig for helpful discussions regarding confined water dynamics.
Footnotes
Supporting Information. Materials and methods, deuterated amphiphile synthesis and characterization, lab-source SAXS analyses conditions, RI phase indexing, electron density reconstructions, representative QENS fitting parameters, plots of β versus q and 1/<τβ> versus q, and SUPERFLIP input files. This material is available free of charge via the Internet at http://pubs.acs.org.
The authors declare no competing financial interest.
References
- 1.Stillinger FH Water Revisited. Science 1980, 209, 451–457. [DOI] [PubMed] [Google Scholar]
- 2.Debenedetti PG; Stanley HE Supercooled and Glassy Water. Phys. Today 2003, 56, 40–46. [Google Scholar]
- 3.Soper AK Radical Re-Appraisal of Water Structure in Hydrophilic Confinement. Chem. Phys. Lett 2013, 590, 1–15. [DOI] [PMC free article] [PubMed] [Google Scholar]
- 4.Faraone A; Liu L; Mou C-Y; Shih P-C; Copley JRD; Chen S-H Translational and Rotational Dynamics of Water in Mesoporous Silica Materials: MCM-41-S and MCM-48-S. J. Chem. Phys 2003, 119, 3963–3971. [Google Scholar]
- 5.Takahara S; Sumiyama N; Kittaka S; Yamaguchi T; Bellissent-Funel M-C Neutron Scattering Study on Dynamics of Water Molecules in MCM-41. 2. Determination of Translational Diffusion Coefficient. J. Phys. Chem. B 2005, 109, 11231–11239. [DOI] [PubMed] [Google Scholar]
- 6.McDaniel JG; Mantha S; Yethiraj A Dynamics of Water in Gemini Surfactant-Based Lyotropic Liquid Crystals. J. Phys. Chem. B 2016, 120, 10860–10868. [DOI] [PubMed] [Google Scholar]
- 7.Moilanen DE; Spry DB; Fayer MD Water Dynamics and Proton Transfer in Nafion Fuel Cell Membranes. Langmuir 2008, 24, 3690–3698. [DOI] [PubMed] [Google Scholar]
- 8.Hickner MA Water-Mediated Transport in Ion-Containing Polymers. J. Polym. Sci. Pol. Phys 2012, 50, 9–20. [Google Scholar]
- 9.Geise GM; Lee H-S; Miller DJ; Freeman BD; McGrath JE; Paul DR Water Purification by Membranes: The Role of Polymer Science. J. Polym. Sci. Pol. Phys 2010, 48, 1685–1718. [Google Scholar]
- 10.Ito K; Faraone A; Tyagi M; Yamaguchi T; Chen S-H Nanoscale Dynamics of Water Confined in Ordered Mesoporous Carbon. Phys. Chem. Chem. Phys 2019, 21, 8517–8528. [DOI] [PMC free article] [PubMed] [Google Scholar]
- 11.Mauritz KA; Moore RB State of Understanding of Nafion. Chem. Rev 2004, 104, 4535–4586. [DOI] [PubMed] [Google Scholar]
- 12.Date B; Han J; Park S; Park EJ; Shin D; Ryu CY; Bae C Synthesis and Morphology Study of SEBS Triblock Copolymers Functionalized with Sulfonate and Phosphonate Groups for Proton Exchange Membrane Fuel Cells. Macromolecules 2018, 51, 1020–1030. [Google Scholar]
- 13.Park MJ; Downing KH; Jackson A; Gomez ED; Minor AM; Cookson D; Weber AZ; Balsara NP Increased Water Retention in Polymer Electrolyte Membranes at Elevated Temperatures Assisted by Capillary Condensation. Nano Lett. 2007, 7, 3547–3552. [DOI] [PubMed] [Google Scholar]
- 14.Allen FI; Comolli LR; Kusoglu A; Modestino MA; Minor AM; Weber AZ Morphology of Hydrated as-Cast Nafion Revealed through Cryo Electron Tomography. ACS Macro Lett. 2015, 4, 1–5. [DOI] [PubMed] [Google Scholar]
- 15.Luo H; Aboki J; Ji Y; Guo R; Geise GM Water and Salt Transport Properties of Triptycene-Containing Sulfonated Polysulfone Materials for Desalination Membrane Applications. ACS Appl. Mater. Interfaces 2018, 10, 4102–4112. [DOI] [PubMed] [Google Scholar]
- 16.Park HB; Freeman BD; Zhang Z-B; Sankir M; McGrath JE Highly ChlorineTolerant Polymers for Desalination. Angew. Chem. Int. Ed 2008, 47, 6019–6024. [DOI] [PubMed] [Google Scholar]
- 17.Geise GM; Freeman BD; Paul DR Characterization of a Sulfonated Pentablock Copolymer for Desalination Applications. Polymer 2010, 51, 5815–5822. [Google Scholar]
- 18.Osti NC; Etampawala TN; Shrestha UM; Aryal D; Tyagi M; Diallo SO; Mamontov E; Cornelius CJ; Perahia D Water Dynamics in Rigid Ionomer Networks. J. Chem. Phys 2016, 145, 224901. [DOI] [PubMed] [Google Scholar]
- 19.Perrin J-C; Lyonnard S; Volino F Quasielastic Neutron Scattering Study of Water Dynamics in Hydrated Nafion Membranes. J. Phys. Chem. C 2007, 111, 3393–3404. [Google Scholar]
- 20.Volino F; Pineri M; Dianoux AJ; De Geyer A Water Mobility in a Water-Soaked Nafion® Membrane: A High-Resolution Neutron Quasielastic Study. J. Polym. Sci. Pol. Phys 1982, 20, 481–496. [Google Scholar]
- 21.Pivovar AM; Pivovar BS Dynamic Behavior of Water within a Polymer Electrolyte Fuel Cell Membrane at Low Hydration Levels. J. Phys. Chem. B 2005, 109, 785–793. [DOI] [PubMed] [Google Scholar]
- 22.Hallinan DT; Elabd YA Diffusion of Water in Nafion Using Time-Resolved Fourier Transform Infrared–Attenuated Total Reflectance Spectroscopy. J. Phys. Chem. B 2009, 113, 4257–4266. [DOI] [PubMed] [Google Scholar]
- 23.Davis EM; Stafford CM; Page KA Elucidating Water Transport Mechanisms in Nafion Thin Films. ACS Macro Lett. 2014, 3, 1029–1035. [DOI] [PubMed] [Google Scholar]
- 24.Saito M; Arimura N; Hayamizu K; Okada T Mechanisms of Ion and Water Transport in Perfluorosulfonated Ionomer Membranes for Fuel Cells. J. Phys. Chem. B 2004, 108, 16064–16070. [Google Scholar]
- 25.Choi J-H; Willis CL; Winey KI Structure–Property Relationship in Sulfonated Pentablock Copolymers. J. Membr. Sci 2012, 394–395, 169–174. [Google Scholar]
- 26.Schmidt-Rohr K; Chen Q Parallel Cylindrical Water Nanochannels in Nafion Fuel-Cell Membranes. Nat. Mater 2008, 7, 75–83. [DOI] [PubMed] [Google Scholar]
- 27.Trigg EB; Gaines TW; Marechal M; Moed DE; Rannou P; Wagener KB; Stevens MJ; Winey KI Self-Assembled Highly Ordered Acid Layers in Precisely Sulfonated Polyethylene Produce Efficient Proton Transport. Nat. Mater 2018, 17, 725–731. [DOI] [PubMed] [Google Scholar]
- 28.Mezzenga R; Seddon JM; Drummond CJ; Boyd BJ; Schröder-Turk GE; Sagalowicz L Nature-Inspired Design and Application of Lipidic Lyotropic Liquid Crystals. Adv. Mater 2019, 31, 1900818. [DOI] [PubMed] [Google Scholar]
- 29.Berrod Q; Lyonnard S; Guillermo A; Ollivier J; Frick B; Manseri A; Améduri B; Gébel G Nanostructure and Transport Properties of Proton Conducting Self-Assembled Perfluorinated Surfactants: A Bottom-up Approach toward PFSA Fuel Cell Membranes. Macromolecules 2015, 48, 6166–6176. [Google Scholar]
- 30.Jackson GL; Mantha S; Kim S; Diallo SO; Herwig KW; Yethiraj A; Mahanthappa MK Ion-Specific Confined Water Dynamics in Convex Nanopores of Surfactant Liquid Crystals. J. Phys. Chem. B 2018, 122, 10031–10043. [DOI] [PubMed] [Google Scholar]
- 31.Gin DL; Bara JE; Noble RD; Elliott BJ Polymerized Lyotropic Liquid Crystal Assemblies for Membrane Applications. Macromol. Rapid Commun 2008, 29, 367–389. [Google Scholar]
- 32.Park HB; Kamcev J; Robeson LM; Elimelech M; Freeman BD Maximizing the Right Stuff: The Trade-Off between Membrane Permeability and Selectivity. Science 2017, 356, 1137–1147. [DOI] [PubMed] [Google Scholar]
- 33.Werber JR; Deshmukh A; Elimelech M The Critical Need for Increased Selectivity, Not Increased Water Permeability, for Desalination Membranes. Environ. Sci. Technol. Lett 2016, 3, 112–120. [Google Scholar]
- 34.Hyde ST, Identification of Lyotropic Liquid Crystalline Mesophases In Handbook of Applied Surface and Colloid Chemistry, Holmberg K, Ed. J. Wiley & Sons: New York, 2001; Chapter 16, Vol. 2, pp 299–332. [Google Scholar]
- 35.Jayaraman A; Mahanthappa MK Counterion-Dependent Access to Low-Symmetry Lyotropic Sphere Packings of Ionic Surfactant Micelles. Langmuir 2018, 34, 2290–2301. [DOI] [PubMed] [Google Scholar]
- 36.Baez-Cotto CM; Mahanthappa MK Micellar Mimicry of Intermetallic C14 and C15 Laves Phases by Aqueous Lyotropic Self-Assembly. ACS Nano 2018, 12, 3226–3234. [DOI] [PubMed] [Google Scholar]
- 37.Carter BM; Wiesenauer BR; Hatakeyama ES; Barton JL; Noble RD; Gin DL Glycerol-Based Bicontinuous Cubic Lyotropic Liquid Crystal Monomer System for the Fabrication of Thin-Film Membranes with Uniform Nanopores. Chem. Mater 2012, 24, 4005–4007. [Google Scholar]
- 38.Hatakeyama ES; Gabriel CJ; Wiesenauer BR; Lohr JL; Zhou M; Noble RD; Gin DL Water Filtration Performance of a Lyotropic Liquid Crystal Polymer Membrane with Uniform, Sub-1-nm Pores. J. Membr. Sci 2011, 366, 62–72. [Google Scholar]
- 39.Zhou M; Nemade PR; Lu X; Zeng X; Hatakeyama ES; Noble RD; Gin DL New Type of Membrane Material for Water Desalination Based on a Cross-Linked Bicontinuous Cubic Lyotropic Liquid Crystal Assembly. J. Am. Chem. Soc 2007, 129, 9574–9575. [DOI] [PubMed] [Google Scholar]
- 40.Hatakeyama ES; Wiesenauer BR; Gabriel CJ; Noble RD; Gin DL Nanoporous, Bicontinuous Cubic Lyotropic Liquid Crystal Networks Via Polymerizable Gemini Ammonium Surfactants. Chem. Mater 2010, 22, 4525–4527. [Google Scholar]
- 41.Tousley ME; Feng X; Elimelech M; Osuji CO Aligned Nanostructured Polymers by Magnetic-Field-Directed Self-Assembly of a Polymerizable Lyotropic Mesophase. ACS Appl. Mater. Interfaces 2014, 6, 19710–19717. [DOI] [PubMed] [Google Scholar]
- 42.Feng X; Kawabata K; Kaufman G; Elimelech M; Osuji CO Highly Selective Vertically Aligned Nanopores in Sustainably Derived Polymer Membranes by Molecular Templating. ACS Nano 2017, 11, 3911–3921. [DOI] [PubMed] [Google Scholar]
- 43.Feng X; Tousley ME; Cowan MG; Wiesenauer BR; Nejati S; Choo Y; Noble RD; Elimelech M; Gin DL; Osuji CO Scalable Fabrication of Polymer Membranes with Vertically Aligned 1 nm Pores by Magnetic Field Directed Self-Assembly. ACS Nano 2014, 8, 11977–11986. [DOI] [PubMed] [Google Scholar]
- 44.Jackson GL; Perroni DV; Mahanthappa MK Roles of Chemical Functionality and Pore Curvature in the Design of Nanoporous Proton Conductors. J. Phys. Chem. B 2017, 121, 9429–9436. [DOI] [PubMed] [Google Scholar]
- 45.Mantha S; Jackson GL; Mahanthappa MK; Yethiraj A Counterion-Regulated Dynamics of Water Confined in Lyotropic Liquid Crystalline Morphologies. J. Phys. Chem. B 2018, 122, 2408–2413. [DOI] [PubMed] [Google Scholar]
- 46.Faraone A; Liu K-H; Mou C-Y; Zhang Y; Chen S-H Single Particle Dynamics of Water Confined in a Hydrophobically Modified MCM-41-S Nanoporous Matrix. J. Chem. Phys 2009, 130, 134512. [DOI] [PubMed] [Google Scholar]
- 47.Heiney PA Datasqueeze Software. http://www.physics.upenn.edu/?heiney/datasqueeze/index.html (Accessed Sept. 21, 2018).
- 48.Kim SA; Jeong K-J; Yethiraj A; Mahanthappa MK Low-Symmetry Sphere Packings of Simple Surfactant Micelles Induced by Ionic Sphericity. Proc. Nat. Acad. Sci., U.S.A 2017, 114, 4072–4077. [DOI] [PMC free article] [PubMed] [Google Scholar]
- 49.Sorenson GP; Schmitt AK; Mahanthappa MK Discovery of a Tetracontinuous, Aqueous Lyotropic Network Phase with Unusual 3d-Hexagonal Symmetry. Soft Matter 2014, 10, 8229–8235. [DOI] [PubMed] [Google Scholar]
- 50.Perroni DV; Mahanthappa MK Inverse PmKN Cubic Micellar Lyotropic Phases from Zwitterionic Triazolium Gemini Surfactants. Soft Matter 2013, 9, 7919–7922. [Google Scholar]
- 51.Petříček V; Dušek M; Palatinus L Crystallographic Computing System JANA2006: General Features. Z. Kristallogr.-Cryst. Mater 2014, 229, 345–352. [Google Scholar]
- 52.Palatinus L; Chapuis G SUPERFLIP - a Computer Program for the Solution of Crystal Structures by Charge Flipping in Arbitrary Dimensions. J. Appl. Crystallogr 2007, 40, 786–790. [Google Scholar]
- 53.Baerlocher CM, Lynne B; Palatinus Lukas. Charge Flipping Combined with Histogram Matching to Solve Complex Crystal Structures from Powder Diffraction Data. Z. Kristallogr.-Cryst. Mater 2009, 222, 47–53. [Google Scholar]
- 54.Momma K; Izumi F VESTA 3 for Three-Dimensional Visualization of Crystal, Volumetric and Morphology Data. J. Appl. Crystallogr 2011, 44, 1272–1276. [Google Scholar]
- 55.Sarada T; Granata RD; Foley RT Properties of Trifluoromethanesulfonic Acid Monohydrate Pertinent to Its Use as a Fuel Cell Electrolyte. J. Electrochem. Soc 1978, 125, 1899–1906. [Google Scholar]
- 56.Rauch H; Waschkowski W Neutron Scattering Lengths In Neutron Data Booklet 2nd Ed Dianoux A-J and Lander G, Ed. Insititut Laue-Langevin, Grenoble, 2003, Chapter 1, pp. 9–10. [Google Scholar]
- 57.Arnold O; Bilheux JC; Borreguero JM; Buts A Campbell SI; Chapon L; Doucet M; Draper N; Ferraz Leal R; Gigg MA et al. Mantid–Data Analysis and Visualization Package for Neutron Scattering and mSR Experiments. Nucl. Instrum. Methods Phys. Res. A, 2014, 764, 156–166. [Google Scholar]
- 58.Faraone A; Fratini E; Todea AM; Krebs B; Müller A; Baglioni P Dynamics of Water in Voids between Well-Defined and Densely Packed Spherical Nanocages Acting as Polyprotic Inorganic Acids. J. Phys. Chem. C 2009, 113, 8635–8644. [Google Scholar]
- 59.Zanotti JM; Bellissent-Funel MC; Chen SH Relaxational Dynamics of Supercooled Water in Porous Glass. Phys. Rev. E 1999, 59, 3084–3093. [Google Scholar]
- 60.Spehr TL; Frick B; Zamponi M; Stuhn B Dynamics of Water Confined to Reverse AOT Micelles. Soft Matter 2011, 7, 5745–5755. [Google Scholar]
- 61.Harpham MR; Ladanyi BM; Levinger NE; Herwig KW Water Motion in Reverse Micelles Studied by Quasielastic Neutron Scattering and Molecular Dynamics Simulations. J. Chem. Phys 2004, 121, 7855–7868. [DOI] [PubMed] [Google Scholar]
- 62.Acharya DP; Kunieda H; Shiba Y; Aratani K -i. Phase and Rheological Behavior of Novel Gemini-Type Surfactant Systems. J. Phys. Chem. B 2004, 108, 1790–1797. [Google Scholar]
- 63.Gustafsson S; Quist P-O Nuclear Magnetic Resonance and X-Ray Study of a Rectangular Phase. J. Colloid Interface Sci 1996, 180, 564–573. [Google Scholar]
- 64.Faraone A; Liu L; Chen S-H Model for the Translation–Rotation Coupling of Molecular Motion in Water. J. Chem. Phys 2003, 119, 6302–6313. [Google Scholar]
- 65.Liu L; Faraone A; Chen S-H Model for the Rotational Contribution to Quasielastic Neutron Scattering Spectra from Supercooled Water. Phys. Rev. E 2002, 65, 041506. [DOI] [PubMed] [Google Scholar]
- 66.Chen SH; Liao C; Sciortino F; Gallo P; Tartaglia P Model for Single-Particle Dynamics in Supercooled Water. Phys. Rev. E 1999, 59, 6708–6714. [DOI] [PubMed] [Google Scholar]
- 67.Chen SH; Gallo P; Sciortino F; Tartaglia P Molecular-Dynamics Study of Incoherent Quasielastic Neutron-Scattering Spectra of Supercooled Water. Phys. Rev. E 1997, 56, 4231–4243. [Google Scholar]
- 68.Mantha S; Yethiraj A Dynamics of Water Confined in Lyotropic Liquid Crystals: Molecular Dynamics Simulations of the Dynamic Structure Factor. J. Chem. Phys 2016, 144, 084504. [DOI] [PubMed] [Google Scholar]
- 69.Lyonnard S; Berrod Q; Brüning BA; Gebel G; Guillermo A; Ftouni H; Ollivier J; Frick B Perfluorinated Surfactants as Model Charged Systems for Understanding the Effect of Confinement on Proton Transport and Water Mobility in Fuel Cell Membranes. A Study by QENS. Eur. Phys. J.-Spec. Top 2010, 189, 205–216. [Google Scholar]
- 70.Mills R Self-Diffusion in Normal and Heavy Water in the Range 1–45 Degrees. J. Phys. Chem 1973, 77, 685–688. [Google Scholar]
- 71.Teixeira J; Bellissent-Funel MC; Chen SH; Dianoux AJ Experimental Determination of the Nature of Diffusive Motions of Water Molecules at Low Temperatures. Phys. Rev. A 1985, 31, 1913–1917. [DOI] [PubMed] [Google Scholar]
- 72.Briman IM; Rébiscoul D; Diat O; Zanotti J-M; Jollivet P; Barboux P; Gin S Impact of Pore Size and Pore Surface Composition on the Dynamics of Confined Water in Highly Ordered Porous Silica. J. Phys. Chem. C 2012, 116, 7021–7028. [Google Scholar]
- 73.Miskowiec A; Buck ZN; Hansen FY; Kaiser H; Taub H; Tyagi M; Diallo SO; Mamontov E; Herwig KW On the Structure and Dynamics of Water Associated with Single-Supported Zwitterionic and Anionic Membranes. J. Chem. Phys 2017, 146, 125102. [DOI] [PubMed] [Google Scholar]
- 74.Collins KD Charge Density-Dependent Strength of Hydration and Biological Structure. Biophys. J 1997, 72, 65–76. [DOI] [PMC free article] [PubMed] [Google Scholar]
- 75.Brun TS; Hoiland H; Vikingstad E The Fraction of Associated Counterions and Singly Dispersed Amphiphiles in Micellar Systems from Ion Exchange Membrane Electrode Measurements. J. Colloid Interface Sci 1978, 63, 590–592. [Google Scholar]
- 76.Vlachy N; Jagoda-Cwiklik B; Vácha R; Touraud D; Jungwirth P; Kunz W Hofmeister Series and Specific Interactions of Charged Headgroups with Aqueous Ions. Adv. Colloid Interface Sci 2009, 146, 42–47. [DOI] [PubMed] [Google Scholar]
- 77.He ZM; O’Connor PJ; Romsted LS; Zanette D Specific Counterion Effects on Indicator Equilibria in Micellar Solutions of Decyl Phosphate and Lauryl Sulfate Surfactants. J. Phys. Chem 1989, 93, 4219–4226. [Google Scholar]
- 78.Jho YS; Kanduč M; Naji A; Podgornik R; Kim MW; Pincus PA Strong-Coupling Electrostatics in the Presence of Dielectric Inhomogeneities. Phys. Rev. Lett 2008, 101, 188101. [DOI] [PubMed] [Google Scholar]
- 79.McDaniel JG; Yethiraj A Coupling between the Dynamics of Water and Surfactants in Lyotropic Liquid Crystals. J. Phys. Chem. B 2017, 121, 5048–5057. [DOI] [PubMed] [Google Scholar]
- 80.Page KA; Rowe BW; Masser KA; Faraone A The Effect of Water Content on Chain Dynamics in Nafion Membranes Measured by Neutron Spin Echo and Dielectric Spectroscopy. J. Polym. Sci. Pol. Phys 2014, 52, 624–632. [Google Scholar]
- 81.Moilanen DE; Levinger NE; Spry DB; Fayer MD Confinement or the Nature of the Interface? Dynamics of Nanoscopic Water. J. Am. Chem. Soc 2007, 129, 14311–14318. [DOI] [PMC free article] [PubMed] [Google Scholar]
Associated Data
This section collects any data citations, data availability statements, or supplementary materials included in this article.


