Abstract
Sodium is the main cation in the extracellular fluid that regulates various physiological functions. Sodium-depletion in the body elevates the hedonic value of sodium taste, which drives animals toward sodium consumption 1,2. Conversely, oral sodium detection rapidly promotes satiation of sodium appetite 3,4, suggesting that chemosensory signals have a central role in sodium appetite and its satiety. Nevertheless, the neural basis of chemosensory-based appetite regulation remains poorly understood. Here, we dissect genetically-defined neural circuits in mice that control sodium intake by integrating sodium taste and internal depletion signals. We show that a subset of excitatory neurons in the pre-locus coeruleus (pre-LC) that express prodynorphin (PDYN) serve as a critical neural substrate for sodium intake behavior. Acute stimulation of this population triggered robust sodium ingestion even from rock salt by transmitting negative valence signals. Inhibition of the same neurons selectively reduced sodium consumption. We further demonstrate that peripheral chemosensory signals rapidly suppressed these sodium appetite neurons. Simultaneous in vivo optical recording and gastric infusion revealed that sensory detection of sodium, but not sodium ingestion per se, is required for the acute modulation of pre-LC PDYN neurons and satiety of sodium appetite. Moreover, retrograde virus tracing showed that sensory modulation is partly mediated by specific GABAergic neurons in the bed nucleus of the stria terminalis. This inhibitory neural population is activated upon sodium ingestion, and sends rapid inhibitory signals to sodium appetite neurons. Together, this study reveals a dynamic circuit diagram that integrates chemosensory signals and the internal need to maintain sodium balance.
The precise regulation of sodium balance is crucial for any species 1,5–9. Sodium depletion is detected by the brain through hormonal actions and visceral afferent signals, and elevates the valence of sodium taste signals 1,10. This valence shift triggers a strong motivational drive toward sodium consumption. Sodium taste also has a pivotal role for satiety of sodium appetite because oral sodium intake provides quicker satiety compared to the non-oral sodium administration (e.g., gastric sodium load) 3,4,11,12. These studies indicated the importance of sodium orosensory signals for the regulation of sodium appetite and its satiety.
Multiple brain sites including the hypothalamus, amygdala, and hindbrain regulate sodium consumption1,2. For example, sodium-depletion stimulates neurons in the lamina terminalis (LT) and hydroxysteroid dehydrogenase (HSD2)-expressing neurons in the nucleus of solitary tract (NTS) through a combinatorial action of angiotensin II or/and aldosterone, two major hormones that regulate body fluid balance 13. Recent neural manipulation studies further confirmed the contribution of LT and HSD2 neurons to sodium intake 14–16. In these studies, however, sodium appetite was only observed under water-deprived conditions 15 or with additional signaling 14,16, representing complex regulatory mechanisms of the appetite.
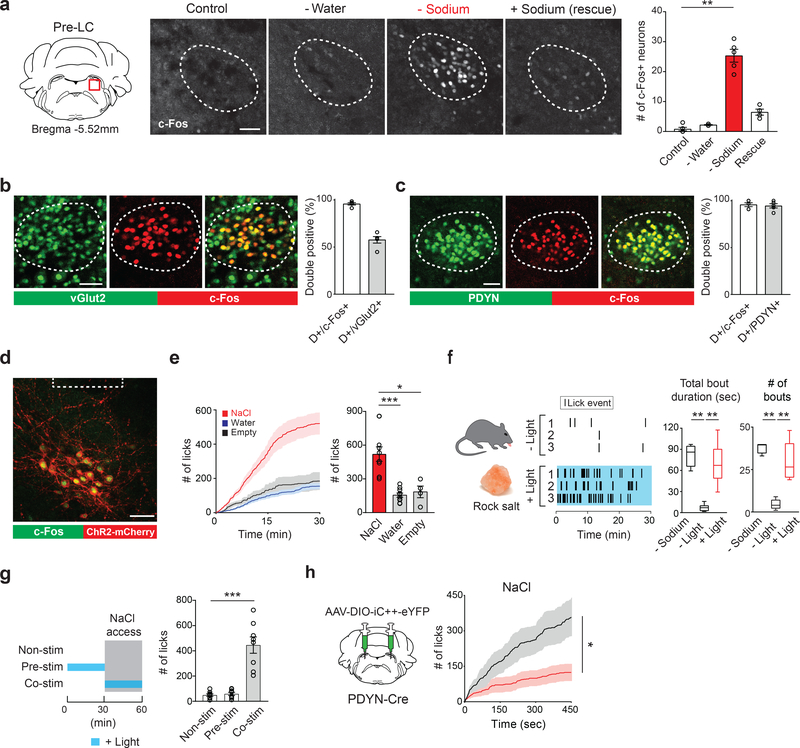
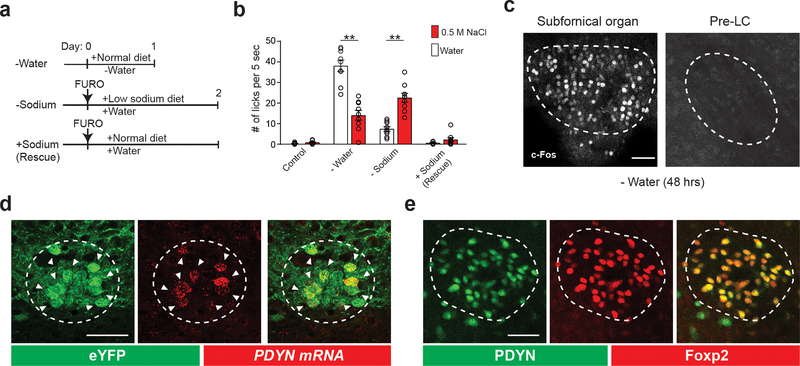
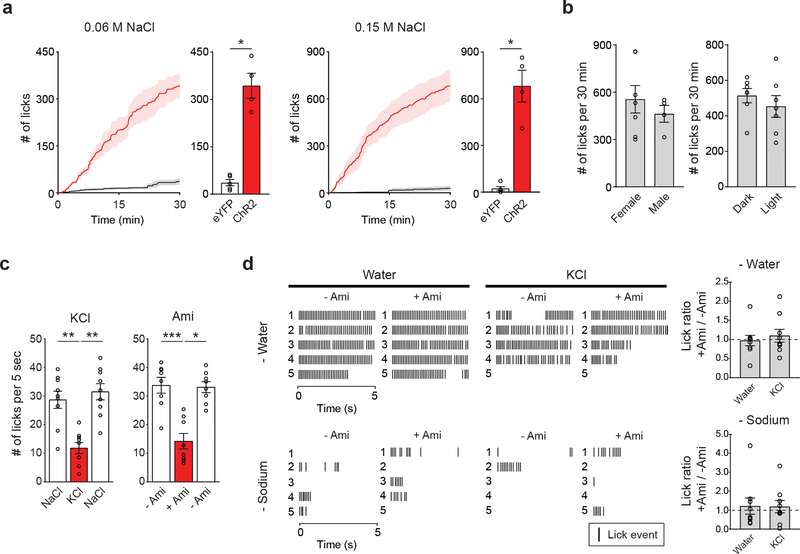
To gain a circuit-level understanding of sodium appetite, we first searched for a neural population that selectively controls sodium intake. The pre-LC is a hindbrain nucleus that receives interoceptive information from the NTS, integrates inputs from other nuclei, and relays them to the forebrain structures1. Because pre-LC neurons are activated under sodium-depletion 17, we hypothesized that this nucleus serves as a central node that controls the drive for sodium consumption. Consistent with this notion, neurons in the pre-LC strongly expressed c-Fos, a neuronal activity marker, under sodium-depletion. The activation was not observed in sated, water-deprived, or sodium-rescued animals after depletion (Fig. 1a and Extended Data Fig. 1a–c). Our histological analysis revealed that about 60% of pre-LC excitatory neurons are activated under sodium-depleted conditions (Fig. 1b). We further screened genetic markers and identified that PDYN expression faithfully (>90%) overlaps with sodium-depletion-activated neurons (pre-LCPDYN neurons, Fig. 1c and Extended Data Fig 1d). Notably, pre-LCPDYN neurons co-expressed Foxp2, a genetic marker for sodium depletion-sensitive neurons in the pre-LC 17 (Extended Data Fig. 1e). We next investigated the functional significance of these neurons for sodium appetite by gain- and loss-of-function approaches. For optogenetic activation of pre-LCPDYN neurons, we infected adeno-associated virus (AAV) encoding Cre-dependent channelrhodopsin (AAV-DIO-ChR2) into the pre-LC of PDYN-Cre animals. This neural manipulation triggered robust sodium ingestion from a high concentration of NaCl solution (0.5 M) that is normally aversive under sated conditions (Fig. 1d, e) or even from rock salt (Fig. 1f, Supplementary Video 1, and 2). Importantly, the appetite was sodium specific and was observed regardless of sex or time of the day (Extended Data Fig.2). Sodium consumption required concurrent stimulation of pre-LCPDYN neurons with sodium presentation (Fig. 1g). These data demonstrate that the ongoing activity of pre-LCPDYN neurons is required for driving sodium appetite.
Figure 1. Genetic and functional identification of sodium appetite neurons in the pre-LC.
a, c-Fos expression in sated (control), water-deprived, sodium-depleted, or sodium-repleted (rescue) animals. Quantified data are shown (n = 4 mice for rescue, n = 5 mice for other conditions). b, Sodium-depletion activates pre-LC excitatory neurons (n = 5 mice). D+ denotes double-positive. c, c-Fos expression fully overlaps with PDYN-positive neurons visualized in PDYN/Ai110 transgenic mice (n = 5 mice). d, Representative image of optic fiber placement in the pre-LC. e, Photostimulation of pre-LCPDYN neurons triggered ingestion of NaCl solution (0.5 M, n = 10 mice) compared to water (n = 10 mice) or empty spout (n = 4 mice). f, Photostimulated mice showed robust licking behavior toward rock salt (n = 4 for – Sodium and n = 8 for the rest). Raster plots of 3 out of 8 mice are shown. g, A scheme of photostimulation and sodium presentation (left panel). The number of licks for 30 min was quantified (right panel, n = 8 mice). h, Photoinhibition of pre-LCPDYN neurons by iC++ significantly reduced sodium intake (n = 7 mice). Scale bar, 50 μm.*P<0.05, **P<0.01 and ***P<0.001 by Kruskal–Wallis, Friedman test (Dunn’s multiple comparison), or two-tailed Wilcoxon test. Data presented as mean ± s.e.m. Box plots show median, quartiles (boxes), and range (whiskers).
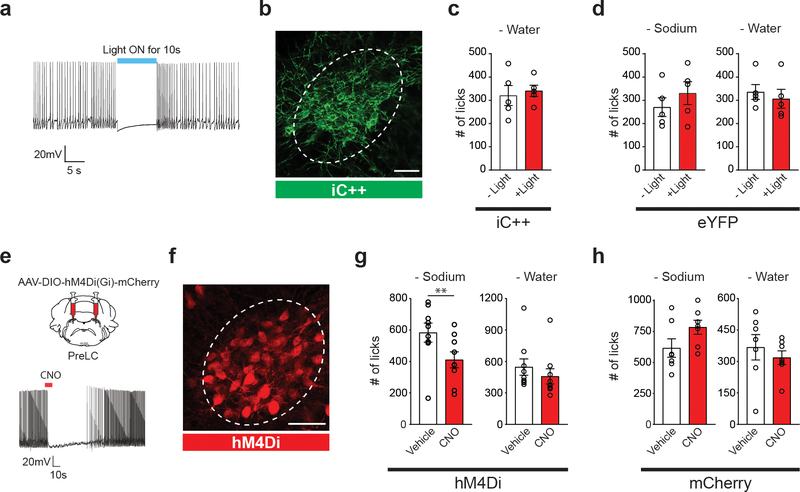
Moreover, loss-of-function studies revealed the functional necessity of pre-LCPDYN neurons for sodium appetite. Photoinhibition of pre-LCPDYN neurons specifically suppressed sodium ingestion under sodium-depleted conditions (Fig. 1h and Extended Data Fig. 3a–d). Similar results were obtained using chemogenetic inhibition (Extended Data Fig 3e–h). These gain-of-function and loss-of-function experiments demonstrate that pre-LCPDYN neurons have a critical role in sodium appetite and intake.
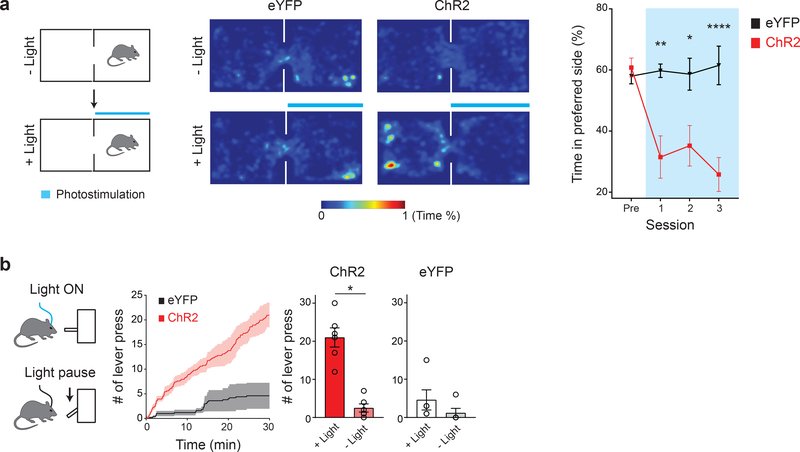
Classical behavioral studies suggest a model that nutrient deficiency evokes negative internal states, which drives animals toward consumption to alleviate such discomfort 18. To investigate whether sodium appetite neurons encode a specific valence, we used a two-chamber real-time place preference assay. We found that photostimulation of pre-LCPDYN neurons significantly reduced occupancy time in the compartment paired with light (Fig. 2a). Thus, the activation of pre-LCPDYN neurons is an aversive stimulus to animals. We next tested if animals would perform a task to reduce the aversive state mediated by pre-LCPDYN neurons. For this purpose, we used an operant assay where each lever-press pauses continuous photostimulation of the pre-LC (Fig. 2b, left panel). Indeed, animals exhibited robust lever-press behavior to stop stimulation (Fig. 2b right panel and Extended Data Fig 4). Thus, pre-LCPDYN neurons transmit a negative valence signal upon activation.
Figure 2. Activation of pre-LCPDYN neurons drives an aversive motivational signal.
a, Two-chamber real-time place preference assay (left panel). Place preference of a representative animal with or without photostimulation (middle panel). Blue bars indicate the side with light. Quantified data are shown (n = 8 mice for eYFP, n = 10 mice for ChR2). b, Negative reinforcement assay. Animals were continuously photostimulated (20 Hz) in the chamber, which was paused for 20 sec by each lever press. Cumulative and a total number of lever press were quantified (n = 5 and 6 mice for eYFP and ChR2). *P<0.05, **P<0.01, ****P<0.0001 by two-way repeated measures ANOVA (Sidak’s multiple comparisons test) or two-tailed Wilcoxon test. Data presented as mean ± s.e.m.
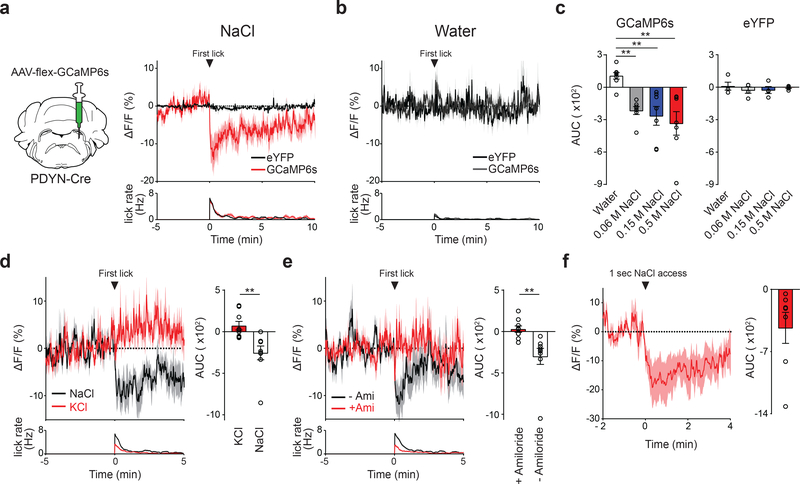
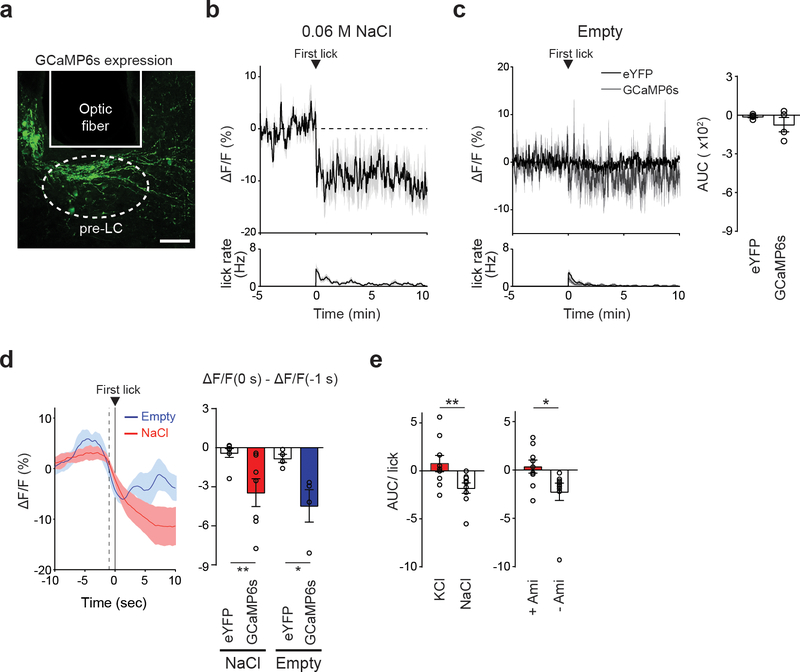
Central appetite circuits receive various sensory and behavioral modulations on a real-time basis 19–22. To investigate the regulatory mechanisms of sodium appetite neurons in vivo, we utilized fiber photometry recording from pre-LCPDYN neurons in awake animals during sodium consumption (Fig. 3a and Extended Data Fig 5a). Sodium-depleted animals were given access to various solutions while recording GCaMP6s fluorescent signals. We found that the activity of pre-LCPDYN neurons was rapidly and persistently suppressed upon sodium ingestion (Fig. 3a, c and Extended Data Fig 5b). This robust inhibition was not observed when animals licked water or an empty bottle (Fig. 3b, c, and Extended Data Fig 5c, d). We next examined if the persistent inhibition is selectively driven by chemosensory detection of sodium. In contrast to NaCl, no suppression was observed by KCl (0.5 M, Fig. 3d and Extended Data Fig 5e), excluding the possibility that the effect is induced by osmolality changes. Importantly, blocking the sodium taste receptor by amiloride 23,24 fully abolished NaCl-induced suppression of pre-LCPDYN neurons (Fig. 3e and Extended Data Fig 5e). Moreover, a brief contact to NaCl was sufficient to induce robust suppression for several minutes (Fig. 3f). These results suggest that oral chemosensory signals, likely mediated by the taste system, mediate acute modulation of sodium appetite neurons.
Figure 3. Sodium appetite neurons are rapidly modulated by sodium taste signals.
a, Photometry recording of GCaMP6s signals from pre-LCPDYN neurons (n = 7 mice for eYFP and GCaMP6s). b, No suppression was observed when the animals licked water (n = 4 and 8 mice for eYFP and GCaMP6s). c, Fluorescent change (AUC) was calculated upon consumption of water and NaCl solutions (n = 4, 7, and 7 mice for eYFP, 0.06 M, and 0.15 M NaCl, respectively). d, Ingestion of KCl did not affect pre-LCPDYN neuron activity (n = 9 mice). e, Blocking the ENaC by amiloride eliminated inhibition (n = 9 mice). f, A brief NaCl intake for 1 sec induced persistent suppression (n = 7 mice). **P<0.01 by Kruskal–Wallis test (Dunn’s multiple comparison) or two-tailed Wilcoxon test. Data presented as mean ± s.e.m.
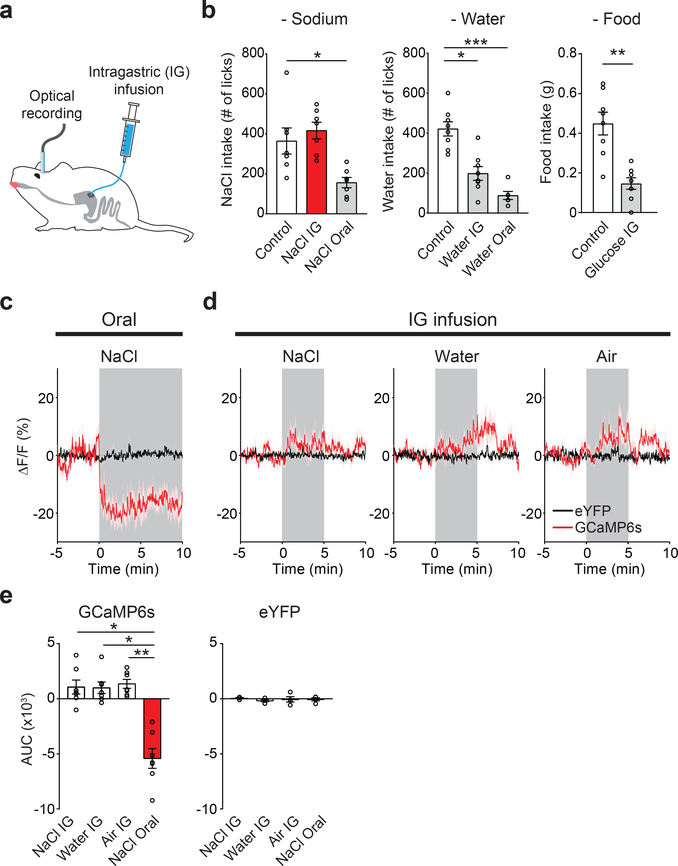
Given the functional significance of the pre-LCPDYN population for sodium intake, we hypothesized that inhibition of these neurons contributes to satiety of sodium appetite. We examined this possibility using photometry recording combined with intragastric (IG) infusion that allows sodium administration without stimulating orosensory systems (Fig. 4a). Surprisingly, we found that gastric preloading of NaCl in sodium-depleted mice did not affect subsequent sodium ingestion, whereas oral NaCl contact quickly quenched the appetite (Fig. 4b left panel). Only after a long period of IG infusion, significant appetite reduction was observed (41.3 ± 6.0 % after 2 hrs, n = 6 mice). In sharp contrast, IG water and glucose infusion in thirsty and hungry animals, respectively, suppressed water/food consumption shortly after the infusion (Fig. 4b middle and right panels). These results highlight two key aspects of satiety regulation. First, sodium chemosensory inputs are critical for rapid satiety of sodium appetite. Second, individual appetite circuits appear to receive temporally-distinct modulations from post-oral signals.
Figure 4. Oral sodium detection promotes satiety of sodium appetite by suppressing pre-LCPDYN neurons.
a, Simultaneous optical recording of pre-LCPDYN neurons and intragastric (IG) infusion. b, The effects of gastric infusion of sodium, water, and glucose (5M) on subsequent ingestive behaviors for 10 min (n = 7 mice for NaCl, n = 6 mice for water oral, n = 8 mice for controls, water IG and glucose IG). c, Oral sodium consumption suppressed pre-LCPDYN neuron s activity (n = 4 and 7 mice for eYFP and GCaMP6s). d, However, fluorescence signals were not affected by IG infusion of NaCl, water, or air. e, Quantification of c and d. *P<0.05, **P<0.01 and ***P<0.001 by Friedman, Kruskal–Wallis test (Dunn’s multiple comparison), or two-tailed Wilcoxon test. Data presented as mean ± s.e.m.
If pre-LCPDYN neurons are involved in taste-mediated satiety, we anticipated that they should be solely suppressed by oral detection of sodium. Consistent with our hypothesis, while oral NaCl consumption drastically reduced the neural activity of pre-LCPDYN neurons (Fig. 4c, e), IG infusion of NaCl in the same set of animals had no inhibitory effect (Fig. 4d, e), suggesting that oral sodium detection facilitates satiety of sodium appetite via persistent suppression of pre-LCPDYN neurons.
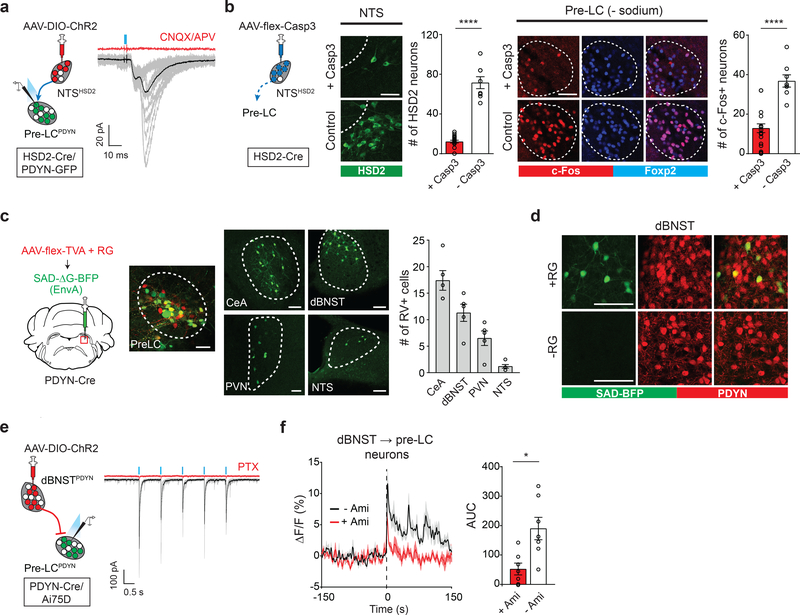
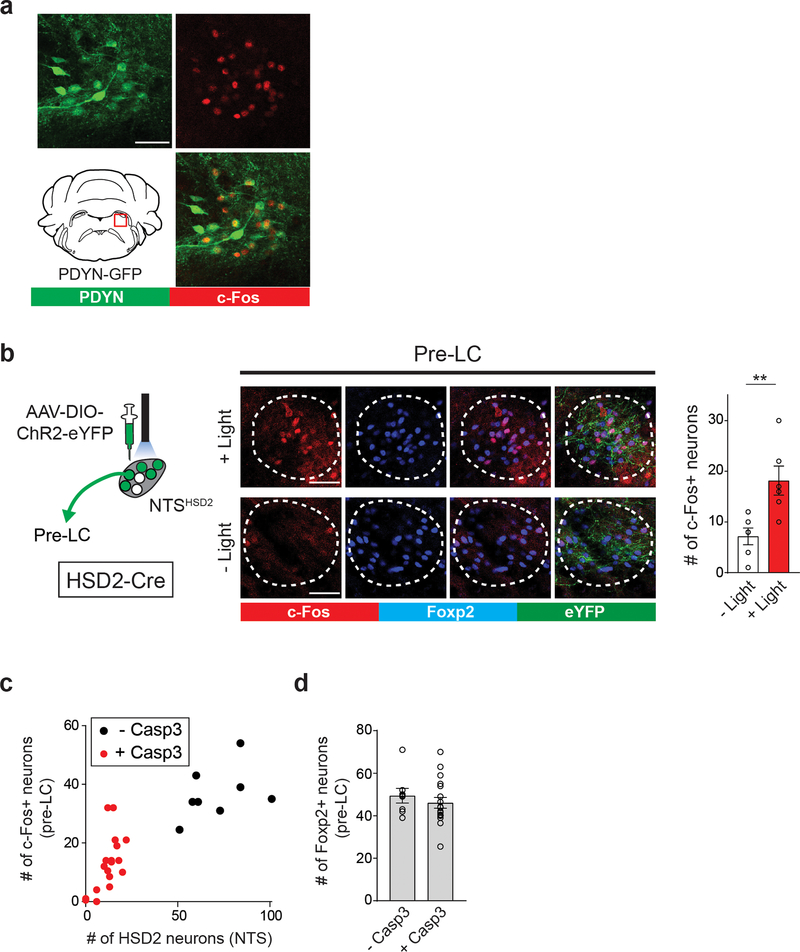
Our results indicate a model that the pre-LC integrates the internal sodium need and sensory information to regulate real-time sodium appetite. We next dissected the neural circuits carrying these signals. Because HSD2 neurons in the NTS (NTSHSD2) project to the pre-LC 14,16,25, we tested if pre-LCPDYN neurons directly receive the interoceptive information from the NTS. Using ChR2-assisted circuit mapping (Fig. 5a and Extended Data Fig. 6a), we found that a majority of recorded pre-LCPDYN neurons received monosynaptic excitatory inputs from NTSHSD2 neurons. We further examined the functional significance of this connection for pre-LC activity. Optogenetic stimulation of NTSHSD2 neurons activated pre-LCPDYN neurons in sated animals (Extended Data Fig. 6b). Conversely, ablation of NTSHSD2 neurons by caspase greatly attenuated c-Fos expression in pre-LCPDYN neurons after sodium-depletion (Fig. 5b and Extended Data Fig. 6c, d). These data demonstrate that the excitatory NTSHSD2→ pre-LCPDYN connections are necessary and sufficient to activate pre-LCPDYN neurons under sodium-depletion.
Figure 5. Pre-LCPDYN neurons receive both homeostatic and sensory inputs.
a, NTSHSD2 neurons send monosynaptic inputs to pre-LCPDYN neurons (23/38 neurons) with an EPSC latency 6.3 msec. b, Ablation of NTSHSD2 by AAV-flex-Casp3 (left panels) drastically reduced the pre-LC activity under sodium depletion (right panels, n = 18 from 9 mice for + Casp3, and n = 8 from 4 mice for – Casp3). Pre-LCPDYN neurons were visualized by Foxp2 immunostaining. c, Monosynaptic rabies tracing from pre-LCPDYN neurons (left panel). Representative images of the pre-LC, CeA, dBNST, PVN, and NTS (middle panels), and the number of SAD-positive neurons (right panel) was quantified (n = 5 mice). d, Monosynaptic dBNSTPDYN → pre-LCPDYN projections. A magnified image from c showing that SAD-ΔG-BFP overlaps with PDYN expression in the dBNST (upper panels, 71.7 ± 6.8%, n = 5). Control tracing experiments without RG are shown (bottom panels). e, Monosynaptic inhibitory connections of dBNSTPDYN → pre-LCPDYN (28/44 neurons) with an IPSC latency of 7 msec. f, GCaMP6s was retrogradely delivered to dBNST → pre-LC neurons by infecting CAV-Cre in the pre-LC and AAV-flex-GCaMP6s in the dBNST. Shown are calcium responses of dBNST → pre-LC neurons toward sodium with or without amiloride (n = 7 mice). Scale bar, 50 μm. *P<0.05, ****P<0.0001 by two-tailed Wilcoxon or two-tailed Mann-Whitney test. Data presented as mean ± s.e.m.
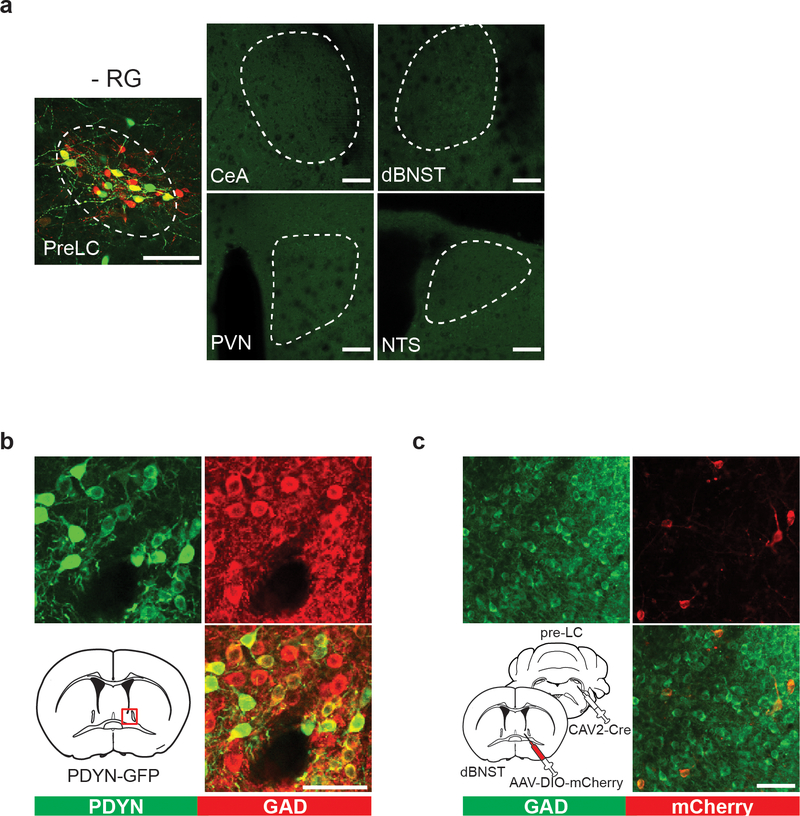
We further searched for neural circuits that mediate chemosensory-dependent inhibition by monosynaptic rabies tracing (SAD-ΔG-BFP) from pre-LCPDYN neurons. These tracing experiments identified several brain regions with most prominent inputs from the dorsal area of the bed nucleus of the stria terminalis (dBNST), and the central amygdala (Fig. 5c and Extended Data Fig. 7a). Because the BNST was previously shown to contribute to sodium consumption 15,26, we focused our functional analysis on the dBNST→pre-LC circuit. In dBNST, a majority of RV-positive neurons were the inhibitory population that also expressed PDYN (dBNSTPDYN, Fig. 5d and Extended Data Fig. 7b). We confirmed in slice recording that dBNSTPDYN neurons send monosynaptic inhibitory inputs to pre-LCPDYN neurons (Fig. 5e). If this dBNST→ pre-LC circuit mediates rapid satiety signals, dBNST neurons should be activated upon sodium ingestion. To test this idea, we infected canine adenovirus (CAV2)-Cre in the pre-LC and AAV-flex-GCaMP6s in the dBNST in order to label dBNST→ pre-LC neurons (Extended Data Fig. 7c). As anticipated, optical recording from dBNST→ pre-LC neurons demonstrated that they responded upon NaCl intake under sodium-depleted conditions, which were strongly inhibited by amiloride (Fig. 5f). Taken together, our results show that pre-LCPDYN neurons integrate sensory and internal information through multiple excitatory and inhibitory inputs.
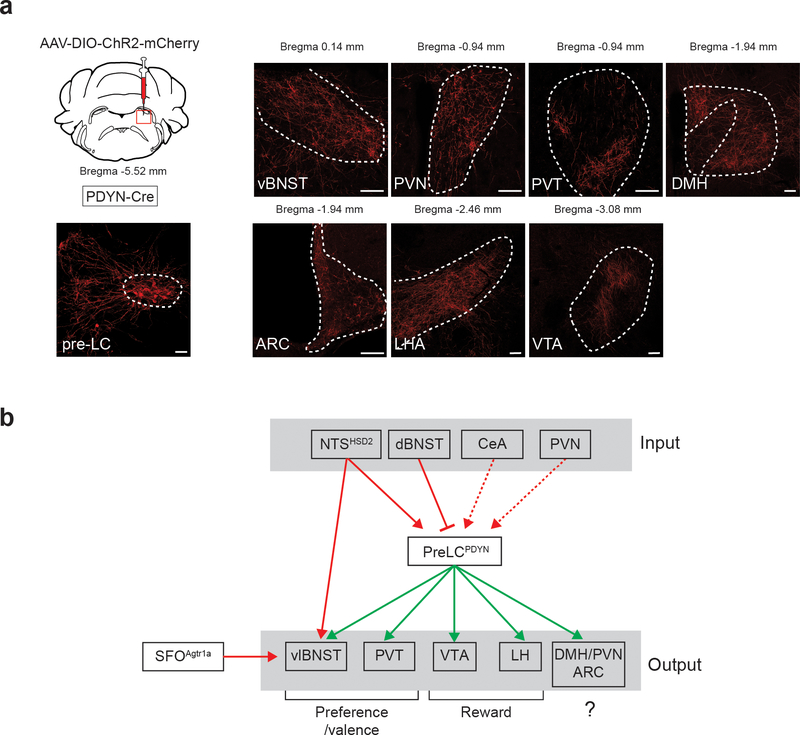
In this study, we dissected the neural circuitry that controls sodium appetite and consequent ingestive behavior. Extensive studies in the past decade have shown that sodium intake is regulated by multiple hindbrain and forebrain structures including the NTS, BNST, and amygdala 1. Interestingly, pre-LCPDYN neurons are anatomically connected to these structures (Fig. 5c and Extended Data Fig. 8) suggesting their integral roles for sodium appetite. At the molecular level, the central opioid signaling has been shown as a key regulator of sodium intake 27. Because pre-LCPDYN neurons express PDYN, a precursor of κ-opioid receptor agonists, understanding the action of dynorphin at downstream sites may provide novel molecular insights for appetite regulations.
Recent in vivo analyses of appetite circuits in rodents revealed that ingestive behaviors rapidly modulate appetite circuits prior to nutrient absorption in the body 28. Thirst, hunger, and sodium appetite neurons are all inhibited upon ingestion of nutrients in need, whereas the underlying mechanisms appear to be different for individual appetites. Hypothalamic hunger neurons are acutely suppressed by food anticipation as well as nutrient detection in the gut 29,30. Conversely, thirst neurons are inhibited by liquid-gulping motion and post-oral osmolality changes 19. This study revealed another aspect of appetite regulation: chemosensory signals. Our circuit analysis revealed that pre-LCPDYN neurons receive multiple inputs from upstream neural populations, although not directly from gustatory regions of the NTS. Defining the genetic identity of these populations and their interactions in the pre-LC would provide further insights for homeostatic and chemosensory regulations of the innate drive toward sodium consumption.
METHODS
Animals
All procedures followed animal care guidelines from NIH for the care and use of laboratory animals and California Institute of Technology Institutional Animal Care and Use Committee (1694–14). Animals at least six weeks old were used for experiments. The following mice were purchased from the Jackson Laboratory: C57BL/6J, stock number 00064. Slc17a6-Cre, stock number 016963. Ai75D, stock number 025106, Ai3, stock number 007903. HSD2-Cre mice were provided by A. and G. Fejes-Tóth (Dartmouth Medical School). PDYN-GFP mice were provided by D. Kong (Tufts University School of Medicine). PDYN-Cre mice were provided by B. Lowell (Harvard Medical School) and M. Krashes (NIH). Ai110 line was provided by D. Anderson (Caltech). Mice were housed on a 13 h: 11h light: dark cycle with ad llbitum access to food and water except for specific depletion experiments (water, food, sodium). Male and female mice were used for experiments.
Viral constructs
The following AAV viruses were purchased from the UNC Vector Core AAV1-CAG-flex-RG (3.0 × 10¹² genome copies per ml), AAV1-EF1a-flex-TVA-mCherry (6.0 × 10¹² genome copies per ml), AAV2-EF1a-DIO-eYFP (4.6 × 10¹² genome copies per ml), AAV1-EF1a-DIO-ChR2-mCherry (5.1 × 10¹² genome copies per ml), AAV5-Ef1a-DIO iC++-eYFP (4.5 × 10¹² genome copies per ml), AAV5-flex-taCasp3-TEVp (4.5 × 10¹² genome copies per ml). The following AAV viruses were purchased from the UPenn virus core, AAV1-hSyn1-flex-GCaMP6s-WPRE-SV40 (2.28 × 10¹³ genome copies per ml), AAV5-EF1a-DIO-ChR2-eYFP (3.3 × 10¹³ genome copies per ml), AAV1-EF1a-DIO-ChR2-mCherry (2.0 × 10¹³ genome copies per ml). The following AAV viruses were purchased from Addgene, AAV8-hSyn-DIO-hM4D(Gi)-mCherry (1.9 × 10¹³ genome copies per ml), AAV5-hSyn-DIO-mCherry (1 × 10¹³ genome copies per ml), AAV8-Ef1a-DIO-iC++-eYFP (8.5 × 10¹³ genome copies per ml) was purchased from the Stanford Virus vector core. SAD- ΔG-BFP (1.7 × 10⁹ genome copies per ml) was purchased from Salk. CAV-Cre (1.5 × 10¹³ genome copies per ml) was purchased from Plateforme de Vectorologie de Montpellier (PVM).
Surgery
Mice were anaesthetized with a mixture of ketamine (1 mg/mL) and xylazine (10 mg/mL) in isotonic saline, intraperitoneally injected at 10 μl /g body weight. Ketoprofen was subcutaneously administered at 5 μl /g body weight. The animal was placed in a stereotaxic apparatus (Narishige Apparatus) with a heating pad. Surgery was performed as previously described 8. The three-dimensional MRI coordinate system was used as a reference for the injection site coordinates. Viral constructs were injected using a microprocessor-controlled injection system (Nanoliter 2000, WPI) at 100 nl /min. The coordinates for pre-LC are AP: −9000, ML: ±1000, DV: −3900 (60–100 nl injection), for dBNST are AP: −3100 ML: 1100 DV: −3600 (100 nl injection), for NTS are AP: −10800 ML: ±150 DV: −5100, −5300 (100–300 nl injection each).
For optogenetic experiments, implants were made with a 200 μm fiber bundle (FT200EMT, Thorlabs) glued to a ceramic ferrule (CF230 or CFLC230, Thorlabs). For photometry, customized implants (400 μm diameter, Doric Lenses) were used. A fiber implant was placed 200–300 μm (for optogenetic) or 0–50 μm (for photometry) above the virus injection site. Histology position of fiber implant was confirmed after data collection. Data from implant disposition was not included. For IG infusion, catheter construction and implantation closely followed as described previously 31,32. IG catheters were custom made using silastic tubing (Dow Corning, 508–002), tygon tubing (Instech, BTPE-25) and pinport (Instech, PNP3F25–50). For photometry recording, IG surgery was performed after animals recovered from the initial implantation of an optic fiber. After surgery, all animals were placed in a clean cage placed on a heating pad overnight and then were housed in the animal facility. Behavioral and histological assays were performed after at least 10 days of recovery. For ablation experiments, AAV-flex-taCasp3-TEVp or AAV-hSyn-DIO-mCherry (control) was injected. These animals were sodium-depleted after 2–3 weeks of recovery. At the end of experiments, all animals were sacrificed for histological examination. For fiber implantation experiments, we occasionally observed that the position of an implanted fiber shifted in the hindbrain due to cranial deformation.
Optogenetic and chemogenetic manipulations
For ChR2 photostimulation. 473 nm laser pulses (20ms, 20Hz) were delivered via an optic cable (MFP-FC-ZF, Doric Lenses) using a pulse generator (Sapphire 9200 from Quantum composers or SYS-A310 from WPI). The laser intensity was maintained at 5–10 mW at the tip of the fiber. Unless otherwise noted, photostimulation was delivered for 1 s at 3 s intervals throughout the behavior session. For iC++ photoinhibition33, 473 nm laser was continuously turned on throughout the session at 3 mW at the tip of the fiber. For chemogenetic manipulation34 (Extended Data Fig.3e–h), CNO (Sigma, 10 mg/kg) or vehicle (water) was administered intraperitoneal 20 min before the sodium consumption experiment.
Preference assay
To induce sodium appetite, animals were injected with furosemide (Sigma) at a dose of 50mg/kg body weight. Low sodium diet (TD. 90228, ENVIGO) was provided for 2 days after the injection of furosemide. For water-restriction experiments, animals were kept in their home cage without water, and were provided with 1 mL of water daily. For food restriction experiments, animals were deprived of food up to 24 hrs with normal water provided. All assays were performed in a custom gustometer (Dialog Instruments) or Biodaq monitoring system (Research Diets Inc) 19,23,35. All sodium-depleted animals were trained in a gustometer before experiments. Animals which licked at least 150 licks during the 30-min session were used for further behavioral assays. After every sodium-depletion round, animals were recovered for at least 4 days with the normal diet.
For appetite specificity assay (Extended Data Fig 2c), three different solutions were presented to animals during the same session, and their preference was measured as a lick number. For each trial, 20 sec of photostimulation was delivered to the animal with an inter-trial-interval of 60 secs. We used water, 0.5 M KCl, 0.5 M NaCl, or 0.5 M NaCl + 30 μM amiloride for preference assay. For sodium consumption assay (Fig. 1e, g, and h), animals were given ad libitum access to 0.5 M NaCl, water or an empty spout for either 7.5 or 30 min.
For photometry recording, animals were given either 5 or 10 min access to stimuli. To examine sodium specific responses of pre-LCPDYN neurons (Fig. 3d, e), animals were presented with three solutions during the session. First, animals were given 5 min access to 0.5 M KCl (Fig. 3d) or 0.5 M NaCl + 0.1 mM amiloride (Fig. 3e). Then animals had 5 min access to water. Finally, animals were given 5 min access to 0.5 M NaCl. The interval between trials was 5 min.
Rock salt intake behavioral assay
Sodium-depleted animals were acclimatized for 1 hour in an acrylic box (50 cm X 25 cm X 25 cm) with a rock salt (Halite Himalayan Crystal Salt). Then the lick events of rock salt were monitored for 30 min using a webcam under sated, sodium depleted, or photostimulated conditions. The start and end of bouts were manually annotated and quantified.
Real-time place preference
Real-time place preference was performed in a two-chamber acrylic box (50 cm x 25cm x 25cm) as described previously 36. Each side of the chamber had distinct visual and textural cues (different size and shape of holes of plastic bin). A custom MATLAB code was used for real-time optogenetic stimulation and analyzing the place preference. The initial preference for each animal was determined during the initial 30-min session without photostimulation, which was followed by three test sessions with photostimulation. Light (20Hz, 5s ON 5s OFF) was delivered through an optic fiber in the initially-preferred side.
Negative reinforcement assay
To examine if appetite neurons transmit negative valence 37,38, animals were first acclimatized in the operant conditioning chamber (MedAssociate). After acclimatization, the animals were trained to press the lever to avoid negative stimulus (foot shock at 0.15–0.18 mV). Each lever press paused the foot shock for 20 sec. Training was completed when an animal pushed the lever more than 20 times during the 30-min session. In a test session, animals were given continuous 20 Hz photostimulation to the pre-LC, which was paused for 20 sec by each lever press. The number of lever presses during the session was quantified.
Intragastric infusion
In Fig. 4b, 0.5 M NaCl, deionized water, or glucose solution (5 M) was infused via an intragastric catheter. Solutions were delivered at 0.1 ml/ min for 5 min (water and sodium) or 10 min (food) using an infusion syringe pump (NE-300, New Era Pump Systems Inc). 10 min after gastric infusion, animals were given access to nutrients and their consumption was quantified for 10 min (for water and 0.5 M NaCl), or 30 min (for normal chow). Either air infusion (for water), or water infusion (for sodium and food) was used as a control stimulus. In Fig. 4d, either 0.15 M NaCl, water, or air was infused at a rate of 0.1 ml/ min while recording the neural activity by photometry. For control, oral ingestion (Fig. 4c), the same set of animals were given access to 0.15 M NaCl.
Fibre photometry
For all photometry assays, animals were acclimatized for 10–15 min in the chamber before stimuli were presented. Bulk fluorescence signals were collected using fibre photometry as previously described 19,39. Briefly, data were extracted and subjected to a low-pass filter at 1.8 Hz. A linear function was used to scale up the 405-nm channel signal to the 490-nm channel signal to obtain the fitted 405-nm signal. The resultant ΔF/F was calculated as (raw 490 nm signal – fitted 405 nm signal)/ (fitted 405 nm signal). ΔF/F was then time-binned by a factor of 2.5 times the sampling frequency and down-sampled to 10 Hz. For all bouts, the mean fluorescence for 5 min before the first lick was calculated and subtracted from the entire session. The licks from the lickometer were simultaneously recorded. The area under the curve (AUC) was quantified by integrating the baseline-subtracted fluorescence signals for 30 sec after the start of the bout. For Extended Data Fig 5d, the data were quantified as ΔF/F change between 1 sec prior to, and at the first lick (0 sec). For IG infusion experiments (Fig. 4e), AUC was quantified during the 5-min of infusion.
Retrograde Viral tracing
For monosynaptic rabies tracing 40 of pre-LCPDYN, 100 nl of a mixture of AAV1-CAG-flex-RG and AAV1-EF1a-flex-TVA-mCherry (4:1 ratio) was injected to the pre-LC. Two weeks later, 200 nl of SAD-ΔG-BFP was injected into the pre-LC. The mice were euthanized a week later.
To label the dBNST→pre-LC circuit, 100nl of CAV-Cre was injected into the pre-LC followed by the injection of AAV5-DIO-mCherry or AAV1-flex-GCaMP6S into the dBNST. These animals were used for experiments at least two weeks after the injection.
Histology
Mice were anaesthetized and were perfused with PBS followed by 4% PFA in PBS (pH 7.4). The brain was dissected and fixed in 4% PFA at 4 °C for overnight. Fixed samples were sectioned into 100 μm coronal sections using a vibratome (Leica, VT-1000 s). For immunohistochemistry (IHC), brain sections were incubated in a blocking buffer (10% Donkey serum, 0.2% Triton-X) for 1–2 hrs. Then sections were incubated with primary antibodies diluted in blocking buffer: goat anti-c-Fos (1:500, Santa Cruz, SC-52G), rabbit anti-c-Fos (1:1000, Millipore ABE457), rabbit anti-GAD65+GAD67 (1:500, Abcam, ab183999), chicken anti-GFP (1:1000, Abcam, ab13970), rat anti-mCherry (1:500, Thermo Fisher, M11217), sheep anti-Foxp2 (1:2000, R&D systems, AF5647), and rabbit anti-HSD211β2 (1:300, proteintech, 14192–1-AP). Samples were incubated with primary antibodies overnight. After washing three times with PBS, the sections were incubated with secondary antibodies (1:500 dilutions, Jackson laboratory) in blocking buffer for 4 h. For an exception, GAD65+GAD67 staining was performed without Triton-X. Fluorescence in situ hybridization (FISH) was carried out in frozen brain sections using the RNAscope fluorescent multiplex kit (Advanced Cell Diagnostics) following the manufacturer’s instructions. IHC staining was applied for eYFP after FISH.
Slice electrophysiology
250-μm coronal slices were obtained using a vibratome (VT-1000s, Leica) in ice-cold sucrose-aCSF (artificial cerebrospinal fluid) solution (Sucrose 213, KCl 2.5, NaH2PO4 1.2, NaHCO3 25, glucose 10, MgSO4 7, CaCl2 1, in mM at pH 7.3), and then incubated in HEPES-holding aCSF (NaCl 92, KCl 2.5, NaH2PO4 1.2, NaHCO3 30, HEPES 20, glucose 25, Na-ascorbate 5, thiourea 2, Na-pyruvate 3, MgSO4 2, CaCl2 2, in mM at pH 7.3–7.4). Slices were recovered at 34.5 °C for 45 min and then held at room temperature until use.
For patch-clamp recording, slices were placed in a recording chamber perfused with aCSF (NaCl 124, KCl 2.5, NaH2PO4 1.2, NaHCO3 25, glucose 10, MgSO4 1, CaCl2 2, in mM, at pH 7.3) on an upright microscope (Examiner.D1, Zeiss). Whole-cell recordings were achieved using glass pipettes (5–8 MΩ) filled with intracellular solution (for DREADD and iC++ experiments, K-gluconate 145, NaCl 2, KCl 4, HEPES 10, EGTA 0.2, Mg-ATP 4, Na-GTP 0.3; for GABAergic postsynaptic currents, CsCl 145, NaCl 2, HEPES 10, EGTA 0.2, QX-314 bromide 5, Mg-ATP 4, Na-GTP 0.3, in mM at pH 7.25; for glutamatergic postsynaptic currents, Cs(CH3)SO3 145, NaCl 2, HEPES 10, EGTA 0.2, QX-314 bromide 5, Mg-ATP 4, Na-GTP 0.3, in mM, at pH 7.25). Electrical signals were filtered at 3k Hz with Axon MultiClamp 700B (Molecular Devices) and collected at 20 kHz with Axon Digidata 1550A (Molecular Devices).
To obtain light-evoked responses, the light beam from an LED light source (X-Cite 120LED, Excelitas Technologies) was delivered through an optical filter (475/30) and then 40x water-immersion objective (Zeiss) onto neurons. For iC++ experiments, the light was turned on continuously for 10s, while for DREADD experiments, 10 μM CNO was puffed (10 sec) using a glass pipette. For CRACM experiments 41, 2-msec light pulses were given either 5 times at 1 Hz for 4 cycles or 1 time for 20 cycles. To verify GABAergic connections, picrotoxin (PTX, 100 μM) was applied through perfusion, whereas for glutamatergic connections, 6-Cyano-7-nitroquinoxaline-2,3-dione (CNQX, 10 μM) and DL-2-Amino-5-phosphonopentanoic acid (APV, 25 μM) were used.
Data and code availability
Data and code is available from the corresponding author upon reasonable request.
Extended Data
Extended Data Figure 1. Behavioral paradigms for sodium appetite induction and histological analysis of the pre-LC.
a, Experimental protocols for inducing thirst and sodium appetite. Intraperitoneal injection of furosemide (50 mg/kg body weight) was used to induce sodium appetite. b, Sodium-depleted animals showed a strong preference for sodium while water-deprived animals preferred water over sodium (n = 9 mice). c, Water-deprivation for 48 hrs induced robust c-Fos expression in the subfornical organ. However, it did not activate the pre-LC (one out of 4 mice). d, Fluorescence in situ hybridization (FISH) showing that PDYN-Cre expression (visualized in Ai3 transgenic line, green) overlaps with endogenous PDYN transcripts in the pre-LC (red, one out of 2 mice). e, Pre-LCPDYN neurons also overlap with Foxp2 expression, a known marker in the pre-LC 42,43 (93.8 ± 1.1%, n = 3 mice). Scale bar, 50 μm. **P<0.01 by two-tailed Wilcoxon test. Data presented as mean ± s.e.m.
Extended Data Figure 2. Sodium appetite induced by the photostimulation of pre-LCPDYN neurons.
a, Photostimulation of pre-LCPDYN neurons increased intake of a lower concentration of NaCl (0.06 M and 0.15 M, n = 5 mice for eYFP, n = 4 mice for ChR2). b, Photostimulation triggered sodium appetite in both sexes (left panel, n = 7 for female, n = 4 mice for male), at any time of the day (right panel, n = 7 mice). Data were partially reanalyzed from Fig. 1e and g. c, Pre-LCPDYN-stimulated animals preferred NaCl over KCl (left panel, n = 9 mice). NaCl consumption was reduced in the presence of amiloride (right panel, n = 8 mice). 0.5 M solutions were used for NaCl and KCl. d, Representative plots showing lick events during the 5-sec of water or KCl access (left panels). The effect of amiloride on water and KCl intake was quantified under water-deprivation and sodium-depletion (right panels). The total number of licks from 5 trials with amiloride was averaged and divided by that without amiloride (n = 9 mice). *P<0.05, **P<0.01, ***P<0.001 by two-tailed Mann-Whitney test or Friedman test (Dunn’s multiple comparison). Data presented as mean ± s.e.m.
Extended Data Figure 3. Optogenetic and chemogenetic inhibition of pre-LCPDYN neurons.
a, Electrophysiological recording in fresh brain slices. Illumination of 473 nm light strongly suppressed firing of pre-LCPDYN neurons expressing iC++ (10 out of 10 neurons from 2 mice). b, A representative image of AAV-DIO-iC++-eYFP expression in the pre-LC of a PDYN-Cre animal (one out of 7 mice). c, Suppression of pre-LCPDYN did not affect water intake in water-deprived animals (n = 5 mice). d, AAV-DIO-eYFP controls for optogenetic inhibition (n = 5 mice). e, AAV-DIO-hM4Di-mCherry was bilateral injected into the pre-LC. A representative recording demonstrates chemogenetic inhibition of pre-LCPDYN neuron by CNO (13 out of 14 neurons from 2 mice). f, A representative image of AAV-DIO-hM4Di-mCherry expression in the pre-LC (one out of 9 mice). g, Chemogenetic inhibition of pre-LCPDYN neurons reduced sodium intake in sodium-depleted animals. The same manipulation did not affect thirst (n = 9 mice). h, CNO administration did not affect thirst or sodium appetite in AAV-DIO-mCherry injected animals (n = 7 mice). Scale bar, 50 μm. **P<0.01 by two-tailed Wilcoxon test. Data presented as mean ± s.e.m.
Extended Data Figure 4. Training paradigm for negative reinforcement assay.
a, A diagram of training paradigm using foot shock. Each lever press pauses continuous foot shock for 20 sec. b, A total number of lever press in each condition during the 30-min session (n = 5 for eYFP and n = 6 mice for ChR2). c, Animals were conditioned to perform lever press without foot shock pre-training sessions (n = 6 mice). *P<0.05 by two-tailed Wilcoxon test. Data presented as mean ± s.e.m.
Extended Data Figure 5. In vivo activity of pre-LCPDYN neurons upon ingestive behaviors.
a, Placement of an implanted optic fiber and GCaMP6s expression in the pre-LC. Scale bar, 50 μm. b, A low concentration of NaCl exhibited inhibitory effects on pre-LCPDYN neurons (0.06 M, n = 7 mice). c, Licking empty spout had no inhibitory effect on pre-LCPDYN neurons (n = 4 mice for eYFP, n = 4 mice for GCaMP6s). d, Peristimulus time histogram of GCaMP signals around the start of sodium ingestion. Data were magnified from c and Fig. 3a. Fluorescence changes (ΔF/F) from −1 to 0 sec was calculated. e, Activity change per lick was quantified for Fig. 3d and 3e. *P<0.05, **P<0.01 by two-tailed Wilcoxon or two-tailed Mann-Whitney test. Data presented as mean ± s.e.m.
Extended Data Figure 6. Functional analysis of the NTSHSD2→ pre-LCPDYN connections.
a, Functional validation of PDYN-GFP transgenic animals. Similar to PDYN-Cre line, GFP-positive neurons in the pre-LC mice were activated by sodium-depletion in PDYN-GFP mice (One out of 2 mice). b, A diagram of optogenetic stimulation of HSD2 neurons. Foxp2-positive pre-LC neurons express c-Fos after HSD2 stimulation (n = 6 hemispheres from 3 mice). c, Relationship between the number of HSD2 neurons in the NTS and c-Fos-positive neurons in the pre-LC. >95% of c-Fos-positive neurons expressed Foxp2. d, Number of Foxp2-positive neurons was not affected by the ablation of HSD2 neurons (n = 18 hemispheres from 9 mice for + Casp3, and n = 8 hemispheres from 4 mice for – Casp3). Scale bar, 50 μm. **P<0.01 by two-tailed Wilcoxon test. Data presented as mean ± s.e.m.
Extended Data Figure 7. Histological analysis of putative upstream brain structures of pre-LCPDYN neurons.
a, Control monosynaptic tracing experiments without RG (One out of 3 mice). Scale bar, 100 μm. b, A majority of PDYN neurons in the dBNST (green) are inhibitory neurons (red, 77.3 ± 1.7%, n = 3 mice). c, CAV-2 positive neurons in the dBNST retrogradely labeled from the pre-LC (red) were inhibitory neurons (One out of 3 mice). Scale bar, 50 μm. The mouse brain in this figure has been reproduced from the mouse brain atlas44.
Extended Data Figure 8. Downstream projections of pre-LCPDYN neurons.
a, PDYN-Cre mice were injected with AAV-DIO-ChR2-mCherry into the pre-LC. Representative axonal projections are shown (one out of six mice). Arc, arcuate nucleus; vBNST, ventral bed nucleus of the stria terminalis; DMH, dorsomedial hypothalamic nucleus; LH, lateral hypothalamus; PVN, paraventricular hypothalamic nucleus; PVT, paraventricular thalamic nucleus; VTA, ventral tegmental area. Scale bar, 50 μm. b, A wiring diagram of upstream and downstream neural connections of pre-LCPDYN neurons. It is feasible that the VTA and LH process the reward aspect of sodium appetite 45,46, while BNST and PVT may regulate preference and valence toward sodium 47,48. Besides the hindbrain, the BNST also receive interoceptive information from SFO neurons that express angiotensin receptor 15.
Supplementary Material
Acknowledgements
We thank the members of the Oka laboratory and D.J. Anderson for helpful discussion0020and comments. We thank B. Lowell and M. Krashes for generously sharing PDYN-Cre mice, A. Fejes-Toth for HSD2-Cre mice, and Y. Peng for real-time mouse tracking software. This work was supported by Startup funds from California Institute of Technology. Y.O. is supported by the Searle Scholars Program, the Mallinckrodt Foundation, the McKnight Foundation and the Klingenstein-Simons Foundation, and NIH (R56MH113030, R01NS109997). D.K. is supported by NIH (R01 DK108797 and R01 NS107315). H.E. is supported by the Japan Society for the Promotion of Science.
Footnotes
The authors declare no competing financial interests.
REFERENCES
- 1.Geerling JC & Loewy AD Central regulation of sodium appetite. Exp Physiol 93, 177–209, doi: 10.1113/expphysiol.2007.039891 (2008). [DOI] [PubMed] [Google Scholar]
- 2.Johnson AK & Thunhorst RL The neuroendocrinology of thirst and salt appetite: visceral sensory signals and mechanisms of central integration. Front Neuroendocrinol 18, 292–353, doi: 10.1006/frne.1997.0153 (1997). [DOI] [PubMed] [Google Scholar]
- 3.Nachman M & Valentino DA Roles of taste and postingestional factors in the satiation of sodium appetite in rats. Journal of comparative and physiological psychology 62, 280–283 (1966). [DOI] [PubMed] [Google Scholar]
- 4.Wolf G, Schulkin J & Simson PE Multiple factors in the satiation of salt appetite. Behav Neurosci 98, 661–673 (1984). [DOI] [PubMed] [Google Scholar]
- 5.Augustine V, Gokce SK & Oka Y Peripheral and Central Nutrient Sensing Underlying Appetite Regulation. Trends Neurosci 41, 526–539, doi: 10.1016/j.tins.2018.05.003 (2018). [DOI] [PMC free article] [PubMed] [Google Scholar]
- 6.Faraco G et al. Dietary salt promotes neurovascular and cognitive dysfunction through a gut-initiated TH17 response. Nature neuroscience 21, 240–249, doi: 10.1038/s41593-017-0059-z (2018). [DOI] [PMC free article] [PubMed] [Google Scholar]
- 7.Milan A, Mulatero P, Rabbia F & Veglio F Salt intake and hypertension therapy. J Nephrol 15, 1–6 (2002). [PubMed] [Google Scholar]
- 8.Oka Y, Ye M & Zuker CS Thirst driving and suppressing signals encoded by distinct neural populations in the brain. Nature 520, 349–352, doi: 10.1038/nature14108 (2015). [DOI] [PMC free article] [PubMed] [Google Scholar]
- 9.Rowland NE & Fregly MJ Sodium appetite: species and strain differences and role of renin-angiotensin-aldosterone system. Appetite 11, 143–178 (1988). [DOI] [PubMed] [Google Scholar]
- 10.Richter CP Increased salt appetite in adrenalectomized rats. American Journal of Physiology 115, 155–161 (1936). [Google Scholar]
- 11.Denton DA & Sabine JR The selective appetite for Na ions shown by Na ion-deficient sheep. The Journal of physiology 157, 97–116 (1961). [DOI] [PMC free article] [PubMed] [Google Scholar]
- 12.Dicara LV & Wilson LM Role of Gustation in Sodium Appetite. Physiological Psychology 2, 43–44 (1974). [Google Scholar]
- 13.Sakai RR, Nicolaidis S & Epstein AN Salt appetite is suppressed by interference with angiotensin II and aldosterone. The American journal of physiology 251, R762–768, doi: 10.1152/ajpregu.1986.251.4.R762 (1986). [DOI] [PubMed] [Google Scholar]
- 14.Jarvie BC & Palmiter RD HSD2 neurons in the hindbrain drive sodium appetite. Nature neuroscience 20, 167–169, doi: 10.1038/nn.4451 (2017). [DOI] [PubMed] [Google Scholar]
- 15.Matsuda T et al. Distinct neural mechanisms for the control of thirst and salt appetite in the subfornical organ. Nat Neurosci 20, 230–241, doi: 10.1038/nn.4463 (2017). [DOI] [PubMed] [Google Scholar]
- 16.Resch JM et al. Aldosterone-Sensing Neurons in the NTS Exhibit State-Dependent Pacemaker Activity and Drive Sodium Appetite via Synergy with Angiotensin II Signaling. Neuron 96, 190–206 e197, doi: 10.1016/j.neuron.2017.09.014 (2017). [DOI] [PMC free article] [PubMed] [Google Scholar]
- 17.Stein MK & Loewy AD Area postrema projects to FoxP2 neurons of the pre-locus coeruleus and parabrachial nuclei: brainstem sites implicated in sodium appetite regulation. Brain Res 1359, 116–127, doi: 10.1016/j.brainres.2010.08.085 (2010). [DOI] [PMC free article] [PubMed] [Google Scholar]
- 18.Hull CL Principles of Behavior: An Introduction to Behavior Theory. 422 (Appleton-Century, 1943). [Google Scholar]
- 19.Augustine V et al. Hierarchical neural architecture underlying thirst regulation. Nature, doi: 10.1038/nature25488 (2018). [DOI] [PMC free article] [PubMed] [Google Scholar]
- 20.Betley JN et al. Neurons for hunger and thirst transmit a negative-valence teaching signal. Nature 521, 180–185, doi: 10.1038/nature14416 (2015). [DOI] [PMC free article] [PubMed] [Google Scholar]
- 21.Chen Y, Lin YC, Kuo TW & Knight ZA Sensory detection of food rapidly modulates arcuate feeding circuits. Cell 160, 829–841, doi: 10.1016/j.cell.2015.01.033 (2015). [DOI] [PMC free article] [PubMed] [Google Scholar]
- 22.Zimmerman CA et al. Thirst neurons anticipate the homeostatic consequences of eating and drinking. Nature 537, 680–684, doi: 10.1038/nature18950 (2016). [DOI] [PMC free article] [PubMed] [Google Scholar]
- 23.Chandrashekar J et al. The cells and peripheral representation of sodium taste in mice. Nature 464, 297–301, doi: 10.1038/nature08783 (2010). [DOI] [PMC free article] [PubMed] [Google Scholar]
- 24.Heck GL, Mierson S & Desimone JA Salt Taste Transduction Occurs through an Amiloride-Sensitive Sodium-Transport Pathway. Science 223, 403–405, doi:DOI 10.1126/science.6691151 (1984). [DOI] [PubMed] [Google Scholar]
- 25.Geerling JC & Loewy AD Aldosterone-sensitive neurons in the nucleus of the solitary tract: efferent projections. The Journal of comparative neurology 497, 223–250, doi: 10.1002/cne.20993 (2006). [DOI] [PubMed] [Google Scholar]
- 26.Zardetto-Smith AM, Beltz TG & Johnson AK Role of the central nucleus of the amygdala and bed nucleus of the stria terminalis in experimentally-induced salt appetite. Brain Res 645, 123–134 (1994). [DOI] [PubMed] [Google Scholar]
- 27.Smith CM & Lawrence AJ Salt Appetite, and the Influence of Opioids. Neurochem Res 43, 3–9, doi: 10.1007/s11064-017-2336-3 (2018). [DOI] [PubMed] [Google Scholar]
- 28.Sternson SM & Eiselt AK Three Pillars for the Neural Control of Appetite. Annu Rev Physiol 79, 401–423, doi: 10.1146/annurev-physiol-021115-104948 (2017). [DOI] [PubMed] [Google Scholar]
- 29.Beutler LR et al. Dynamics of Gut-Brain Communication Underlying Hunger. Neuron 96, 461–475 e465, doi: 10.1016/j.neuron.2017.09.043 (2017). [DOI] [PMC free article] [PubMed] [Google Scholar]
- 30.Su Z, Alhadeff AL & Betley JN Nutritive, Post-ingestive Signals Are the Primary Regulators of AgRP Neuron Activity. Cell Rep 21, 2724–2736, doi: 10.1016/j.celrep.2017.11.036 (2017). [DOI] [PMC free article] [PubMed] [Google Scholar]
- 31.Sadio A et al. A Mouse Intra-Intestinal Infusion Model and its Application to the Study of Nanoparticle Distribution. Front Physiol 7, 579, doi: 10.3389/fphys.2016.00579 (2016). [DOI] [PMC free article] [PubMed] [Google Scholar]
- 32.Ueno A et al. Mouse intragastric infusion (iG) model. Nat Protoc 7, 771–781, doi: 10.1038/nprot.2012.014 (2012). [DOI] [PMC free article] [PubMed] [Google Scholar]
- 33.Berndt A et al. Structural foundations of optogenetics: Determinants of channelrhodopsin ion selectivity. Proc Natl Acad Sci U S A 113, 822–829, doi: 10.1073/pnas.1523341113 (2016). [DOI] [PMC free article] [PubMed] [Google Scholar]
- 34.Roth BL DREADDs for Neuroscientists. Neuron 89, 683–694, doi: 10.1016/j.neuron.2016.01.040 (2016). [DOI] [PMC free article] [PubMed] [Google Scholar]
- 35.Oka Y, Butnaru M, von Buchholtz L, Ryba NJ & Zuker CS High salt recruits aversive taste pathways. Nature 494, 472–475, doi: 10.1038/nature11905 (2013). [DOI] [PMC free article] [PubMed] [Google Scholar]
- 36.Peng Y et al. Sweet and bitter taste in the brain of awake behaving animals. Nature 527, 512–515, doi: 10.1038/nature15763 (2015). [DOI] [PMC free article] [PubMed] [Google Scholar]
- 37.Allen WE et al. Thirst-associated preoptic neurons encode an aversive motivational drive. Science 357, 1149–1155, doi: 10.1126/science.aan6747 (2017). [DOI] [PMC free article] [PubMed] [Google Scholar]
- 38.Leib DE et al. The Forebrain Thirst Circuit Drives Drinking through Negative Reinforcement. Neuron 96, 1272–1281 e1274, doi: 10.1016/j.neuron.2017.11.041 (2017). [DOI] [PMC free article] [PubMed] [Google Scholar]
- 39.Lerner TN et al. Intact-Brain Analyses Reveal Distinct Information Carried by SNc Dopamine Subcircuits. Cell 162, 635–647, doi: 10.1016/j.cell.2015.07.014 (2015). [DOI] [PMC free article] [PubMed] [Google Scholar]
- 40.Callaway EM & Luo LQ Monosynaptic Circuit Tracing with Glycoprotein-Deleted Rabies Viruses. Journal of Neuroscience 35, 8979–8985, doi: 10.1523/Jneurosci.0409-15.2015 (2015). [DOI] [PMC free article] [PubMed] [Google Scholar]
- 41.Petreanu L, Huber D, Sobczyk A & Svoboda K Channelrhodopsin-2-assisted circuit mapping of long-range callosal projections. Nat Neurosci 10, 663–668, doi: 10.1038/nn1891 (2007). [DOI] [PubMed] [Google Scholar]
- 42.Geerling JC & Loewy AD Sodium deprivation and salt intake activate separate neuronal subpopulations in the nucleus of the solitary tract and the parabrachial complex. The Journal of comparative neurology 504, 379–403, doi: 10.1002/cne.21452 (2007). [DOI] [PubMed] [Google Scholar]
- 43.Geerling JC et al. FoxP2 expression defines dorsolateral pontine neurons activated by sodium deprivation. Brain research 1375, 19–27, doi: 10.1016/j.brainres.2010.11.028 (2011). [DOI] [PMC free article] [PubMed] [Google Scholar]
- 44.Paxinos G & Franklin KB The Mouse Brain in Stereotaxic Coordinates 2nd edition. (Academic Press, 2001). [Google Scholar]
- 45.Hurley S & Johnson A The biopsychology of salt hunger and sodium deficiency. Pflugers Archiv-European Journal of Physiology 467, 445–456, doi: 10.1007/s00424-014-1676-y (2015). [DOI] [PMC free article] [PubMed] [Google Scholar]
- 46.Stuber GD & Wise RA Lateral hypothalamic circuits for feeding and reward. Nature neuroscience 19, 198–205, doi: 10.1038/nn.4220 (2016). [DOI] [PMC free article] [PubMed] [Google Scholar]
- 47.Andermann ML & Lowell BB Toward a Wiring Diagram Understanding of Appetite Control. Neuron 95, 757–778, doi: 10.1016/j.neuron.2017.06.014 (2017). [DOI] [PMC free article] [PubMed] [Google Scholar]
- 48.Tye KM Neural Circuit Motifs in Valence Processing. Neuron 100, 436–452, doi: 10.1016/j.neuron.2018.10.001 (2018). [DOI] [PMC free article] [PubMed] [Google Scholar]
Associated Data
This section collects any data citations, data availability statements, or supplementary materials included in this article.
Supplementary Materials
Data Availability Statement
Data and code is available from the corresponding author upon reasonable request.


