Abstract
The goal of this study was to test the utility of time-gated optical imaging of head and neck radiotherapy treatments to measure surface dosimetry in real-time and inform possible interfraction replanning decisions. The benefit of both Cherenkov and scintillator imaging in head and neck treatments is direct daily feedback on dose, with no change to the clinical workflow. Emission from treatment materials was characterized by measuring radioluminescence spectra during irradiation and comparing emission intensities relative to Cherenkov emission produced in phantoms and scintillation from small plastic targets. Head and neck treatment plans were delivered to a phantom with bolus and mask present to measure impact on signal quality. Interfraction superficial tumor reduction was simulated on a head and neck phantom, and cumulative Cherenkov images were analyzed in the region of interest. Head and neck human patient treatment was imaged through the mask and compared with the dose distribution calculated by the treatment planning system. The relative intensity of radioluminescence from the mask was found to be within 30% of the Cherenkov emission intensity from tissue-colored clay. A strong linear relationship between normalized cumulative Cherenkov intensity and tumor size was established (R2 = 0.98). The presence of a mask above a scintillator region of interest was found to decrease mean pixel intensity by > 40% and increase distribution spread. Cherenkov imaging through mask material is shown to have potential for surface field verification and tracking of superficial anatomy changes between treatment fractions. Imaging of scintillating targets provides a direct imaging of surface dose on the patient and through transparent bolus material. The first imaging of a patient receiving head and neck radiotherapy was achieved with a signal map which qualitatively matches the surface dose plan.
Keywords: Cherenkov imaging, surface dosimetry, head and neck radiotherapy, scintillator
Introduction
Volumetric modulated arc therapy (VMAT) is a common treatment option for head and neck (HN) cancer patients, where optimization of dose delivery is done with steep dose gradients.1 Due to the nature of these techniques, and the tight spatial proximity of gross tumor volume (GTV) and healthy organs at risk (OAR), proper target positioning is crucial to maintain treatment efficacy. Thermoplastic masks are typically used to immobilize the patient during treatment. In addition, it has been documented that patient anatomy can change noticeably during the course of a fractionated treatment schedule, both due to tumor volume shrinkage and weight loss, which can have an impact on dose distribution.4 At many treatment centers HN patients are imaged at regular intervals using on-board cone beam CT (CBCT) scanners in order to align the patient on the couch to internal anatomy, but the frequency of this image verification differs between centers, as does the choice of what to do with that information.2,3 Adaptive radiation therapy (ART) can mitigate the dosimetric effects of changing anatomy, however the specific methodologic decision remains up to the radiation oncologist, and current techniques involve patient- and clinic-specific practices that can be time and resource intensive or lack quantitative ground for making the decision.5 In this study, imaging of surface dosimetry with Cherenkov emission and scintillation dosimeters was examined to determine the value in quantifying changes in tissue dose as an adjunct decision tool in ART.
In vivo surface dosimetry is a useful tool for evaluating treatment plan accuracy in superficial layers of the tissue and verification of dose delivery. Additionally, changes to surface dose across treatment fractions could assist clinical staff with decisions regarding adaptive planning and could potentially help interpret and reduce skin reactions. In HN cancer patients undergoing radiotherapy, surface dose has been measured using various techniques including MOSFETS, film, TLDs, and gel dosimeters.6–8
Recently, optical imaging methods have been used to measure surface dosimetry, especially with time-gated imaging for real-time in vivo field verification from Cherenkov emission intensity or dose estimation from scintillating target emission9–13. The Cherenkov emission dose-intensity relationship is not entirely linear, but imaging of scintillating targets does provide a direct surface dose value with accuracy comparable to commercial dosimeters.12–15 Scintillator dosimeters function independent of tissue optical properties, have a minimal impact on underlying surface dose, and emit light with greater intensity compared to Cherenkov emission. In this study we used time-gated optical imaging to characterize both Cherenkov emission and scintillation signals underneath thermoplastic masks and with and without bolus, to assess feasibility of real-time in vivo optical surface dosimetry during head and neck radiotherapy, at the level of the mask, bolus or tissue. The goal was to determine which, if any, of these signals was the best indicator of dose and dose change and which were accurate enough to rely upon for routine image guidance for adaptive planning.
Methods and Materials
Imaging Setup
All imaging was performed using a tripod-mounted intensified CMOS camera (C-Dose, DoseOptics LLC, Lebanon, NH) and an attached 50 mm f/1.8 lens (Nikon Inc, Tokyo, Japan). The intensifier was time-gated to the 360 Hz, 4 μs x-ray pulses of the linac, thereby rejecting the majority of ambient light. Both the rising edge of the target current signal from the linac and the voltage pulse from a remote stray radiation detector were used as triggering events depending on the accelerator.12,16 Each primary frame was captured with a 51 ms exposure time, thereby containing up to 18 linac pulses. After each primary frame, a background frame with 8 ms exposure was acquired, containing up to 3 of the subsequent linac pulses. Each background frame is then scaled, allowing for real-time background subtraction of room light during patient treatment. Images were temporally and spatially filtered using a 5-frame window and 5 × 5 grid, respectively. The resulting 1600 × 1200 pixel image stacks were summed for each acquisition and dark-field and flat-field corrections were applied in post-processing. Video 1 presents cumulative video output from a patient undergoing VMAT treatment. Raw pixel intensity values were calibrated to average photon radiance using a 635 nm laser source and optical power meter (Thorlabs, Newton, NJ).
Scintillators
EJ-212 scintillator (Eljen Technology, Sweetwater, TX) was cut into small disks (⊘15 mm × 1 mm). EJ-510 white reflective paint was applied to the outer edge and one face of each disk.
Emission Spectra and Optical Response to Radiation
To determine the emission spectra of head and shoulder thermoplastic radiotherapy masks, purple, white (CIVCO Radiotherapy, Orange City, IA) and orange (IZI Medical Products, Owings Mills, MD) 6 × 4 cm mask samples and were irradiated at 600 MU/min using a Clinac 2100CD accelerator (Varian Medical Systems, Palo Alto, CA). The mask samples were placed one at a time on a blacked-out solid water phantom at 100 cm SSD. The tip of the optical fiber and the mask sample were aligned with the edge of the 20 × 20 cm light field. Emission spectra of the mask samples, as well as background signal, were obtained using a SpectraPro 2300i spectrograph (Acton Research, now Princeton Instruments, Acton, MA) coupled to a PI-MAX3 ICCD camera (Princeton Instruments, Trenton, NJ).
Samples of the three different colored masks, scintillator, 5 mm thick tissue-colored molding clay (commercial name Sculpey, Polyform Products, Elk Grove Village, IL), and transparent polymer bolus material (model ClearSight Bolus, Innovative Oncology Solutions, Memphis, TN and ClearSight RT, Durham, NC) of 5 mm water-equivalent thickness were placed on a blacked-out solid water phantom in a 20 × 20 cm field at 100 cm SSD. The samples were each irradiated to 200 monitor units at 600 MU/min using a Clinac 2100CD accelerator (Varian Medical Systems, Palo Alto CA), and cumulative emission images of each sample were acquired.
Phantom Imaging
Phantom irradiation was performed using a TrueBeam accelerator (Varian Medical Systems, Palo Alto, CA). An anthropomorphic body phantom (PH-2, Kyoto Kagaku America Inc., Torrance CA) was covered with a 5 mm layer of tissue-colored clay to mimic optical properties of skin17; semi-spherical tumor-resembling masses molded out of clay were attached to the neck region on the left side. The phantom was fitted with a white thermoplastic immobilization mask covering the head and shoulders (Fig. 1A), and a simulation CT scan was taken using a 16-slice scanner (Lightspeed VCT, GE Healthcare, Chicago, IL). The target volume was delineated in the planning software and a double arc 6 MV VMAT plan was developed. Four sequential 2 Gy fractions of this same VMAT plan were delivered to the phantom and the tumor size was systematically reduced between fractions (Fig. 1A) to represent response to radiation. The three tumor sizes used were 64 cm3, 48 cm3, and 12 cm3. Cherenkov images were acquired for each delivery and cumulative emission intensities in the region of interest (ROI) were compared as a function of mass size.
Figure 1:
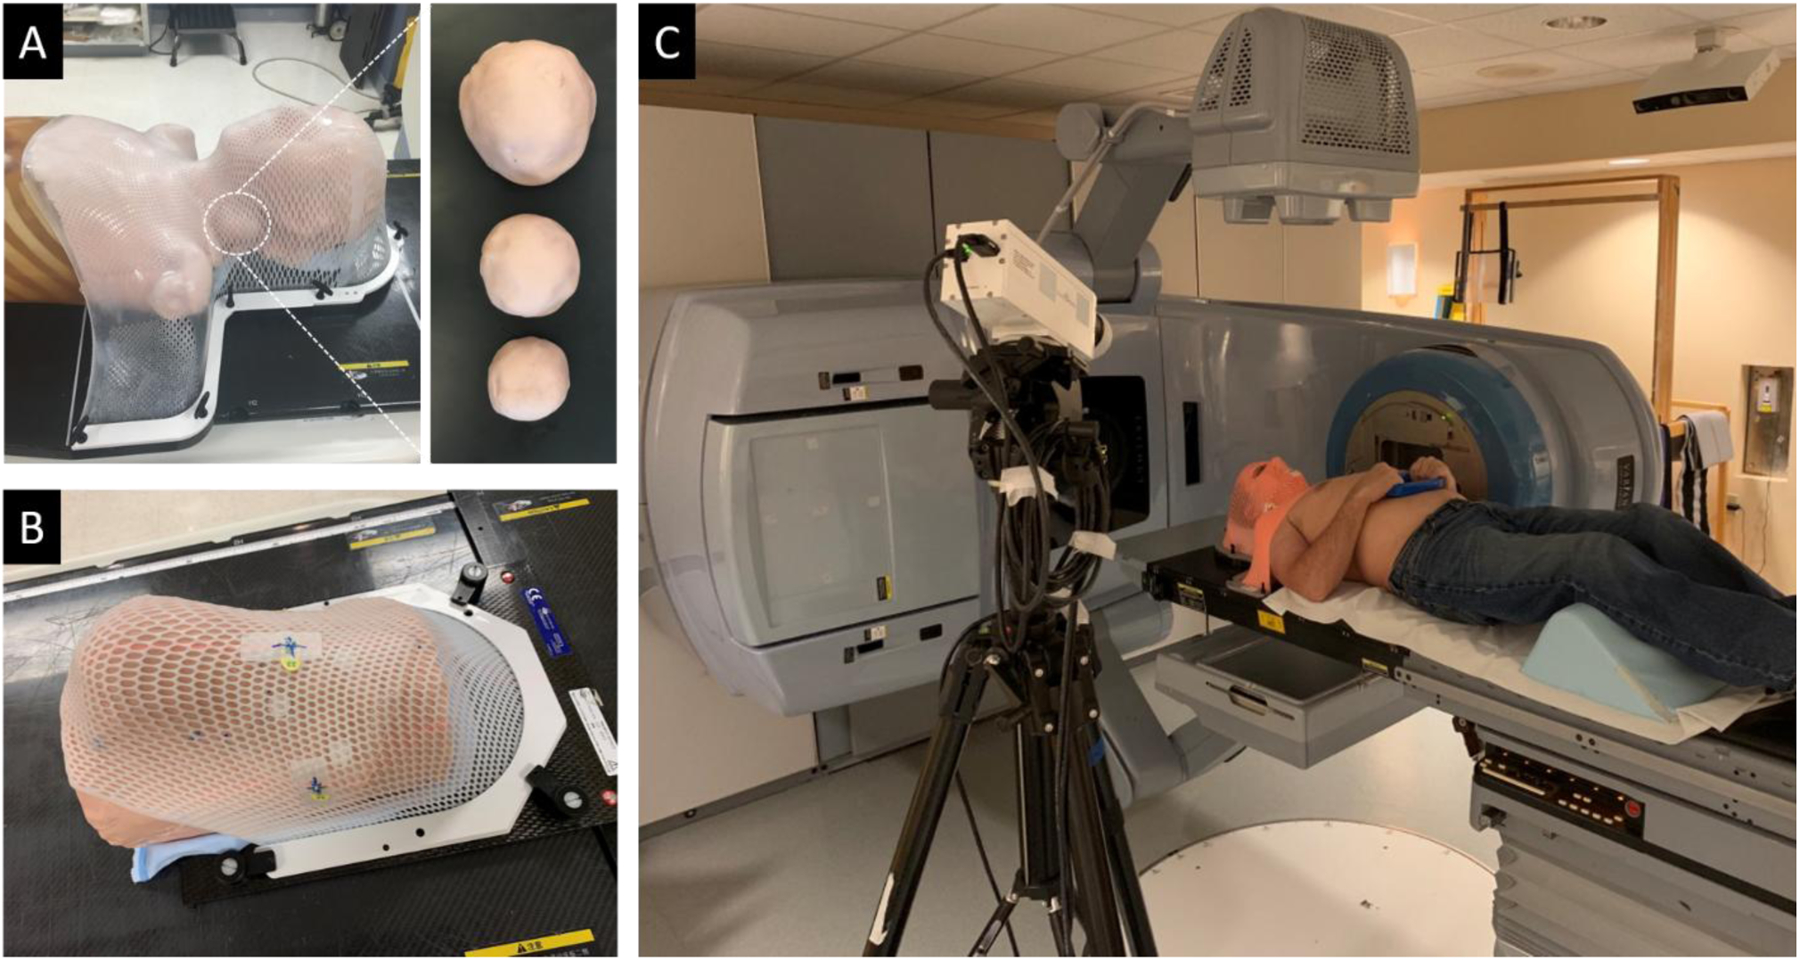
(A) Thermoplastic mask fitting over body phantom wrapped in molding clay; detailed view of differing mass sizes in the neck region. (B) Thermoplastic mask fitting over phantom, showing scintillators underneath the mask. (C) Photograph of patient imaging setup.
Additional phantom imaging was done using a custom-machined ABS plastic phantom also covered in a 3 mm layer of molding clay. An 8 × 12 cm2 piece of transparent bolus with 0.5 cm water equivalent thickness was laid over three scintillators on the surface of the phantom, which was then fitted with a white thermoplastic mask (Fig. 1B). Simulation CT images were acquired and a 124 cm3 target volume was contoured just beneath the phantom surface, directly underneath the bolus. Eight 2 Gy fractions of a double-arc VMAT plan were delivered to the target volume. Image stacks were acquired of different combinations of scintillators, mask and transparent bolus applied to the phantom during each fraction, to compare the different effects on detected signal quality.
Patient Imaging
A human subject imaging study was approved by the Dartmouth College Institutional Review Board. One patient was imaged during this feasibility study and informed consent was obtained prior to image acquisition. The patient was treated on a Varian Trilogy accelerator (Varian Medical Systems, Palo Alto, CA) and was immobilized with an orange mask (Fig. 1C). The camera was positioned at a height of 1.84 m, an angle of 22° from the horizontal, and a distance of 1.58 m from the patient surface (Fig. 1C). Cherenkov images were acquired during one 1.8 Gy fraction of a 25-fraction double-arc 6 MV VMAT plan. The resulting Cherenkov intensity distribution was then compared to the surface dose distribution exported from the treatment planning system (TPS).
Results
Mask Spectra and Radioluminescence Intensities
Radioluminescence spectra were acquired for samples of white, orange, and purple thermoplastic immobilization masks, as well for as tissue-colored clay and transparent bolus, during irradiation. These spectra were background corrected post-acquisition to help isolate useful signal. The normalized, corrected spectra along with the CMOS camera sensitivity as a function of wavelength are shown in Figure 2. Additionally, the radioluminescence signal from each mask sample, tissue-colored clay, and bolus was found to be linear with delivered dose. Cumulative intensity images were analyzed in the ROI for each sample, including scintillators, tissue-colored clay, transparent bolus, and masks (Fig. 3B–D). An average pixel value and signal-to-noise ratio calculated in the ROI for each sample is shown in Figure 3A. Measurements of scintillator intensity are more than 3x greater than mask radioluminescence and Cherenkov emission in both the tissue-colored clay and transparent bolus material. Radioluminescence measurements from both orange and white colored mask material are within 5% of Cherenkov measurements from tissue colored clay, while emission intensity from purple mask material is 28% lower. Light emission from the upward facing surface of the transparent bolus material is over 4x less than the other materials studied.
Figure 2:
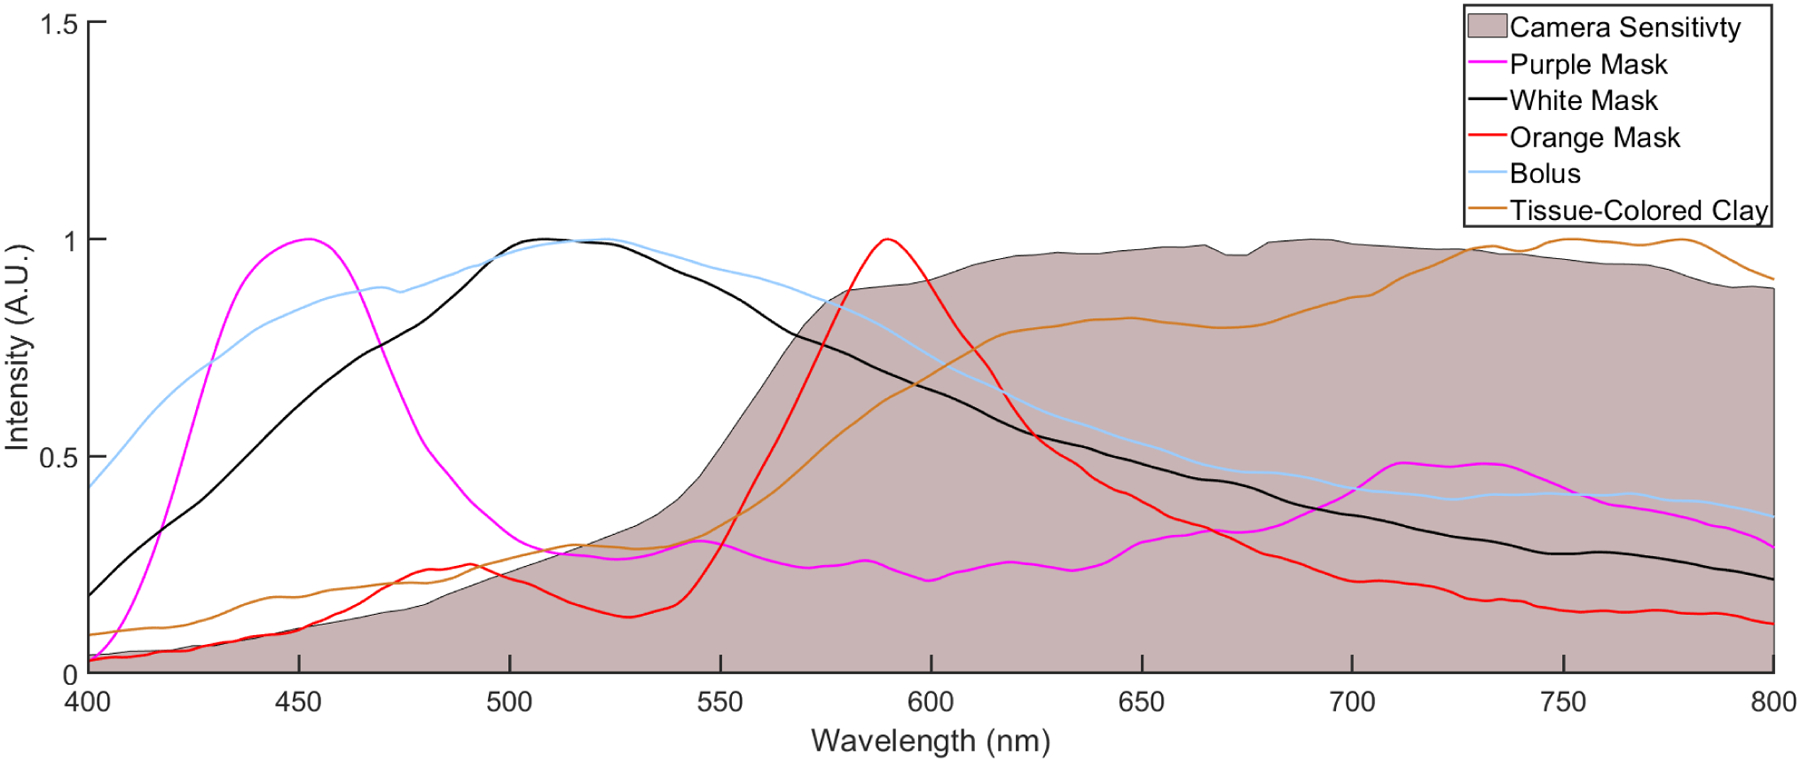
Relative, background-corrected, normalized radioluminescence spectra for purple, white, and orange thermoplastic mask samples, as well as transparent bolus, tissue-colored clay, and wavelength-dependent relative camera sensitivity.
Figure 3:
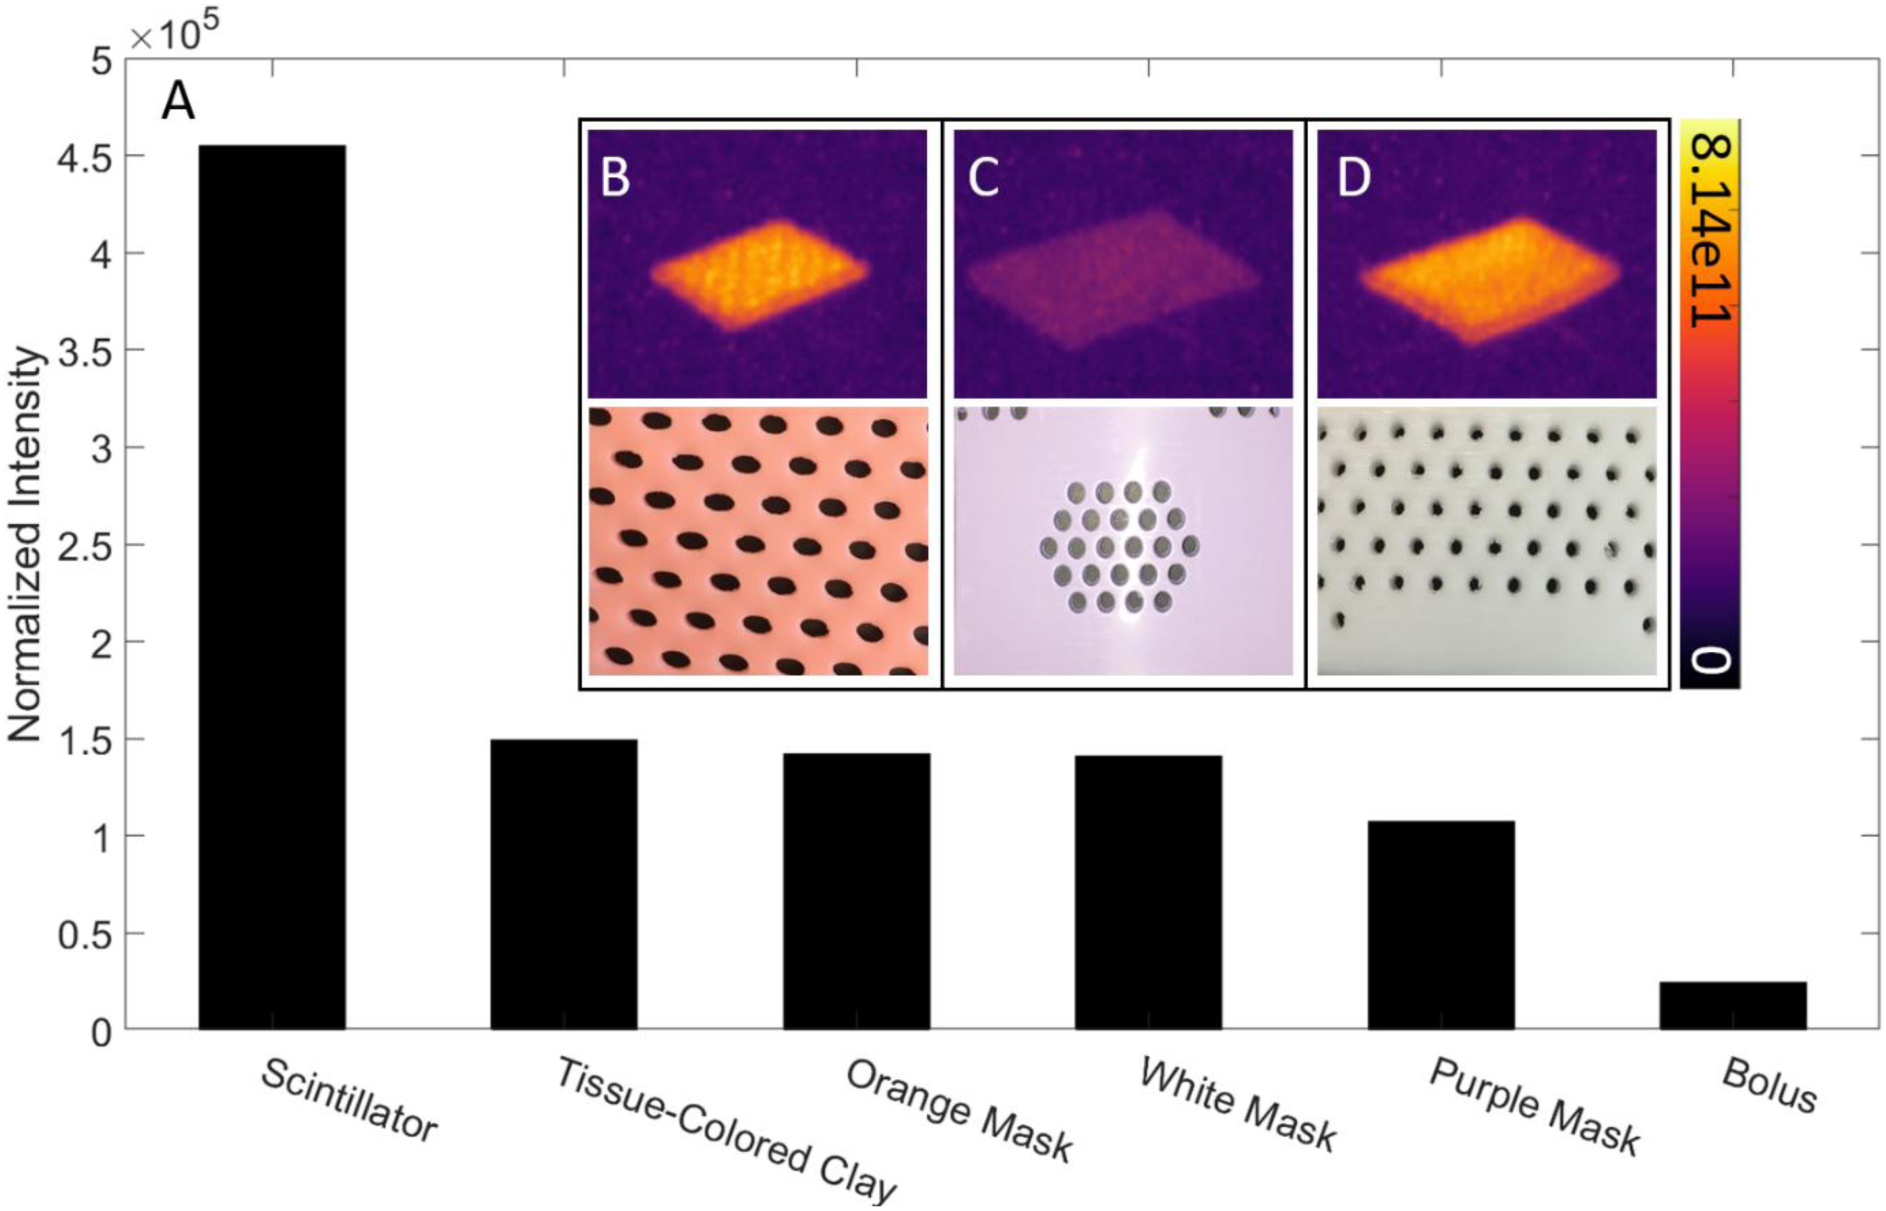
Relative intensity and SNR values for scintillator, tissue-colored clay, transparent bolus, and mask samples. Luminescence images and photographs of orange (B), purple (C), and white (D) thermoplastic mask samples. Colorbar is presented in photons cm−2 sr−1 s−1.
Simulated Tumor Reduction
Cumulative Cherenkov images of the body phantom were analyzed during irradiation in a ROI surrounding the treatment area on the neck (Fig. 4A–D). The cumulative image was separated temporally into three parts corresponding to incident beam angle, in order to isolate signal from entrance, exit, and tangential beams. An average pixel intensity was calculated for each image of the different tumor sizes to characterize the relationship between Cherenkov emission intensity and tumor volume for entrance, exit, and tangential portions of the cumulative treatment (Fig. 4E). The strongest correlation between Cherenkov emission and tumor size is found for tangential components of the treatment with an R2 value of 0.99. The mean Cherenkov intensity in the chin region of the phantom, where no anatomical change was induced, was found to vary up to 4% between fractions. This inherent variability in the signal is incorporated into the data as error bars in Fig. 4E. Overall, a decrease of >30% in average pixel intensity was observed within the ROI as the tumor was reduced.
Figure 4:
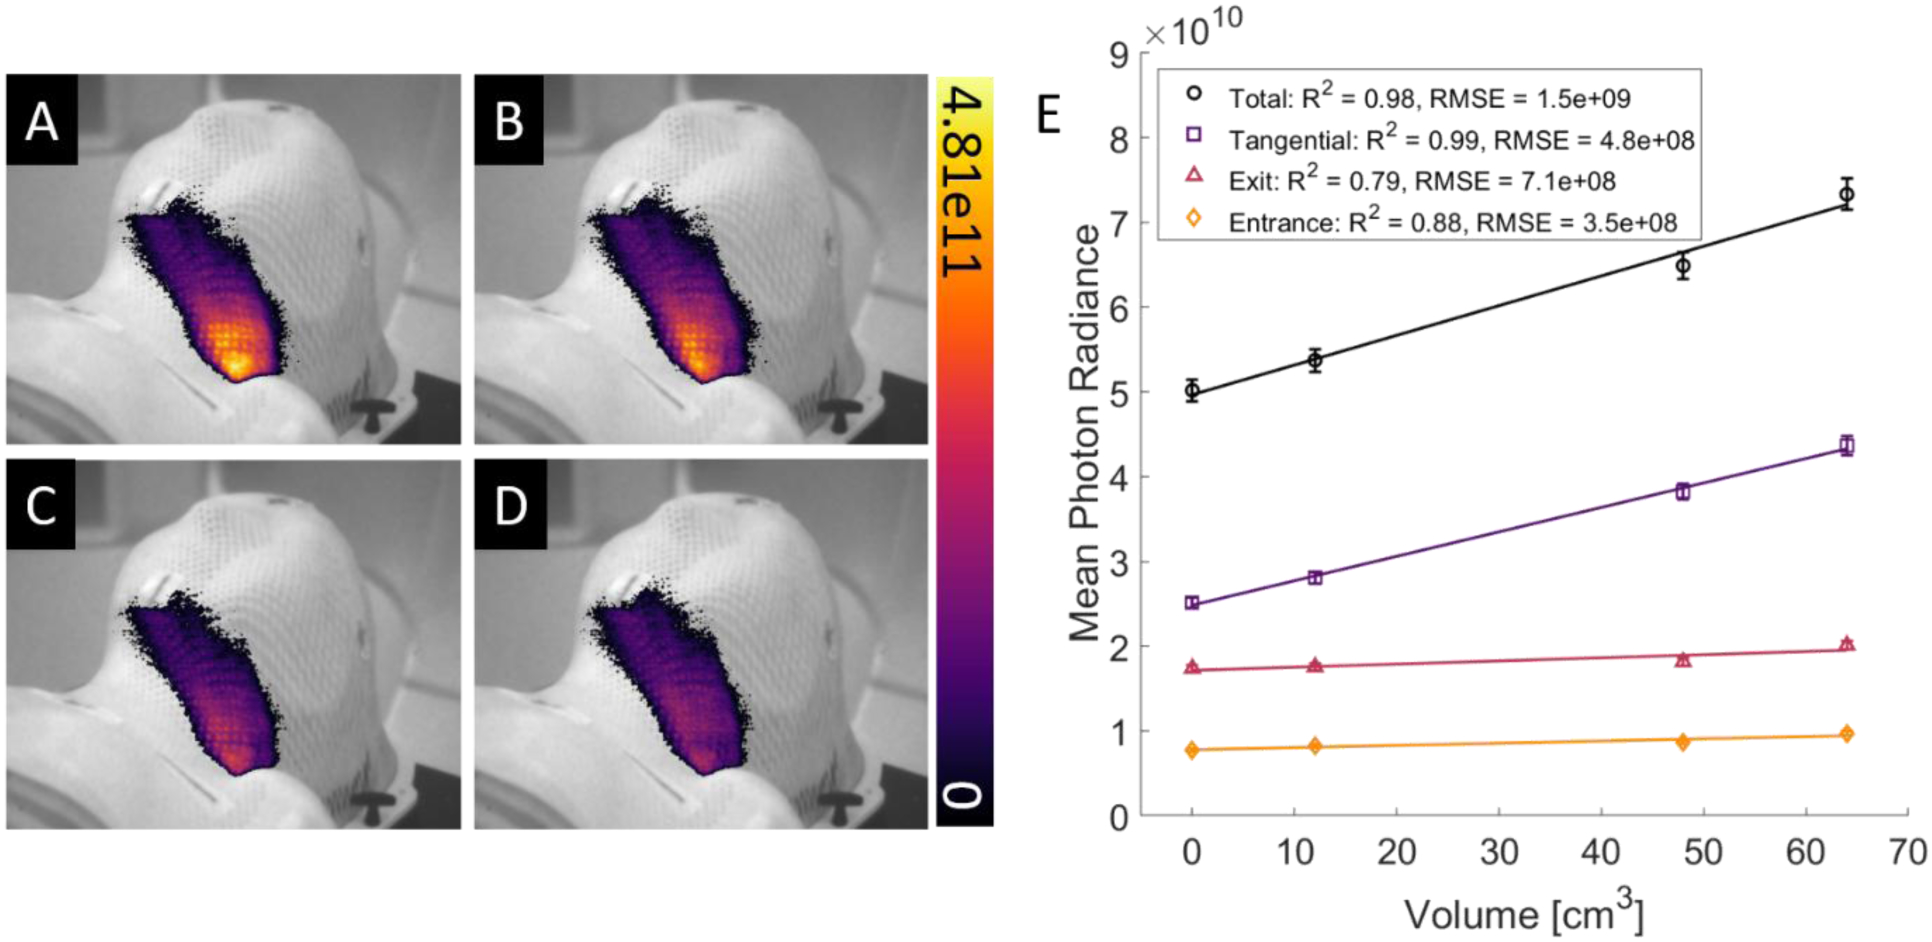
Cumulative images of Cherenkov intensity from VMAT treatment of the neck of an anthropomorphic phantom with an artificial tumor of decreasing size in order from (A) to (D). (E) Plot of Cherenkov emission intensity in the ROI compared to tumor volume. Coefficients of determination for both fits are shown in the lower left corner. Colorbar and vertical axis are presented in photons cm−2 sr−1 s−1.
Imaging Through Mask and Bolus
Different combinations of treatment materials were used in administering a head and neck VMAT plan to a curved phantom to observe the impact on signal quality. Cumulative images acquired for each treatment are shown in Figure 5A–H. Comparing mask-free treatments with and without bolus, there was an increase of 40% in average scintillator intensity in the ROI. (Fig. 5C,G). When an immobilization mask was placed above the bolus, the mean scintillator photon radiance is found to be (1.05 ± 0.02) × 1012 photons cm−2 sr−1 s−1, compared to (1.88 ± 0.01) × 1012 photons cm−2 sr−1 s−1 when no mask is present.
Figure 5:
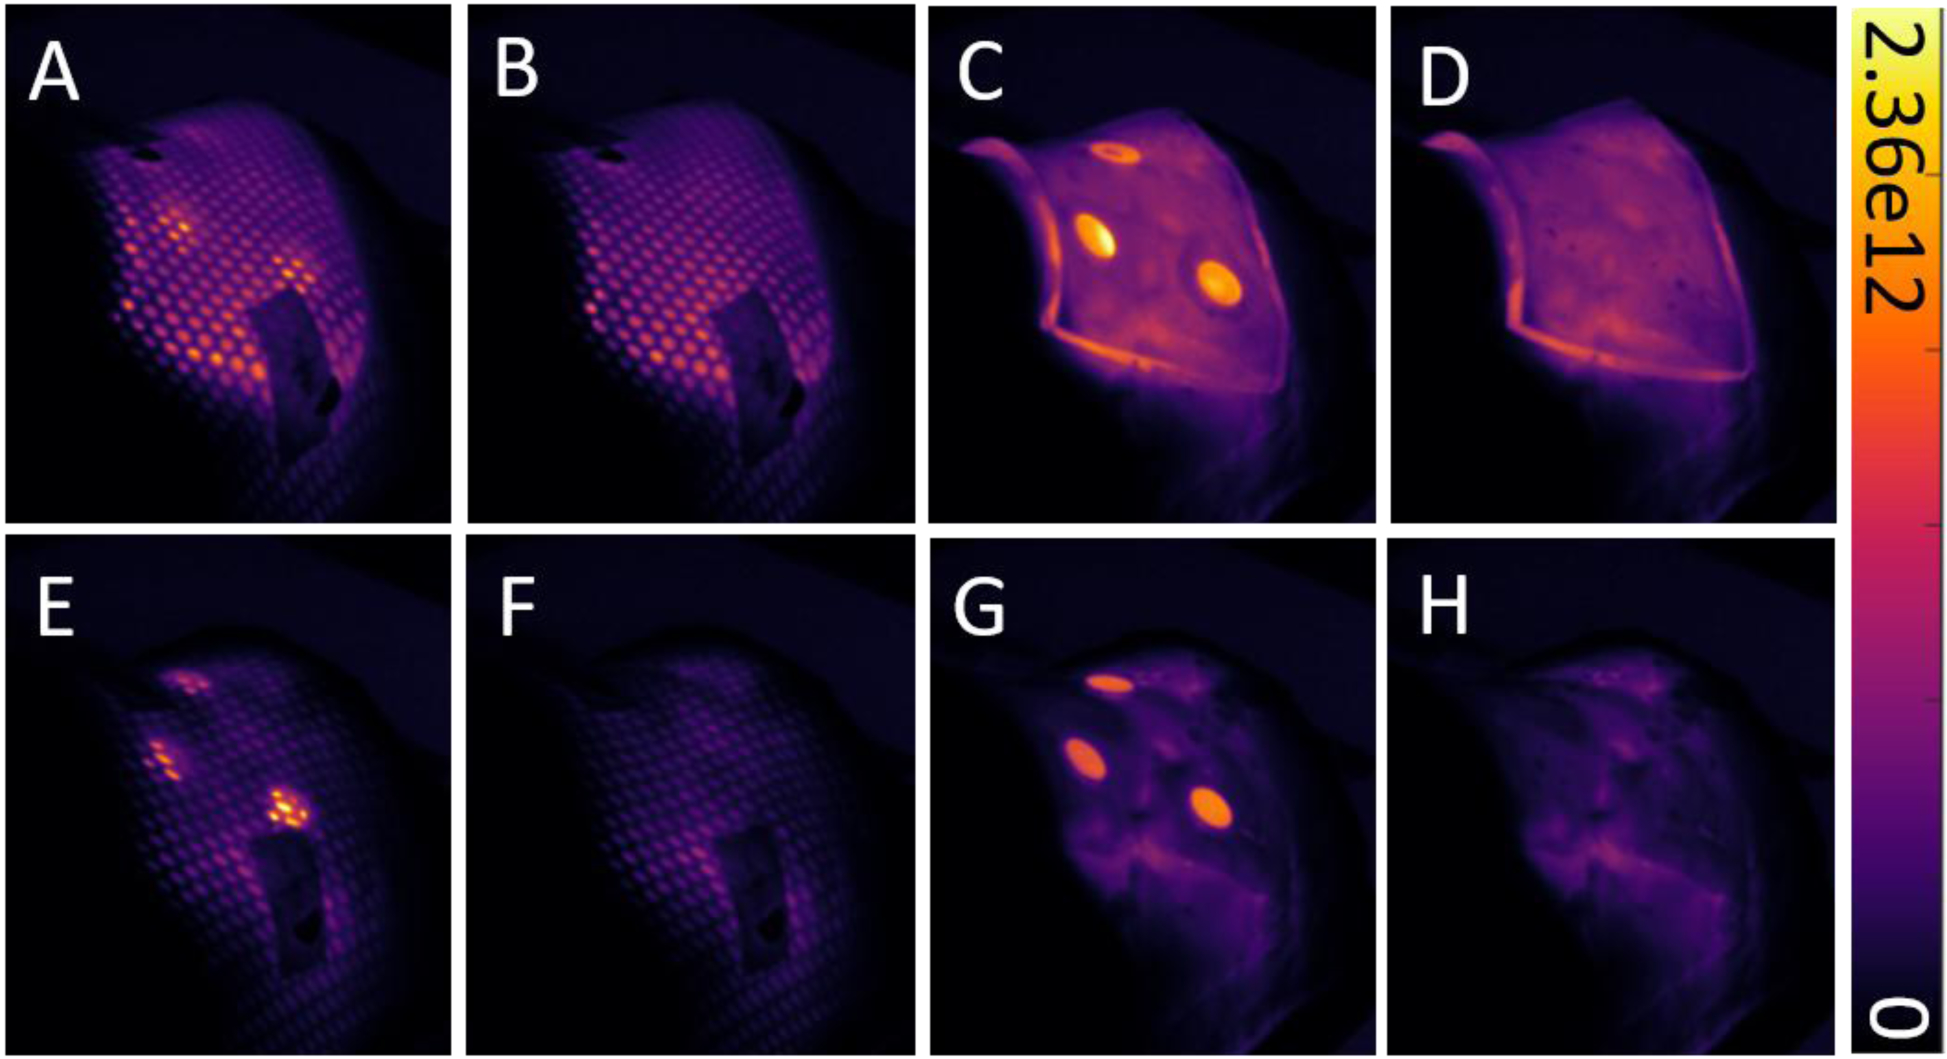
Cumulative images showing various combinations of treatment materials applied to a phantom during irradiation, with and without scintillators. The same head and neck VMAT plan was administered in all eight scenarios. The top row (A-D) shows images from treatment with transparent bolus, while the bottom row (E-F) shows images from treatment without bolus. Colorbar is presented in photons cm−2 sr−1 s−1.
Patient Imaging
Cumulative Cherenkov images were acquired for one 1.8 Gy fraction of head and neck patient treatment. The planned dose distribution data overlaid on simulation CT data of the patient was exported from the treatment planning system, and the point-of-view was co-registered with the camera view of the patient in the C-Dose software (C-Dose, DoseOptics LLC, Lebanon, NH) via a built-in checkerboard calibration procedure performed prior to acquisition. Figure 6 shows the cumulative Cherenkov distribution acquired during treatment as well as the treatment plan data.
Figure 6:
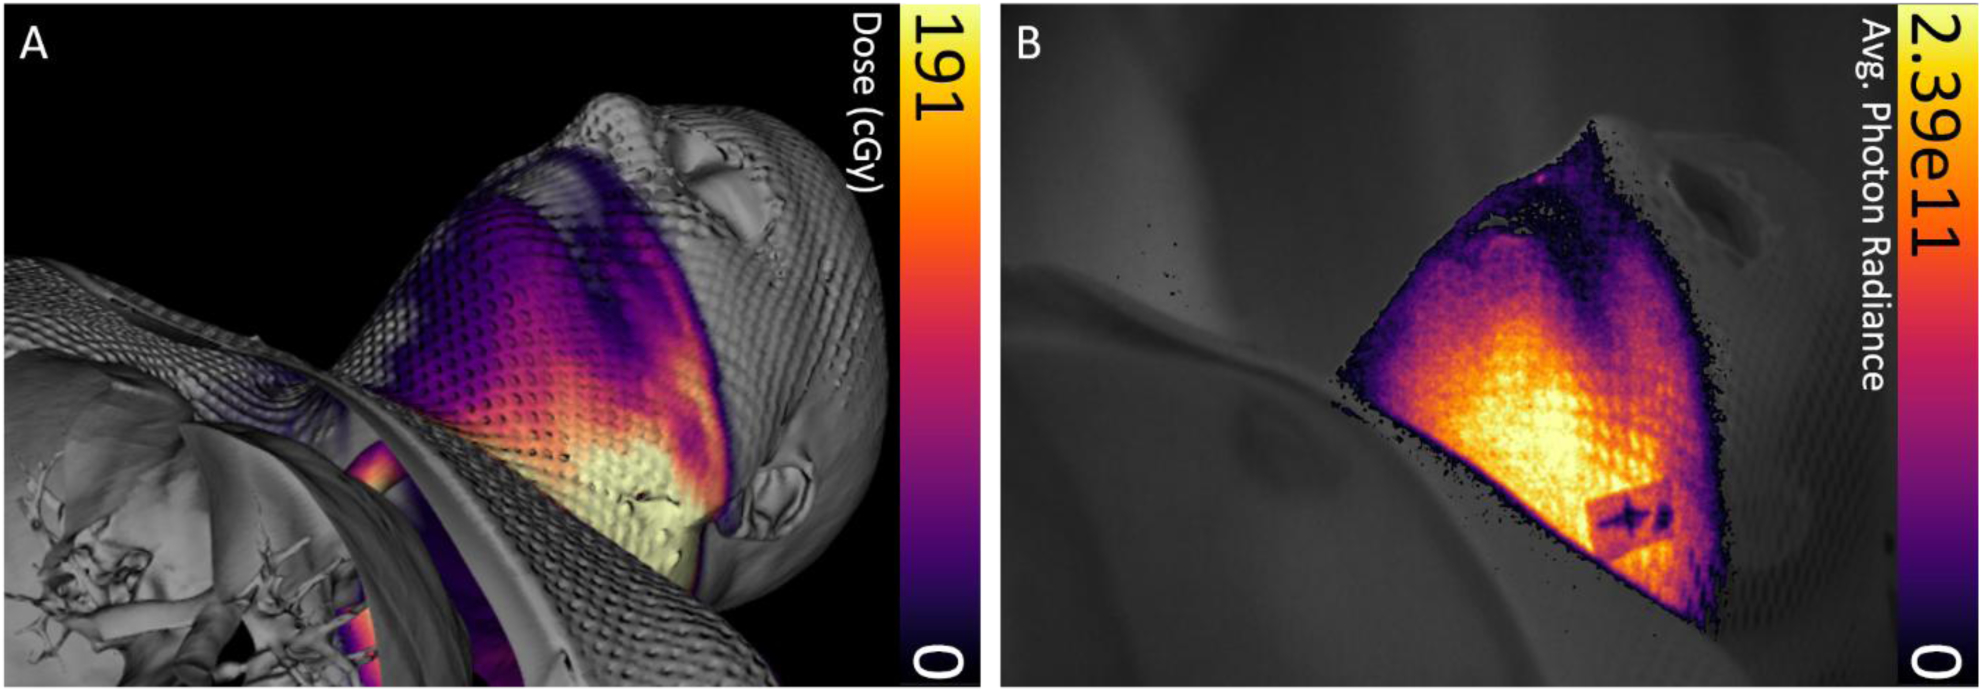
Coregistered intensity maps from patient treatment plan and treatment delivery. (A) Dose distribution overlaid with 3D simulation CT data from the patient treatment plan. (B) Cumulative Cherenkov intensity distribution captured through the immobilization mask acquired real-time during treatment. Colorbar is presented in photons cm−2 sr−1 s−1.
Discussion
In order to use optical imaging to measure surface dosimetry during HN radiotherapy treatment, contributions to the measured signal from the immobilization mask and bolus material must be understood and characterized. Results show that immobilization masks introduce radioluminescence to cumulative image data and attenuate Cherenkov emission and scintillation signals at the surface level, and that the magnitude of these effects depends on mask color. There is a dominance of Cherenkov emission in the spectrum of the white mask in sensitivity range of the CMOS camera used, while the purple and orange spectra exhibit fluorescence peaks. Differences in spectral data between different masks allows for possible modulation of the radioluminescence effect; this could be accomplished by filtering of the measured signal in conjunction with using a camera with set wavelength-dependence, although this is not performed in this study. Radioluminescence spectra from the bolus material shows a Cherenkov emission dominance, while the tissue-colored clay emits a spectrum consistent with Cherenkov emission from human skin, wherein the blue weighted Cherenkov light is preferentially attenuated by absorption and scattering properties of the tissue18. Figure 3 shows that mask radioluminescence intensity is comparable to Cherenkov intensity in the skin layer of the phantom to within 30%. Differences in refractive index between the tissue-colored clay and human tissue may give rise to differences in the amount of Cherenkov emission produced, although this will not impact the relative relationship between Cherenkov emission and dose. Additionally, relative intensity between mask radioluminescence and Cherenkov emission is likely lower in vivo as the mask stretches during application, decreasing thickness and density. This ambiguity of thickness might preclude quantitative comparisons of emissive intensity between masks or at different locations on a mask. However, since the light output response from the mask itself is linear with dose, the signal intensity can reliably report changes in delivered dose in a clinical setting.
The increased light output from scintillating targets, as well as a lack of dependence on tissue optics, makes them an attractive alternative to measuring Cherenkov emission signals in tissue or radioluminescence from the mask. The use of transparent bolus to transmit optical signals generated at the tissue surface and sustain dose-linearity response while maintaining the necessary clinical effect was demonstrated in this study, and this provides a logical substitute for traditional opaque bolus if optical dosimetry is desired. Additionally, the intensity of optical signals produced in the bolus itself were found to be much less than that produced by scintillating surface dose targets (Fig. 3A), thereby allowing the scintillators to be imaged through it. More characterization of the light coupling at the bolus interface is necessary to understand the full extent of the optical effects the bolus presents.
The feasibility of tracking reduction of superficial tumor size using Cherenkov emission signals was illustrated by the relationship in Figure 4E. Strong linear correlation was observed between physical target volume and Cherenkov emission production through the mask in the region of interest. This relationship is attributed to the optimization algorithm preferentially delivering more monitor units at angles tangential to the neck in order to spare healthy tissue below the target volume. The decrease in tissue in the PTV causes portions of the beam to miss this target, decreasing the amount of signal in the target ROI. The three separate components in Fig. 4 support the hypothesis that the Cherenkov emission generated by the tangential component of the beam is the primary source of this relationship. This illustrates the potential to use real-time imaging, without interruption of the clinical workflow, to inform clinical decisions regarding adaptive planning for superficial lesions, either using quantitative dosimetric calibration or real-time qualitative observation (Fig. 4A–D).
The degree to which the immobilization mask affects surface-level emission was explored by delivering VMAT treatment to a phantom under a variety of surface configurations. Notable comparisons include mean intensity values in the scintillator target ROI with and without both transparent bolus and mask present. The effect of adding bolus upon the measured signal in this case was quantified as a large increase in mean pixel intensity. As expected, the mask was found to impede a portion of emission from reaching the camera, thereby reducing mean pixel intensity in the ROI by 44%. Furthermore, it is likely that this effect will depend on the mask geometry, as the mesh pattern is frequently stretched non-uniformly across the surface. The spread of pixel intensities in the ROI acquired when mask was present was expectedly larger than those acquired without mask present, as a large proportion of the scintillator area is covered by the mask mesh. It is plausible that a generalizable pixel-by-pixel analysis using intensity thresholding could be developed to exploit this effect and correct for the effect of the mask; this is under investigation.
A HN cancer patient undergoing radiotherapy was imaged during one treatment fraction to establish a baseline of optical signals present during head and neck treatment. While it is known that the relationship between Cherenkov intensity and absorbed dose is impacted by patient specific tissue optical properties, the comparison given in Figure 6 shows that it is a robust method for field verification. Additionally, it may not be necessary to establish a rigorous quantitative relationship between Cherenkov emission and surface dose in order to use it to inform clinical decisions, as long as the intensity is repeatable from day to day, allowing for inter-fraction observation of surface dose accuracy. Further head and neck patient imaging is planned to investigate both Cherenkov emission and scintillation imaging dosimetry as means to assist the current clinical workflow.
Conclusions
Imaging of optical signals during HN radiotherapy was quantified from phantoms and treatment materials such as immobilization masks and bolus. The attenuation and emissivity of light from each of these are complex, and without careful interpretation might confound the use of the signal. This study demonstrated that imaging Cherenkov emission from tissue and scintillation from plastic surface dosimeters through transparent bolus material is possible, and thus allows for direct visualization of surface dose in patient tissue that has been prescribed with bolus use. While the mask material is opaque and heterogenous, and therefore not readily imaged through, light emission both from the mask and through holes in the mesh are indicative of surface dose, reliable day-to-day, and are altered by changes in the tissue volume below. Thus, Cherenkov emission imaged through mask material can be used for field verification and has strong potential to provide information about changing patient anatomy.
Acknowledgments:
The work completed in this project has been sponsored by National Institutes of Health research grants R01EB023909 and R44CA199681.
Footnotes
Conflict of Interest / Disclosure:
B Pogue is the president and co-founder of DoseOptics LLC, manufacturing the C-Dose camera provided for this research. P Bruza is the principal investigator in SBIR subaward B02463 (prime award NCI R44CA199681, DoseOptics LLC).
References
- 1.Teoh M, et al. “Volumetric modulated arc therapy: a review of current literature and clinical use in practice.” The British journal of radiology 84.1007 (2011): 967–996. [DOI] [PMC free article] [PubMed] [Google Scholar]
- 2.Zeidan Omar A., et al. “Evaluation of image-guidance protocols in the treatment of head and neck cancers.” International Journal of Radiation Oncology* Biology* Physics 67.3 (2007): 670–677. [DOI] [PubMed] [Google Scholar]
- 3.Gros Sébastien AA, et al. “A novel surrogate to identify anatomical changes during radiotherapy of head and neck cancer patients.” Medical physics 44.3 (2017): 924–934. [DOI] [PubMed] [Google Scholar]
- 4.Jr Barker, Jerry L, et al. “Quantification of volumetric and geometric changes occurring during fractionated radiotherapy for head-and-neck cancer using an integrated CT/linear accelerator system.” International Journal of Radiation Oncology* Biology* Physics 59.4 (2004): 960–970. [DOI] [PubMed] [Google Scholar]
- 5.Juloori Aditya, et al. “Adaptive radiation therapy for head and neck cancer.” Applied Radiat Oncol 4.3 (2015): 12–17. [Google Scholar]
- 6.Qi Zhen‐Yu, et al. “In vivo verification of superficial dose for head and neck treatments using intensity‐modulated techniques.” Medical physics 36.1 (2009): 59–70. [DOI] [PubMed] [Google Scholar]
- 7.Shiau An‐Cheng, et al. “Dosimetric verification of surface and superficial doses for head and neck IMRT with different PTV shrinkage margins.” Medical physics 38.3 (2011): 1435–1443. [DOI] [PubMed] [Google Scholar]
- 8.Eyadeh Molham M., Wierzbicki Marcin, and Diamond Kevin R.. “Measurement of skin surface dose distributions in radiation therapy using poly (vinyl alcohol) cryogel dosimeters.” Journal of applied clinical medical physics 18.3 (2017): 153–162. [DOI] [PMC free article] [PubMed] [Google Scholar]
- 9.Jarvis Lesley A., et al. “Cherenkov video imaging allows for the first visualization of radiation therapy in real time.” International Journal of Radiation Oncology* Biology* Physics 89.3 (2014): 615–622. [DOI] [PubMed] [Google Scholar]
- 10.Glaser Adam K., et al. “Optical dosimetry of radiotherapy beams using Cherenkov radiation: the relationship between light emission and dose.” Physics in Medicine & Biology 59.14 (2014): 3789. [DOI] [PubMed] [Google Scholar]
- 11.Zhang Rongxiao, et al. “Beam and tissue factors affecting Cherenkov image intensity for quantitative entrance and exit dosimetry on human tissue.” Journal of biophotonics 10.5 (2017): 645–656. [DOI] [PMC free article] [PubMed] [Google Scholar]
- 12.Bruza Petr, et al. “Time-gated scintillator imaging for real-time optical surface dosimetry in total skin electron therapy.” Physics in Medicine & Biology 63.9 (2018): 095009. [DOI] [PMC free article] [PubMed] [Google Scholar]
- 13.Tendler Irwin, et al. “Rapid Multi-Site Remote Surface Dosimetry for Total Skin Electron Therapy: Scintillator Target Imaging.” International Journal of Radiation Oncology* Biology* Physics (2018). [DOI] [PMC free article] [PubMed] [Google Scholar]
- 14.Tendler Irwin I., et al. “Characterization of a non-contact imaging scintillator-based dosimetry system for total skin electron therapy.” Physics in medicine and biology (2019). [DOI] [PMC free article] [PubMed] [Google Scholar]
- 15.Hachadorian Rachael, et al. “Correcting Cherenkov light attenuation in tissue using spatial frequency domain imaging for quantitative surface dosimetry during whole breast radiation therapy.” Journal of biomedical optics 24.7 (2018): 071609. [DOI] [PMC free article] [PubMed] [Google Scholar]
- 16.Ashraf Muhammad Ramish, et al. “Time‐Gating to Medical Linear Accelerator Pulses: Stray Radiation Detector.” Medical physics (2018). [DOI] [PMC free article] [PubMed] [Google Scholar]
- 17.Ahmed Syed Rakin, et al. “Radiotherapy-induced Cherenkov luminescence imaging in a human body phantom.” Journal of biomedical optics 23.3 (2018): 030504. [DOI] [PMC free article] [PubMed] [Google Scholar]
- 18.Zhang Rongxiao, et al. “Superficial dosimetry imaging based on Čerenkov emission for external beam radiotherapy with megavoltage x‐ray beam.” Medical physics 40.10 (2013). [DOI] [PMC free article] [PubMed] [Google Scholar]


