

Abstract
Objectives
We aimed to investigate the expression of T cell immunoglobulin and mucin domain 3 (Tim-3) on peripheral blood cells in spontaneous intracerebral hemorrhage (ICH) patients and to analyze its clinical significance.
Design and methods
Tim-3 expression on peripheral immunocytes from ICH patients and healthy volunteers was measured by flow cytometry. The correlation between Tim-3 expression and the clinical indices was estimated using linear regression.
Results
Tim-3 expressions on peripheral CD3+ T cells and CD8+ T cells in ICH patients are significantly downregulated, while Tim-3 expressions on CD14+ monocytes and CD16+CD56+ NK cells are increased. Furthermore, Tim-3 expression on peripheral CD8+ T cells was negatively correlated with the inflammatory response, the disease severity and the outcome of ICH patients. However, there was no relationship between Tim-3 expression and blood glucose concentration.
Conclusions
Altered expression of Tim-3 might play an important role in the pathogenesis of ICH, demonstrating that Tim-3 might be a novel candidate molecule for prognosis evaluation of ICH patients.
Keywords: Intracerebral hemorrhage (ICH), T cell immunoglobulin and mucin domain 3 (Tim-3), Glasgow coma scale (GCS), Glasgow outcome scale (GOS), Blood glucose
Highlights
-
•
Tim-3 expression on peripheral blood cells in ICH patient was dysregulated.
-
•
Tim-3 expression on CD8+ T cells negatively correlated with the disease severity.
-
•
Tim-3 expression on CD8+ T cells negatively correlated with the patients' outcome.
Introduction
Spontaneous intracerebral hemorrhage (ICH; nontraumatic and without any underlying lesion) is the most devastating type of stroke with limited effective therapies. It is characterized by spontaneous bleeding in the parenchymal tissue of the brain and is associated with a very high mortality and substantial morbidity [1]. Approximately 2 million cases of ICH occur worldwide each year [2], and patients with ICH have nearly twice the risk of being severely disabled when compared to patients with ischemic stroke [3]. Treatment for ICH is primarily supportive, and the clinical outcome is poor with potential huge burden for the caretakers. Better understanding of the pathogenesis of ICH-induced brain injury would contribute to improve the clinical outcome of ICH.
Increasing evidences from preclinical and clinical studies have described that an intense local inflammatory response surrounding the hemorrhage occurs soon after ICH and peaks several days later and have indicated that these inflammatory mechanisms contribute substantially to cell damage and edema formation caused by cerebral bleeding [4], [5]. Napoli et al. reported that higher C-reactive protein (CRP), one of acute inflammatory markers, is associated with increased mortality in sICH patients and improved mortality prediction when added to the ICH score [6]. The inflammation cascades following ICH comprise both cellular components and molecular components [4]. Blood-derived leukocytes, macrophages, and resident microglia, that are activated and accumulate within the brain after ICH, are the major inflammatory cells. Animal models of ICH provide substantial evidences for the presence of leukocyte infiltration into the hematoma with the breakdown of the blood–brain-barrier (BBB) [7], [8]. Clinical studies also support the role of leukocytes in ICH. Early studies by Molle [9] and Lee et al. [10] showed that leukocyte counts in cerebrospinal fluid were frequently elevated after ICH. Moreover, patients with ICH also have higher peripheral leukocyte counts [11], which were reported to be one of the independent predictors of neurologic deterioration in ICH [12]. Loftspring et al. [13] quantitatively detected the frequency of infiltrating leukocytes that enter the brain after ICH by using flow cytometry and found that, at 4 days ICH mice brain presented with a 3.4-fold increase in CD45hiGR-1+ cells (mostly are neutrophils) and 1.7-fold increase in CD4+ T cells, compared with control mice, indicating that both innate and adaptive immune cells play roles in the development of brain injury after ICH.
Notably, immunoregulatory molecules are crucial for modulating the activation, proliferation and function of immunocytes in both physiological and pathological conditions, including in ICH. Toll-like receptor (TLR4), identified as an receptor for the recognition of pathogen-associated molecular patterns by immune cells, was found to be involved in the pathogenesis of ICH [14]. TLR4-deficient mice had markedly decreased perihematomal inflammation, associated with reduced recruitment of neutrophils and monocytes and improved functional outcome by day 3 after ICH. These results indicate that immunoregulatory molecules might be important mediators of immune damage ensuing ICH.
Tim-3, a member of T cell immunoglobulin and mucin domain family, was firstly identified as a specific cell surface marker on Th1 cells, but not on Th2 cells [15], [16]. Further studies also described the abundant expression of Tim-3 on CD8+ T cells, monocytes/macrophages, mast cells, NK cells and dendritic cells [17], [18], [19]. A huge amount of data has disclosed the complicated functions of Tim-3 on different types of immune cells in the underlying physiological or pathological milieu [20]. Animal and clinical studies also proved that Tim-3 is involved in the pathogenesis of various kinds of diseases (e.g. tumor, viral infection, atherosclerosis, diabetes, and autoimmune diseases) by modulating the intensity and duration of innate and/or adaptive immune response [21], [22]. More recently our research and that of several other groups suggested that Tim-3 might play a role in the inflammatory reaction in nervous system diseases. Zhang et al. [23] found that time course of Tim-3(+) cell accumulation correlated positively with disease progression of experimental autoimmune neuritis. Our previous findings showed that Tim-3 expression was upregulated in peripheral blood monocytes (PBMCs) of ischemic stroke patients and correlated with abnormal lipid levels [24]. However, there is still no report about the roles of Tim-3 in the pathogenesis of ICH. Here, we found the different alterations of Tim-3 expression on PBMC subsets in ICH patients and, more importantly, there was significant correlation between Tim-3 expression on CD8+ T cells and the inflammatory response, the Glasgow coma scale score and the outcome of the patients. This work gives new insights into the inflammatory mechanisms of ICH and might provide a novel candidate molecule for prognosis evaluation and clinical treatment of ICH patients.
Materials and methods
Patients
We prospectively recruited all consenting patients admitted to Laiwu Steel Group Hospital (Laiwu, Shandong, China) with a diagnosis of ICH within 24 h after stroke onset between September 2010 and December 2011. Spontaneous ICH (sICH) was defined as sudden and spontaneous bleeding within the brain parenchyma confirmed by head CT scan, with or without intraventricular extension. Patients with hemorrhage secondary to trauma, intracranial tumor, hematological malignancy, and thrombolysis, or an underlying structural abnormality had been excluded by four senior neuroradiologists. To avoid other confounding factors, we excluded the patients with acute or chronic infections (≤ 2 months before sICH), those with autoimmune diseases or any other concurrent morbidities.
All patients were examined on hospital arrival. The Glasgow coma scale score (GCS), used to assess initial neurological deficit, was determined [25]. The related clinical data were collected: demographic data, blood pressure, and CT scan findings. The neuroradiologists, blinded to the clinical information, defined the site of ICH (basal ganglia, thalamic, lobar or other), volume of hematoma, and the presence of intraventricular hemorrhage. The baseline characteristics and potential clinical factors associated with 30-day mortality of the ICH patients were listed in Table 1 . On arrival to the hospital, patients who died of ICH are younger (P < 0.05) and had lower Glasgow coma scale scores (P < 0.05), higher BG (P < 0.05), and higher WBC count (P < 0.05).
Table 1.
Baseline characteristics and potential clinical factors associated with 30-day mortality.
| Characteristics | 30-d mortality |
|||
|---|---|---|---|---|
| Total cohort n = 25 |
Alive n = 15 |
Death n = 10 |
P | |
| Age, years (SD) | 59.6 (11.8) | 63.9(9.4) | 55.6(12.5) | 0.0389a |
| Male, n (%) | 11 (47.8) | 5 (45.5) | 6 (54.5) | 0.0941b |
| GCS score, median (IQR) | 8 (3–12) | 11 (8–14) | 3 (3–4) | 0.00017a |
| GCS score, n (%) | 0.0016b | |||
| 13–15 | 6(21.7) | 6(38.5) | 0(0) | |
| 9–12 | 7(30.4) | 6(46.2) | 1(10) | |
| 3–8 | 12(47.8) | 3(15.4) | 9(90) | |
| Biochemistry and vital signs on hospital arrival | ||||
| BG, mmol/L median (IQR) | 5.7(5.0–11.5) | 6.3(5.3–8.5) | 12.15(5.5–13.3) | 0.0463a |
| WBC, × 109 median (IQR) | 9.6 (7.8–11.3) | 8.7 (6.7–9.6) | 12.3 (10.4–16.6) | 0.0221a |
| SBP, mm Hg (SD) | 170 (23) | 167(23) | 173(28) | 0.3a |
| DBP, mm Hg (SD) | 103(14) | 102(16) | 104(13) | 0.36a |
| Radiological variables | ||||
| sICH localization, n (%) | 0.2512b | |||
| Basal ganglia | 15(60) | 11(73.3) | 4(40) | |
| Thalamic | 4(16) | 1(6.7) | 3(30) | |
| Lobar | 3(12) | 1(6.7) | 2(20) | |
| Other | 3(12) | 2(13.4) | 1(10) | |
| Hematoma volume, mL, median (IQR) | 28(24–70) | 29(24.8–70) | 25(20–70) | 0.4871a |
| IVH, n (%) | 0.534b | |||
| Yes | 11(44) | 7(46.7) | 4(40) | |
| No | 14(56) | 8(53.3) | 6(60) | |
P values of average or median values were analyzed by a non-parametric test.
P values of dispersion of different values were studied by Chi-square test.
The control group consisted of 32 healthy volunteers from Medical Examination Center of Qilu Hospital, Jinan, Shandong. Exclusion criteria for controls were identical to those of ICH patients. The study was approved by the medical ethics committee of Shandong University, and an informed consent was acquired from each subject.
Measurement of blood markers
Blood glucose (BG) was determined by the Roche Diagnostics assay, HITACHI7600 automatic analyzer according to its protocol. White blood cell (WBC) counts were performed with flow cytometry.
Blood sampling and detection of Tim-3 expression on circulating immunocytes by flow cytometry
Blood samples were routinely taken from the antecubital vein from normal volunteers and ICH patients within 24 h since spontaneous hemorrhage onset. Flow cytometry was used to determine Tim-3 expression on peripheral blood immunocytes. One hundred microliters of whole blood was incubated at 4 °C in a dark room with monoclonal antibodies, FITC-conjugated anti-human CD4 (clone: OKT4; eBioscience, San Diego, CA), PEcy5-conjugated anti-human CD3e (clone: UCHT1; eBioscience, San Diego, CA), PE-conjugated anti-Tim-3 (clone: RMT3-23; R&D, Minneapolis, MN), FITC-conjugated anti-CD16/56 (Serotec, Oxford, UK) and FITC-conjugated anti-CD14 (Jingmei Bio Tec, Shanghai, China). Thirty minutes later, stained blood samples were subjected to RBC lysis using a FACS lysis solution (BD Biosciences, San Jose, CA). Cells were washed once with a phosphate buffer solution (PBS) and were detected using a Beckman Coulter flow cytometer (Fullerton, CA, USA), and the data were analyzed using the Cell Quest program.
Outcome measures
The prognosis of ICH patients was estimated using Glasgow outcome scale (GOS) at 30 days. A good functional outcome was defined as GOS score 3 to 5 and a poor functional outcome was defined as GOS score 1 to 2.
Statistical analysis
All data were analyzed using the GraphPad Prism 5 (GraphPad Software Inc., San Diego, CA). The Student's t test and Mann–Whitney nonparametric U test were used for comparison between groups. Pearson correlation analysis was performed between the Tim-3 expression and blood glucose and white blood cell counts. P values were considered significant at P < 0.05.
Results
Dysregulated Tim3 expression on peripheral immunocytes in ICH patients
We first analyzed Tim3 expression on peripheral CD3+ T cells, CD4+ T cells, CD8+ T cells, CD14+ monocytes, and CD16+CD56+ NK cells in ICH patients and age- and sex-matched healthy controls. Flow cytometric analysis showed that Tim-3 expression on CD3+ T cells in patients with ICH was significantly lower than that of healthy controls (Fig. 1A,F, percentage of Tim3+CD3+ T cells, ICH vs healthy, mean ± SD 4.5% ± 0.88% vs 6.4% ± 0.62%, P < 0.05), while Tim-3 expression on CD14+ monocytes (Fig. 1D,I) and CD16+CD56+ NK cells (Fig. 1E,J) were increased (percentage of Tim3+ CD14+ monocytes, ICH vs healthy, mean ± SD 90.1% ± 1.9% vs 79.8% ± 2.6%, P < 0.005; percentage of Tim3+ CD16+CD56+ NK cells, ICH vs healthy, mean ± SD 78.1% ± 2.45% vs 63.0% ± 3.1%, P < 0.005). Further analysis confirmed that Tim-3 expression on CD8+ T cells was decreased in ICH patients compared to healthy controls (Fig. 1C,H, percentage of Tim3+ CD8+ T cells, ICH vs healthy, mean ± SD 11.2% ± 3.2% vs 24% ± 2.6%, P < 0.001), while Tim-3 expression on CD4+ T cells had no change (Fig. 1B,G). These data indicated that Tim-3 expression on PBMC subsets was finely and differentially regulated at the early phase of ICH, which might suggest the complicated roles of Tim-3 and immunocytes in the pathogenesis of ICH.
Fig. 1.
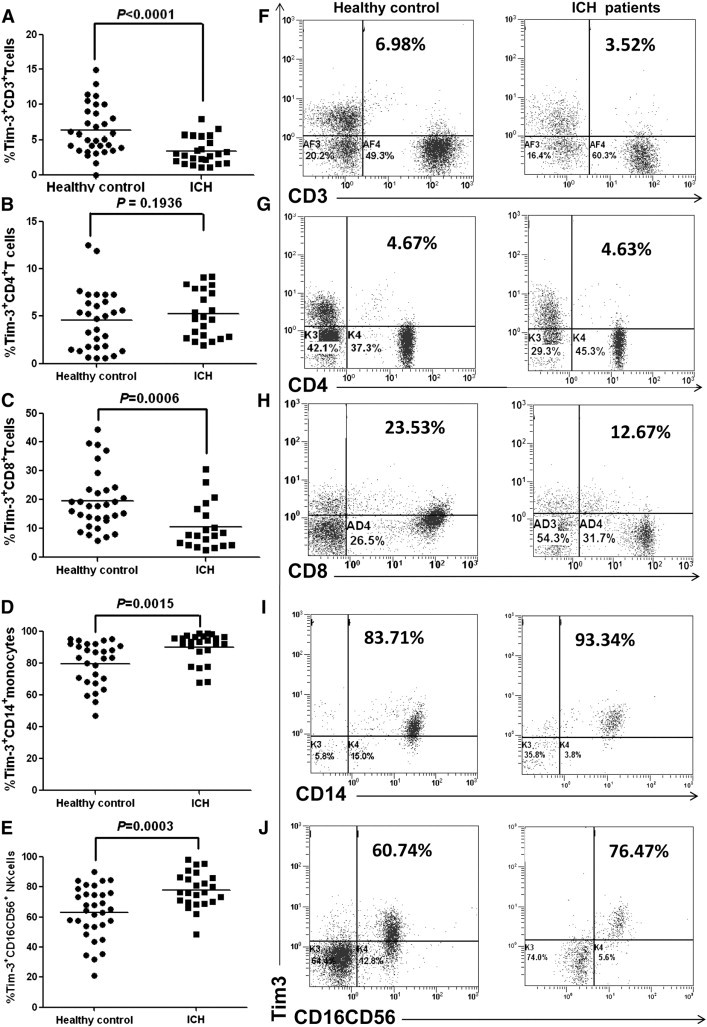
Dysregulated Tim3 expression on peripheral immunocytes in ICH patients. A–E show the percentage of Tim-3+ CD3+ T cells (A), Tim-3+ CD4+ T cells (B), Tim-3+ CD8+ T cells (C), Tim-3+ CD14+ monocytes (D), and Tim-3+ CD16+CD56+ NK cells (E) respectively. F–J show the representative plots of Tim-3 expression on CD3+ T cells (F), CD4+ T cells (G), CD8+ T cells (H), CD14+ monocytes (I), and CD16+CD56+ NK cells (J) respectively. Each dot represents one subject. Horizontal bars indicate the median Tim-3 percentage. P values are shown.
Association between Tim-3 expression and disease severity of ICH patients on admission
Previous studies showed that inflammatory response contributes substantially to brain injury after ICH. Thus, we wonder whether the alteration of Tim-3 expression on immunocytes might also be involved in the pathogenesis of ICH. We analyzed the association of Tim-3 expression on CD8+ T cells, CD14+ monocytes, and CD16+CD56+ NK cells with the Glasgow coma scale score (GCS), which is one of the indicators for disease severity of ICH patients [26]. The statistical results revealed that Tim-3 expression on CD8+ T cells was negatively correlated with GCS score of ICH patients on admission (Fig. 2A, Pearson r = − 0.4671, P < 0.05). However, there were no significant associations between Tim-3 expressions on CD14+ monocytes or CD16+CD56+ NK cells with GCS score of ICH patients (Fig. 2B,C). These data clued that downregulated Tim-3 expression on CD8+ T cells might be a protective response at the early stage of ICH and affluence the severity of brain injury.
Fig. 2.
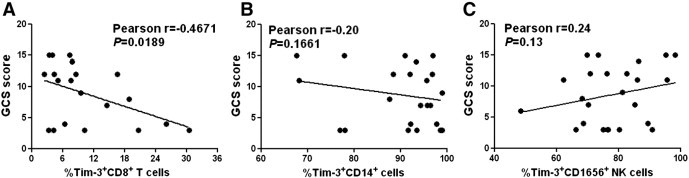
Association between Tim-3 expression and the disease severity of ICH patients on admission. The statistical analysis showed the relationship between GCS score and Tim-3 expression on CD8+ T cells (A), CD14+ monocytes (B), and CD16+CD56+ NK cells (C). Each dot represents a subject. P values are shown.
Relationship between Tim-3 expression and the outcome of ICH patients
Considering that immune factors might be involved in deciding the prognosis and outcome of ICH [12], we then analyzed the relationship between Tim-3 expression and the GOS scores of ICH patients, one of the known indicators for ICH outcome. The statistical analysis showed that Tim-3 expression on CD8+ T cells was reversely correlated with the GOS scores of ICH patients (Fig. 3A, Pearson r = − 0.5, P < 0.05). In contrast, there were no significant correlations between Tim-3 expressions on CD14+ monocytes or CD16+CD56+ NK cells with the GOS scores of ICH patients (Fig. 3B,C). Thus, these data demonstrate that altered Tim-3 expression on CD8+ T cells might be one of prognostic indicators for ICH.
Fig. 3.
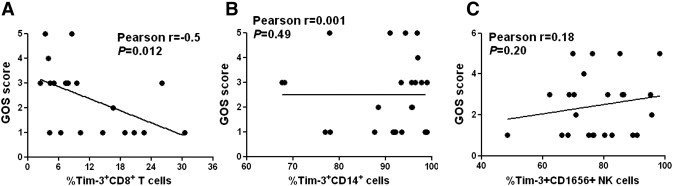
Relationship between Tim-3 expression and the outcome of ICH patients. The statistical results showed the association between GOS score and Tim-3 expression on CD8+ T cells (A), CD14+ monocytes (B), and CD16+CD56+ NK cells (C). Each dot represents a subject. P values are shown.
Significance of altered Tim-3 expression on the inflammatory response of ICH patients
To further evaluate the significance of altered Tim-3 expression on the inflammatory response of ICH patients, we analyzed the relationship between Tim-3 expression on CD8+ T cells, CD14+ monocytes, or CD16+CD56+ NK cells and the white blood cell count in ICH patients. As shown in Fig. 4, Tim-3 expression on CD8+ T cells was positively correlated with the WBC count of ICH patients (Fig. 4A, Pearson r = 0.4520, P = 0.026). On the contrary, there was a negative association between Tim-3 expression on CD16+CD56+ NK cells and white blood cell count in ICH patients (Fig. 4C, Pearson r = − 0.4149, P = 0.0245). However, no significant correlation was found between Tim-3 expression on CD14+ monocytes and white blood cell count in ICH patients (Fig. 4B). These results indicate that Tim-3 expression on immunocytes in ICH patients might modulate the ensuing inflammatory response, which in turn influences the severity and outcome of the patients.
Fig. 4.
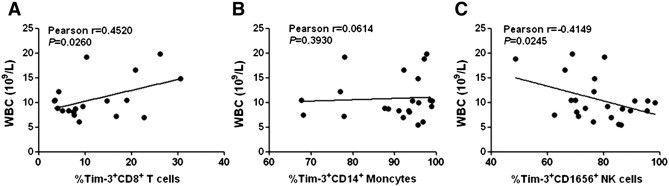
Significance of altered Tim-3 expression on the inflammatory response of ICH patients. The statistical results showed the association between white blood cell count and Tim-3 expression on CD8+ T cells (A), CD14+ monocytes (B), and CD16+CD56+ NK cells (C). Each dot represents a subject. r correlative coefficient and P values are shown.
Association of Tim-3 expression with blood glucose level
Owing to the importance of hyperglycemia both as an outcome determinant of ICH [27] and as a known regulator of inflammation [28], we then analyzed the association of altered Tim-3 expression of ICH patients with blood glucose level. The statistical analysis revealed that there were no significant correlations between blood glucose level and Tim-3 expression on CD8+ T cells, CD14+ monocytes, or CD16+CD56+ NK cells of ICH patients (Fig. 5 ). These results indicate that Tim-3 expression on immunocytes in ICH patients might be modulated in a glucose-independent manner.
Fig. 5.
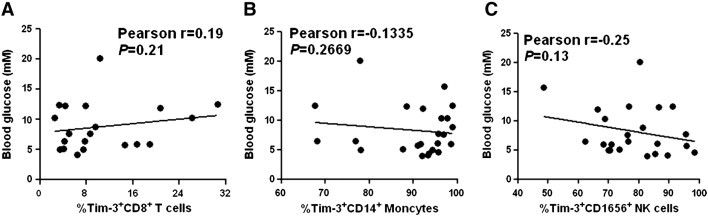
Association of Tim-3 expression with blood glucose level. The statistical results showed the association between blood glucose level and Tim-3 expression on CD8+ T cells (A), CD14+ monocytes (B), and CD16+CD56+ NK cells (C). Each dot represents a subject. r correlative coefficient and P values are shown.
Discussion
Both clinical and animal models of ICH proved that inflammatory response induces secondary brain injury leading to neuronal death, edema, and neurological disability [4], [5], but the exact molecular mechanisms involved in this process are still not fully understood. Here, we carried out a pilot study about the potential role of Tim-3, a novel immunoregulatory molecule, in ICH. We found that Tim-3 expressions on peripheral CD8+ T cells, CD14+ monocytes, and CD16+CD56+ NK cells were significantly altered in ICH patients. Particularly, Tim-3 expression on CD8+ T cells has close relationships with the inflammatory response, the disease severity and the outcome of ICH patients.
Innate immunocytes play important roles in inflammatory central nervous system (CNS) disorders, including ICH [29]. In the present study, we found that Tim-3 expressions in ICH patients were elevated on peripheral CD14+ monocytes and CD16+CD56+ NK cells (Fig. 1). Numerous studies have elucidated the regulatory roles of Tim-3, expressed on innate immune cells. Tim-3 expression on macrophages and dendritic cells promoted tissue inflammation by activating NF-κB and enhancing TNFα secretion [30]. Reported data about Tim-3 on NK cells are paradoxical. Gleason et al. demonstrated that Tim3 functioned as a receptor on NK cells to enhance IFN-γ production. Oppositely, our previous study showed that elevated Tim-3 expression on NK cells in chronic hepatitis B patients suppressed its cytotoxicity and IFN-γ secretion [31]. Unfortunately, we did not find any significant association of Tim-3 expression on peripheral CD14+ monocytes or CD16+CD56+ NK cells with the disease severity or the outcome of ICH patients (Fig. 2). It needs further investigation about the expression pattern of Tim-3 on infiltrating leukocytes in the brains of ICH patients and its dynamic change at the different stages of ICH.
Tim-3 also exerts key regulatory roles on adaptive immune cells and then participates in the pathogenesis of related inflammatory diseases. Interaction of Tim-3 and its ligand induced apoptosis of Th1 cells and inhibited Th1-mediated immunity [32]. Similarly, Tim-3 expression was related with the exhaustion of CD8+ T cells and ameliorated anti-tumor or anti-virus immunity [33]. Flow cytometry results showed that Tim-3 expressions on both CD3+ and CD8+ T cells were weakened in ICH patients (Fig. 1). More importantly, the statistical results revealed that the Tim-3 expression on CD8+ T cells was negatively correlated with GCS score on arrival (Fig. 2), 30-day GOS score (Fig. 3), and the white blood cell count (Fig. 5) of ICH patients. Similarly, Ndhlovu et al. [34] reported that patients with HTLV-1 associated myelopathy/tropical spastic paraparesis also had a systemic down-regulation of Tim-3 expression on virus-specific CD8+ T cells. Moreover, Tim3− CD8+ T cells showed highly active phenotype and might exert regulatory roles. Recently, the roles of CD8+ T cells in inflammatory CNS disorders have attracted particular attentions [35]. In autoimmune and infectious CNS diseases, brain-infiltrating CD8+ T cells exerted not only detrimental proinflammatory and killing functions but also regulatory function by direct killing of activated CD4+ T cells or by secretion of immunosuppressive cytokines such as IL-10 and transforming growth factor-β [36]. In mice with coronavirus-induced acute encephalitis, IL-10+ regulatory CD8+ T cells minimized immunopathological change and were more highly activated [37]. Our results and these reported data imply that the downregulated Tim-3 expression on CD8+ T cells might be probably a protective response in ICH patients and be helpful for patients' recovery. However, the exact roles of CD8+ T cells and the effect of Tim-3 on CD8+ T cells in ICH are still needed to be further explored.
The changes of Tim-3 expression on immunocytes were induced by different inflammatory milieus. Thus, we preliminarily analyzed the potential mechanisms for altered Tim-3 expression in ICH patients. As shown in Table 1, blood glucose level in ICH patients was significantly higher than that of healthy controls, which is consistent with the reported data that hyperglycemia is one of risk factors for poor outcome of ICH [27], [38]. More importantly, both clinical and experimental data showed that acute or chronic hyperglycemia alters many cellular signaling pathways and is involved in the inflammatory processes [28]. Gonzalez et al. [39] showed that high glucose concentrations induce TNF-a production through the down-regulation of CD33. However, we found no significant association between blood glucose concentration and Tim-3 expression on CD8+ T cells, CD14+ monocytes or CD16+CD56+ NK cells in ICH patients. Till now, there are few reports about the underlying mechanisms leading to altered Tim-3 expression in pathological conditions. IL-12 and IL-4 were reported to be responsible for regulating Tim-3 expression in non-Hodgkin lymphoma [40] and in pregnancy [41] respectively. It is worthy to further study the role of other potential factors (e.g. cytokine profiles) in regulating Tim-3 expression in ICH patients.
Taken together, we report that an altered expression in the acute phase of human intracerebral hemorrhage and a significant correlation between Tim-3 expression on CD8+ T cells and the inflammatory response, the disease severity and the outcome of ICH patients, indicate that Tim-3 expression might become a novel candidate molecule for prognosis evaluation and clinical treatment of ICH patients.
Conflict of interest
The authors declare that they have no conflict of interest.
Acknowledgment
This study was supported in parts by Grants from the National Science Foundation of China (No. 91129704, No. 81171642 and No. 30901712), the Fok Ying Tung Education Foundation (No. 121038), the Foundation for Outstanding Young Scientist in Shandong Province (No. BS2011YY032) and the Independent Innovation Foundation of Shandong University, IIFSDU (No. 2011JC005).
Contributor Information
Xiaohong Liang, Email: liangxiaohong@sdu.edu.cn.
Chunhong Ma, Email: machunhong@sdu.edu.cn.
References
- 1.Broderick J., Connolly S., Feldmann E., Hanley D., Kase C., Krieger D. Guidelines for the management of spontaneous intracerebral hemorrhage in adults: 2007 update: a guideline from the American Heart Association/American Stroke Association Stroke Council, High Blood Pressure Research Council, and the Quality of Care and Outcomes in Research Interdisciplinary Working Group. Stroke. 2007;38:2001–2023. doi: 10.1161/STROKEAHA.107.183689. [DOI] [PubMed] [Google Scholar]
- 2.Qureshi A.I., Mendelow A.D., Hanley D.F. Intracerebral haemorrhage. Lancet. 2009;373:1632–1644. doi: 10.1016/S0140-6736(09)60371-8. [DOI] [PMC free article] [PubMed] [Google Scholar]
- 3.Chiu D., Peterson L., Elkind M.S.V., Rosand J., Gerber L.M., Silverstein M.D. Comparison of outcomes after intracerebral hemorrhage and ischemic stroke. J Stroke Cerebrovasc Dis. 2010;19:225–229. doi: 10.1016/j.jstrokecerebrovasdis.2009.06.002. [DOI] [PubMed] [Google Scholar]
- 4.Wang J., Dore' S. Inflammation after intracerebral hemorrhage. J Cereb Blood Flow Metab. 2007;27:894–908. doi: 10.1038/sj.jcbfm.9600403. [DOI] [PubMed] [Google Scholar]
- 5.Xi G., Keep R.F., Hoff J.T. Mechanisms of brain injury after intracerebral haemorrhage. Lancet Neurol. 2006;5:53–63. doi: 10.1016/S1474-4422(05)70283-0. [DOI] [PubMed] [Google Scholar]
- 6.Di Napoli M., Godoy D.A., Campi V., del Valle M., Piñero G., Mirofsky M. C-reactive protein level measurement improves mortality prediction when added to the spontaneous intracerebral hemorrhage score. Stroke. 2011;42:1230–1236. doi: 10.1161/STROKEAHA.110.604983. [DOI] [PubMed] [Google Scholar]
- 7.Zhao B.Q., Wang S., Kim H.Y., Storrie H., Rosen B.R., Mooney D.J. Role of matrix metalloproteinases in delayed cortical responses after stroke. Nat Med. 2006;12:441–445. doi: 10.1038/nm1387. [DOI] [PubMed] [Google Scholar]
- 8.Wang J., Tsirka S.E. Neuroprotection by inhibition of matrix metalloproteinases in a mouse model of intracerebral haemorrhage. Brain. 2005;128:1622–1633. doi: 10.1093/brain/awh489. [DOI] [PubMed] [Google Scholar]
- 9.Molle W.E. Leukocytosis in the cerebrospinal fluid in cerebral hemorrhage. Ohio Med J. 1942;38:325–327. [Google Scholar]
- 10.Lee M.C., Heaney L.M., Jacobson R.L., Klassen A.C. Cerebrospinal fluid in cerebral hemorrhage and infarction. Stroke. 1975;6:638–641. doi: 10.1161/01.str.6.6.638. [DOI] [PubMed] [Google Scholar]
- 11.Bestue-Cardiel M., Martin-Martinez J., Iturriaga-Heras C., Ara-Callizo J.R., Oliveros-Juste A. Leukocytes and primary intracerebral hemorrhage. Rev Neurol. 1999;29:968–971. [PubMed] [Google Scholar]
- 12.Silva Y., Leira R., Tejada J., Lainez J.M., Castillo J., Davalos A. Molecular signatures of vascular injury are associated with early growth of intracerebral hemorrhage. Stroke. 2005;36:86–91. doi: 10.1161/01.STR.0000149615.51204.0b. [DOI] [PubMed] [Google Scholar]
- 13.Loftspring M.C., McDole J., Lu A., Clark J.F., Johnson A.J. Intracerebral hemorrhage leads to infiltration of several leukocyte populations with concomitant pathophysiological changes. J Cereb Blood Flow Metab. 2009;29:137–143. doi: 10.1038/jcbfm.2008.114. [DOI] [PMC free article] [PubMed] [Google Scholar]
- 14.Sansing L.H., Harris T.H., Welsh F.A., Kasner S.E., Hunter C.A., Kariko K. Toll-like receptor 4 contributes to poor outcome after intracerebral hemorrhage. Ann Neurol. 2011;70:646–656. doi: 10.1002/ana.22528. [DOI] [PMC free article] [PubMed] [Google Scholar]
- 15.Monney L., Sabatos C.A., Gaglia J.L., Ryu A., Waldner H., Chernova T. Th1-specific cell surface protein Tim-3 regulates macrophage activation and severity of an autoimmune disease. Nature. 2002;415:536–541. doi: 10.1038/415536a. [DOI] [PubMed] [Google Scholar]
- 16.Kuchroo V.K., Umetsu D.T., DeKruyff R.H., Freeman G.J. The TIM gene family: emerging roles in immunity and disease. Nat Rev Immunol. 2003;3:454–462. doi: 10.1038/nri1111. [DOI] [PubMed] [Google Scholar]
- 17.Oikawa T., Kamimura Y., Akiba H., Yagita H., Okumura K., Takahashi H. Preferential involvement of Tim-3 in the regulation of hepatic CD8+ T cells in murine acute graft-versus-host disease. J Immunol. 2006;177:4281–4287. doi: 10.4049/jimmunol.177.7.4281. [DOI] [PubMed] [Google Scholar]
- 18.Anderson A.C., Anderson E.D., Bregoli L., Hastings W.D., Kassam N., Charles L. Promotion of tissue inflammation by the immune receptor TIM-3 expressed on innate immune cells. Science. 2007;318:1141–1143. doi: 10.1126/science.1148536. [DOI] [PubMed] [Google Scholar]
- 19.Ndhlovu L.C., Lopez-Vergès S., Barbour J.D., Jones R.B., Jha A.R., Long B.R. Tim-3 marks human natural killer cell maturation and suppresses cell-mediated cytotoxicity. Blood. 2012;19(119):3734–3743. doi: 10.1182/blood-2011-11-392951. [DOI] [PMC free article] [PubMed] [Google Scholar]
- 20.Zhu C., Anderson A.C., Kuchroo V.K. TIM-3 and its regulatory role in immune responses. Curr Top Microbiol Immunol. 2011;350:1–15. doi: 10.1007/82_2010_84. [DOI] [PubMed] [Google Scholar]
- 21.Anderson A.C. Tim-3, a negative regulator of anti-tumor immunity. Curr Opin Immunol. 2012;24:213–216. doi: 10.1016/j.coi.2011.12.005. [DOI] [PubMed] [Google Scholar]
- 22.Anderson A.C., Anderson D.E. TIM-3 in autoimmunity. Curr Opin Immunol. 2006;18:665–669. doi: 10.1016/j.coi.2006.09.009. [DOI] [PubMed] [Google Scholar]
- 23.Zhang Z.Y., Schluesener H.J., Zhang Z. Distinct expression of Tim-3 during different stages of rat experimental autoimmune neuritis. Brain Res Bull. 2011;86:229–234. doi: 10.1016/j.brainresbull.2011.07.005. [DOI] [PubMed] [Google Scholar]
- 24.Zhao D., Hou N., Cui M., Liu Y., Liang X., Zhuang X. Increased T cell immunoglobulin and mucin domain 3 positively correlate with systemic IL-17 and TNF-α level in the acute phase of ischemic stroke. J Clin Immunol. 2011;31:719–727. doi: 10.1007/s10875-011-9534-6. [DOI] [PubMed] [Google Scholar]
- 25.Teasdale G., Jennett B. Assessment of coma and impaired consciousness. A practical scale. Lancet. 1974;2:81–84. doi: 10.1016/s0140-6736(74)91639-0. [DOI] [PubMed] [Google Scholar]
- 26.Rosen D.S., Macdonald R.L. Subarachnoid hemorrhage grading scales: a systematic review. Neurocrit Care. 2005;2:110–118. doi: 10.1385/NCC:2:2:110. [DOI] [PubMed] [Google Scholar]
- 27.Qureshi A.I., Palesch Y.Y., Martin R., Novitzke J., Cruz-Flores S., Ehtisham A. Association of serum glucose concentrations during acute hospitalization with hematoma expansion, perihematomal edema, and three month outcome among patients with intracerebral hemorrhage. Neurocrit Care. 2011;15:428–435. doi: 10.1007/s12028-011-9541-8. [DOI] [PubMed] [Google Scholar]
- 28.Esposito K., Nappo F., Marfella R., Giugliano G., Giugliano F., Ciotola M. Inflammatory cytokine concentrations are acutely increased by hyperglycemia in humans: role of oxidative stress. Circulation. 2002;106:2067–2072. doi: 10.1161/01.cir.0000034509.14906.ae. [DOI] [PubMed] [Google Scholar]
- 29.Ransohoff R.M., Brown M.A. Innate immunity in the central nervous system. J Clin Invest. 2012;122:1164–1171. doi: 10.1172/JCI58644. [DOI] [PMC free article] [PubMed] [Google Scholar]
- 30.Freeman G.J., Casasnovas J.M., Umetsu D.T., DeKruyff R.H. TIM genes: a family of cell surface phosphatidylserine receptors that regulate innate and adaptive immunity. Immunol Rev. 2010;235:172–189. doi: 10.1111/j.0105-2896.2010.00903.x. [DOI] [PMC free article] [PubMed] [Google Scholar]
- 31.Ju Y., Hou N., Meng J., Wang X., Zhang X., Zhao D. T cell immunoglobulin- and mucin-domain-containing molecule-3 (Tim-3) mediates natural killer cell suppression in chronic hepatitis B. J Hepatol. 2010;52:322–329. doi: 10.1016/j.jhep.2009.12.005. [DOI] [PubMed] [Google Scholar]
- 32.Sánchez-Fueyo A., Tian J., Picarella D., Domenig C., Zheng X.X., Sabatos C.A. Tim-3 inhibits T helper type 1-mediated auto- and alloimmune responses and promotes immunological tolerance. Nat Immunol. 2003;4:1093–1101. doi: 10.1038/ni987. [DOI] [PubMed] [Google Scholar]
- 33.Sakuishi K., Jayaraman P., Behar S.M., Anderson A.C., Kuchroo V.K. Emerging Tim-3 functions in antimicrobial and tumor immunity. Trends Immunol. 2011;32:345–349. doi: 10.1016/j.it.2011.05.003. [DOI] [PMC free article] [PubMed] [Google Scholar]
- 34.Ndhlovu L.C., Leal F.E., Hasenkrug A.M., Jha A.R., Carvalho K.I., Eccles-James I.G. HTLV-1 tax specific CD8+ T cells express low levels of Tim-3 in HTLV-1 infection: implications for progression to neurological complications. PLoS Negl Trop Dis. 2011;5:e1030. doi: 10.1371/journal.pntd.0001030. [DOI] [PMC free article] [PubMed] [Google Scholar]
- 35.Willing A., Friese M.A. CD8-mediated inflammatory central nervous system disorders. Curr Opin Neurol. 2012;25:316–321. doi: 10.1097/WCO.0b013e328352ea8b. [DOI] [PubMed] [Google Scholar]
- 36.Smith T.R.F., Kumar V. Revival of CD8+ Treg-mediated suppression. Trends Immunol. 2008;29:337–342. doi: 10.1016/j.it.2008.04.002. [DOI] [PubMed] [Google Scholar]
- 37.Trandem K., Zhao J., Fleming E., Perlman S. Highly activated cytotoxic CD8 T cells express protective IL-10 at the peak of coronavirus-induced encephalitis. J Immunol. 2011;186:3642–3652. doi: 10.4049/jimmunol.1003292. [DOI] [PMC free article] [PubMed] [Google Scholar]
- 38.Béjot Y., Aboa-Eboulé C., Hervieu M., Jacquin A., Osseby G.V., Rouaud O. The deleterious effect of admission hyperglycemia on survival and functional outcome in patients with intracerebral hemorrhage. Stroke. 2012;43:243–245. doi: 10.1161/STROKEAHA.111.632950. [DOI] [PubMed] [Google Scholar]
- 39.Gonzalez Y., Herrera M.T., Soldevila G., Garcia-Garcia L., Fabián G., Pérez-Armendariz E.M. High glucose concentrations induce TNF-α production through the down-regulation of CD33 in primary human monocytes. BMC Immunol. 2012;13:19. doi: 10.1186/1471-2172-13-19. [DOI] [PMC free article] [PubMed] [Google Scholar]
- 40.Yang Z.Z., Grote D.M., Ziesmer S.C., Niki T., Hirashima M., Novak A.J. IL-12 upregulates TIM-3 expression and induces T cell exhaustion in patients with follicular B cell non-Hodgkin lymphoma. J Clin Invest. 2012;122:1271–1282. doi: 10.1172/JCI59806. [DOI] [PMC free article] [PubMed] [Google Scholar]
- 41.Zhao J., Lei Z., Liu Y., Li B., Zhang L., Fang H. Human pregnancy up-regulates Tim-3 in innate immune cells for systemic immunity. J Immunol. 2009;182:6618–6624. doi: 10.4049/jimmunol.0803876. [DOI] [PubMed] [Google Scholar]