

Abstract
Background
Ambient air pollution is a modifiable risk factor for cardiovascular disease, yet uncertainty remains about the size of risks at lower levels of fine particulate matter (PM2.5) exposure which now occur in the USA and elsewhere.
Methods
We investigated the relationship of ambient PM2.5 exposure with cause-specific cardiovascular disease mortality in 565 477 men and women, aged 50 to 71 years, from the National Institutes of Health-AARP Diet and Health Study. During 7.5 x 10⁶ person-years of follow up, 41 286 cardiovascular disease deaths, including 23 328 ischaemic heart disease (IHD) and 5894 stroke deaths, were ascertained using the National Death Index. PM2.5 was estimated using a hybrid land use regression (LUR) geostatistical model. Multivariate Cox regression models were used to estimate relative risks (RRs) and 95% confidence intervals (CI).
Results
Each increase of 10 μg/m3 PM2.5 (overall range, 2.9–28.0 μg/m3) was associated, in fully adjusted models, with a 16% increase in mortality from ischaemic heart disease [hazard ratio (HR) 1.16; 95% CI 1.09-1.22] and a 14% increase in mortality from stroke (HR 1.14; CI 1.02-1.27). Compared with PM2.5 exposure <8 μg/m3 (referent), risks for CVD were increased in relation to PM2.5 exposures in the range of 8–12 μg/m3 (CVD: HR 1.04; 95% CI 1.00-1.08), in the range 12–20 μg/m3 (CVD: HR 1.08; 95% CI 1.03-1.13) and in the range 20+ μg/m3 (CVD: HR 1.19; 95% CI 1.10-1.28). Results were robust to alternative approaches to PM2.5 exposure assessment and statistical analysis.
Conclusions
Long-term exposure to fine particulate air pollution is associated with ischaemic heart disease and stroke mortality, with excess risks occurring in the range of and below the present US long-term standard for ambient exposure to PM2.5 (12 µg/m3), indicating the need for continued improvements in air pollution abatement for CVD prevention.
Keywords: Air pollution, cardiovascular disease, mortality
Key Messages
Long-term exposure to fine particulate air pollution is associated with ischaemic heart disease and stroke mortality, with excess CVD risks occurring in the range of and below the present US long-term standard for ambient exposure to PM2.5 (12 µg/m3).
Inclusion of data on region, sex, race or ethnic group, education, body mass index, smoking, alcohol use and ecological characteristics of residence census tracts showed that the air pollution associations were independent of these.
The results, particularly at the lower ranges of exposure experienced in the USA, have implications for air pollution abatement needs internationally.
Introduction
Evaluations developed in the Global Burden of Disease initiative indicate that ambient air pollution has a greater impact on mortality than other major modifiable risk factors, including low physical activity, high sodium diet and high cholesterol.1 Of all US federal regulatory standards, compliance with the air quality standard for fine particulate matter (PM2.5, particles or droplets in the air that are 2.5 microns or less in width) avoids the greatest number of premature deaths, primarily from cardiovascular disease.2,3 The primary health information for setting regulatory standards for PM2.5 comes from observational studies comparing the health outcomes of people exposed to different levels of air pollution, showing particularly important effects of long-term PM2.5 exposure on cardiovascular disease mortality.4 As levels of PM2.5 decrease, the nature of the exposure-response relationship at these lower levels becomes more relevant, as it is this relationship that will predict the benefits of future reductions and the hazards of future increases in exposure. As there have been few studies conducted in this lower PM environment, there is a lack of information on the exposure-response relationship.
We evaluated risks for cause-specific cardiovascular disease (CVD) mortality in a cohort of members of the NIH (National Institutes of Health)-AARP (American Association of Retired Persons) Diet and Health Study, with annual average PM2.5 exposure of 13.3 µg/m3. Having previously established that long-term exposure to PM2.5 is associated with increased risk of total and CVD mortality in this cohort,2 we report here specifically on risks for ischaemic heart disease and stroke, with particular attention to risks in dose ranges currently experienced by large segments of the US population, approaching the present 12 μg/m3 annual average standard of the U.S. Environmental Protection Agency for the USA for PM2.5.5
Methods
Study population
We analysed data from the National Institutes of Health NIH-AARP Diet and Health Study.6 Between the years 1995 and 1996, members of the American Association of Retired Persons residing in six US states (California, Florida, Louisiana, New Jersey, North Carolina and Pennsylvania) and two urban areas (Atlanta, GA, and Detroit, MI,) were recruited to the study. These regions were selected for study because they were areas with large AARP membership, had well-performing cancer registries and, in sum, maximized the minority composition of the cohort. A baseline questionnaire to assess diet, physical activity and medical history was mailed to 3.5 million American Association of Retired Persons members and was satisfactorily completed by 566 398 individuals aged 50 to 71 years. The study, including questionnaire collection and linkage to national databases for mortality follow-up, was approved by the Special Studies Institutional Review Board of the U.S. National Cancer Institute and completion of the questionnaires was considered to imply informed consent. Among 566 398 participants enrolled in the NIH-AARP cohort and available for analysis in 2014, we excluded subjects who lived in locations without census tract information (n = 690), missing PM2.5 data (n = 182) or who exited from the study on the study entry date (n = 49). After accounting for overlapping exclusions, the analytical cohort included 565 477 (99.9%) participants for whom matching PM2.5 air pollution data were available.
Cohort follow-up and mortality ascertainment
Vital status was determined by annual linkage to the Social Security Administration Death Master File, linkage to cancer registries, and by responses to follow-up questionnaires and other mailings to study participants. We used the International Statistical Classification of Diseases, 10th Revision, to define deaths due to cardiovascular disease (CVD: ICD-10 I00-I99), including the major cardiovascular diseases of ischaemic heart disease (IHD: ICD-10 I20-I25) and stroke (ICD-10 I60-I69), as well other CVD (i.e. not IHD or stroke). Institutional Review Board approvals for this research were obtained from the National Cancer Institute and New York University School of Medicine.
PM2.5 exposure assessment
PM2.5 exposure estimates were based on a spatio-temporal prediction model recently developed by Kim et al.7 for the continental USA, 1980–2010. This model provides mean annual estimates of ambient PM2.5 for each census tract in the contiguous USA over the time period of our study, allowing for air pollution exposure estimation on an annual basis for relatively small geographical areas that included study residences of cohort study members. For the period from 1999, reliable long-term regulatory monitoring data from spatially distributed monitoring networks began to become available for PM2.5. For the period 1999 through 2010, Kim et al.7 used annual average PM2.5 data from the U.S. Environmental Protection Agency (EPA) Federal Reference Method (FRM) network, the Interagency Monitoring of Protected Visual Environments (IMPROVE) network and >800 geographical adjustment variables, to derive complete surface estimates of annual average levels of PM2.5 for the contiguous USA. Because regulatory monitoring data were not collected in this fashion before 1999, temporal trends before 1999 were estimated using: (i) extrapolation based on PM2.5 data in FRM/IMPROVE; (ii) PM2.5 sulphate data in the Clean Air Status and Trends Network; and (iii) visibility data across the Weather-Bureau-Army-Navy network. The modelling approach was validated using PM2.5 data collected before 1999 from IMPROVE, California Air Resources Board dichotomous sampler monitoring (CARB dichot), the Children’s Health Study (CHS) and the Inhalable Particulate Network (IPN). Data for this study were accessed7 as annual averages of PM2.5 for census tracts of the contiguous USA.
Statistical methods
We used descriptive statistics to summarize PM2.5 exposures and population characteristics. Person-years of follow-up were calculated from study entry (the return date of the questionnaire) to date of death, loss to follow-up, date of moving from the enrolment residence region or 31 December 2011, whichever occurred first. Cox regression modelling with time-dependent covariates8 was used to model the hazard ratio (HR) and 95% confidence intervals (CIs) for CVD mortality in relation to ambient PM2.5. The Cox regression models were fitted with annual average exposure assignment at the census tract level, lagged by 1 year in a time-dependent fashion and scaled per 10 μg/m3 PM2.5. Models were also fitted in relation to selected categories of exposure [<8 µg/m3 (referent), 8 -<12 µg/m3, 12-<20 µg/m3, 20+ µg/m3].
In Cox regression base models, we treated sex and region (six US states and two municipalities of residence, at study entry) as strata and adjusted for age and race or ethnic group (Non-Hispanic White; Non-Hispanic Black; Hispanic; Asian, Pacific Islander or American Indian/Alaskan Native; unknown). We then included additional personal factors that we a priori hypothesized could potentially confound the relationship between air pollution and cardiovascular disease, including level of education (less than high school, some high school, high school completed, post-high school or some college, college and postgraduate, unknown); marital status (married or living as married, never married, other, unknown); body mass index (BMI) (<18.5 kg/m2, 18.5-<25.0, 25.0-<30.0, 30-<35, 35+, unknown); alcohol (none, <1, 1-<2, 2-<3, 3-<5 and 5+ drinks per day); and smoking status (never smoker, former smoker of <= 1 pack/day, former smoker of >1 pack/day, current smoker of <= 1 pack/day, current smoker of >1 pack/day, unknown). In addition, from U.S. Census summary data, we evaluated characteristics of the census tract of residence at enrolment (median income, percentage not completing high school, percentage unemployed, percentage in poverty, percentage Black) as categorical covariates, by quartiles, in Cox regression models. After inclusion of median income and the percentage not completing high school in the models, each of the other contextual variables considered individually (percentage unemployed, percentage in poverty, percentage Black) did not contribute to changes in HR related to PM2.5 exposure (<10% change). Therefore, median income and the percentage not completing high school were the two census-based variables included as contextual covariates in specified Cox regression models.
In sensitivity analyses, we evaluated risks when incorporating random effects in models for the six US States and two municipalities of residence at study entry. We also compared risks with respect to distance of residence from AQS PM2.5 monitoring sites. We carried out sensitivity analyses with the follow-up risk period starting in 2000 and 2005, instead of 1995–96, because prediction for the model for years before 1999 was derived from multiple sources.7 We also derived PM2.5 estimates for 2000 at the census tract centroids by geospatial interpolation (Empirical Bayesian Kriging), using the AQS data and the ArcGIS Geospatial Analyst module (ESRI, Redlands, CA, USA) and applied these estimates for risk estimation, as an additional sensitivity analysis. Because the largest number of study participants were from California and this region exhibited the greatest exposure variability, we also describe hazard ratios for five regions in this state (Bay Area, Farm Belt, Los Angeles, North and Mountain, Other Southern California). Data analyses were carried out with SAS (SAS 9.3, SAS Institute Inc., Cary, NC) and R statistical software (R 3.4.2, R Foundation for Statistical Computing).
Results
Among the 565 477 participants in our study, the median age at entry was 62.8 years. Of participants, 60.0% were men, 91.2% were Non-Hispanic Whites, more than half of the participants came from either California (30.9%) or Florida (21.5%), and few (7.3%) were resident 50 to 100 km from AQS monitoring sites (Table 1). The median household income in 2000 in census tracts where participants resided was $48 550, somewhat higher than the US average of $40 703 for that year. The median percentage of residents not completing high school in census tracts where participants resided was 13.5%, somewhat lower than the US average of 19.6% in 2000.
Table 1.
NIH-AARP participants and PM2.5 exposure characteristics
| Participants |
PM2.5 Exposure (year 2000) |
||||
|---|---|---|---|---|---|
| Participant category | n | % | Median | IQR | IQR% a |
| Total | 565 477 | 100 | 13.3 | 4.0 | 30.3 |
| Age at entry (years) | |||||
| <57.90 | 141 370 | 25 | 13.5 | 3.9 | 28.6 |
| 57.90-<62.79 | 141 369 | 25 | 13.4 | 4.0 | 29.6 |
| 62.79-<66.73 | 141 369 | 25 | 13.3 | 4.1 | 30.9 |
| 66.73-<72.00 | 141 369 | 25 | 13.1 | 4.2 | 32.1 |
| Sex | |||||
| Male | 339 133 | 60 | 13.3 | 4.0 | 30.0 |
| Female | 226 344 | 40 | 13.4 | 4.1 | 30.6 |
| Race/ethnicity | |||||
| Non-Hispanic White | 516 052 | 91.2 | 13.2 | 4.0 | 30.2 |
| Non-Hispanic Black | 21 970 | 3.9 | 15.0 | 3.1 | 20.9 |
| Hispanic | 10 549 | 1.9 | 13.2 | 6.4 | 48.5 |
| Asian/Pacific Islander/Native | 9137 | 1.6 | 14.0 | 5.8 | 41.3 |
| Unknown | 7769 | 1.4 | 13.6 | 4.2 | 30.8 |
| Education | |||||
| <12 years | 36 001 | 6.4 | 13.3 | 4.1 | 30.4 |
| High school | 111 368 | 19.7 | 13.4 | 3.9 | 29.4 |
| Some college | 55 560 | 9.8 | 13.2 | 4.3 | 32.6 |
| Other post-high school | 130 135 | 23 | 13.2 | 4.1 | 31.1 |
| College graduate | 215 464 | 38.1 | 13.4 | 3.9 | 29.2 |
| Unknown | 16 949 | 3 | 13.3 | 4.2 | 31.5 |
| Marital status | |||||
| Married | 389 195 | 68.8 | 13.2 | 4.0 | 30.1 |
| Never married | 144 824 | 25.6 | 13.5 | 4.2 | 31.0 |
| Other | 26 739 | 4.7 | 14.0 | 4.0 | 28.7 |
| Unknown | 4719 | 0.8 | 13.4 | 4.1 | 30.7 |
| Body mass index (kg/m2) | |||||
| <18.5 | 4776 | 0.8 | 13.4 | 4.1 | 30.8 |
| 18.5-<25.0 | 189 353 | 33.5 | 13.3 | 4.1 | 30.7 |
| 25.0-<30.0 | 234 380 | 41.4 | 13.3 | 4.0 | 30.2 |
| 30-<35 | 86 874 | 15.4 | 13.4 | 4.0 | 29.9 |
| 35+ | 34 737 | 6.1 | 13.6 | 3.9 | 29.0 |
| Unknown | 15 357 | 2.7 | 13.4 | 4.1 | 30.4 |
| Alcohol (drinks per day) | |||||
| None | 140 621 | 24.9 | 13.5 | 4.0 | 29.8 |
| <1 | 294 102 | 52 | 13.4 | 4.0 | 29.4 |
| 1-<2 | 63 840 | 11.3 | 13.0 | 4.1 | 31.7 |
| 2-<3 | 21 389 | 3.8 | 12.9 | 4.2 | 32.4 |
| 3-<5 | 20 821 | 3.7 | 12.8 | 4.2 | 32.9 |
| 5+ | 24 704 | 4.4 | 12.8 | 4.3 | 33.5 |
| Smoking status | |||||
| Never | 196 171 | 34.7 | 13.5 | 3.9 | 28.9 |
| Former, ≤1 pack/day | 150 486 | 26.6 | 13.3 | 4.0 | 30.3 |
| Former, >1 pack/day | 118 803 | 21 | 13.1 | 4.1 | 31.6 |
| Current, ≤1 pack/day | 50 393 | 8.9 | 13.4 | 4.2 | 31.0 |
| Current, >1 pack/day | 27 871 | 4.9 | 13.1 | 4.2 | 32.3 |
| Unknown | 21 753 | 3.8 | 13.4 | 4.0 | 30.1 |
| State/city | |||||
| California | 174 860 | 30.9 | 13.8 | 6.8 | 49.0 |
| Florida | 121 593 | 21.5 | 10.3 | 1.8 | 17.3 |
| Pennsylvania | 84 979 | 15 | 14.8 | 1.8 | 12.2 |
| New Jersey | 71 014 | 12.6 | 13.0 | 2.0 | 15.8 |
| North Carolina | 46 937 | 8.3 | 14.4 | 2.3 | 15.7 |
| Louisiana | 21 710 | 3.8 | 12.8 | 2.4 | 18.7 |
| Detroit | 28 573 | 5.1 | 14.7 | 1.9 | 12.6 |
| Atlanta | 15 811 | 2.8 | 18.0 | 1.6 | 9.0 |
| Median income ($1000) in census tract | |||||
| Quartile 1 (<37.07) | 141 370 | 25.0 | 12.5 | 4.7 | 37.4 |
| Quartile 2 (≥37.07 and <48.55) | 141 369 | 25.0 | 13.5 | 4.5 | 33.5 |
| Quartile 3 (≥48.55 and <65.35) | 141 369 | 25.0 | 13.7 | 3.7 | 27.3 |
| Quartile 4 (≥65.35) | 141 369 | 25.0 | 13.4 | 3.2 | 23.7 |
| Percentage not completing high school in census tract | |||||
| Quartile 1 (<7.8%) | 141 370 | 25.0 | 13.4 | 3.6 | 27.1 |
| Quartile 2 (≥7.8% and <13.5%) | 141 369 | 25.0 | 13.1 | 3.8 | 29.0 |
| Quartile 3 (≥13.5% and <21.2%) | 141 369 | 25.0 | 13.2 | 4.2 | 31.7 |
| Quartile 4 (≥21.2%) | 141 369 | 25.0 | 13.8 | 4.5 | 32.6 |
| Distance to AQS sites | |||||
| < 25 km | 432 610 | 76.5 | 14.0 | 3.8 | 27.5 |
| ≥25 and <50 km | 88 414 | 15.6 | 11.5 | 3.4 | 29.7 |
| ≥50 and 100 km | 41 206 | 7.3 | 10.8 | 2.7 | 24.8 |
IQR%: (interquartile range/median PM2.5) x 100.
Summarizing PM2.5 exposure for the year 2000, levels varied in the study census tracts from 2.9 to 28.0 μg/m3. Median PM2.5 exposure was 13.3 μg/m3, with an interquartile range of 4.0 μg/m3 and an interquartile range percent [IQR% = (IQR/median PM2.5) x 100] of 30.3% (Table 1). Median exposures tended to be higher for Non-Hispanic Blacks (15.0 μg/m3), but little difference in exposures was found for other individual factors of sex, education, marital status, body mass index and alcohol or tobacco use. The greatest annual average exposures were in Atlanta (18.0 μg/m3), an urban area, and the least in Florida (10.3 μg/m3). The range of individual exposures was greatest in California (IQR% = 49.0%); residents in other geographical regions showed limited intraregional variation in PM2.5 (ranging from IQR%: 17.3% for Florida, to 5.7% for Atlanta). PM2.5 exposures varied moderately with respect to residence census tract income and education characteristics, and tended to be lower with greater distance from AQS measurement sites.
During 7.5 x 10⁶ person-years of follow-up (average 13.3 years per person), a total of 135 289 participants died, including 41 286 (30.5%) from CVD, 29 222 (21.6%) due to the major cardiovascular diseases of ischaemic heart disease (IHD, n = 23 328, 17.2%) and stroke (n = 5894, 4.4%), and 12 064 (8.9%) from other forms of CVD (Table 2). When adjusted for personal factors, risks for the major cardiovascular disease deaths were elevated (HR 1.19; 95% CI 1.13-1.25), including for IHD (HR 1.20; 95% CI 1.14-1.27) and stroke (HR 1.16; 95% CI 1.05-1.30). Additional adjustment for census tract characteristics moderately altered these risks, for IHD (HR 1.16; 95% CI 1.09-1.22) and stroke deaths (HR 1.14; 95% CI 1.02-1.27). Compared with PM2.5 exposure <8 μg/m3 (referent), risks for CVD deaths were increased in relation to PM2.5 exposures in the range of 8–12 μg/m3 (CVD: HR 1.04; 95% CI 1.00-1.08), in the range 12–20 μg/m3 (CVD: HR 1.08; 95% CI 1.03-1.13) and in the range 20+ μg/m3 (CVD: HR 1.19; 95% CI 1.10-1.28) (Figure 1; Supplementary S1 Appendix, available as Supplementary data at IJE online).
Table 2.
Hazard ratios (HR) for cardiovascular disease (CVD) mortality associated with an exposure increase of 10 μg/m3 in the level of fine particulate matter (PM2.5)
| Hazard ratio (95% CI) |
||||||||
|---|---|---|---|---|---|---|---|---|
|
Base model
a
|
Adjusted for personal characteristics
b
|
Adjusted for personal and census tract characteristics
c
|
||||||
| Cause of death | Deaths | Cumulative mortality (%) d | HR | 95% CI | HR | 95% CI | HR | 95% CI |
| All CVDe | 41 286 | 5.2 | 1.22 | 1.17-1.28 | 1.15 | 1.10-1.20 | 1.12 | 1.07-1.17 |
| Major CVDf | 29 222 | 3.8 | 1.27 | 1.21-1.33 | 1.19 | 1.13-1.25 | 1.15 | 1.10-1.21 |
| IHDg | 23 328 | 3.0 | 1.28 | 1.21-1.35 | 1.20 | 1.14-1.27 | 1.16 | 1.09-1.22 |
| Stroke | 5894 | 0.8 | 1.21 | 1.09-1.35 | 1.16 | 1.05-1.30 | 1.14 | 1.02-1.27 |
| Other CVD | 12 064 | 1.5 | 1.12 | 1.04-1.21 | 1.05 | 0.97-1.14 | 1.03 | 0.95-1.12 |
All analyses evaluated the time until death in the category. All estimates were adjusted for sex and region (as strata), age and race or ethnic group.
All analyses were evaluated as above, with additional adjustment for level of education, marital status, body mass index (BMI), alcohol and tobacco use.
All analyses were evaluated as above, with additional adjustment for percentage not completing high school and median income of residents of the census tract of residence at study entry, based on data from the 2000 census.
Cumulative mortality (%, per 10 years) = 1-e((-Deaths/PY)*10), where ‘e’ = 2.718 and ‘PY’ = 7.74 x 10⁶ person-years.
CVD, all cardiovascular disease.
Major CVD deaths are deaths due to ischaemic heart disease or stroke.
IHD, ischaemic heart disease specifically.
Figure 1.
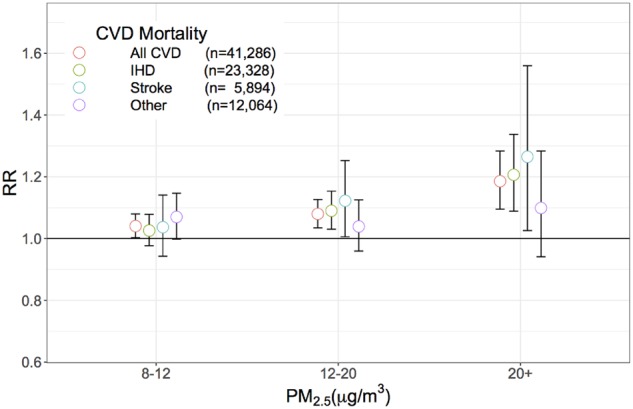
Hazard ratios (HR), for overall and cause-specific CVD mortality, by level of fine particulate matter (PM2.5), NIH-AARP. Hazard ratios are adjusted in Cox regression models for sex and region (six US states and two municipalities of residence, at study entry) as strata, and adjusted for age, race or ethnic group, education, marital status, body mass index (BMI), alcohol use, smoking, median income and percenage not completing high school in the census tract of residence at enrolment.
The risk relationships for IHD and stroke mortality, per 10 μg/m3 PM2.5, were similar with respect to sex, age at study entry and race; furthermore, no clear differentials were observed in risk with respect to average income or educational levels associated with the residence census tracts of study participants (Table 3). The relationship between PM2.5 and mortality due to the major cardiovascular diseases (IHD and stroke) exhibited some variability between regions (Figure 2, Supplementary S2 Appendix, available as Supplementary data at IJE online), although heterogeneity was not strongly evident (P = 0.26). Within California, the state with the largest representation and the greatest variation in PM, PM2.5-associated risks also exhibited some variability, but these differentials may also have been due to chance (P = 0.27).
Table 3.
Hazard ratios (HR) for ischaemic heart disease and stroke (major CVD) mortality associated with an exposure increase of 10 μg/m3 in the level of fine particulate matter (PM2.5)
| Major CVD Deaths a | HR b | 95% CI | P for interaction | |
|---|---|---|---|---|
| Sex | ||||
| Male | 21 337 | 1.12 | 1.06–1.19 | |
| Female | 7885 | 1.23 | 1.12–1.34 | 0.23 |
| Age (years) | ||||
| Below median (<62.79 years) | 8512 | 1.12 | 1.03–1.23 | |
| Above median | 20 710 | 1.16 | 1.10–1.23 | 0.12 |
| Racec | ||||
| Black | 1139 | 0.98 | 0.73–1.32 | |
| White | 26 681 | 1.15 | 1.09–1.21 | 0.63 |
| Census tract: income | ||||
| Below median (<48.55, $1000s) | 16 834 | 1.13 | 1.07–1.21 | |
| Above median | 12 388 | 1.17 | 1.08–1.27 | 0.29 |
| Census tract: not completing high school | ||||
| Below median (<13.5%) | 12 463 | 1.19 | 1.09–1.29 | |
| Above median | 16 759 | 1.15 | 1.08–1.22 | 0.95 |
Major CVD deaths are deaths due to ischaemic heart disease or stroke.
Analyses evaluated the time until death in the category. Hazard ratios (HR) are adjusted in Cox regression models for sex and region (six US states and two municipalities of residence, at study entry) as strata, and adjusted for age, race or ethnic group, education, marital status, body mass index (BMI), alcohol use, smoking, median income and percentage not completing high school in the census tract of residence at enrolment.
Presented for Blacks and Whites only, due to small numbers for other groups.
Figure 2.

Hazard ratios (HR) for major cardiovascular diseases per 10 μg/m3 level of exposure to fine particulate matter (PM2.5), NIH-AARP. Major cardiovascular diseases (CVD) include ischaemic heart disease and stroke. Hazard ratios (HR) are adjusted in Cox regression models for sex and region (six US states and two municipalities of residence, at study entry) as strata, and adjusted for age, race or ethnic group, education, marital status, bodymass index (BMI), alcohol use, smoking, median income and percentage not completing high school in the census tract of residence at enrolment.
We conducted several sensitivity analyses to determine the robustness of our findings. First, we evaluated models that included random effects for each of the eight regions and found no differences in major cardiovascular disease hazard for IHD or stroke death (HR 1.14; 95% CI 1.10-1.19), compared with when these regions were treated as strata in Cox regression models (see Table 2). Second, we estimated these major cardiovascular disease risks for IHD or stroke death with respect to distance from AQS PM2.5 measurement sites and found that risks were consistently elevated at least up to distances of 50 km from these locations (including 92.7% of the study population); we also found that risks were generally elevated with respect to study follow-up period and calendar period (Table 4). Finally, we compared our risk estimates based on combined geographical predictors and annual average PM2.5 data with risks when PM2.5 was estimated by Empirical Bayesian Kriging from PM2.5 data for the year 2000. We found that fully adjusted risks for death due to the major cardiovascular diseases of IHD and stroke were similar by the combined prediction (see Table 2; HR 1.15; 95% CI 1.10-1.21) and by Empirical Bayesian Kriging (HR 1.15; 95% CI 1.11-1.19).
Table 4.
Hazard ratios (HR) for ischaemic heart disease and stroke (major CVD) mortality associated with an exposure increase of 10 μg/m3 in the level of fine particulate matter (PM2.5)
| Major CVD deaths a | HR b | 95% CI | |
|---|---|---|---|
| Distance from AQS sites | |||
| 0-25km | 21 933 | 1.14 | 1.07–1.21 |
| 25-50km | 4783 | 1.31 | 1.11–1.54 |
| 50-100km | 2346 | 0.81 | 0.59–1.11 |
| Time on study (days) | |||
| Q1: ≤1460 | 3192 | 1.04 | 0.91–1.20 |
| Q2: 1460-2921 | 6572 | 1.20 | 1.10–1.31 |
| Q3: 2921-4747 | 9864 | 1.19 | 1.10–1.29 |
| Q4:>4747 | 9594 | 1.09 | 0.99–1.21 |
| Risk entry period | |||
| 1995-96 (all subjects) | 29 222 | 1.15 | 1.10–1.21 |
| 2000 | 24 385 | 1.17 | 1.11–1.23 |
| 2005 | 15 652 | 1.14 | 1.07–1.21 |
Major CVD deaths are deaths due to ischaemic heart disease or stroke.
Analyses evaluated the time until death in the category. Hazard ratios (HR) are adjusted in Cox regression models for sex and region (six US states and two municipalities of residence, at study entry) as strata, and adjusted for age, race or ethnic group, education, marital status, body mass index (BMI), alcohol use, smoking, median income and percentage not completing high school in the census tract of residence at enrolment.
Discussion
In this large cohort, we showed that greater exposure to ambient PM2.5, is associated with increased mortality due to ischaemic heart disease (IHD: 16% increase per 10 μg/m3 PM2.5) and stroke (14% increase), consistent with our previous report on all-cause and total CVD mortality in this cohort.2 Furthermore, a meta-analysis9 of 10 cohort studies10–19 showed a 15% increase (95% CI 1.04-1.27) in CVD mortality per 10 -μg/m3 increase in PM2.5. In addition to modelling exposure-response as a continuous variable, we also identified excesses of CVD mortality below the range of the current regulatory standard of the U.S. Environmental Protection Agency, consistent with the recent identification of excess total mortality in Medicare beneficiaries exposed to PM2.5 at <12 μg/m3 20 and excess IHD mortality in low-exposure residents of Iowa and North Carolina21 and Canada.12,22,23 These findings indicate a need for continued air pollution abatement efforts.
The risks we identified for IHD mortality were similar to those reported in most previous studies. The increase in IHD mortality risk per 10 μg/m3 PM2.5 was about 18% in the American Cancer Society (ACS) cohort of 319 000 participants,24 about 31% in the Canadian national cohort of 2 145 000 participants exposed on average to 8.7 μg/m3 PM2.512 and about 10% in the Rome longitudinal study of 1 265 000 persons.11 An estimated 5 -μg/m3 increase in estimated annual mean PM2.5 was associated with a 13% increase in coronary events, in 100 000 Europeans in the ESCAPE study.25 Most17,24,26–28 but not all other studies19,29 show similar associations of PM2.5 with IHD.
There is also evidence from previous cohort studies for an association between particulate matter and stroke,30 although risk estimates are more variable, with some evidence indicating a greater role in ischaemic than in haemorrhagic stroke.31–33 An 8% excess in stroke mortality per 10 μg/m3 PM2.5 was found in the Rome longitudinal study11 and a 19% excess per 5 μg/m3 PM2.5 was observed in ESCAPE,34 whereas no association was found in the ACS cohort.24 Other generally smaller studies tended to show non-significant excesses,12,16 as reviewed by Hoek et al.9 Specific details on stroke due to haemorrhage or infarction were generally not available from death certificates in our and most other large cohort studies, limiting our understanding of the role of air pollution in these specific stroke types. Also in our study, the number of stroke deaths was far lower than for IHD, somewhat limiting our ability to assess stroke risks. We found no association of PM2.5 exposure with other causes of cardiovascular death, similar to results from the ACS,24 although there is some evidence from other studies of a role for particulate matter in peripheral arterial and venous diseases.35,36
Based on our models, we can expect approximately 570 fewer CVD deaths per 100 000 persons for 5 years associated with a reduction of 10 ug/m3 of the annual average PM2.5 level for Black men in California who are current or recent smokers, at reference values for other covariates, whereas for White women in Florida who are non-smokers, absolute CVD mortality reduction would be approximately 80 deaths per 100 000 persons. Considering a 1-ug/m3 reduction in PM2.5, a more relevant target given current lower exposure levels, the model predicts reductions of 57 and eight deaths, respectively, per 100 000 persons. Although individual risks are modest, PM2.5 exposure is ubiquitous and even small reductions in these exposures could lead to many thousands of deaths averted globally.37
The National Institutes of Health NIH-AARP Diet and Health Study6 includes members of a national organization who volunteered for participation in this study and, therefore are not entirely representative of the population in the regions studied. Given this important caveat, however, our overall findings are robust. Analyses stratified by personal (sex, age, race) or census tract characteristics (income and education) generally revealed similar PM2.5-associated IHD and stroke mortality risks, lessening concerns that observed associations of mortality with PM2.5 might be due to confounding. We observed some degree of variation in risk by geographical area, but these differentials could be due to chance, indicating within the limits of our study that the effects of PM2.5 air pollution are not regionally limited. We demonstrated robustness of our findings for PM2.5-associated IHD mortality, whether risk estimates were based on a hybrid land use regression-geostatistical interpolation or Empirical Bayesian Kriging. Since our study lacked a complete history of moving during the follow-up period, we ended follow-up time when participants moved from the enrolment residence region. Ascertaining detailed within-region moving history and identification of specific PM2.5 chemical constituents38 could be important improvements over our necessarily limited approach. We found that risks were consistently elevated for subjects resident up to 50 km from stationary monitoring sites (including 92.7% of the study population), indicating the robustness of exposure estimation to at least this distance. We found no remarkable variation in risk by time since study entry, indicating that risk patterns were similar over follow-up time, consistent with the proportional hazards assumption of Cox regression analysis.8 Finally, we found that risk estimates were not biased by inclusion of follow-up time and related exposure estimates for earlier time periods, when direct data on PM2.5 were unavailable nationally.7
Although associations of PM2.5 with cardiovascular mortality could partially be related to unmeasured confounding, there is substantial biological support for the observed relations between PM2.5 and cardiovascular disease mortality.28,39 Inhaled particulate matter has extrapulmonary effects on the cardiovascular system, through release from lung-based cells of pro-inflammatory mediators and vasculo-active molecules, through autonomic nervous system imbalance due to particle interactions with lung receptors or nerves, through predisposition to heart rhythm disturbances and potentially through increased platelet activation and translocation of particulate matter into the systemic circulation. Animal models point to acceleration of vascular inflammation and atherosclerosis related to long-term air pollution exposure,40 and long-term PM2.5 exposure has been related in epidemiological study to early-stage progression of intima-media thickness41 and coronary calcification.42 The evidence is strongest for ischaemic disease and a central role of fine particulate matter in the atherothrombotic process,17,24,43,44 but air pollution may also be involved in heart failure and haemorrhagic stroke.45
The large size of the AARP cohort allowed us to address PM2.5–related IHD and stroke mortality in detail across the broad spectrum of exposures experienced in the USA, represented by six states and two cities. Further studies are needed to clarify the hazards associated with specific sources and constituents of particulate matter, with inter-relationships with other environmental pollutants and other factors unexamined in our study. Nevertheless, these results on PM2.5-related IHD and stroke mortality could contribute to the discussion of appropriate measures to reduce the mortality burden of cardiovascular disease.
In summary, with more than 560 000 participants examined for air pollution-related mortality, our study showed that PM2.5 is associated with increased risk for IHD and stroke mortality, with excess CVD risks occurring in the range of and below the present 12 μg/m3 annual average standard for the USA for PM2.5.5
Funding
This research was supported by grants to the NYU School of Medicine from the National Institutes of Health (1R01ES019584-01A1, R21ES021194), as well as by the NYU-NIEHS Center of Excellence (ES00260) and NYU Perlmutter Cancer Center Support Grant (CA 016087–34).
Supplementary Material
Acknowledgements
Dr. Joel Kaufmann of Washington University contributed the census tract level PM2.5 concentration data used in this analysis for the follow-up years prior to 1999, which were developed under the following grants: EPA award No. RD831697 (MESA Air) and RD-83830001 (MESA Air Next Stage), and NIH Awards K24ES013195 and P30ES07033.
Author Contributions
R.B.H., J.A. and G.D.T. conceived of and designed the study. R.B.H., Y.S., C.L. and Y.Z. conducted statistical analyses. R.B.H. drafted the manuscript. R.B.H., J.A., G.D.T., H.R.R., D.T.S., R.J. and M.J. interpreted the data and provided critical revision of the manuscript. R.B.H., J.A. and G.D.T. obtained funding. R.B.H. supervised the study.
Conflict of interest: None declared.
References
- 1. Lim SS, Vos T, Flaxman AD. et al. A comparative risk assessment of burden of disease and injury attributable to 67 risk factors and risk factor clusters in 21 regions, 1990-2010: a systematic analysis for the Global Burden of Disease Study 2010. Lancet 2012;380:2224–60. [DOI] [PMC free article] [PubMed] [Google Scholar]
- 2. Thurston GD, Ahn J, Cromar KR. et al. Ambient particulate matter air pollution exposure and mortality in the NIH-AARP diet and health cohort. Environ Health Perspect 2016;124:484–90. [DOI] [PMC free article] [PubMed] [Google Scholar]
- 3. Dominici F, Greenstone M, Sunstein CR.. Science and regulation. Particulate matter matters. Science 2014;344:257–59. [DOI] [PMC free article] [PubMed] [Google Scholar]
- 4. Brook RD, Newby DE, Rajagopalan S.. Air pollution and cardiometabolic disease: an update and call for clinical trials. Am J Hypertens 2017;31:1–10. [DOI] [PMC free article] [PubMed] [Google Scholar]
- 5.United States Environmental Protection Agency. National Ambient Air Quality Standards for Particulate Matter Washington, DC: Environmental Protection Agency, Federal Register, 2013.
- 6. Schatzkin A, Subar AF, Thompson FE. et al. Design and serendipity in establishing a large cohort with wide dietary intake distributions: the National Institutes of Health-American Association of Retired Persons Diet and Health Study. Am J Epidemiol 2001;154:1119–25. [DOI] [PubMed] [Google Scholar]
- 7. Kim SY, Olives C, Sheppard L. et al. Historical prediction modeling approach for estimating long-term concentrations of PM2.5 in cohort studies before the 1999 implementation of widespread monitoring. Environ Health Perspect 2017;125:38–46. [DOI] [PMC free article] [PubMed] [Google Scholar]
- 8. Cox DR. Regression models and life-tables. J R Stat Soc B 1972;34:187–220. [Google Scholar]
- 9. Hoek G, Krishnan RM, Beelen R. et al. Long-term air pollution exposure and cardio- respiratory mortality: a review. Environ Health 2013;12:43. [DOI] [PMC free article] [PubMed] [Google Scholar]
- 10. Beelen R, Hoek G, van den Brandt PA. et al. Long-term effects of traffic-related air pollution on mortality in a Dutch cohort (NLCS-AIR study). Environ Health Perspect 2008;116:196–202. [DOI] [PMC free article] [PubMed] [Google Scholar]
- 11. Cesaroni G, Badaloni C, Gariazzo C. et al. Long-term exposure to urban air pollution and mortality in a cohort of more than a million adults in Rome. Environ Health Perspect 2013;121:324–31. [DOI] [PMC free article] [PubMed] [Google Scholar]
- 12. Crouse DL, Peters PA, van Donkelaar A. et al. Risk of nonaccidental and cardiovascular mortality in relation to long-term exposure to low concentrations of fine particulate matter: a Canadian national-level cohort study. Environ Health Perspect 2012;120:708–14. [DOI] [PMC free article] [PubMed] [Google Scholar]
- 13. Gan WQ, Koehoorn M, Davies HW, Demers PA, Tamburic L, Brauer M.. Long-term exposure to traffic-related air pollution and the risk of coronary heart disease hospitalization and mortality. Environ Health Perspect 2011;119:501–7. [DOI] [PMC free article] [PubMed] [Google Scholar]
- 14. Hart JE, Garshick E, Dockery DW, Smith TJ, Ryan L, Laden F.. Long-term ambient multipollutant exposures and mortality. Am J Respir Crit Care Med 2011;183:73–78. [DOI] [PMC free article] [PubMed] [Google Scholar]
- 15. Lepeule J, Laden F, Dockery D, Schwartz J.. Chronic exposure to fine particles and mortality: an extended follow-up of the Harvard Six Cities study from 1974 to 2009. Environ Health Perspect 2012;120:965–70. [DOI] [PMC free article] [PubMed] [Google Scholar]
- 16. Lipsett MJ, Ostro BD, Reynolds P. et al. Long-term Exposure To Air Pollution And Cardiorespiratory Disease In The California teachers study cohort. Am J Respir Crit Care Med 2011;184:828–35. [DOI] [PMC free article] [PubMed] [Google Scholar]
- 17. Miller KA, Siscovick DS, Sheppard L. et al. Long-term exposure to air pollution and incidence of cardiovascular events in women. N Engl J Med 2007;356:447–58. [DOI] [PubMed] [Google Scholar]
- 18. Pope CA 3rd, Thun MJ, Namboodiri MM. et al. Particulate air pollution as a predictor of mortality in a prospective study of U.S. adults. Am J Respir Crit Care Med 1995;151:669–74. [DOI] [PubMed] [Google Scholar]
- 19. Puett RC, Hart JE, Suh H, Mittleman M, Laden F.. Particulate matter exposures, mortality, and cardiovascular disease in the health professionals follow-up study. Environ Health Perspect 2011;119:1130–35. [DOI] [PMC free article] [PubMed] [Google Scholar]
- 20. Di Q, Wang Y, Zanobetti A. et al. Air pollution and mortality in the Medicare population. N Engl J Med 2017;376:2513–22. [DOI] [PMC free article] [PubMed] [Google Scholar]
- 21. Weichenthal S, Villeneuve PJ, Burnett RT. et al. Long-term exposure to fine particulate matter: association with nonaccidental and cardiovascular mortality in the Agricultural Health study cohort. Environ Health Perspect 2014;122:609–15. [DOI] [PMC free article] [PubMed] [Google Scholar]
- 22. Crouse DL, Peters PA, Hystad P. et al. Ambient PM2.5, O(3), and NO(2) exposures and associations with mortality over 16 years of follow-up in the Canadian Census Health and Environment Cohort (CanCHEC). Environ Health Perspect 2015;123:1180–86. [DOI] [PMC free article] [PubMed] [Google Scholar]
- 23. Pinault L, Tjepkema M, Crouse DL. et al. Risk estimates of mortality attributed to low concentrations of ambient fine particulate matter in the Canadian Community Health Survey cohort. Environ Health 2016;15:18. [DOI] [PMC free article] [PubMed] [Google Scholar]
- 24. Pope CA, Burnett RT, Thurston GD. et al. Cardiovascular mortality and long-term exposure to particulate air pollution: epidemiological evidence of general pathophysiological pathways of disease. Circulation 2004;109:71–77. [DOI] [PubMed] [Google Scholar]
- 25. Cesaroni G, Forastiere F, Stafoggia M. et al. Long term exposure to ambient air pollution and incidence of acute coronary events: prospective cohort study and meta-analysis in 11 European cohorts from the ESCAPE Project. BMJ 2014;348:f7412.. [DOI] [PMC free article] [PubMed] [Google Scholar]
- 26. Krewski DJ, Burnett RT, Ma R. et al. Extended Follow-up and Spatial Analysis of the American Cancer Society Study Linking Particulate Air Pollution and Mortality: Special Report. Cambridge, MA: Health Effects Institute, 2009. [PubMed] [Google Scholar]
- 27. Schwartz J, Coull B, Laden F, Ryan L.. The effect of dose and timing of dose on the association between airborne particles and survival. Environ Health Perspect 2008;116:64–69. [DOI] [PMC free article] [PubMed] [Google Scholar]
- 28. Brook RD, Rajagopalan S, Pope CA 3rd. et al. Particulate matter air pollution and cardiovascular disease: an update to the scientific statement from the American Heart Association. Circulation 2010;121:2331–78. [DOI] [PubMed] [Google Scholar]
- 29. Beelen R, Stafoggia M, Raaschou-Nielsen O. et al. Long-term exposure to air pollution and cardiovascular mortality: an analysis of 22 European cohorts. Epidemiology (Cambridge, Mass) 2014;25:368–78. [DOI] [PubMed] [Google Scholar]
- 30. Shin HH, Fann N, Burnett RT, Cohen A, Hubbell BJ.. Outdoor fine particles and nonfatal strokes: systematic review and meta-analysis. Epidemiology 2014;25:835–42. [DOI] [PMC free article] [PubMed] [Google Scholar]
- 31. Hong YC, Lee JT, Kim H, Kwon HJ.. Air pollution: a new risk factor in ischemic stroke mortality. Stroke 2002;33:2165–69. [DOI] [PubMed] [Google Scholar]
- 32. Wellenius GA, Schwartz J, Mittleman MA.. Air pollution and hospital admissions for ischemic and hemorrhagic stroke among Medicare beneficiaries. Stroke 2005;36:2549–53. [DOI] [PubMed] [Google Scholar]
- 33. Lisabeth LD, Escobar JD, Dvonch JT. et al. Ambient air pollution and risk for ischemic stroke and transient ischemic attack. Ann Neurol 2008;64:53–59. [DOI] [PMC free article] [PubMed] [Google Scholar]
- 34. Stafoggia M, Cesaroni G, Peters A. et al. Long-term exposure to ambient air pollution and incidence of cerebrovascular events: results from 11 European cohorts within the ESCAPE project. Environ Health Perspect 2014;122:919–25. [DOI] [PMC free article] [PubMed] [Google Scholar]
- 35. Peng RD, Chang HH, Bell ML. et al. Coarse particulate matter air pollution and hospital admissions for cardiovascular and respiratory diseases among Medicare patients. JAMA 2008;299:2172–79. [DOI] [PMC free article] [PubMed] [Google Scholar]
- 36. Baccarelli A, Martinelli I, Zanobetti A. et al. Exposure to particulate air pollution and risk of deep vein thrombosis. Arch Intern Med 2008;168:920–27. [DOI] [PMC free article] [PubMed] [Google Scholar]
- 37. Landrigan PJ, Fuller R, Acosta NJR. et al. The Lancet Commission on pollution and health. Lancet 2018;391:462–512. [DOI] [PubMed] [Google Scholar]
- 38. Heo J, Schauer JJ, Yi O, Paek D, Kim H, Yi SM.. Fine particle air pollution and mortality: importance of specific sources and chemical species. Epidemiology 2014;25:379–88. [DOI] [PubMed] [Google Scholar]
- 39. Newby DE, Mannucci PM, Tell GS. et al. Expert position paper on air pollution and cardiovascular disease. Eur Heart J 2015;36:83–93b. [DOI] [PMC free article] [PubMed] [Google Scholar]
- 40. Nemmar A, Hoylaerts MF, Nemery B.. Effects of particulate air pollution on hemostasis. Clin Occup Environ Med 2006;5:865–81. [DOI] [PubMed] [Google Scholar]
- 41. Adar SD, Sheppard L, Vedal S. et al. Fine particulate air pollution and the progression of carotid intima-medial thickness: a prospective cohort study from the multi-ethnic study of atherosclerosis and air pollution. PLoS Med 2013;10:e1001430.. [DOI] [PMC free article] [PubMed] [Google Scholar]
- 42. Kaufman JD, Adar SD, Barr RG. et al. Association between air pollution and coronary artery calcification within six metropolitan areas in the USA (the Multi-Ethnic Study of Atherosclerosis and Air Pollution): a longitudinal cohort study. Lancet 2016;388:696–704. [DOI] [PMC free article] [PubMed] [Google Scholar]
- 43. Zanobetti A, Schwartz J.. Particulate air pollution, progression, and survival after myocardial infarction. Environ Health Perspect 2007;115:769–75. [DOI] [PMC free article] [PubMed] [Google Scholar]
- 44. Puett RC, Schwartz J, Hart JE. et al. Chronic particulate exposure, mortality, and coronary heart disease in the Nurses' Health Study. Am J Epidemiol 2008;168:1161–68. [DOI] [PMC free article] [PubMed] [Google Scholar]
- 45. Kim H, Kim J, Kim S. et al. Cardiovascular effects of long-term exposure to air pollution: a population-based study with 900 845 person-years of follow-up. J Am Heart Assoc 2017, Nov 8. doi: 10.1161/JAHA.117.007170. [DOI] [PMC free article] [PubMed] [Google Scholar]
Associated Data
This section collects any data citations, data availability statements, or supplementary materials included in this article.