

Mainstream news, mainly on television, vastly outweighs fake news, and news itself is a small fraction of U.S. media consumption.
Abstract
“Fake news,” broadly defined as false or misleading information masquerading as legitimate news, is frequently asserted to be pervasive online with serious consequences for democracy. Using a unique multimode dataset that comprises a nationally representative sample of mobile, desktop, and television consumption, we refute this conventional wisdom on three levels. First, news consumption of any sort is heavily outweighed by other forms of media consumption, comprising at most 14.2% of Americans’ daily media diets. Second, to the extent that Americans do consume news, it is overwhelmingly from television, which accounts for roughly five times as much as news consumption as online. Third, fake news comprises only 0.15% of Americans’ daily media diet. Our results suggest that the origins of public misinformedness and polarization are more likely to lie in the content of ordinary news or the avoidance of news altogether as they are in overt fakery.
INTRODUCTION
Since the 2016 U.S. presidential election, the deliberate spread of online misinformation, in particular on social media platforms such as Twitter and Facebook, has generated extraordinary interest across several disciplines (1–10). In large part, this interest reflects a deeper concern that the prevalence of “fake news” has increased political polarization, decreased trust in public institutions, and undermined democracy (11–14). Recently, a handful of papers have attempted to measure the prevalence of fake news on social media (1, 8, 9), finding that exposure is rare compared with other types of news content and generally concentrated among older, politically conservative Americans. Despite these findings, many researchers and other observers continue to advocate that deliberately engineered misinformation disseminated on social media is sufficiently prevalent to constitute an urgent crisis (15, 16). Disagreements over the prevalence and importance of misinformation are difficult to evaluate empirically for three reasons. First, Americans consume news online via desktop computers and, increasingly, mobile devices as well as on television (TV); yet, no single source of data covers all three modes. As a result, researchers select data sources on the basis of their availability, which may not correspond with either representativeness or comprehensiveness. For example, many studies rely exclusively on Twitter, whose users are highly unrepresentative of the general population (17), while even studies that rely on representative online panels omit TV consumption (18). Second, analyses of fake news often fail to account for how much of it is consumed relative to other types of news or non–news-related content. Because the volume of online content is so vast, even a very large numerator may constitute only a tiny fraction of the total (19). Third, even if its prevalence is low relative to other types of content, fake news could be important either because it is disproportionately impactful or because it is concentrated on small subpopulations. While comprehensive measures of prevalence are intrinsically interesting and can indicate how much relative impact different types of content would have to have to dominate, they cannot on their own resolve questions about influence.
Here, we address the first two of three challenges, leaving the third for future research. We assembled a unique dataset that drew on three different sources to capture consumption across the two principal modes of news production, TV and online, where we integrate total consumption across the modes by demographic bucket (see Materials and Methods and the Supplementary Methods for a more detailed description of the datasets, definitions of key terms, and estimation methods). Content is defined by the mode on which it is consumed not produced; thus, for example, video consumed on desktop or a mobile device is categorized as online consumption even when it is produced by mainstream TV stations.
MATERIALS AND METHODS
First, we measure national TV programming using Nielsen’s nationally representative TV panel (N ≈ 100,000). In addition, we measure local programming using a subset of the national panel (N ≈ 50,000) sampled from the 25 largest local markets. TV news consumption is defined as time devoted to watching any of the roughly 400 programs that are classified by Nielsen as “news”—a category that includes “hard news” (e.g., evening cable and network news), magazine news (e.g., Inside Edition and Dateline), morning shows (e.g., Good Morning America and Today Show), and entertainment news (e.g., TMZ, Access Hollywood)—and late-night comedy shows (e.g., The Daily Show With Trevor Noah and The Late Show With Stephen Colbert), which are frequently viewed as a source of news-related information, especially for younger viewers (20).
Second, we measure desktop and mobile media consumption (including media consumed through mobile applications) using Comscore’s nationally representative desktop and mobile panel, which breaks out total time spent on different types of media sites including news, search, and social media by demographic bucket. Online (mobile and desktop) news consumption is defined as time spent on any article published on one of more than 800 websites, adapted from (21), that primarily cover “hard” news topics like politics, business, and U.S. and international affairs. Correspondingly, fake news consumption is the time spent on 1 of 98 websites previously identified by researchers (8), professional fact checkers, and journalists as sources of fake, deceptive, low-quality, or hyperpartisan news. Thus, in accordance with the previous literature, with the notable exception of YouTube, fake news is defined at the publisher or URL (Uniform Resource Locator) level. We further categorize online non-news consumption for the top 2000 domains, ranked by mobile and desktop traffic, into one of 28 Comscore categories (e.g., entertainment, gaming, health, social media, sports)
Third, we use Nielsen’s nationally representative desktop-only web panel (90,000 in 2016 decreasing to 60,000 in 2018; see the Supplementary Materials for details), which records individual visits to URLs and the referral URL, to impute passive news consumption (e.g., news snippets, images, headlines, and summaries that appear on a newsfeed or search results page but which the user does not click on) on the top four social media sites (Facebook, YouTube, Twitter, and Reddit) and on the top three search engines (Google, Bing, and Yahoo). For every site except YouTube, we estimated this fraction as the fraction of URLs that are referred to from the platform in question that we classify as news and fake news, respectively. For YouTube, which hosts all of its own content, we computed the fraction of a random sample of 360,000 videos (10,000 per month, weighted by viewing time) that are classified as “news and politics” in YouTube’s internal classification scheme. We further count as online news consumption all time spent on the three major portals: MSN, Yahoo, and AOL. Last, we use a subset of the Nielsen web panel (N ≈15,000) who also appear in the TV panel to estimate the relation between desktop and TV news consumption.
RESULTS
Figure 1 shows the breakdown of Americans’ daily desktop, mobile, and TV media consumption, measured in minutes per person, over the course of 3 years spanning January 2016 through December 2018. Figure 1A shows this pattern in aggregate, while Fig. 1 (B and C) shows the same pattern for the youngest (18- to 24-year-olds) and oldest (55+) age brackets, respectively (see fig. S1 for the remaining age categories). On average, Americans devote over 7.5 hours (460 min)/day to media consumption, including TV, streaming video or music, gaming, engaging with social media, or browsing the web either from a desktop or mobile devices (Fig. 1A). This total is relatively stable over the 36-month period of our data, showing seasonal declines during the summers and peaks coinciding with the 2016 presidential election and the presidential inauguration in January 2017 (because the shares devoted to different types of content remain generally stable over time, in subsequent figures we aggregate over time; however, the full overtime results are available in the Supplementary Materials). As expected, younger Americans spend more time on mobile devices and less time watching TV than average (Fig. 1B), whereas the pattern is reversed for older Americans (Fig. 1C); however, the former watch so much less TV than the latter that their total media consumption is about 30% less despite their higher mobile usage. Figure 1 also reveals three results that directly undercut the conventional wisdom about the prevalence of fake news online and more broadly question the importance of online news relative to TV news and other types of media consumption.
Fig. 1. Overall information consumption by category and platform over time, from January 2016 to December 2018.
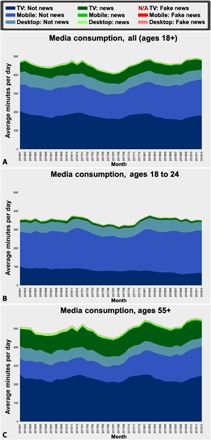
Breakdown of consumption for (A) the entire adult sample, 18 years and older, (B) 18 to 24 years old, and (C) 55 years and older. See table S6 for numerical values.
First, the bulk of daily media consumption is not news related. As expected, young adults (Fig. 1B) spend less time consuming news (colored green) than average and far less time than the oldest group (Fig. 1C), but in all age groups, news consumption is heavily outweighed by non-news consumption (colored blue). Of the 460 min per person per day of total media consumption, approximately 400 min (86%) is not related to news of any kind (see table S6 for exact figures). Figure 2 shows a more detailed breakdown of news and non-news categories of media consumption online (Fig. 2A) and on TV (Fig. 2B). For online consumption, which includes mobile and desktop, news is dominated by several other categories such as entertainment, social media, and search. Even including passive exposure to news content on social media sites (Facebook, Twitter, Reddit, and YouTube), search engines (Google, Bing, and Yahoo!), and portals (Yahoo!, MSN, and AOL), news accounts for only 4.2% of total online consumption. TV news is more prominent, comprising the largest single category of TV consumption and 23% of the total. In aggregate, however, TV news is still heavily outweighed by non-news programming such as dramas, documentaries, movies, and sports (Fig. 2B). To the extent that Americans are uninformed about politics, economics, and other issues relevant to democracy, the reason may be simply that they are choosing not to inform themselves (22).
Fig. 2. Detailed breakdown of overall media consumption for Online and TV.
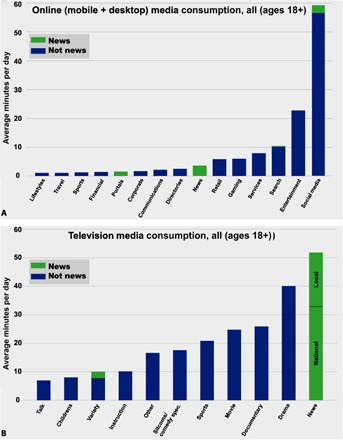
(A) Online consumption (including mobile and desktop) for the top 2000 sites per applications on Comscore. (B) TV consumption by program category. Total online consumption is 227 min per person per day, of which 58% is accounted for by the top 2000 sites, while total television consumption is 232 min per person per day. To compute news consumption in search and social media, excluding YouTube, we use the share of referrals from the site in question that redirect to news articles as a proxy for the share of time a user is exposed to news-related content on the platform. For YouTube, which does not redirect users to external sites, we randomly sampled 10,000 videos per month (weighted by viewing time) and computed the percentages that were classified as “news and politics”. Because portals such as MSN, Yahoo, and AOL almost always display some news-related stories on their landing pages, we count 100% of time spent on portals as news consumption. Last, news consumption in the “variety” category of television viewing is computed as 100% of time attributed to late-night comedy programs, such as The Daily Show With Trevor Noah, which are known to contain commentary on politics and current events. For clarity, (A) shows only the top 15 of 28 categories (see table S7 for numerical values).
Second, to the extent that Americans do consume news, they do so overwhelmingly by watching TV. Overall, the ratio of TV to online news—including both desktop and mobile devices—is more than five to one (54 min versus 9.7 min), varying from a minimum of almost two to one for 18- to 24-year-olds (9 min versus 5 min) to a maximum of more than seven to one for those 55 years and older (94 min versus 13 min). Online news (including both mobile and desktop activity) was more prominent in the vicinity of the 2016 election; however, the ratio of TV to online remained similar (the minimum ratio in our 36-month time period is 4.5:1 during December 2016). Drawing on our sample of roughly 15,000 individuals who are members of both the Nielsen web and TV panels, Fig. 3 shows that while essentially everyone is exposed to a substantial amount of daily TV news, 44% of the sample is exposed to no online news at all and almost three quarters spends less than 30 s/day reading news online (see fig. S2 for results broken down by age group, and tables S8 and S9 for exact values). Because the Nielsen panel records only desktop activity, these figures understate the true consumption of online news (i.e., including mobile). In light of our earlier result that average mobile news consumption is slightly less than desktop news consumption, however, and assuming that the distribution of news consumption is not markedly different on mobile versus desktop devices, then it follows that a majority of Americans spend less than a minute per day reading news online.
Fig. 3. Television versus desktop news consumption aggregated over all age categories 18 to 55+.
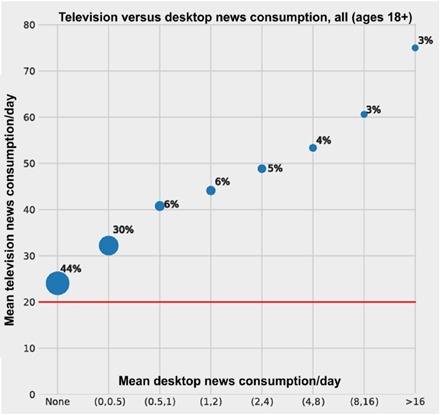
For each month, the overlap panelists are separated into groups corresponding to different ranges of web news consumption. For each group, the mean television news consumption and group size as a percentage of all panelists are computed. Overtime averages for the mean television news consumption and size of each group are calculated by computing the mean television news mean and mean group size over all 36 months. Error bars are SEs obtained via bootstrapping for group size and group television news consumption, respectively, and are smaller than the symbols. See fig. S2 for all results broken down by age group, and tables S8 and S9 for numerical values.
Third, fake news consumption (Fig. 1, colored red) is a negligible fraction of Americans’ daily information diet. We emphasize here that both our definition of news and fake news are extremely broad. In the case of news, we include, for example, morning shows and portals, while our definition of fake news includes highly biased and hyperpartisan news sites such as Breitbart.com [i.e., corresponding to the “red” and “orange” categories defined in (8)] and outright fraudulent sites (i.e., the “black” category). Our estimates of the prevalence of news and fake news therefore likely overstate the true prevalence, although we also find that adopting stricter definitions makes no discernable difference to our main conclusions (see fig. S3 for comparison of upper and lower bound estimates of news and fake news consumption, respectively, and table S10 for exact values). Figure 4 shows a more detailed breakdown of news consumption online (Fig. 4A) and on TV (Fig. 4B), also broken out by age group (see table S11 for numerical values).
Fig. 4. News-only consumption by age.
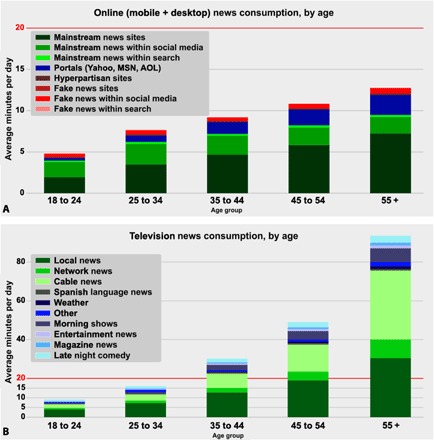
Detailed breakdown of news-only consumption by age group for (A) online (including mobile and desktop) and (B) television. See fig. S4 (A and B) for results plotted over time from January 2016 to December 2018. See table S11 for numerical values.
Referring first to online consumption, Fig. 4A shows that fake news stories were more likely to be encountered on social media (dark versus light red) and that older viewers were heavier consumers than younger ones, consistent with previous findings (6, 8, 9). No age group, however, spent more than an average of a minute per day engaging with fake news, nor did it occupy more than 1% of their overall news consumption (i.e., including TV) or more than 0.2% of their overall media consumption. Of potential concern, a very small fraction of desktop panelists (1.97%) did consume more fake news than mainstream news; however, this number drops to 0.7% when restricting to people who consumed at least 1 min of fake news per day. When restricting to just black and red fake news sites (i.e., excluding hyperpartisan sites), these numbers drop to 0.97 and 0.32%, respectively. That is, while majority-fake news consumers do exist, they are extremely rare and most of them consume very little online news of any kind.
Turning to TV, there are no objectively fake news stations of the sort that exist online, i.e., that are exclusively or near exclusively devoted to disseminating deliberate falsehoods while masquerading as legitimate news organizations. Including TV news consumption in the previous calculation would therefore reduce the population of majority-fake news consumers even further. Nonetheless, misinformation construed more broadly can also manifest itself in regular news programming in the form of selective attention, framing, “spin,” false equivalence, and other forms of bias. Although a detailed analysis of false or misleading content contained in conventional news programming is beyond the scope of this paper, it is nonetheless interesting to examine how much collective attention is paid to different categories of news. Figure 4B provides this breakdown, showing first that TV news consumption greatly exceeds online news (red line) and is sharply increasing with age, ranging from less than 10 min/day (18- to 24-year-olds) to over 90 min/day (55+). Local news is the dominant form of news consumption for all age groups except the oldest, for whom national cable news (ranked second overall) is slightly more popular. In turn, the relative dominance of cable news in the 55+ category is driven by a small minority of voracious news consumers (roughly the top 10% by consumption). Hard network news (e.g., evening news shows) is ranked third for all age groups, while morning shows are ranked fourth for all age groups but the youngest, which slightly prefer late-night comedy shows. Given the large differences in total news consumption across age groups, the consistency of ranking of different types of news is notable. Also notable given its perceived importance for younger viewers is the limited presence of late-night comedy (less than 5% overall, and less than 7% for 18- to 24-year-olds).
DISCUSSION
Summarizing, we note that according to Google Scholar at the time of final submission, 2210 English language publications with “fake news” in the title had appeared since January 2017, compared with just 73 in all the years leading up to and including 2016. Not only has interest in fake news clearly exploded in the past 2 years, but it has also far outstripped attention to TV news: A comparable count yielded just 329 articles published since 2017 containing either “television news” or “TV news” in their titles, while 708 articles contained “online news,” 394 contained “Twitter” or “Facebook” and “news,” and 556 contained “social media” and “news.” Restricting further to studies that explicitly connect misinformation to a particular platform, Google Scholar yielded 99 results containing both “misinformation” and one of “online” or “social media” or “web” in the title since 2017, but just 1 result for “misinformation” and “television” or “TV”—an article about the unrealistic survival rates of cardiopulmonary resuscitation on TV shows. This evident focus of the recent research literature on online sources of fake news and misinformation is directionally and proportionately inconsistent with our results in three ways. First, whereas the research treats news consumption as the issue of primary importance, we find that most media consumption, whether online or on TV, is not news related. Second, whereas research on online news—and even more specifically news on social media platforms—markedly outweighs research on TV news, we find that TV news consumption dominates online by a ratio of 5:1 (where the ratio is even more extreme for social media sites). Third, whereas the topic of fake news outstrips all other news-related research, we find that fake news itself is only 1% of overall news consumption, substantially lower for Twitter alone (8). Instead, news consumption is heavily dominated by mainstream news sources both online and on TV.
We emphasize that our results do not imply that fake news is not a problem worthy of attention. Arguably the deliberate circulation of false information with the objective of creating confusion and discord is intolerable in principle and should be combatted at any prevalence greater than zero. Moreover, it is possible that news consumed online could have more impact per minute of exposure than news consumed on TV, or that fake news could have an outsized impact compared with regular news, or that it could have large impacts on certain subpopulations. Last, we note that our definitions of news and fake news are—with the exception of YouTube—dependent on site or program-level classifications. News-relevant content on social media that is not tied to a particular URL, or false or misleading information that is promulgated by generally reliable news sources, would therefore be misclassified by our scheme. We hope that future work will address all of these areas of uncertainty. We note, however, that our methodology was designed to be consistent with previous work, which also has used list-based classification and relied on prevalence (i.e., not impact) to assess importance. On those terms, our finding that fake news is extremely rare, comprising only about one-tenth of 1% of Americans’ overall daily media diet, suggests that concerns regarding possible threats to democracy should be much broader in scope than deliberately engineered falsehoods circulating on social media. In particular, public ignorance or misunderstanding of important political matters could also arise out of a combination of (i) ordinary bias and agenda setting in the mainstream media (23–25)) and (ii) the overall low exposure of many Americans to news content in general, especially in written form. We conclude that future work on misinformation and its potentially corrosive effects on democracy should consider all potential sources of problematic content, as well as the absence of relevant content, not simply the type that is most easily identified and least associated with conventional media interests (19).
Supplementary Material
Acknowledgments
We are grateful to Harmony Labs for engineering and financial support and to Nielsen for access to television and web panels. Funding: We thank the Nathan Cummings Foundation (18-08129) for funding support. Author contributions: All authors contributed to the design of the research. J.A. and B.H. analyzed the data and drafted the Supplementary Materials, and J.A., B.H., and D.R. produced the figures. D.J.W. drafted the paper, and all authors contributed to the revisions. Competing interests: The authors declare that they have no competing interests. Data and materials availability: All data needed to evaluate the conclusions in the paper are present in the paper and/or the Supplementary Materials. Additional data related to this paper may be found at https://osf.io/cygta/ or requested from the authors.
SUPPLEMENTARY MATERIALS
Supplementary material for this article is available at http://advances.sciencemag.org/cgi/content/full/6/14/eaay3539/DC1
REFERENCES AND NOTES
- 1.Allcott H., Gentzkow M., Social Media and Fake News in the 2016 Election. J. Econ. Perspect. 31, 211–236 (2017). [Google Scholar]
- 2.Shu K., Sliva A., Wang S., Tang J., Liu H., Fake news detection on social media: A data mining perspective. ACM SIGKDD Explor. Newsl. 19, 22–36 (2017). [Google Scholar]
- 3.Lazer D. M. J., Baum M. A., Benkler Y., Berinsky A. J., Greenhill K. M., Menczer F., Metzger M. J., Nyhan B., Pennycook G., Rothschild D., Schudson M., Sloman S. A., Sunstein C. R., Thorson E. A., Watts D. J., Zittrain J. L., The science of fake news. Science 359, 1094–1096 (2018). [DOI] [PubMed] [Google Scholar]
- 4.Vosoughi S., Roy D., Aral S., The spread of true and false news online. Science 359, 1146–1151 (2018). [DOI] [PubMed] [Google Scholar]
- 5.Shao C., Hui P.-M., Wang L., Jiang X., Flammini A., Menczer F., Ciampaglia G. L., Anatomy of an online misinformation network. PLOS ONE 13, e0196087 (2018). [DOI] [PMC free article] [PubMed] [Google Scholar]
- 6.A. Guess, B. Nyhan, J. Reifler, Selective Exposure to Misinformation: Evidence from the consumption of fake news during the 2016 US presidential campaign, European Research Council (2018).
- 7.Stella M., Ferrara E., De Domenico M., Bots increase exposure to negative and inflammatory content in online social systems. Proc. Natl. Acad. Sci. U.S.A. 115, 12435–12440 (2018). [DOI] [PMC free article] [PubMed] [Google Scholar]
- 8.Grinberg N., Joseph K., Friedland L., Swire-Thompson B., Lazer D., Fake news on Twitter during the 2016 U.S. presidential election. Science 363, 374–378 (2019). [DOI] [PubMed] [Google Scholar]
- 9.Guess A., Nagler J., Tucker J., Less than you think: Prevalence and predictors of fake news dissemination on Facebook. Sci. Adv. 5, eaau4586 (2019). [DOI] [PMC free article] [PubMed] [Google Scholar]
- 10.Pennycook G., Rand D. G., Fighting misinformation on social media using crowdsourced judgments of news source quality. Proc. Natl. Acad. Sci. U.S.A. 116, 2521–2526 (2019). [DOI] [PMC free article] [PubMed] [Google Scholar]
- 11.Persily N., Can democracy survive the Internet? J. Democr. 28, 63–76 (2017). [Google Scholar]
- 12.J. Tucker, A. Guess, P. Barberá, C. Vaccari, A. Siegel, Social media, political polarization, and political disinformation: A review of the scientific literature (2018); https://papers.ssrn.com/sol3/papers.cfm?abstract_id=3144139.
- 13.Ciampaglia G. L., Fighting fake news: A role for computational social science in the fight against digital misinformation. J. Comput. Soc. Sci. 1, 147–153 (2018). [Google Scholar]
- 14.K. Clayton, S. Blair, J. A. Busam, S. Forstner, J. Glance, G. Green, A. Kawata, A. Kovvuri, J. Martin, E. Morgan, M. Sandhu, R. Sang, R. Scholz-Bright, A. T. Welch, A. G. Wolff, A. Zhou, B. Nyhan, Real Solutions for Fake News? Measuring the Effectiveness of General Warnings and Fact-Check Tags in Reducing Belief in False Stories on Social Media. Political Behavior (2019); doi: 10.1007/s11109-019-09533-0. [DOI]
- 15.Aral S., Eckles D., Protecting elections from social media manipulation. Science 365, 858–861 (2019). [DOI] [PubMed] [Google Scholar]
- 16.Roozenbeek J., van der Linden S., The fake news game: Actively inoculating against the risk of misinformation. J. Risk Res. 22, 570–580 (2019). [Google Scholar]
- 17.Wojcik Stefan And, Sizing up Twitter Users. Pew Research Center (2018); https://www.pewinternet.org/2019/04/24/sizing-up-twitter-users/.
- 18.A. Mitchell, Americans Still Prefer Watching to Reading the News–and Mostly Still Through Television. Pew Research Center (2018); https://www.journalism.org/2018/12/03/americans-still-prefer-watching-to-reading-the-news-and-mostly-still-through-television/.
- 19.D. J. Watts, D. Rothschild, Don’t blame the election on fake news. Blame it on the media. Columbia Journalism Review (2017); https://www.cjr.org/analysis/fake-news-media-election-trump.php.
- 20.Feldman L., The news about comedy: Young audiences, The Daily Show, and evolving notions of journalism. Journalism 8, 406–427 (2007). [Google Scholar]
- 21.S. Athey, M. M. Mobius, J. Pál, The Impact of Aggregators on Internet News Consumption (2017); https://papers.ssrn.com/abstract=2897960.
- 22.Edgerly S., Vraga E. K., Bode L., Thorson K., Thorson E., New media, new relationship to participation? A closer look at youth news repertoires and political participation. Journal. Mass Commun. Q. 95, 192–212 (2018). [Google Scholar]
- 23.McCombs M. E., Shaw D. L., The agenda-setting function of mass media. Public Opin. Q. 36, 176–187 (1972). [Google Scholar]
- 24.R. Puglisi, J. M. Snyder, in Handbook of Media Economics, S. P. Anderson, J. Waldfogel, D. Strömberg, Eds. (North-Holland, 2015), vol. 1, pp. 647–667. [Google Scholar]
- 25.King G., Schneer B., White A., How the news media activate public expression and influence national agendas. Science 358, 776–780 (2017). [DOI] [PubMed] [Google Scholar]
- 26.Deming W. E., Stephan F. F., On a least squares adjustment of a sampled frequency table when the expected marginal totals are known. Ann. Math. Stat. 11, 427–444 (1940). [Google Scholar]
- 27.C. Silverman, In Spite Of Its Efforts, Facebook Is Still The Home Of Hugely Viral Fake News. BuzzFeed News (2018); https://www.buzzfeednews.com/article/craigsilverman/facebook-fake-news-hits-2018.
- 28.C. Silverman, This analysis shows how viral fake election news stories outperformed real news on Facebook. BuzzFeed News. 16 (2016).
Associated Data
This section collects any data citations, data availability statements, or supplementary materials included in this article.
Supplementary Materials
Supplementary material for this article is available at http://advances.sciencemag.org/cgi/content/full/6/14/eaay3539/DC1