Abstract
The world does not have too much time to ensure that the fast-growing population has enough land, food, water and energy. The rising food demand has brought a positive surge in fertilizers’ demand and agriculture-based economy. The world is using 170 million tons of fertilizer every year for food, fuel, fiber, and feed. The nitrogenous fertilizers are being used to meet 48% of the total food demand of the world. High fertilizer inputs augment the reactive nitrogen levels in soil, air, and water. The unassimilated reactive nitrogen changes into a pollutant and harms the natural resources. The use of controlled-release fertilizers for slowing down the nutrients’ leaching has recently been practiced by farmers. However, to date, monitoring of the complete discharge time and discharge rate of controlled released fertilizers is not completely understood by the researchers. In this work, corn starch was thermally processed into a week gel-like coating material by reacting with urea and borate. The granular urea was coated with native and processed starch in a fluidized bed reactor having bottom-up fluid delivery system. The processed starch exhibited better thermal and mechanical stability as compared to the native starch. Unlike the pure starch, the storage modulus of the processed starch dominated the loss modulus. The release time of urea, coated with processed starch, remained remarkably larger than the uncoated urea.
Subject terms: Biophysics, Chemistry, Engineering, Materials science
Introduction
Nitrogen cycle and environmental pollution
The world is facing the problem of exponential population growth. The population of this planet was around 3 billion in 1960, which is expected to reach 9 billion in 20401. The world does not have too much time to ensure that there is enough land, food, water, and energy for the fast-growing population. The United Nations warns that if humans remain unsuccessful in curbing overpopulation, more than three billion people will be in poverty in coming years. The growing food crisis also presents an opportunity for researchers and investors in the farming sector, especially in fertilizer production, to invest more in this profitable business. The rising food demand has also brought a positive surge in the fertilizer demand. Due to large input of mineral fertilizers, the global production of crop and livestock has increased significantly over the past century. As revealed by the International Fertilizer Association, the world uses 170 million tons of fertilizer every year for food, fuel, fiber, and feed. Among this, the nitrogenous fertilizers are being used to meet 48% of the total food demand of the world2. Over-fertilization augments the pollutants’ level in the soil, air and water. The excessively available nitrogen during fertilization of crops also contributes to environmental pollution. The unassimilated reactive nitrogen acts as a pollutant and harms the natural resources.
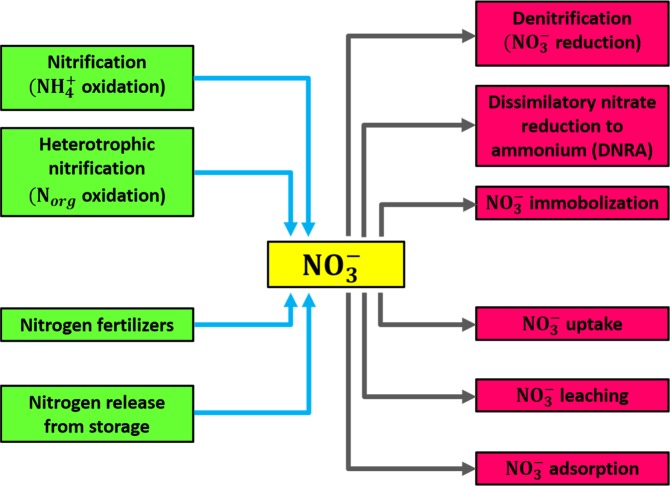
Most of the pollution in the world today is caused by human beings. The contribution of nitrogen to the environment pollution is increasing with growing human population. Sources of manmade pollution include excessive fertilization of crops, sewage, stormwater, industry, automobiles, burning of wood and fuels, etc3. The nitrogen cycle in terms of fixation, ammonification, nitrification and denitrification is explained in Fig. 1. The major part of the nitrogen primarily comes from the industrial nitrogen fixation, which directly contributes to the nitrogen in terrestrial ecosystems. This increase in nitrogen in the environment is a source of high deposition of nitrogen in agriculture-dominated landscapes1,4. Nitrogen fertilizers, nitrogen in foods and airborne nitrogen emissions are the three main sources of reactive nitrogen. The food products represent the major part of reactive nitrogen (38–75%) in the world. The airborne emissions of ammonia and nitrogen oxides, and the subsequent deposition from the atmosphere contribute about 11–36%, while nitrogen fertilizers contribute about 11–32% to the reactive nitrogen5. The surplus reactive nitrogen can cause pollution problems in the environment, such poor air quality, acidification of lakes and rivers, disruption of foresting process and degradation of coastal water quality.
Figure 1.
Nitrogen cycle in terms of major biological pathways for reduction.
A core process in nitrogen cycle is denitrification, a heterotrophic process carried out by facultative anaerobic organisms which use various C substrates as donors of electrons6,7. A better understanding of denitrification and dynamics of nitrogen transformation associated with it are crucial. Nitrate is the main nitrogen species for loss of nitrogen and is influenced by several nitrogen flows that produce and consume via nitrification and leaching, respectively. To be environmentally friendly, must be reduced to a nonreactive form (N2). The key biological pathways of reduction, as shown in Fig. 1, are (i) assimilatory reduction into biomass, (ii) dissimilatory reduction to N2 and (iii) dissimilatory reduction to 8. Dissimilatory reduction can result in denitrification under limited conditions and provide an energetically favorable alternative to denitrification9. Nevertheless, there is still a need for further work to recognize the importance of DNRA in terrestrial systems and to understand perfect methods for studying the mechanism.
Researchers are trying to investigate the different methods and mechanisms to minimize nitrogen losses, particularly due to fertilization. The performance of a fertilizer can be enhanced through many ways, including nitrification inhabitation, urease inhabitation and controlled-release fertilizer. Farmers around the world have recently explored the use of controlled-release fertilizers to slow down leaching of the nutrients. The added advantage of such fertilizers is the controlled availability of nutrients in the soil for longer time periods. The acceptable properties of a fertilizer to qualify as a controlled-release fertilizer vary from researcher to researcher. Under ambient conditions and absence of any external stress, Trenkel guidelines for slow release fertilizer are: (i) no more than 15 percent release within 24 hours, (ii) no more than 75 percent release within 28 days, and (iii) at least about 75 percent release after specified timeframe10. Ţolescu and Iovu11, revealed that a controlled-release fertilizer contains at least one nutrient, which delays its availability to plant after application, or available to plant over a substantially longer period of time than a normal quick release fertilizer. Shaviv12 criteria for a controlled-release fertilizer is that the factors affecting the release rate, release pattern and release time should be well understood and controllable during preparation of a fertilizer.
Nitrogen pollution control by coating urea
A controlled-release fertilizer is generally produced by coating the granular fertilizer and producing a physical barrier at the surface to control the water penetration into the core. The release of nitrogen from the coated core slows down and the farmer gets good fertilizer performance. One determined advantage of the coated fertilizers is availability of the nutrients to the plant for longer periods of time. The rate of nutrients’ leaching normally depends on properties of the material. The common materials, reported in the past literature, are neem, resins, sulfur, natural carbohydrate polymers and synthetic polymers13,14. The coated layer acts as a semipermeable or impermeable membrane having tiny pores. This membrane temporarily isolates the core from the surrounding environment15. The leaching of nutrients from the membrane barrier depends on the properties of the material16,17. The leaching process is not much affected by salinity, pH, texture, microbial activity and cation exchange capacity of the soil. It reveals that monitoring of nutrients’ leaching from the coating membrane is not a trivial case.
Many research efforts are underway to understand the release time, release rate and mechanism of interaction of coating with water in the soil. Sulphur coated fertilizers are costly and the coating cracks easily because of its friability18,19. Starch, lignin and cellulose have limited controlled release characteristics due hydrophilicity20–22. Other coated fertilizers use thermoplastics, ethylene-vinyl acetate or surfactants as diffusion retardent materials. Some zeolite-based controlled-release fertilizers have also been developed. Bansiwal et al.23 used surfactant-modified zeolite to coat Phosphorus fertilizers. Notario et al.24 prepared Phosphorous and Potassium slow release fertilizers from concentrated solutions of Potassium Dihydrogen Phosphate and Dipotassium Phosphate. Other coating materials include soda flax lignin25, graphene oxide films26 and gypsum plaster19. Gonzales et al.27 reported some polymeric materials for slowing down the urea hydrolysis. These polymers include ethyl cellulose, acetate cellulose and sodium alginate. Solihin et al.28 incorporated K+, NH4+ and PO4− ions in kaolin structure as nutrients for plant. Costa et al.29 coated urea with polyhydroxybutyrate and ethyl-cellulose in the presence of different emulsifiers.
Polyurethane is also a versatile polymeric material first developed in 1930s for use in aerospace and military industries30. The high toughness, chemical resistance, flexibility and abrasion resistance of polyurethane make it an attractive material for coating applications. The reported literature shows that materials containing urea or urethane groups within the backbone are gaining more significance in coating industry31. Although, synthetic polymeric coating materials have shown several merits over natural polymers32, these materials form impermeable or semi-impermeable membranes of tiny pores. The main issue in producing the polymer coated urea is the choice of right material for coating and the associated coating process33. The release of nitrogen through a membrane is mainly influenced by physical and moisture permeability properties of the coating. The soil properties did not influence much the release rate. The moisture permeability of the coating materials may be regulated by altering their composition. Therefore, the nutrient release from a polymer-coated urea can be predicted much more accurately over a given period of time than that covered with inorganic materials12,33. Most of the used polymers, however, are quite costly and non-degradable, so emphasis should be on low-cost, environmentally friendly polymers. The presented work is focused on the thermal processing of corn starch into a coating material using di-sodium tetraborate and urea.
Materials and Methods
Preparation of coating solution
Corn starch is a low cost, biodegradable and eco-friendly carbohydrate polymer. In the presented work, processed corn starch was used to produce controlled-release urea. To reduce the process cost, the starch with terminated shelf life can also be tested for the stated purpose. Since pure starches show poor mechanical strength, tacking ability and viscosity, they can not be used to produce good water retardant coatings34. The specific rheological properties, needed to improve the adhesion and coating properties, are often incorporated through chemical modification of the starches. Chemical modification of the starch produces esters and ethers35. A chemical reaction also gives anionic or cationic character to the starches. Through chemical modification, the starches receive additional properties enabling their applications in foods industry and various technical sectors.
Comprehensive alteration of physical and chemical properties of pure starches is possible through their reaction with various chemical regents. These chemical additives convert a pure starch system into a long chain biopolymer complex of improved viscosity, tacking ability, mechanical strength and surface tension. The interactions can be intra or intermolecular or both, depending on nature, length, groups, hydration capacity, degree of polymerization, salinity, pH and co-solvents. Since polymeric chains in a starch are more flexible than polymeric chains in cellulose, starches are highly soluble in many solvents25,36. In the given work, de-ionized water was used as a standard solvent. The solute was a premix of corn starch, urea and borate (Na2B4O7.10H2O). Corn starch was commercial grade product whereas the Analytical Reagent (AR) grade chemicals were supplied by R and M Chemicals. Four compositions of the coating material were formed and tested for their rheological, physical and slow release coating properties. The coating material was prepared by adopting the procedure of Naz et al.37. The details of formulation of coating material and processing temperature are presented in Table 1.
Table 1.
Composition of the coating material.
| Solution | Water (ml) | Starch (g) | Urea (g) | Borate (g) | Reaction Temp. (°C) |
|---|---|---|---|---|---|
| S0 | 1000 | 50 | 0 | 0 | 80 |
| S1 | 1000 | 50 | 15 | 0 | 80 |
| S2 | 1000 | 50 | 0 | 4.5 | 80 |
| S3 | 1000 | 50 | 15 | 4.5 | 80 |
Coating experiments
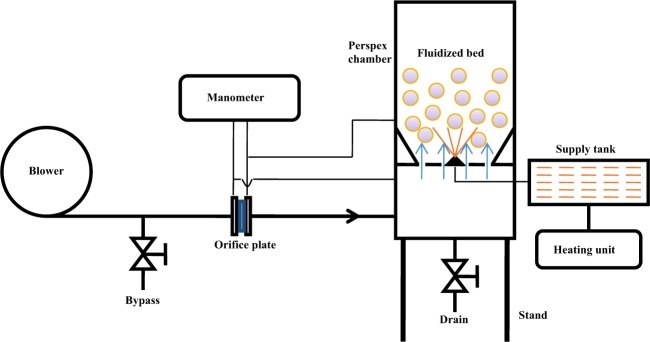
Once the physical parameters of the coating material were fully depicted, it was coated over granular urea in a conventional fluidized bed spray coater. In the coating reactor, as shown schematically in Fig. 2, the atomizer was mounted at the base of the fluidized bed column. A small distance of 80 mm was maintained between atomizer and granular urea in its fluidized state. This approach minimizes drying of the spray and increases uniformity of the coating. Since the pneumatic mass flow provided the high kinetic energy from the bottom of the bed, the wetted particles tended to fluidize to produce evenly coated urea. An air blower was used to fluidize 500 g of urea above the minimum level of fluidization. The prepared coating material was sprayed from the bottom to coat the fluidized urea particles. A full cone spray nozzle was used to spray the coating material at a temperature of 80 °C and pressure of 5 bar. The coated urea was dried at 60 °C at the end of the coating process to remove the moister.
Figure 2.
Schematic illustration of fluidized bed spray coating process.
Both the uncoated and coated urea samples were inspected for coating thickness, percentage of coating material, coating morphology, nutrient discharge rate, complete dissolution time, and coating strength. Scanning electron microscopy was used to elaborate the surface morphology and coating thickness of the coated urea. The crushing strength of the urea samples was measured with a tablet tester. The crushing strength was measured in terms of constant force (N). The force required to crack the coating is called coating sensitivity. A dissolution rate test was conducted to measure the discharge time of the uncoated and coated urea. In this test, the urea was released in distilled water under a shear rate of 200 rpm. Both coated urea and control were weighed to 10 g and placed in separate glass beakers. A total of 200 mL of deionized water was added to the sample and the urea-water mixture was stirred at room temperature by using an overhead stirrer. The time for complete release of urea in distilled water was noted.
Ethical approval
This article does not contain any studies with human participants or animals performed by any of the authors.
Results and Discussion
Rheological traits of coating solution
The processing conditions notably change the time and temperature of gelatinization of the starch suspension38. The possible changes in the viscosity of the modified and native starches over time are reported in Fig. 3. After 15 min of heating, S0 sample achieved maximum viscosity at a constant heating temperature of 80 °C. The viscosity of the native starch suspension was reduced by 34 points when the suspension was further heated after 15 min. After 25 min, the suspension viscosity remained unchanged over time. the peak viscosity of S0 was measured about 300 cP. Other samples also showed similar viscosity plots. The peak viscosity of S1, S2, and S3 samples was found relatively higher than the pure starch. The viscosity curves of these samples attained the peak values slightly later than the peak value of native starch. The lessening of viscosity of the modified starch after attaining the peak value had not been as noticeable as in case of pure starch.
Figure 3.
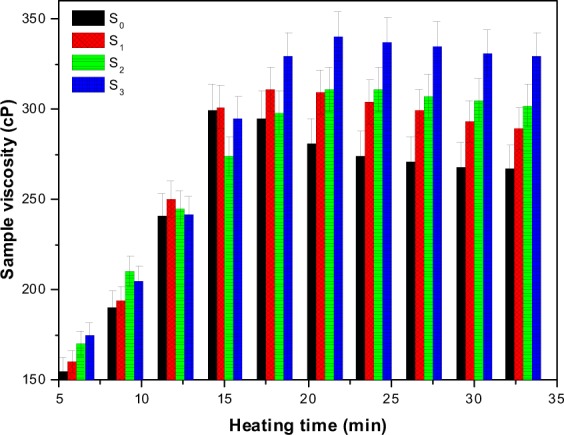
Viscosity profiles of pure and modified starch.
The alleviation of viscosity with time from the peak value might be ascribed to high process temperature and prolonged heating of the suspension. Because the temperature of decomposition of the starch granules is reported as lower than its melting point, the granules rapidly expand and crack over time. Figure 4 depicts the swelling of the starch granules in the heated suspension. Upon cracking, the suspension loses its tightness, and consequently the viscosity. The deformation and cracking of the starch particles over time is illustrated in Fig. 5. The viscosity profile reflected the possible variations in the granule’s shape during the processing of the starch. The viscosity profile exhibited a linearly increasing trend at early stages of starch processing due to swelling of the granules and amylose leaching. After 7 min of heating, the starch granules completely swelled out and the viscosity profile reached the peak point. Beyond this point, heat treatment of the suspension resulted in a viscosity breakdown due to the shear field of the instrument and consequently a decrease in viscosity39.
Figure 4.
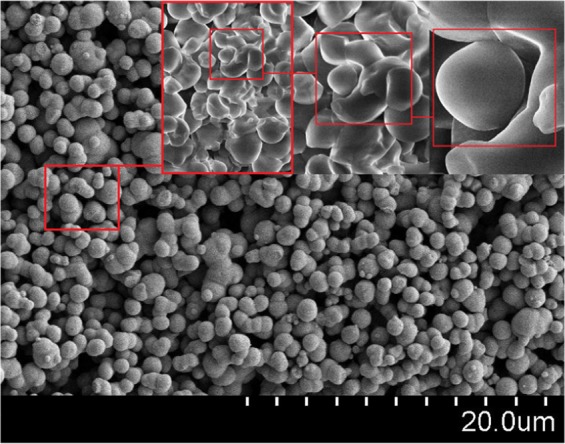
SEM illustration of deformation and swelling of corn starch.
Figure 5.
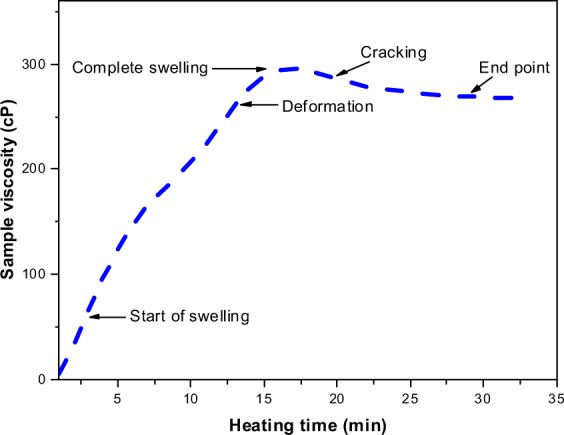
Illustration of stages of corn starch processing.
The suggested viscosity breakdown in Fig. 5 can be avoided by introducing cross-linking and plasticizing agents in the suspension40. Figure 3 suggests that the presence of borate and urea in the formulation caused a small change between the peak viscosity and the final viscosity of the chemically altered starch. These modifiers notably improve the stability of the suspension by reducing the starch cracking. In response, the suspension retains its tightness and therefore viscosity breakdown was not as detrimental as it was in pure starch. The S3 sample gained the highest viscosity among the investigated samples. The high viscosity was attributed to addition of di-sodium tetraborate in the dispersion, which dissociated into borate and sodium ions. The reactive borate ions formulated the polymer chains through hydrogen bonding with the starch whereas the charge on the developed chains was shielded by the free Na+ ions.
A comparison of the storage modulus of S0 and S3 samples is provided in Fig. 6. The time-based storage modulus plots revealed high stability of S3 over S0. The pure starch destabilizes after 300 seconds, which suggests low stability of material over time. The gel of native starch breakdowns more sharply over time. In contrast, the modified samples retained their gel structures over longer periods of time. Strain sweep also reveals that after critical strain, the samples behave like a fluid (G′ < G″). It is an indication that beyond the critical strain, the material response is more complex and is no longer a function of strain alone but G′ and G″. Figure 7 provides a comparison of frequency sweep responses of native and modified starch at 1% strain. The frequency sweep profiles provide information about the storage and loss moduli with a change in angular frequency. The storage modulus of the modified starch was reported higher than the loss modulus, which confirms the gel formation character of the modified starch and dense fluid-like character of the pure starch. It was worth noting that the magnitude of G′ and G″ for strong gel should reach up to one million. Because the magnitude of G′ and G″ of the modified starch was not as high as required for a strong gel, it was regarded as a weak gel. The unmodified starch sample was fluid in nature where the G″ component dominated the G′ at lower angular frequencies.
Figure 6.
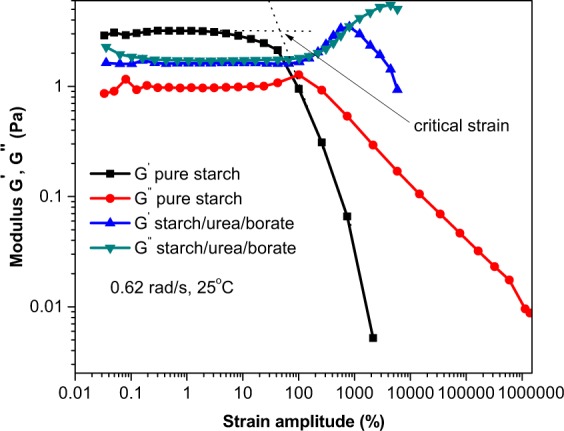
Strain sweep for determination of critical strain at room temperature.
Figure 7.
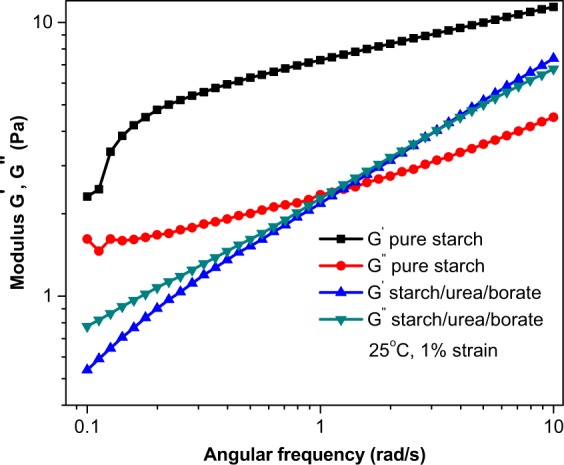
Frequency sweep: storage and loss moduli as a function of angular frequency.
Surface morphology
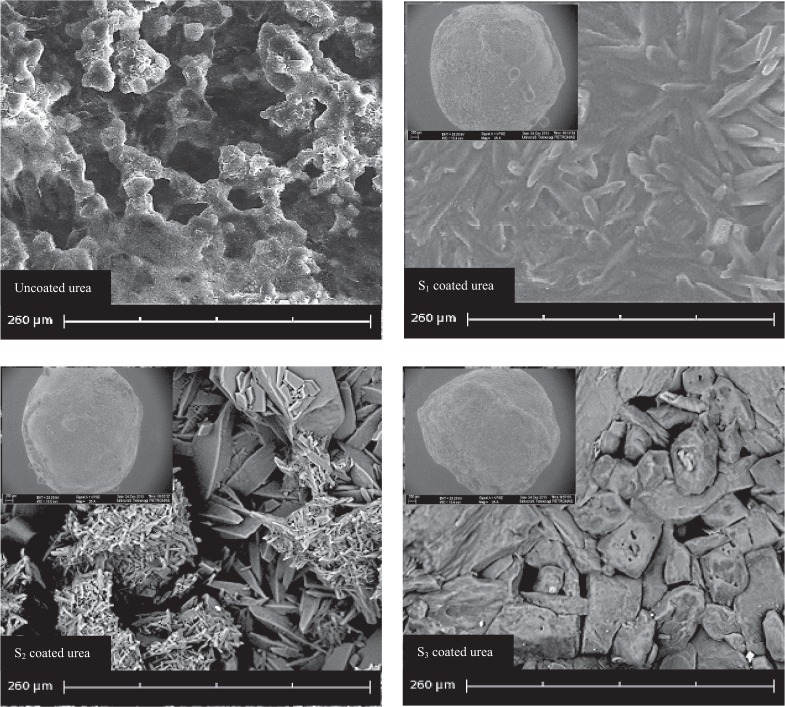
The coating content typically accounts for 3 to 15% of the weight of the finished product10. The amount of coated material influences the surface morphology and release parameter of the product. The coating content depends on the physical and chemical traits of the coating material and the process parameters. In this work, the coating morphology and surface properties of the finished product were studied from SEM micrographs. As a thick layer of coating material was formed on the surface of urea granules, 20 granules from each sample were randomly selected and scanned through SEM technique. Figure 8 shows SEM micrographs of surface of coated and uncoated urea.
Figure 8.
SEM micrographs of uncoated urea and coated with processed corn starch.
High surface roughness was seen in SEM micrograph of uncoated urea. Without coating a layer, the surface was less rigid and highly porous. Compared to uncoated urea, surface of the coated urea was highly dens and smooth. The coated surface also looked hard, uniform, compact and water resistant. SEM micrographs of the samples, coated with S0, S1, S2 and S3 materials, clearly differ in terms of surface morphology. As shown in Table 2, the mean thickness of the coating was determined by taking the difference in diameters of uncoated and coated granules. Each measurement was carried out by taking 10 coated granules of roughly same size from each sample and noting their diameters from the respective SEM micrographs. In addition, the coating thickness was also evaluated manually using a Vernier Caliper. The S0 material produced the thin coating layer, whereas S3 produced the thickest coating layer among the tested materials. The coating percentage of S3 material was higher than all other tested materials.
Table 2.
Effect of composition on coating thickness and percent coating.
| Solution | % Coating | Thickness (mm) |
|---|---|---|
| S0 | 2.84 ± 0.240 | 0.21 ± 0.010 |
| S1 | 3.67 ± 0.201 | 0.28 ± 0.012 |
| S2 | 3.73 ± 0.107 | 0.30 ± 0.015 |
| S3 | 4.32 ± 0.243 | 0.47 ± 0.017 |
Coating strength release test
Different methods are available for testing the controlled release fertilizers, including the laboratory, greenhouse, growth chamber and field methods41,42. The researchers are still designing a standardized method for commercial purposes to test the slow release fertilizers. The laboratory methods under controlled conditions are however the best and easiest way of screening the slow release fertilizers quickly11. In this work, dissolution rate testing of the coated and uncoated urea was performed in water. In a beaker, 10 g of each urea sample was taken, and 200 ml of deionized water was also added to the system. At room temperature, an overhead stirring at a constant speed of 200 rpm agitated the water-urea mixture. The time of complete dissolution of each sample was noted, as shown in Fig. 9. Compared with coated ones, nitrogen began to discharge immediately from the uncoated urea. The maximum time of complete dissolution of uncoated urea was 65 seconds. The release time was considerably increased with coating thickness in the presence of chemical additives. A 0.54 mm thick coating gives optimum release time. The overall discharge duration of urea coated with S3 material was relatively greater than those coated with other rest of the materials. Shi et al.43 coated the urea with a mixture of plastic and starch and revealed prolonged nitrogen release time as compared to the pure starch coating.
Figure 9.
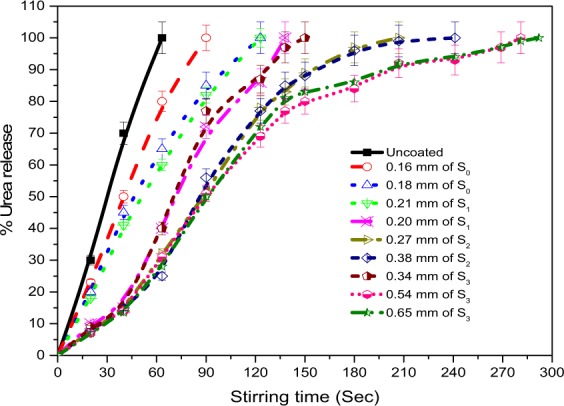
Release time of coated and uncoated urea.
In addition to the above stated parameters, the coated product should also show adequate mechanical resistance to normal handling and storage for avoiding the surface fractures44. The mechanical resistance was measured by firmly pressing on the individual coated granules and observing the surface cracks. The mechanical strength greatly depended on the coating composition and thickness. The uncoated urea granules and those coated with S1 and S2 exhibited very low mechanical strength as compared S3 coated urea. In addition, the surface strength was considerably improved with an increase in the coating thickness to a certain point (0.54 mm), after which the coating thickness was not significantly influenced. The overall mechanical strength of coated urea varied from 22 N to 20 N. The uncoated urea exhibited the coating strength of 20 N.
Conclusions
High urea inputs raise the level of reactive nitrogen in the soil, air, and water. Unused reactive nitrogen acts as a pollutant and harms the natural resources. The use of controlled-release fertilizers for slowing down the nutrients’ leaching has recently been practiced by farmers worldwide. The added advantage of such fertilizers is the availability of controlled amount of nutrients in the soil for longer periods of time. However, to date, monitoring of the complete discharge time and discharge rate of controlled released fertilizers is not completely understood by the researchers. The starches, modified with urea and borate, showed good stability and mechanical strength over time. A decrease in the storage modulus of the native starch showed unstable gel structure, which may break after some time. The viscous component dominated the elastic component at lower angular frequencies for the native starch. A small difference between the peak and end point viscosities of the modified starch suggested that the presence of urea and borate in the starch suspension considerably reduced the starch cracking. The S3 coated urea gained the highest viscosity among the investigated samples. SEM analyses showed a less dense surface morphology of the uncoated urea with a high degree of roughness. The porosity of the uncoated granules was also quite high compared to the coated granules. The surface of the coated granules was uniform, dense, and hard with low porosity. Fast release of the uncoated urea was predicted compared to the coated samples. The uncoated urea was completely released into water after 6 min. Conversely, the slowest release was predicted from the urea coated with the S3 material. The coated granules exhibited the highest crushing strength of 30 N, which was noticeably higher than the crushing strength of the uncoated urea (20 N).
Acknowledgements
This work was sponsored by King Saud University, Riyadh, Saudi Arabia under the Research Group Project No. RG-1440-095.
Author contributions
M.Y. Naz and S.A. Sulaiman designed the experimental plan and prepared the modified starch adhesives. A. Ghaffar and S. Shukrullah measured the rheological properties of the prepared samples. M.Y. Naz and K.A. Ibrahim performed the data analysis and drafted this paper. K.A. Ibrahim and N.M. AbdEl-Salam secured the research grant for this project and will be paying the publication fee from the grant approved on his name. They also helped preparing the figures. All authors reviewed and approved the manuscript before submitting it to this journal.
Competing interests
The authors declare no competing interests.
Footnotes
Publisher’s note Springer Nature remains neutral with regard to jurisdictional claims in published maps and institutional affiliations.
References
- 1.Galloway JN, et al. Transformation of the nitrogen cycle: recent trends, questions, and potential solutions. Science. 2008;320:889–893. doi: 10.1126/science.1136674. [DOI] [PubMed] [Google Scholar]
- 2.Glibert P, Harrison J, Heil C, Seitzinger S. Escalating worldwide use of urea-a global change contributing to coastal eutrophication. Biogeochemistry. 2006;77:441–463. doi: 10.1007/s10533-005-3070-5. [DOI] [Google Scholar]
- 3.Naz MY, Sulaiman SA. Slow release coating remedy for nitrogen loss from conventional urea: A review. Journal of Controlled Release. 2016;225:109–120. doi: 10.1016/j.jconrel.2016.01.037. [DOI] [PubMed] [Google Scholar]
- 4.Ibrahim KA, et al. Controlling Nitrogen Pollution via Encapsulation of Urea Fertilizer in Cross-linked Corn Starch. BioResources. 2019;14:7775. [Google Scholar]
- 5.Boyer EW, Goodale CL, Jaworski NA, Howarth RW. Anthropogenic nitrogen sources and relationships to riverine nitrogen export in the Northeastern USA. Biogeochemistry. 2002;57/58:137–169. doi: 10.1023/A:1015709302073. [DOI] [Google Scholar]
- 6.Jeppesen, E. et al. In Advances in Ecological Research Vol. Volume 47 (eds Ute Jacob Guy Woodward & J. O’Gorman Eoin) 411–488 (Academic Press, 2012).
- 7.Muller, C. & Clough, T. J. Advances in understanding nitrogen flows and transformations: gaps and research pathways. Journal of Agricultural Science152, S34–S44 (2014).
- 8.Burger M, Jackson LE. Plant and microbial use and turnover: rapid conversion of nitrate to ammonium in soil with roots. Plant and Soil. 2005;266:289–301. doi: 10.1007/s11104-005-1362-0. [DOI] [Google Scholar]
- 9.Rütting T, Boeckx P, Müller C, Klemedtsson L. Assessment of the importance of dissimilatory nitrate reduction to ammonium for the terrestrial nitrogen cycle. Biogeosciences. 2011;8:1779–1791. doi: 10.5194/bg-8-1779-2011. [DOI] [Google Scholar]
- 10.Trenkel, M. E. Improving Fertilizer Use Efficiency. Controlled-Release and Stabilized Fertilizers in Agriculture. The International Fertilizer Industry Association, Paris (1997).
- 11.Ţolescu, C. & Iovu, H. Polymer Conditioned Fertilizers. UPB Scientific Bulletin, Series B 72 (2010).
- 12.Shaviv, A. Controlled Release Fertilizers. IFA International Workshop on Enhanced-Efficiency Fertilizers, Frankfurt. International Fertilizer Industry Association Paris, France (2005).
- 13.Jin S, et al. Preparation and properties of a degradable interpenetrating polymer networks based on starch with water retention, amelioration of soil, and slow release of nitrogen and phosphorus fertilizer. Journal of Applied Polymer Science. 2012;128:407–415. doi: 10.1002/app.38162. [DOI] [Google Scholar]
- 14.Saleh DS, Hemati M. Experimental study and modeling of fluidized bed coating and agglomeration. Powder technology. 2003;130:116–123. doi: 10.1016/S0032-5910(02)00254-1. [DOI] [Google Scholar]
- 15.Butzen, S. Common nitrogen fertilizers and stabilizers for corn production. Crop Insights23 (2013).
- 16.Hergert, G. R., Ferguson, C. & Wortmann, C. Enhanced efficiency fertilizers: will they enhance my fertilizer efficiency? Proceedings of the 3rd Annual Crop Production Clinics, University of Nebraska-Lincoln Entension (2011).
- 17.Xiao X, et al. One-step method to prepare starch-based superabsorbent polymer for slow release of fertilizer. Chemical Engineering Journal. 2017;309:607–616. doi: 10.1016/j.cej.2016.10.101. [DOI] [Google Scholar]
- 18.Naz MY, Sulaiman SA. Testing of starch-based carbohydrate polymer coatings for enhanced urea performance. Journal of Coatings Technology and Research. 2014;11:747–756. doi: 10.1007/s11998-014-9590-y. [DOI] [Google Scholar]
- 19.Ibrahim KRM, Babadi FE, Yunus R. Comparative performance of different urea coating materials for slow release. Particuology. 2014;17:165–172. doi: 10.1016/j.partic.2014.03.009. [DOI] [Google Scholar]
- 20.Azeem B, KuShaari K, Man ZB, Basit A, Thanh TH. Review on materials & methods to produce controlled release coated urea fertilizer. Journal of Controlled Release. 2014;181:11–21. doi: 10.1016/j.jconrel.2014.02.020. [DOI] [PubMed] [Google Scholar]
- 21.Bao X, et al. Rheokinetics of graft copolymerization of acrylamide in concentrated starch and rheological behaviors and microstructures of reaction products. Carbohydrate Polymers. 2018;192:1–9. doi: 10.1016/j.carbpol.2018.03.040. [DOI] [PubMed] [Google Scholar]
- 22.Qiao D, et al. Preparation and characterization of slow-release fertilizer encapsulated by starch-based superabsorbent polymer. Carbohydrate Polymers. 2016;147:146–154. doi: 10.1016/j.carbpol.2016.04.010. [DOI] [PubMed] [Google Scholar]
- 23.Bansiwal AK, Rayalu SS, Labhasetwar NK, Juwarkar AA, Devotta S. Surfactant-Modified Zeolite as a Slow Release Fertilizer for Phosphorus. Agricultural and Food Chemistry. 2006;54:4773–4779. doi: 10.1021/jf060034b. [DOI] [PubMed] [Google Scholar]
- 24.Notario JJS, Arteaga IJ, Martin MMG, Herndndez JEG. Phosphorus and potassium release from phillipsite-based slow-release fertilizers. Journal of Controlled Release. 1995;34:25–29. doi: 10.1016/0168-3659(94)00116-C. [DOI] [Google Scholar]
- 25.Mulder WJ, Gosselink RJA, Vingerhoeds MH, Harmsen PFH, Eastham D. Publications Lignin based controlled release coatings. Industrial Crops and Products. 2011;34:915–920. doi: 10.1016/j.indcrop.2011.02.011. [DOI] [Google Scholar]
- 26.Zhang Z, Jiang P-X, Ouyang X-L, Chen J-N, Christopher DM. Experimental investigation of spray cooling on smooth and micro-structured surfaces. International Journal of Heat and Mass Transfer. 2014;76:366–375. doi: 10.1016/j.ijheatmasstransfer.2014.04.010. [DOI] [Google Scholar]
- 27.Morales-Sanfrutos J, Lopez-Jaramillo F, Elremaily M, Hernández-Mateo F, Santoyo-Gonzalez F. Divinyl Sulfone Cross-Linked Cyclodextrin-Based Polymeric Materials: Synthesis and Applications as Sorbents and Encapsulating Agents. Molecules. 2015;20:3565. doi: 10.3390/molecules20033565. [DOI] [PMC free article] [PubMed] [Google Scholar]
- 28.Solihin Zhang Q, Tongamp W, Saito F. Mechanochemical synthesis of kaolin-KH2PO4 and kaolin-NH4H2PO4 complexes for application as slow release fertilizer. Powder Technology. 2011;212:354–358. doi: 10.1016/j.powtec.2011.06.012. [DOI] [Google Scholar]
- 29.Costa MME, Cabral-Albuquerque ECM, Alves TLM, Pinto JC, Fialho RL. Use of Polyhydroxybutyrate and Ethyl Cellulose for Coating of Urea Granules. Journal of Agricultural and Food Chemistry. 2013;61:9984–9991. doi: 10.1021/jf401185y. [DOI] [PubMed] [Google Scholar]
- 30.Schellekens Y, et al. Tin-free catalysts for the production of aliphatic thermoplastic polyurethanes. Green Chemistry. 2014;16:4401–4407. doi: 10.1039/C4GC00873A. [DOI] [Google Scholar]
- 31.Chattopadhyay DK, Raju KVSN. Structural engineering of polyurethane coatings for high performance applications. Progress in Polymer Science. 2007;32:352–418. doi: 10.1016/j.progpolymsci.2006.05.003. [DOI] [Google Scholar]
- 32.Chiellini, E. & Solaro, R. Biodegradable polymeric materials. Advanced Materials4 (1996).
- 33.Fujita, T. & Shoji, S. Kinds and properties of Meister fertilizers. In: Meister controlled release fertilizer - Properties and Utilization. Shoji, S. (ed). Konno Printing Company Ltd. Sendai, Japan, 13–34 (1999).
- 34.Singh AV, Nath LK. Synthesis and evaluation of physicochemical properties of cross-linked sago starch. International Journal of Biological Macromolecules. 2012;50:14–18. doi: 10.1016/j.ijbiomac.2011.09.003. [DOI] [PubMed] [Google Scholar]
- 35.Koo S, Lee K, Lee H. Effect of cross-linking on the physicochemical and physiological properties of corn starch. Food Hydrocolloids. 2010;24:619–625. doi: 10.1016/j.foodhyd.2010.02.009. [DOI] [Google Scholar]
- 36.Pratap, K. G., Chowdary, K. P. R. & Yasoda, K. K. Evaluation of Starch Acetate as Microencapsulating Agent for Controlled Release of Carbamazepine in Comparison to Other Known Polymers. International Journal of Pharma Sciences2, 67-69 (2012).
- 37.Naz MY, Sulaiman SA, Ariwahjoedi B. Effect of the borax mass and pre-spray medium temperature on droplet size and velocity vector distributions of intermittently sprayed starchy solutions. Physical Chemistry Chemical Physics. 2015;17:3704–3714. doi: 10.1039/C4CP04378B. [DOI] [PubMed] [Google Scholar]
- 38.Yin W, et al. Steady rheological behaviors of UV-curable waterborne hyperbranched polyurethane acrylate dispersions. J Coat Technol Res. 2013;10:57–64. doi: 10.1007/s11998-012-9432-8. [DOI] [Google Scholar]
- 39.Bao X, et al. How rheological behaviors of concentrated starch affect graft copolymerization of acrylamide and resultant hydrogel. Carbohydrate polymers. 2019;219:395–404. doi: 10.1016/j.carbpol.2019.05.034. [DOI] [PubMed] [Google Scholar]
- 40.Ariyanti S, Man Z, Azmi BM. Improvement of Hydrophobicity of Urea Modified Tapioca Starch Film with Lignin for Slow Release Fertilizer. Advanced Materials Research. 2013;626:350–354. doi: 10.4028/www.scientific.net/AMR.626.350. [DOI] [Google Scholar]
- 41.Simonne EH, Hutchinson CM. Controlled-release fertilizers for vegetable production in the era of best management practices: Teaching new tricks to an old dog. HortTechnology. 2005;15:36–46. doi: 10.21273/HORTTECH.15.1.0036. [DOI] [Google Scholar]
- 42.Engelsjord M, Fostad O, Singh B. Effects of temperature on nutrient release from slow-release fertilizers. Nutrient Cycling Agroecosystems. 1996;46:179–118. doi: 10.1007/BF00420552. [DOI] [Google Scholar]
- 43.Shi R, et al. The effect of citric acid on the structural properties and cytotoxicity of the polyvinyl alcohol/starch films when molding at high temperature. Carbohydrate Polymers. 2008;74:763–770. doi: 10.1016/j.carbpol.2008.04.045. [DOI] [Google Scholar]
- 44.Mikhailova A, Tamboura M, Jia M. Synthesis, characterization, and analyses of mechanical, adhesion, and thermal properties of polysiloxane resin modified with segmented polyurethane. Journal of Coatings Technology and Research. 2013;10:97–108. doi: 10.1007/s11998-012-9424-8. [DOI] [Google Scholar]


