

Abstract
Perylenequinones (PQ), a class of naturally occurring polypeptides, are widely used as a clinical drug for treating skin diseases and as a photodynamic therapy against cancers and viruses. In this study, the effects of different carbon sources on PQ biosynthesis by Shiraia sp. Slf14 were compared, and the underlying molecular mechanism of fructose as the sole carbon to enhance PQ production was investigated by transcriptome analysis. The results indicated that fructose enhanced PQ yield to 1753.64 mg/L, which was 1.73-fold higher than that obtained with glucose. Comparative transcriptome analysis demonstrated that most of the upregulated genes were related to transport systems, energy and central carbon metabolism in Shiraia sp. Slf14 cultured in fructose. The genes involved in glycolysis and pentose phosphate pathways, and encoding citrate synthase, ATP-citrate lyase, and acetyl-CoA carboxylase were substantially upregulated, resulting in increased overall acetyl-CoA and malonyl-CoA production. However, genes involved in gluconeogenesis, glyoxylate cycle pathway, and fatty acid synthesis were significantly downregulated, resulting in higher acetyl-CoA influx for PQ formation. In particular, the putative PQ biosynthetic cluster was upregulated in Shiraia sp. Slf14 cultured in fructose, leading to a significant increase in PQ production. The results of real-time qRT-PCR and related enzyme activities were also consistent with those of transcriptome analysis. These findings provide a remarkable insight into the underlying mechanism of PQ biosynthesis and pave the way for improvements in PQ production by Shiraia sp. Slf14.
Electronic supplementary material
The online version of this article (10.1007/s13205-020-02181-w) contains supplementary material, which is available to authorized users.
Keywords: Shiraia sp. Slf14, Transcriptome analysis, Fructose, Perylenequinones, Metabolic regulation
Introduction
Perylenequinones (PQ) are a class of natural compounds, including cercosporin, phleichrome, cladochrome, elsinochrome, hypocrellin, etc., characterized by 3,10-perylenedione, 4, 9-dihydroxy as the distinct core architecture (Mulrooey et al. 2012), and have been used in Chinese herbal medicine for centuries to treat various diseases, including gastric ailments and rheumatoid arthritis (Diwu and Lown 1990). Hypocrellins are important PQ and are classified into four types, hypocrellin A (HA), B, C, and D, among which HA has been noted to exhibit higher potency (Yan et al. 2014). In China, HA has been used in traditional Chinese medicine for centuries to treat rheumatic pain, stomachache, vitiligo, psoriasis, and white lesions of the vulva (Kishi et al. 1991). Besides, as a new type of non-porphyrin photosensitizer, HA has also been considered as a potential photodynamic therapy drug owing to its excellent photodynamic properties and very low dark toxicity. Currently, the striking anticancer, antibacterial, and antiviral activities of HA have gained considerable attention. In addition to its use in the pharmaceutical industry, HA also has extensive potential applications in agricultural, cosmetic, food, and feed industries (Shen et al. 2012; Su et al. 2011).
Hypocrellins were initially extracted from the stromata of parasitic fungus Shiraia bambusicola and Hypocrella bambusae (Kishi et al. 1991; Liang et al. 2009). Currently, hypocrellins are produced from the stromata of S. bambusicola (Wu et al. 1989); however, the natural resources from the fruiting body of this fungus are becoming increasingly limited. To protect the dwindling resources and improve the production of HA in Shiraia sp., mycelial culture of Shiraia sp. is becoming a promising alternative method. So far, HA production in submerged cultures of most of the Shiraia sp. isolates has been relatively low (10–40 mg/L) (Lei et al. 2017). To improve the yield of hypocrellins, various strategies, including strain improvement by UV (Pan et al. 2012) or gamma-ray mutagenesis (Liu et al. 2016), optimization of culture conditions and medium (Yang et al. 2009), induction of biotic and abiotic elicitors (Du et al. 2013, 2015), and overexpression of the cluster-specific transcription factor SbTF1 (Li et al. 2019), have been developed in the past two decades. Furthermore, the hypocrellins yields of Shiraia sp. had been effectively improved by adding Triton X-100 (Cai et al. 2011), H2O2 (Deng et al. 2016a), or Cr3+ (Xiang et al. 2011), or by treating with low-intensity ultrasound (Sun et al. 2017) as elicitor. In our previous study, by adding Ca2+, the total PQ content of Shiraia sp. Slf14 was increased to 1894.66 mg/L, which represents a 5.8-fold improvement over that achieved in the controls (Liu et al. 2018). Nevertheless, the low yields of hypocrellins in submerged cultures of Shiraia sp. is still a major barrier to their biotechnological production, and further improvements in HA production are urgently needed.
The composition of fermentation medium, especially the carbon source that is mainly used as energy source for cell growth and metabolism, plays an important role in the titer and productivity of secondary metabolites (Li et al. 2015; Kayali et al. 2011; Silva et al. 2019). In a previous study, glucose was confirmed as a suitable carbon source for hypocrellins production using Shiraia sp. (Yang et al. 2009; Hu et al. 2010; Xiang et al. 2012). Shiraia sp. Slf14 is a novel endophytic fungus producing high yield of PQ, including hypocrellins (HA and HB) and elsinochrome (EA, EB, and EC), and was isolated from Huperzia serrata (Thunb. ex Murray) Trev., in our previous studies, and could be used as an alternative robust strain for hypocrellins production (Liu et al. 2018; Yang et al. 2014; Zhu et al. 2010). During optimization of the culture medium of Shiraia sp. Slf14, fructose was noted to be more beneficial for PQ biosynthesis, and when compared with cells grown in glucose, those cultivated in fructose exhibited 1.73-fold improvement in PQ yield. Although there are a few studies on the influence of carbon sources on the production of hypocrellins by Shiraia spp., the underlying mechanism of carbon sources regulating hypocrellins biosynthesis is poorly understood.
Transcriptomics is a powerful tool that can facilitate our understanding of the genome response to environmental disturbances and changes in gene expression, regulation, and networks (Liang et al. 2012; Gangwar et al. 2018). RNA sequencing (RNA-seq) technology, as a robust technique for transcriptome analysis, can effectively help to better understand a wide dynamic range of gene expression levels under different conditions. In the present study, RNA-seq technology was applied to comprehensively elucidate the complex transcriptional profile of Shiraia sp. Slf14 during PQ production with fructose or glucose as the sole carbon source, respectively. The results obtained could substantially assist in understanding the underlying mechanism by which carbon sources regulate PQ biosynthesis, and pave way for improvements in PQ production.
Materials and methods
Strains and culture conditions
The endophytic fungal strain Shiraia sp. Slf14 had been isolated from the leaves of H. serrata in our previous work and deposited in China Center for Type Culture Collection (CCTCC No. M209294) (Zhu et al. 2010). The stock culture of Shiraia sp. Slf14 was maintained on potato dextrose agar (PDA) slants at 4 °C and initially incubated on a PDA plate at 28 °C for 7 days. The actively growing mycelia were inoculated into a 500-mL flask containing 140 mL of potato dextrose broth (PDB) and incubated in light at 28 °C for 3 days with constant shaking at 150 rpm. Then, 8 mL of the seed broth was transferred into the fermentation medium containing 200 g/L potato extract, 0.7 g/L yeast extract, 20 g/L different carbon sources (sucrose, fructose, maltose, soluble starch, glucose, or lactose) and incubated at 28 °C for 14 days according to the experimental design. The different concentrations of fructose (10, 20, 30, 40, 50, 60, 70, and 80 g/L) in the fermentation medium were optimized. In the subsequent experiment, the fermentation medium containing 200 g/L potato extract, 5 g/L yeast extract, and 60 g/L glucose or fructose was employed. All the reagents (analytical pure) were bought from Solarbio (Beijing, China) or Aladdin (Shanghai, China). All the experiments were performed in triplicate.
Sampling, analyses of cell growth, and residual sugar
Three parallel samples were collected each time, and the data were averaged from the triplicate samples. Biomass accumulation was measured by dry cell weight analysis. The mycelia were collected from three different culture flasks, washed with distilled water, and dried at 45 °C to constant weight. Residual sugar was determined by the phenol–sulfuric acid method (Liu et al. 2018; Xu and Zhong 2012). In brief, 1 mL 5% phenolic solution and 5 mL sulfuric acid in 1 mL diluted fermentation broth were added, shaken well, and then left at 25 °C for 25 min. The absorbance was recorded with a UV-1800 (PC) UV–vis spectrophotometer (Mapada; China) at 488 nm.
Extraction and analysis of total and individual PQ
The total and individual PQs were measured with spectrophotometry and high-performance liquid chromatography (HPLC) according to Tong et al. (2017). The dried mycelia (1 g) were extracted by the Soxhlet method with 100 mL of acetone for 24 h at 70 °C, and the refluxed liquid was dried by rotary evaporation at 45 °C and dissolved in 10 mL of acetonitrile. The individual PQs were analyzed by Waters 2996 system (Milford, MA, USA) equipped with YMC-Triart C18 column (250 mm × 4.6 mm, 5 µm, Tokyo, Japan) using 70% acetonitrile and 30% water as the mobile phase at a flow rate of 1.0 mL/min and monitored at 460 nm. Quantification of individual PQs in mycelia was based on purified EA, EB, EC, HA, and HB, which were applied as standards to establish a detection calibration curve.
RNA isolation and sequencing
Three parallel hyphal samples collected from the medium with 60 g/L fructose or glucose at mid-growth phase (day 4) were mixed, filtered, immediately frozen in liquid nitrogen, and stored at − 80 °C until RNA extraction. The total RNA of the mycelia was isolated using TRIzol reagent (Invitrogen, Carlsbad, CA, USA) according to the manufacturer’s instructions. The 3′-end with polyA tail structure mRNA from the total RNA was isolated using magnetic beads (Invitrogen) with oligo (dT). The cDNA library was constructed from the extracted mRNA with PCR using TruseqTM RNA sample prep kit (Illumina, San Diego, CA, USA). Sequencing was conducted and analyzed using Illumina HiSeq 4000 platform (Majorbio, Shanghai, China). Raw fastq file reads were filtered, trimmed, and sequencing adapters and low-quality bases were removed using SeqPrep (https://github.com/jstjohn/SeqPrep) and Sickle (https://github.com/najoshi/sjckle). The remaining reads were classified as clean reads.
De novo assembly and gene expression analysis
All the clean reads were assembled to generate long contigs using Trinity software (https://github.com/trinityrnaseq/trinityrnaseq/wiki). The generated contigs were joined together to form a sequence called unigenes that cannot be extended at both the ends. The direction of the unigenes was determined by comparing the unigene sequence with the NR protein (Non-redundant protein, https://www.ncbi.nlm.nih.gov), Swiss-Protein (https://www.expasy.ch/sprot), KEGG (Kyoto Encyclopedia of Genes and Genomes, https://www.genome.jp/kegg), and GO (Gene Ontology Consortium, https://geneontology.org) databases.
The gene expression level was normalized to the number of reads per kilobase of exon region per million mapped reads (RPKM). The P value was used to identify genes that were differentially expressed. The false discovery rate was applied to identify the threshold of the P value in multiple tests and analyses. The differentially expressed genes (DEGs) between two samples were screened based on a threshold of false discovery rate ≤ 0.001 and ∣fold change∣ ≥ 1.5 (Lei et al. 2017).
Gene function annotation and KEGG pathway analysis
By using BLASTp, all the unigenes were aligned to the NCBI NR protein, GO, KOG (Clusters of orthologous groups for eukaryotic complete genomes), and KEGG databases, with a cutoff value of e < 10−5 for establishing the highest sequence similarities to the given unigenes. The GO functional annotation (molecular function, biological process, and cellular component) for the unigenes was obtained using blast2go program (https://www.blast2go.com/b2ghome). Subsequently, WEGO software (https://wego.genomics.org.cn/) was applied to run the GO functional classifications for all the unigenes as well as to understand the distribution of gene functions under the fermentation conditions with fructose or glucose as the sole carbon source at the macro level. KEGG is a classification method based on pathways, which could be used to profile the functions of genes. After gene function annotation, the unique sequences were assigned an Enzyme Commission number, and the DEGs were also mapped to pathway for enrichment analysis.
Measurement of gene expression by real-time qRT-PCR
To verify the expression pattern of the selected genes that exhibited upregulation and downregulation under the fermentation conditions examined, SYBR Green real-time PCR (Applied Biosystems, Carlsbad, CA, USA) was performed. A total of 14 genes involved in carbon metabolism, fatty acid, and PQ biosynthesis were selected. The specific gene primers (Table S1) used in this study were designed according to the cDNAs with Primer software. Melting curve analysis was performed at the end of the PCR to confirm product quality. All the data were normalized with respect to the reference gene, GAPDH amplicon (Deng et al. 2016b). The efficiency corrected ΔΔCt method and differences in the cycle number during linear amplification phase between the samples were used to determine relative gene expression (Livak and Schmittgen 2001). The effectiveness of qRT-PCR was estimated for each primer pair using a method based on linear regression slope of a dilution series. The gene expression in the presence of glucose was expressed relative to that estimated in the presence of fructose.
Measurement of enzymes activities
The samples were collected from the fermentation medium with fructose or glucose as the sole carbon source at mid-growth phase (day 4). Then, all the samples were filtered, washed twice with ultrapure water, and suspended in Na2HPO4/KH2PO4 buffer (pH 7.5) at a ratio of 1:3 (w/v). Subsequently, the cells were ruptured by sonication at 60 W and 4 °C for 15 min (3-s sonication with 5-s interval). The homogenate was centrifuged at 15,000×g for 15 min at 4 °C, and the supernatant was immediately used for determining enzymes activities as well as for detecting the concentration of protein by Bradford’s method with serum albumin as the standard (Bellou et al. 2016).
For isocitrate dehydrogenase (ICDH) activity determination, the sample was incubated in a solution containing Tris–HCl (20 mM, pH 8.0), MgCl2 (2 mM), isocitrate (5 mM), crude enzyme (50 μL/mL), and NADP+ (0.5 mM) at 25 °C, and the rate of NADPH formation was recorded at 340 nm every 30 s over 3 min (Kornberg 1955). For malic enzyme (ME) determination, the sample was incubated in a mixture consisting of Tris–HCl (0.1 mM, pH 8.0), MgCl2 (5 mM), malate acid (10 mM), NADP+ (0.5 mM), and water at 25 °C for 10 min, and the rate of NADPH formation was recorded at 340 nm (Geer et al. 1980). The ATP-citrate lyase (ACL) activity was measured based on NADH oxidation, according to Srere (1959). The sample was incubated in a mixture containing Tris–HCl (0.1 M, pH 7.4), MgCl2 (0.1 M), sodium citrate (0.2 M), coenzyme A (12.7 M), 2-mercaptoethanol (0.1 M), NADH (3.5 mM), and malate dehydrogenase (600 units) at 25 °C. The oxidation rate of NADH was read at 340 nm every 15 s over 35 min. Fatty acid synthase (FAS) activity was assayed at 340 nm by measuring the oxidation rate of NADPH at 25 °C in a mixture consisting of Na2HPO4/KH2PO4 (0.1 M, pH 6.5), NADPH (0.14 M), DTT (4 mM), BSA (0.3 mg/mL), EDTA (2.5 mM), acetyl-CoA (0.18 mM), and malonyl-CoA (0.09 mM). The controls comprised equal volume of Na2HPO4/KH2PO4 buffer instead of the crude enzyme (Stoops et al. 1978). One unit of specific enzyme activity was defined as the amount of enzyme needed to produce/oxidize 1 µmol of NADH/NADPH per minute per milligram of protein under the aforementioned conditions (Bellou et al. 2016).
Availability of data and materials
The sequenced reads have been deposited in NCBI’s Sequence Read Archive under accession number SRP115742, BioProject under accession number PRJNA399021, and BioSample under Accession No. SAMN07521971.
Statistical analysis
All the data obtained in this study were the average of triplicate independent samples and the standard deviations were expressed by error bars. The statistical significance was evaluated with one-way ANOVA, followed by Student’s t test, with P < 0.05.
Results and discussion
Effect of different carbon sources on growth and PQ production of Shiraia sp. Slf14
To improve the yield of HA, various strategies have been developed in the past two decades (Du et al. 2015; Liu et al. 2018).The carbon sources play a crucial role in the titer and productivity of secondary metabolites. The composition of fermentation medium, especially the carbon source mainly used as energy source for cellular growth and metabolism, plays an important role in the titer and productivity of secondary metabolites (Kayali et al. 2011; Li et al. 2015). In the present study, cultivation of Shiraia sp. Slf14 in fermentation medium containing 20 g/L sucrose, fructose, maltose, soluble starch, glucose, or lactose, respectively, revealed distinct differences in both biomass and PQ production. Among the carbon sources examined, soluble starch yielded maximum mycelial growth (16.36 g/L), whereas fructose yielded maximum PQ production (544.77 mg/L), followed by sucrose (490.28 mg/L), maltose (345.246 mg/L), and glucose (305.066 mg/L) (Fig. 1a). Previous studies have demonstrated that glucose is a suitable carbon source for hypocrellins production in submerged cultivation of Shiraia sp. (Hu et al. 2010; Xiang et al. 2012), rather than fructose. Further experiments on the effects of various concentrations of fructose, ranging from 10 to 80 g/L, showed that the biomass and PQ yield of Shiraia sp. Slf14 increased with the increasing concentration of fructose from 10 to 60 g/L (Fig. 1b). The highest biomass and PQ yield were obtained with an initial fructose concentration of 60 g/L. However, cell growth and PQ biosynthesis were inhibited when the concentration of fructose was more than 70 g/L. Besides, the highest biomass and PQ yield were also achieved with an initial glucose concentration of 60 g/L (data not shown). Overall, these results indicated that fructose is a suitable carbon source for PQ production by Shiraia sp. Slf14, and the optimal concentration of fructose in the fermentation medium is 60 g/L.
Fig. 1.

Effects of different carbon sources (a) and initial fructose concentrations (b) on the mycelial growth and perylenequinones (PQ) production of Shiraia sp. Slf14. DCW, dry cell weight
Subsequently, the time courses of cell growth, sugar consumption, and PQ production of Shiraia sp. Slf14 cells cultured in 60 g/L fructose or glucose were measured and compared. The contents of total PQ and individual PQs (including EA, EB, EC, and HA) increased over time with fructose or glucose as substrate, respectively, whereas that of HB was too low for detection with HPLC (Fig. 2a–e). Furthermore, the level of PQ reached the maximum on day 12 in the presence of fructose and glucose, respectively. In the presence of fructose, the total PQ yield of Shiraia sp. Slf14 reached 1753.64 mg/L on day 12, which represented 1.73-fold improvement over that achieved with glucose (1011.42 mg/L) (Fig. 2c). With regard to sugar consumption, utilization of fructose by the cells was slightly faster than that of glucose in the earlier fermentation stage, but the surplus of glucose and fructose was almost the same in the later fermentation stage (Fig. 2b). Furthermore, the increase in biomass of Shiraia sp. Slf14 cultured in medium containing fructose was rather faster than that in medium containing glucose; however, at the end of fermentation, the biomass of Shiraia sp. Slf14 in both the media became almost similar (Fig. 2a). According to the time profiles of biomass and total PQ yield, cell growth and PQ accumulation of Shiraia sp. Slf14 were rapid from days 2 to 8. Therefore, samples of Shiraia sp. Slf14 grown in fructose and glucose, respectively, were collected on day 4 for comparative transcriptome analysis.
Fig. 2.

Effects of initial fructose and glucose concentrations on the mycelial growth (a), sugar consumption (b), total perylenequinones (PQ) production (c), and biosynthesis of EA (d), EB (e), EC (f) and HA (g) in submerged culture of Shiraia sp. Slf14. * and ** denote statistic significance P < 0.05 and P < 0.01, respectively. DCW dry cell weight, EA elsinochrome A, EB elsinochrome B, EC elsinochrome C, HA hypocrellin A, HB hypocrellin B
RNA-seq analysis
To better understand the molecular mechanism of fructose-stimulated PQ production of Shiraia sp. Slf14, transcriptome analysis was performed. The RNA isolated from cells grown in glucose or fructose was subjected to Illumina sequencing assay and the data acquired were investigated. The raw reads were cleaned by removing adaptor sequences, empty reads, and low-quality reads, the results were valid, and Q30 was more than 90% (Table 1). The sequencing generated 14,596 unigenes with mean length of 1525.37 bp, among which 9183 unigenes showed various expression levels. These results highlighted a considerable difference in the transcriptomes of cells cultured under the two fermentation conditions. With regard to genes annotation, BLASTX was used to compare the obtained sequences with those in several well-known databases based on a threshold E value of 10−5. In total, of the 14,596 unigenes, 10,441 (71.53%) unigenes showed significant similarity to sequences in the NCBI NR database, while 5624 (38.53%), 3465 (23.74%), 3913 (26.81%), and 6777 (46.43%) unigenes were aligned to known proteins in SwissProt, String, KEGG, and Pfam databases, respectively. These assembled transcripts were mapped to a few public databases, and the number of transcripts aligned to each database was shown in Fig. 3.
Table 1.
Statistics of transcriptome sequencing
| Sample | Fructose | Glucose |
|---|---|---|
| Raw reads | 36,054,726 | 37,498,540 |
| Raw bases | 5,444,263,626 | 5,662,279,540 |
| Clean reads | 34,416,064 | 35,726,368 |
| Clean bases | 4,715,055,076 | 4,912,255,890 |
| Valid ratio (reads)/% | 95.46 | 95.27 |
| Q30a | 91.12 | 91.14 |
| GC content/%b | 52.57 | 52.8 |
aQ30: The percentage of bases with the values of Phred greater than 30 in total
bGC content: the percentage of the number of G and C bases in total
Fig. 3.
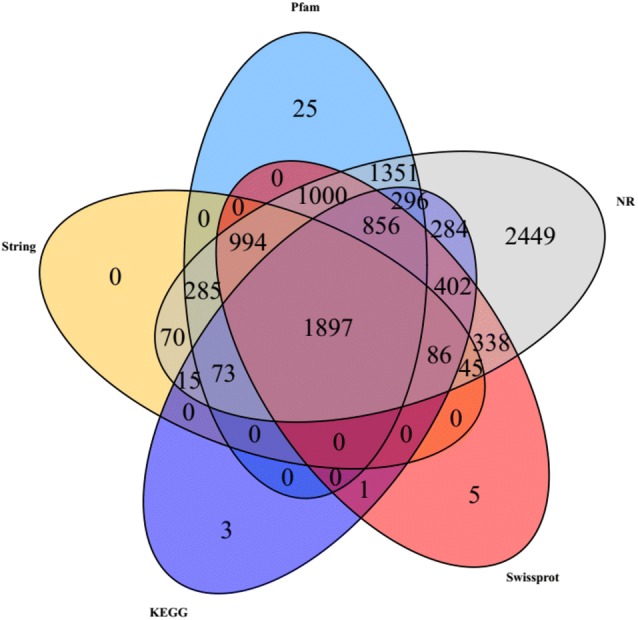
Venn diagram of transcripts detected in Pfam, NR, Swissprot, String and KEGG analysis
The GO annotation showed that these unigenes represent diverse functionalities and are involved in various metabolic pathways, including three categories of “molecular function,” “biological process,” and “cellular component” (Fig. S1). In the molecular function category, “binding” (GO: 0005488) and “catalytic activity” (GO: 0003824) constitute 45.3% (2763) and 60.01% (3633) of the level 2 GO terms, respectively. “Metabolic process” (GO: 0008152), “cellular process” (GO: 0009987), and “single-organism process” (GO: 0044763) were the most frequent under the biological process category, representing 72.32% (4378), 54.66% (3309), and 36.54% (2212) of the level 2 GO terms, respectively. In the cellular component category, “Cell” (GO: 0005623) was the most frequently occurring, representing 28.41% (1720) of the total level 2 GO terms. To identify biochemical pathways, the genes were mapped to 33 KEGG pathways, and the results showed that the most annotated gene pathways were the global and overview maps (1160, 29.64%) and carbohydrate metabolism (429, 10.96%). In particular, the top 20 pathways with the highest number of genes were all involved in carbon metabolism (Fig. S2).
To further study these DEGs, the transcripts with ∣fold change∣ > 2 were surveyed (Fig. S3). The results revealed that 212 genes among the 9183 unigenes were significantly upregulated in the presence of fructose, whereas 228 genes were downregulated. Many of the DEGs were mapped to pathways essential for “pentose and glucuronate interconversions,” “oxidative phosphorylation,” and “two-component system”, and the most frequently represented pathways were primarily involved in carbon metabolism. GO analysis of these genes revealed enrichment in the genes involved in “oxidoreducase activity,” “NADH dehydrogenase activity,” and “mitochondrial electron transport NADH to ubiquinone.” In brief, the largest group of upregulated genes was linked to transport systems and energy and central carbon metabolism.
Differential transcription profiles of Shiraia sp. Slf14 grown in glucose or fructose
The transcripts of “carbon metabolism” and “perylenequinones biosynthesizing pathway” were further analyzed because they were the most important KEGG pathways among fructose and glucose transcripts. When compared with cells grown in glucose, those grown in fructose exhibited significant upregulation of the hexose transporters (HXT; c9180_g1) in the plasma membrane and slight upregulation of fructose-specific transporters (Ght6; c3677_g1, c3637_g1) (Fig. 4; Table S2); however, unexpectedly, high-affinity glucose transporter (RGT2; c10951_g1) was also significantly upregulated. Besides, in cells cultivated in fructose, the genes of three rate-limiting enzymes involved in glycolysis, including hexokinase (HK; c1091_g1), phosphofructokinase (PKF; c3374_g1), and pyruvate kinase (PK; c12897_g1), were all significantly upregulated, which was expected based on increased biomass-specific fructose uptake rates. Furthermore, various genes involved in the pentose phosphate pathway (PPP) were significantly upregulated, except for the slight upregulation of phosphoglucose isomerase (PGI; c1912_g1), which could increase the production of NADPH cofactor required for cell growth and enzymatic activity for PQ biosynthesis. With regard to the TCA cycle, the gene encoding citrate synthase (CS; c12601_g1) was significantly upregulated, whereas the gene encoding aconitase (ACO; c10032_g1) was significantly downregulated, suggesting that fructose may promote the biosynthesis and accumulation of citrate. Meanwhile, significant downregulation of succinate dehydrogenase (SDH; c5753_g1) and 2-oxoglutarate dehydrogenase E1 component (OGDC; c11128_g1) indicated that fructose may suppress the TCA cycle. With respect to the glyoxylate pathway, the genes encoding the critical enzymes, isocitcrate lyase (ICL; c12802_g1) and malate synthase (MS; c598_g1), were significantly downregulated. Similarly, the genes of key enzymes involved in gluconeogenesis, fructose-1,6-biophosphatase (FBP; c6257_g1) and phosphoenolpyruvate carboxykinase (PEPCK; c6303_g1), were significantly downregulated. Furthermore, the genes encoding ATP-citrate lyase (ACL; c2763_g1) and acetyl-CoA carboxylase (ACC; c12803_g1), the critical enzymes generating cytosolic acetyl-CoA and malonyl-CoA for fatty acid and PQ biosynthesis, were significantly upregulated. Moreover, when compared with cells grown in glucose, those cultivated in fructose exhibited significant upregulation of various genes encoding the key enzymes predicted to be involved in PQ biosynthesis, including polyketide synthase I (PKS I; c1546_g2), FAD-dependent monooxygenase (Mono; c1546_g3), zinc finger transcription factor (Zftf; c650_g2), FAD/FMN-dependent oxidoreductase (FAD; c650_g2), O-methyltransferase (Omef; c1546_g3), and hydroxylase (Hydro; c650_g2). However, the gene encoding FAS was downregulated, and its expression was lower than that in cells grown in glucose.
Fig. 4.

Transcriptional profiles of Shiraia sp.Slf14 in the presence of glucose or fructose. a Red represents upregulated genes, and green denotes downregulated genes in the fructose sample compared with glucose sample, “◆→” indicates gluconeogenesis, “●⇢” indicates ellipsis; b the putative biosynthetic cluster of hypocrellin A; c putative hypocrellin A biosynthesis pathway. The samples were collected from the fermentation medium with fructose or glucose as the sole carbon source at day 4. FAD FAD/FMN-dependent oxidoreductase, MFS MFS transporter, Mono FAD-dependent monooxygenase, OmefO-methytransferase, ORF open reading frame, PKS polyketide synthase, Zftf zinc finger transcription. More information about enzyme and annotations are given in Table S2
Regulatory factor expression analysis
In filamentous fungi, secondary metabolite biosynthesis genes are usually clustered and transcriptionally co-regulated by a combination of pathway-specific and global regulators. Through stimulation of the key genes in the cluster, carbon source can improve secondary metabolites’ production (Li et al. 2015). To date, the best-studied PQ is cercosporin from Cercospora sp. The gene cluster, with eight co-regulated genes (CTB1-8), involved in cercosporin biosynthesis had been identified by using chromosome walking strategy, and a putative biosynthetic pathway had been proposed in C. nicotianae (Chen et al. 2007a, b). Subsequently, based on metabolites characterized from a series of biosynthetic gene knockouts, an alternative cercosporin biosynthetic pathway had been suggested (Newman and Townsend 2016), which has paved the way for future research of other perylenequinones. Although the production and bioactivities of HA have received considerable attention, research on the molecular mechanism involved in HA anabolic pathways is still limited, and the genes and mechanism of HA biosynthetic pathway remain unclear (Lei et al. 2017; Peng et al. 2015; Zhao et al. 2016). Our previous study was the first to complete the genome sequencing of Shiraia sp. Slf14, and predicted the biosynthetic cluster of HA (KM434884) (Fig. 4b) (Yang et al. 2014). Subsequently, the HA biosynthetic cluster was compared with homologous cercosporin gene cluster (CTB) and proved to be similar to the CTB cluster of C. nicotianae (Newman and Townsend 2016). In a recent study, the putative HA biosynthesis unigenes from S. bambusicola S4201 were compared and completely matched with the previously reported HA biosynthetic cluster (Zhao et al. 2016) and were upregulated by Ca2+ to enhance PQ production (Liu et al. 2018).To further understand the regulation mechanism of fructose and glucose metabolism, some important regulatory factors were studied (Fig. 4a; Table S2). The results revealed that Zftf (c650_g2), predicted to encode zinc finger transcription factor similar to CTB8 involved in cercosporin biosynthesis of Cercospora nicotianae, was upregulated (about 1.99-fold) in response to fructose, suggesting that Zftf may play a crucial role in the regulation of fructose metabolism. Additionally, the global transcription factors, Cre1 (c3716_g1) and PacC (c2824_g1), were also upregulated (1.56- and 2.57-fold, respectively), whereas a novel global transcription factor, LaeA (c2332_g2), was downregulated (1.92-fold). These pathway-specific and global regulator genes are known to be involved in the biosynthesis of secondary metabolites (Price et al. 2006). Both CreA and PacC have been reported to be regulated by carbon sources and pH in a number of different strains (Tilburn et al. 1995; Tamayo et al. 2008). Penicillin production has been noted to be positively regulated by CreA, but negatively regulated by PacC (Martin 2000). In the present study, both CreA and PacC positively regulated PQ biosynthesis in cells grown in medium containing fructose. In recent years, another major global regulator, LaeA, found in filamentous fungi, has been shown to play an essential role in regulating the expression of various gene clusters and production of secondary metabolite, and affecting the morphological differentiation of filamentous fungi. Most of the initial studies on LaeA had been performed in Aspergillus spp., in which LaeA deletion mutants showed significant reductions in the production of secondary metabolites such as sterigmatocystin, aflatoxin, gliotoxin, and endocrocin (Bok and Keller 2004; Jin et al. 2005). In contrast, in the present study, LaeA of Shiraia sp. Slf14 was downregulated in cells grown in medium containing fructose. This finding is consistent with that of DsLaeA in Dothistroma septosporum for dothistromin production, and DsLaeA deletion has been reported to enhance dothistromin production and increase the expression of the pathway-regulatory gene DsAflR (Chettri and Bradshaw 2016). Interestingly, dothistromin is also a polyketide virulence factor and photosensitive active agent similar to PQ. Thus, besides PQ-specific transcriptional regulation, basic transcriptional regulation might also be involved in PQ biosynthesis.
qRT-PCR analysis
In nature, biosynthesis of metabolites, including PQ, usually requires stoichiometric amounts of NADPH, ATP, and NADH (Lin et al. 2017), which could be acquired through central carbon metabolism. The PPP pathway, NADPH-dependent ICDH in the TCA cycle, and conversion of NADH to NADPH through membrane-bound transhydrogenase are considered to be the three major ways for the generation of NADPH, among which PPP pathway and ICDH in TCA cycle are the most efficient (Sauer et al. 2004).To validate the RNA-seq results, a subset of 14 genes was selected for qRT-PCR analysis with gene-specific primers (Table S1) Among them, GADPH was selected as the reference gene (Deng et al. 2016b). The RNA samples extracted from two additional biological replicate cultures were used as templates. In the present study, the PPP pathway exhibited significant improvement in cells grown in medium containing fructose, with higher transcription of genes in the PPP pathway leading to increase in the NADPH level (Fig. 5). Besides, the ICDH involved in the TCA cycle was also upregulated in cells grown in fructose-containing medium. Under the control conditions, the expression levels of the selected genes varied from the normalized RPKM value of 0.71 for c8011_g1 encoding diacylglycerol acyltransferase (DGAT) to an RPKM value of 4.2 for c437_g1 encoding Omef. Three genes encoding FAS, DGAT, and ICL were downregulated, respectively, whereas Ght6 and the genes involved in PQ biosynthesis were upregulated. The PCR results showed an obvious positive correlation with RNA-seq transcriptomics data, suggesting that the RNA-seq data were of good quality. Moreover, oxidative phosphorylation cycle was strongly induced by glucose, but inhibited by fructose, suggesting that more ATP produced by oxidative phosphorylation cycle was needed for fatty acid synthesis and gluconeogenesis during glucose fermentation. In other words, promoting pathways such as glycolysis, TCA cycle, and PPP pathway can improve the cofactor supply required for PQ production.
Fig. 5.

qRT-PCR detection of 14 genes from Shiraia sp.Slf14 cultured in glucose or fructose fermentation conditions. Selected genes show relative differential expression using the sample cultured in glucose as controls. GADPH was selected as the reference gene. Above and below the X-axis, the upregulation and downregulation of gene expression are represented, respectively. * and ** denote statistic significance P < 0.05 and P < 0.01, respectively. The samples were collected from the fermentation medium with fructose or glucose as the sole carbon source at day 4. ACL ATP-citrate lyase, DGAT diacylglycerol acyltransferase, FAD FAD/FMN-dependent oxidoreductase, FAS fatty acid synthase, GAPDH glyceralde hydephosphate dehydrogenase, Ght6 high-affinity fructose transporter, HXT hexose transpoters, ICDH isocitrate dehydrogenase, ICL isocitrate lyase, cMono monooxygenase, OmefO-methytransferase, PKS polyketide synthase I, Zftf zinc finger transcription
Measurement of enzymes activities
The activities of some key enzymes involved in carbon metabolism and fatty acid synthesis, including ACL, ICDH, ME, and FAS, were measured in Shiraia sp. Slf14 cells cultured in medium containing fructose and glucose, respectively (Fig. 6). In cells grown in fructose, the activities of ACL, ICDH, and ME were higher, whereas that of FAS was lower, when compared with those in cells grown in glucose. These results were consistent with the qRT-PCR and RNA-seq transcriptomics data. Above all, higher transcription of NADP-ME and increased ME activity were noted in cells cultured in medium containing fructose (Figs. 4a, 5, 6; Table S2), suggesting a positive role of ME in NADPH for PQ synthesis.
Fig. 6.

Enzyme activities of isocitrate dehydrogenase (ICDH), NADP-dependent malic enzyme (ME), ATP-citrate lyase (ACL), and fatty acid synthase (FAS) from Shiraia sp. Slf14 cultured fructose or glucose media respectively. * Indicates statistic significance P < 0.05
Conclusion
In summary, fructose was more beneficial for PQ biosynthesis by Shiraia sp. Slf14 than glucose as the carbon source. With fructose as the sole carbon source, Shiraia sp. Slf14 could promote supplies of precursors, including acetyl-CoA and malonyl-CoA, for polyketide synthesis by altering the primary metabolic pathways. Besides, the putative gene cluster involved in PQ biosynthesis was upregulated, leading to significant increase in PQ production. Based on these results, the putative cluster involved in PQ biosynthesis and the hypothetical HA biosynthetic pathway was further verified. The findings of this study could help understand the pathways and regulations of PQ biosynthesis by Shiraia sp. Slf14 at the molecular level, and provide new metabolic insights for alternative efficient PQ production.
Electronic supplementary material
Below is the link to the electronic supplementary material.
Acknowledgements
This work was supported by the National Natural Science Foundation of China (Grant No. 31460021) and Natural Science Foundation of Jiangxi Province of China (Grant Nos. 20151BAB204002; 20151BAB204003; 20181BAB215044).
Compliance with ethical standards
Conflict of interest
The authors declare that they have no conflict of interest.
Footnotes
Zhengying Liu and Jianying Bao contributed equally to this work.
References
- Bellou S, Triantaphyllidou IE, Mizerakis P, Aggelis G. High lipid accumulation in Yarrowia lipolytica cultivated under double limitation of nitrogen and magnesium. J Biotechnol. 2016;234:116–126. doi: 10.1016/j.jbiotec.2016.08.001. [DOI] [PubMed] [Google Scholar]
- Bok JW, Keller NP. LaeA, a regulator of secondary metabolism in Aspergillus spp. Eukaryot Cell. 2004;3(2):527–535. doi: 10.1128/ec.3.2.527-535.2004. [DOI] [PMC free article] [PubMed] [Google Scholar]
- Cai Y, Liao X, Liang X, Ding Y, Sun J, Zhang D. Induction of hypocrellin production by Triton X-100 under submerged fermentation with Shiraia sp. SUPER-H168. N Biotechnol. 2011;28(6):588–592. doi: 10.1016/j.nbt.2011.02.001. [DOI] [PubMed] [Google Scholar]
- Chen HQ, Lee MH, Chung KR. Functional characterization of three genes encoding putative oxidoreductases required for cercosporin toxin biosynthesis in the fungus Cercospora nicotianae. Microbiol. 2007;153:2781–2790. doi: 10.1099/mic.0.2007/007294-0. [DOI] [PubMed] [Google Scholar]
- Chen HQ, Lee MH, Daub ME, Chung KR. Molecular analysis of the cercosporin biosynthetic gene cluster in Cercospora nicotianae. Mol Microbiol. 2007;64(3):755–770. doi: 10.1111/j.1365-2958.2007.05689.x. [DOI] [PubMed] [Google Scholar]
- Chettri P, Bradshaw RE. LaeA negatively regulates dothistromin production in the pine needle pathogen Dothistroma septosporum. Fungal Genet Biol. 2016;97:24–32. doi: 10.1016/j.fgb.2016.11.001. [DOI] [PubMed] [Google Scholar]
- Deng H, Chen J, Gao R, Liao X, Cai Y. Adaptive responses to oxidative stress in the filamentous fungal Shiraia bambusicola. Molecules. 2016;21(9):1118. doi: 10.3390/molecules21091118. [DOI] [PMC free article] [PubMed] [Google Scholar]
- Deng H, Gao R, Liao X, Cai Y. Reference genes selection and relative expression analysis from Shiraia sp. SUPER-H168 productive of hypocrellin. Gene. 2016;580:67–72. doi: 10.1016/j.gene.2016.01.019. [DOI] [PubMed] [Google Scholar]
- Diwu Z, Lown JW. Hypocrellins and their use in photosensitization. Photochem Photobiol. 1990;52:609–616. doi: 10.1111/j.1751-1097.1990.tb01807.x. [DOI] [PubMed] [Google Scholar]
- Du W, Liang ZQ, Zou X, Han YF, Liang JD, Yu JP, Chen WH, Wang YR, Sun CL. Effects of microbial elicitor on production of hypocrellin by Shiraia bambusicola. Folia Microbiol. 2013;58:283–289. doi: 10.1007/s12223-012-0203-9. [DOI] [PubMed] [Google Scholar]
- Du W, Liang J, Han Y, Yu J, Liang Z. Nitric oxide mediates hypocrellin accumulation induced by fungal elicitor in submerged cultures of Shiraia bambusicola. Biotechnol Lett. 2015;37(1):153–159. doi: 10.1007/s10529-014-1665-4. [DOI] [PubMed] [Google Scholar]
- Gangwar M, Sood A, Bansal A, Chauhan RS. Comparative transcriptomics reveals a reduction in carbon capture and flux between source and sink in cytokinin-treated inflorescences of Jatropha curcas L. 3 Biotech. 2018;8(1):64. doi: 10.1007/s13205-018-1089-2. [DOI] [PMC free article] [PubMed] [Google Scholar]
- Geer BW, Krochko D, Oliver MJ, Walker VK, Williamson JH. A comparative study of the NADP-malic enzymes from Drosophila and chick liver. Comp Biochem Physiol. 1980;65(1):25–34. doi: 10.1016/0305-0491(80)90109-1. [DOI] [Google Scholar]
- Hu M, Cai Y, Liao X, Hu Y, Li Z, Zhang D. Optimization submerged fermentation of hypocrellin. Food Mach. 2010;26(5):141–143. doi: 10.3696/j.issn.1003-5788.2010.05.041. [DOI] [Google Scholar]
- Jin WB, Balajee SA, Marr KA, Andes D, Nielsen KF, Frisvad JC, Keller NP. LaeA, a regulator of morphogenetic fungal virulence factors. Eukaryot Cell. 2005;4(9):1574–1582. doi: 10.1128/EC.4.9.1574-1582.2005. [DOI] [PMC free article] [PubMed] [Google Scholar]
- Kayali HA, Tarhan L, Sazak A, Sahin N. Carbohydrate metabolite pathways and antibiotic production variations of a novel Streptomyces sp. M3004 depending on the concentrations of carbon sources. Appl Biochem Biotechnol. 2011;165(1):369–381. doi: 10.1007/s12010-014-1445-6. [DOI] [PubMed] [Google Scholar]
- Kishi T, Tahara S, Taniguchi N, Tsuda M, Tanaka C, Takahashi S. New perylenequinones from Shiraia bambusicola. Planta Med. 1991;57(4):376–379. doi: 10.1055/s-2006-960121. [DOI] [PubMed] [Google Scholar]
- Kornberg A. Isocitric dehydrogenase of yeast (TPN) Methods Enzymol. 1955;1:705–709. doi: 10.1016/0076-6879(55)01123-3. [DOI] [Google Scholar]
- Lei XY, Zhang MY, Ma YJ, Wang WJ. Transcriptomic responses involved in enhanced production of hypocrellin A by addition of Triton X-100 in submerged cultures of Shiraia bambusicola. J Ind Microbiol Biotechnol. 2017;44(10):1415–1429. doi: 10.1007/s10295-017-1965-5. [DOI] [PubMed] [Google Scholar]
- Li T, Fan Y, Nambou K, Hu F, Imanaka T, Wei L, Hua Q. Improvement of ansamitocin p-3 production by Actinosynnema mirum with fructose as the sole carbon source. Appl Biochem Biotechnol. 2015;175(6):2845–2856. doi: 10.1007/s12010-014-1445-6. [DOI] [PubMed] [Google Scholar]
- Li T, Hou C, Shen X. Efficient agrobacterium-mediated transformation of Shiraia bambusicola and activation of a specific transcription factor for hypocrellin production. Biotechnol Biotec Eq. 2019;33(1):1365–1371. doi: 10.1080/13102818.2019.1667874. [DOI] [Google Scholar]
- Liang XH, Cai YJ, Liao XR, Wu K, Wang L, Zhang DB, Meng Q. Isolation and identification of a new hypocrellin a-producing strain Shiraia sp. SUPER-H168. Microbiol Res. 2009;164:9–17. doi: 10.1016/j.micres.2008.08.004. [DOI] [PubMed] [Google Scholar]
- Liang SL, Wang B, Pan L, Ye YR, He MH, Han SY, Zheng SP, Wang XN, Lin Y. Comprehensive structural annotation of Pichia pastoris transcriptome and the response to various carbon sources using deep paired-end RNA sequencing. BMC Genom. 2012;13:738. doi: 10.1186/1471-2164-13-738. [DOI] [PMC free article] [PubMed] [Google Scholar]
- Lin Z, An J, Wang J, Niu J, Ma C, Wang L, Yuan G, Shi L, Liu L, Zhang J, Zhang Z, Qi J, Lin S. Integrated analysis of 454 and Illumina transcriptomic sequencing characterizes carbon fux and energy source for fatty acid synthesis in developing Lindera glauca fruits for woody biodiesel. Biotechnol Biofuels. 2017;10:134–154. doi: 10.1186/s13068-017-0820-2. [DOI] [PMC free article] [PubMed] [Google Scholar]
- Liu XY, Shen XY, Fan L, Gao J, Hou CL. High-efficiency biosynthesis of hypocrellin a in Shiraia sp. using gamma-ray mutagenesis. Appl Microbiol Biotechnol. 2016;10(11):4875–4883. doi: 10.1007/s00253-015-7222-9. [DOI] [PubMed] [Google Scholar]
- Liu B, Bao J, Zhang Z, Yan R, Wang Y, Yang H, Zhu D. Enhanced production of perylenequinonesin the endophytic fungus Shiraia sp. Slf14 by calcium/calmodulin signal transduction. Appl Microbiol Biotechnol. 2018;102(1):153–163. doi: 10.1007/s00253-017-8602-0. [DOI] [PubMed] [Google Scholar]
- Livak KJ, Schmittgen TD. Analysis of relative gene expression data using real-time quantitative PCR and the 2−ΔΔCT method. Methods. 2001;25(4):402–408. doi: 10.1006/meth.2001.1262. [DOI] [PubMed] [Google Scholar]
- Martin JF. Molecular control of expression of penicillin biosynthesis genes in fungi regulatory proteins interact with a bidirectional promoter region. J Bacteriol. 2000;182(9):2355–2362. doi: 10.1128/JB.182.9.2355-2362.2000. [DOI] [PMC free article] [PubMed] [Google Scholar]
- Mulrooey CA, Obrien EM, Morgan BJ, Kozlowski MC. Perylenequinones: isolation, synthesis, and biological activity. Eur J Org Chem. 2012;21:3887–3904. doi: 10.1002/ejoc.201200184. [DOI] [PMC free article] [PubMed] [Google Scholar]
- Newman AG, Townsend CA. Molecular characterization of the cercosporin biosynthetic pathway in the fungal plant pathogen Cercospora nicotianae. J Am Chem Soc. 2016;138(12):4219–4228. doi: 10.1021/jacs.6b00633. [DOI] [PMC free article] [PubMed] [Google Scholar]
- Pan WS, Ji YY, Yang ZY, Wang JW. Screening of high-yield hypocrellin A producing mutants from Shiraia sp. S8 by protoplast mutagenesis and ultraviolet irradiation. Chin J Bioprocess Eng. 2012;10(6):18–23. doi: 10.3969/j.issn.1672-3678.2012.06.004. [DOI] [Google Scholar]
- Peng SL, Yang HL, Li EH, Wang XL, Zhu D (2015) The prokaryotic expression, purification and bioinformatics of type III polyketide synthase from Shiraia sp Slf14, which is an endophytic fungus of Huperzia serrata. J Jiangxi Norm Univ 39: 430–434. https://www.org/CNKI:SUN:CAPE0.2015-04-019
- Price MS, Yu J, Nierman WC, Kim HS, Pritchard B, Jacobus CA, Bhatnagar D, Cleveland TE, Payne GA. The aflatoxin pathway regulator AflR induces gene transcription inside and outside of the aflatoxin biosynthetic cluster. FEMS Microbiol Lett. 2006;255(2):275–279. doi: 10.1111/j.1574-6968.2005.00084.x. [DOI] [PubMed] [Google Scholar]
- Sauer U, Canonaco F, Heri S, Perrenoud A, Fisher E. The soluble and membrane-bound transhydrogenases UdhA and PntAB have divergent functions in NADPH metabolism of Escherichia coli. J Biol Chem. 2004;279:6613–6619. doi: 10.1074/jbc.M311657200. [DOI] [PubMed] [Google Scholar]
- Shen XY, Zheng DQ, Gao J, Hou CL. Isolation and evaluation of endophytic fungi with antimicrobial ability from Phyllostachys edulis. Bangl J Pharmacol. 2012;7(4):249–257. doi: 10.3329/bjp.v7i4.12068. [DOI] [Google Scholar]
- Silva CAA, Oka ML, Fonseca GG. Physiology of yeast strains isolated from Brazilian biomes in a minimal medium using fructose as the sole carbon source reveals potential biotechnological applications. 3 Biotech. 2019;9:191. doi: 10.1007/s13205-019-1721-9. [DOI] [PMC free article] [PubMed] [Google Scholar]
- Srere PA. The citrate cleavage enzyme. I. Distribution and purification. J Biol Chem. 1959;234(10):2544–2547. [PubMed] [Google Scholar]
- Stoops JK, Awad ES, Arslanian MJ, Gunsberg S, Wakil SJ, Oliver RM. Studies on the yeast fatty acid synthetase subunit composition and structural organization of a large multifunctional enzyme complex. J Biol Chem. 1978;253(12):4464–4475. [PubMed] [Google Scholar]
- Su Y, Si S, Qiao L, Cai Y, Xu Z, Yang Y. The effect of a hypocrellin A enriched diet on egg yolk quality and hypocrellin A distributions in the meat of laying hens. Eur Food Res Technol. 2011;232:935–940. doi: 10.1007/s00217-011-1461-5. [DOI] [Google Scholar]
- Sun CX, Ma YJ, Wang JW. Enhanced production of hypocrellin A by ultrasound stimulation in submerged cultures of Shiraia bambusicola. Ultrason Sonochem. 2017;38:214–224. doi: 10.1016/j.ultsonch.2017.03.020. [DOI] [PubMed] [Google Scholar]
- Tamayo EN, Villanueva A, Hasper AA, De Graaff LH, Ramon D, Orejas M. CreA mediates repression of the regulatory gene xlnr which controls the production of xylanolytic enzymes in Aspergillus nidulans. Fungal Genet Biol. 2008;45(6):984–993. doi: 10.1016/j.fgb.2008.03.002. [DOI] [PubMed] [Google Scholar]
- Tilburn J, Sarkar S, Widdick DA, Espeso EA, Orejas M, Mungroo J, Pefnalva MA, Arst HN. The Aspergillus pacc zinc finger transcription factor mediates regulation of both acid- and alkaline-expressed genes by ambient pH. EMBO J. 1995;14(4):779–790. doi: 10.1002/j.1460-2075.1995.tb07056.x. [DOI] [PMC free article] [PubMed] [Google Scholar]
- Tong ZW, Mao LW, Liang HL, Zhang ZB, Wang Y, Yan RM, Zhu D. Simultaneous determination of six perylenequinones in Shiraia sp. Slf14 by HPLC. J Liq Chromatogr Relat Technol. 2017;40(10):536–540. doi: 10.1080/10826076.2017.1331172. [DOI] [Google Scholar]
- Wu H, Lao XF, Wang QW, Lu RR, Shen C, Zhang F, Liu M, Jia L. The shiraia chromes: novel fungal perylenequinone pigments from Shiraia bambusicola. J Nat Prod. 1989;52:948–951. doi: 10.1021/np50065a006. [DOI] [Google Scholar]
- Xiang XY, Zheng AF, Xie L. Effect of different metal ions for submerged culture of Shiraia bambusicola. Chin Tradit Herbal Drugs. 2011;42:164–166. doi: 10.1088/1009-0630/13/1/25. [DOI] [Google Scholar]
- Xiang XY, Zhang ZX, Xie L, Zheng AF. Study on fermentation hypocrellin by Shiraia bambusicolain submerged cultures. Guihaia. 2012;32(2):264–268. doi: 10.3969/j.issn.1000-3142.2012.02.024. [DOI] [Google Scholar]
- Xu YN, Zhong JJ. Impacts of calcium signal transduction on the fermentation production of antitumor ganoderic acids by medicinal mushroom Ganoderma lucidum. Biotechnol Adv. 2012;30:1301–1308. doi: 10.1016/j.biotechadv.2011.10.001. [DOI] [PubMed] [Google Scholar]
- Yan R, Li X, Wang Y, Yu J, Zhang Z, Zhu D. Chemical constituents of endophytic fungi Shiraia sp. Slf14 from Huperzia serrata and their antibacterial activity. Nat Prod Res Dev. 2014;26:1393–1397. doi: 10.16333/j.1001-6880.2014.09.013. [DOI] [Google Scholar]
- Yang H, Xiao C, Ma W, He G. The production of hypocrellin colorants by submerged cultivation of the medicinal fungus Shiraia bambusicola. Dyes Pigments. 2009;82(2):142–146. doi: 10.1016/j.dyepig.2008.12.012. [DOI] [Google Scholar]
- Yang HL, Wang Y, Zhang ZB, Yan RM, Zhu D. Whole-genome shotgun assembly and analysis of the genome of Shiraia sp. strain Slf14, a novel endophytic fungus producing huperzine A and hypocrellin A. Genome Announc. 2014;2:343–349. doi: 10.1128/genomeA.00011-14. [DOI] [PMC free article] [PubMed] [Google Scholar]
- Zhao N, Lin X, Qi SS, Luo ZM, Chen SL, Yan SZ. De Novo transcriptome assembly in Shiraia bambusicola to investigate putative genes involved in the biosynthesis of hypocrellin A. Int J Mol Sci. 2016;17(3):311. doi: 10.3390/ijms17030311. [DOI] [PMC free article] [PubMed] [Google Scholar]
- Zhu D, Wang J, Zeng Q, Zhang Z, Yan R. A novel endophytic Huperzine A-producing fungus, Shiraia sp. Slf14, isolated from Huperzia serrata. J Appl Microbiol. 2010;109(4):1469–1478. doi: 10.1111/j.1365-2672.2010.04777.x. [DOI] [PubMed] [Google Scholar]
Associated Data
This section collects any data citations, data availability statements, or supplementary materials included in this article.
Supplementary Materials
Data Availability Statement
The sequenced reads have been deposited in NCBI’s Sequence Read Archive under accession number SRP115742, BioProject under accession number PRJNA399021, and BioSample under Accession No. SAMN07521971.