

Abstract
Accurate quantification of impurities existing as separate crystalline phases at trace levels in drug materials is an important issue in the pharmaceutical industry. In the present study, a thermoanalytical approach previously developed for quantifying trace levels of polymorphic impurity (form II metastable nuclei) in commercial salmeterol xinafoate powders has been successfully applied with slight modifications to ribavirin, an antiviral drug exhibiting roughly similar polymorph-dependent crystallization kinetics in melts to that of salmeterol xinafoate. Essentially, the approach involved modeling of the crystallization kinetics of both tested and reference drug materials in melts using the Avrami-Erofe’ev (AE) rate expression, derivation of a mathematical equation for relating the AE kinetic constant to the composition of reference polymorph mixtures, and the use of this derived equation (in the form of a calibration curve) to calculate the impurity contents of the tested samples from their computed AE constants. For ribavirin, modification of the latter equation by incorporation of an empirical exponent was found necessary to account for the composition-dependent changes in crystallization kinetics of the reference mixtures. Such modification has made possible the determination of polymorphic impurity content of as low as 0.004% (w/w) in ribavirin samples induced by different forms of grinding treatment.
Keywords: Polymorphic impurity determination, Thermal analysis, Enantiotropic polymorphism, Melt crystallization kinetics, Avrami's equation, Ribavirin
1. Introduction
Polymorphism is an important solid-state property for consideration in the formulation development and large-scale production of solid dosage forms in the pharmaceutical industry. Since different crystalline polymorphs exhibit different physicochemical properties (e.g. melting point, density, hardness, stability and dissolution rate) and possibly bioavailability, stringent regulatory requirements have been imposed on the identification and specification of polymorphs for particular drug materials as part of the quality assurance process. For stability reason, the form that is stable under ambient conditions is normally employed in drug formulation. Contamination of a drug material with its alternative metastable polymorphic form, which can occur during crystallization, grinding/milling or any other form of mechanical treatment, is of particular concern, since such polymorphic impurity could adversely compromise both the stability and the performance of the final products. In order to limit such undesirable physical impurity in pharmaceutical materials, accurate quantification of trace levels of such impurities existing as separate crystalline phases has become an important issue. However, the most widely used methods for solid-phase characterization such as differential scanning calorimetry (DSC), powder X-ray diffraction (PXRD), Fourier-transform infrared (FTIR) spectroscopy and near-infrared (NIR) spectroscopy, are normally not sufficiently sensitive for detecting relatively low levels (<5%) of polymorphic impurity.
In our previous study, a thermoanalytical approach using a standard DSC instrument has been successfully applied to quantify trace levels of polymorphic form II impurity in form I samples of salmeterol xinafoate (SX) (Tong et al., 2003). Essentially, the approach involved measurement of the recrystallization rate of form II from form I melt in DSC at varying scanning speeds, and analysis of the data (expressed as α–time curves) by non-linear iterative fitting to the Avrami-Erofe’ev (AE) equation for the tested SX samples and reference materials of forms I and II mixed in various defined ratios. A mathematical equation based on an instantaneous nucleation model was derived specifically to relate the AE rate constants determined using the physical mixtures of reference SX materials to the corresponding crystal phase compositions (i.e. for construction of a calibration curve). This equation was then used to calculate the concentration of polymorphic form II impurity in each tested form I sample from the computed AE rate constant. It should be noted that the principle of this technique is based not on a direct measurement of the enthalpy of fusion for estimating the actual amount of form II present (as in a standard DSC approach), but rather on how fast this high-melting polymorph is being generated from the form I melt. It has been demonstrated that quantification of as low as 0.1% (w/w) of form II is feasible. It has also been suggested that such a technique could potentially be applied to other enantiotropic polymorphic pairs. In order to verify the general applicability of the developed approach in other enantiotropic polymorph systems and to refine the approach for adaptation to other variants of crystallization kinetics, we have extended the above work to ribavirin, an antiviral drug displaying roughly similar polymorph-dependent crystallization kinetics in melts to that of salmeterol xinafoate.
Ribavirin has long been known to exist in two enantiotropically related polymorphic forms (I and II) (see Section 3.1) (Witkowski et al., 1972, Prusiner and Sundaralingam, 1973). Form II is the stable form at ambient temperature and melts at 166–168 °C while form I, the metastable polymorph, melts at 174–176 °C (Witkowski et al., 1972). The drug has been widely used for several decades to treat viral infections such as hepatitis C (Bacon, 2004). Recently, it has received renewed interest due to its emerging role in the treatment of severe acute respiratory syndrome (SARS) (Tsang et al., 2003, Lee et al., 2003, Hon et al., 2003).
In the present study, ribavirin in pure forms II and I (reference materials) were first prepared, respectively, below and above the transition temperature by recrystallization of pharmaceutical grade ribavirin (form II) from solution and melt. After confirming the identity of the polymorphs by DSC, PXRD and FTIR spectroscopy, the recrystallized (reference) and pharmaceutical grade ribavirin samples were subjected to thermal analysis as reported for salmeterol xinafoate. In order to generate appropriate levels (i.e. below 5%, w/w) of form I metastable phase in pharmaceutical grade ribavirin for trial determination by the established approach, the material was triturated manually or ground using a self-fabricated ball mill system for various time periods. It should be noted that while such grinding treatments might also produce amorphous materials, DSC analysis of the ground ribavirin samples did not reveal any recrystallization exotherm before the melting of form II even at the slowest scanning rate (2 K min−1) and PXRD showed negligible changes in diffraction pattern (data not shown), suggesting that amorphous ribavirin is either absent or present in trace (non-detectable) quantities. Such low levels of amorphous microdomains in the samples are unlikely to have any significant bearing on the polymorphic impurity determination, as the approach measures the impurity in terms of the recrystallization rate of form I from form II melt, which is strictly dependent on the amount of form I nuclei present (see Section 3.2).
2. Materials and methods
2.1. Materials
Ribavirin raw material (R-RW) of USP grade was purchased from International Laboratory Ltd., Las Vegas, USA. Absolute ethanol was supplied by Merck, Germany. Potassium dihydrogen phosphate (analytical grade) and methanol (HPLC grade) were obtained, respectively, from Riedel-de Haen Co. Ltd., Germany and Tedia Co. Inc., USA. All water used was deionized and double distilled.
2.2. Preparation of polymorphically pure ribavirin forms II and I ribavirin crystals
The crystal structure of R-RW is consistent with that of form II reported in literature (Witkowski et al., 1972, Prusiner and Sundaralingam, 1973). Pure ribavirin form II (R-II) crystals were prepared by recrystallization of R-RW from water (Prusiner and Sundaralingam, 1973). Slight excess of R-RW was dissolved in water at 60 °C to form a supersaturated solution. The solution was left to cool slowly at room temperature, and the resulting crystals (R-II) were harvested, and dried thoroughly in desiccators over phosphorous pentoxide prior to use. Pure ribavirin form I (R-I) crystals were prepared by recrystallization of R-RW from melt at 169–170 °C on a hot-stage microscope (HSM), and the crystal form of the resulting material was confirmed by DSC, PXRD and FTIR spectroscopy.
2.3. Preparation of physical mixtures of R-II and R-I
Physical mixtures of R-II and R-I were prepared by gentle blending using a geometric dilution technique. R-II alone was also subjected to the same mixing treatment to check for possible induction of the metastable form I nuclei. No significant changes in thermal behavior of the material were observed.
2.4. Influence of trituration on R-RW
R-RW was placed in a porcelain mortar and triturated manually using a pestle, as in extemporaneous compounding (Chan et al., 2004). Samples were removed for DSC analysis at 0, 1, 3, 6, 10, 20, 30, 40 and 50 min. Since hand-triturated ribavirin samples are subject to variability associated with inconsistency in the applied shear stress, another set of data were obtained for parallel comparison using a self-fabricated ball mill system. Three lead spheres of 2 cm diameter were placed inside a cylindrical metal container (i.d. = 4.2 cm, height = 10 cm). The container was rotated on its longitudinal axis at a constant speed of 120 rpm. Samples were then withdrawn for analysis at various time intervals as before.
2.5. Thermogravimetric analysis (TGA)
TGA was performed in an open pan using a Perkin-Elmer Thermogravimetric Analyzer TGA 7 with Thermal Analysis Controller TAC 7/DX. Approximately, 10 mg of sample (accurately weighed) was placed in the pan and scanned at 2 or 10 °C min−1 from 50 to 260 °C.
2.6. Differential scanning calorimetry
DSC analysis was performed using a Perkin-Elmer Pyris 1 differential scanning calorimeter (with Pyris Manager software). Indium (T m = 156.6 °C; ΔH f = 28.45 J g−1) was used for calibration. Accurately weighed samples (1.5–2.0 mg) were placed in hermetically sealed aluminum pans and scanned at 2–50 °C min−1 under nitrogen purge.
2.7. Hot-stage microscopy
Samples were examined under a hot-stage microscope (Leica Galen III) for both melting and recrystallization events. Heating rate was set at 10 °C min−1.
2.8. Fourier-transform infrared spectroscopy
Spectra were recorded from KBr disks using a Perkin-Elmer Fourier-Transform Infrared Red System (SpectrumBX) (Perkin-Elmer, Beaconsfield, Buckinghamshire, UK). Number of scan was 16 and resolution was 4 cm−1. Samples were scanned from 4000 to 400 cm−1 at an interval of 2 cm−1.
2.9. Powder X-ray diffraction
PXRD patterns of ribavirin (R-I and R-II) samples were recorded on a Philips Powder X-Ray Diffraction System, Model PW 1830 3 kW using Cu anode (λ = 1.540562 Å) over the 2θ interval 2.0–40.0°. Step size was 0.05° with a counting time of 2 s.
2.10. High performance liquid chromatography (HPLC)
Ribavirin was assayed using a stability-indicating HPLC method reported by Shah et al. (1994) with slight modifications (Chan et al., 2004). The analysis employed a Hypersil C18 reversed phase column (5 μm, 250 mm × 4.6 mm i.d., Thermo Hypersil Ltd., Cheshire, UK) and a Waters 2695 LC system equipped with a Waters 996 photodiode array detector and an autosampler (Waters, MA, USA). The mobile phase, composed of 0.01 M potassium dihydrogen phosphate solution and pure methanol (95:5, v/v), was eluted isocratically at a flow rate of 1 ml min−1. Detector response was set at 207 nm. Ribavirin was eluted as a single peak in the chromatogram at around 4.55–4.65 min. R-RW, R-II and R-I samples were dissolved in water to yield a final concentration of 0.2 mg ml−1. Fifty microlitres of samples were injected onto the column. A calibration curve constructed using standard ribavirin solutions within the appropriate concentration range displayed excellent linearity with an R 2 larger than 0.99. All measurements were performed in triplicate.
2.11. Statistical analysis
Sigmastat® V.3.1, Systat Software Inc., SPSS (Hong Kong) Ltd. was employed for all non-linear regression analysis in this study.
3. Results and discussion
3.1. Identification of ribavirin polymorphic forms
Ribavirin form II crystals (R-RW and R-II) were rod-shaped whereas the form I crystals (R-I) were distinctly different platelets, as examined by optical light microscopy. Fig. 1 depicts the DSC and TGA curves of R-RW obtained at 2 °C min−1 while Fig. 2 shows the DSC profiles of R-RW, R-II and R-I generated at 2 °C min−1. As revealed in Fig. 2, R-RW melted at 166.6 °C and partially recrystallized to form I, which subsequently melted at 175.7 °C. This thermal behavior is in close agreement with that reported in literature (Witkowski et al., 1972). No thermal degradation was evident in TGA at 2 K min−1 until the temperature reached 228.6 °C. As with R-RW, R-II melted at around 166.2 °C, but the melting endotherm of form I was virtually not discernable (Fig. 2). Comparison of the fusion thermodynamic properties between R-I (form I) and R-II (form II) showed that form I has a lower enthalpy of fusion (ΔH f) than form II (144.5 J g−1 versus 170.7 J g−1) but a higher melting point than form II (174.7 °C versus 166.2 °C), consistent with enantiotropic polymorphism (Burger and Ramberger, 1979a, Burger and Ramberger, 1979b). The DSC profiles of individual R-I and R-II samples are devoid of the melting endotherms of the alternative polymorphic forms, reflecting a very high level of polymorphic purity for these recrystallized samples (Fig. 2).
Fig. 1.
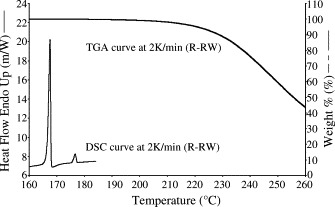
DSC and TGA curves of R-RW obtained at 2 K min−1.
Fig. 2.

DSC curves of R-RW, R-II (stable form) and R-I (metastable form) obtained at 2 K min−1.
The polymorphic identity of the various ribavirin samples was further confirmed by FTIR spectroscopy (Fig. 3 ) and PXRD (Fig. 4 ). As suggested by the differences/similarities in FTIR spectra and PXRD patterns among the samples, R-II and R-I are distinctly different polymorphs while R-RW and R-II are of essentially the same form. Careful examination of the wave-numbers of selected bands in the spectra revealed significant differences in intermolecular and intramolecular hydrogen bonding network between R-II and R-I (Table 1 ), consistent with the structural differences expected of the two polymorphs. Comparison of the observed PXRD patterns with simulated crystal structure data (Allen, 2002, Bruno et al., 2002) also confirmed R-II and R-I to be the stable form II and metastable form I, respectively, as reported in literature (Prusiner and Sundaralingam, 1973). Interestingly, the reported crystal density of form II (1.584 g cm−3) is lower than that of form I (1.654 g cm−3) (Prusiner and Sundaralingam, 1973), which appears to violate the density rule (Burger and Ramberger, 1979a). Nonetheless, there are a few pharmaceutical examples where the density rule does not hold, such as chloroprocaine (Schmidt and Griesser, 2003), hydroquinone (Naoki et al., 1999), neotame (Dong et al., 2002) and resorcinol (Yoshino et al., 1999).
Fig. 3.
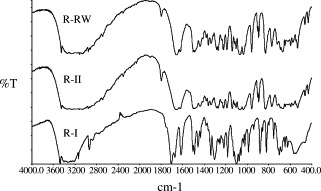
FTIR spectra of R-RW, R-II and R-I.
Fig. 4.
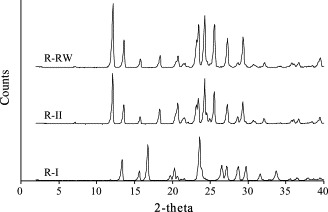
PXRD patterns of R-RW, R-II and R-I.
Table 1.
Wavenumbers (cm−1) of selected bands in FTIR spectra of ribavirin samples
| Functional groups | R-RW (form II; stable form) | R-II (form II; stable form) | R-I (form I; metastable form) |
|---|---|---|---|
| νOH | 3450.74, sharp; strong | 3450.47, sharp; strong | 3475.16, sharp; strong |
| νOH and 1° amide | 3346.77, 3254.56, broad; strong | 3346.39, 3254.33, broad; strong | 3410.69, 3325.30, broad; strong |
| 1° amide | 1656.76, 1623.99, sharp; strong | 1656.79, 1624.00, sharp; strong | 1705.24, 1672.65, sharp; strong |
| Alphatic ether | 1066.52, 1034.91, sharp; strong | 1066.21, 1035.05, sharp; strong | 1099.41, 1074.43, sharp; strong |
The ribavirin contents of R-RW, R-II and R-I, as determined by HPLC, were 98.7 ± 1.8, 99.1 ± 0.4 and 102.8 ± 0.5%, respectively, attesting to the high chemical purity/integrity of these samples. Furthermore, no additional peaks due to potential degradation products could be observed in the HPLC chromatograms of all ribavirin samples. Taking all the DSC, FTIR, PXRD and HPLC data together into consideration, it is apparent that the R-II and R-I samples are chemically and polymorphically pure, and can, therefore, be used as reference standards for subsequent quantitative analysis.
3.2. Construction of α–time curves by DSC at varying scanning speeds
For all DSC scans, including those of physical mixtures (R-II and R-I) and R-RW samples triturated for various time periods, recrystallization into form I was assumed to occur only between the onsets of melting of form II and form I. No polymorphic conversion below the melting point of form I was observable even at the lowest scanning speed used, i.e. 2 °C min−1, probably because of the presence of a high activation energy barrier against the solid–solid polymorphic conversion. Thus, the time allowed for the recrystallization, t, can be calculated from:
| (1) |
where β is the scanning speed and ΔT is the temperature difference between the onsets of first and second melting endotherms.
The ΔH f of the second peak (melting endotherm of form I) obtained at each scanning speed for all ribavirin samples was normalized by that of the reference R-I sample measured at the same scanning speed to yield the fraction of material recrystallized, α. It was observed that the ΔH f of the second melting endotherm increased with increasing time of trituration (Fig. 5 ). The α–time curves of polymorphic mixtures of ribavirin containing different weight percentages of R-I crystals are presented in Fig. 6 .
Fig. 5.
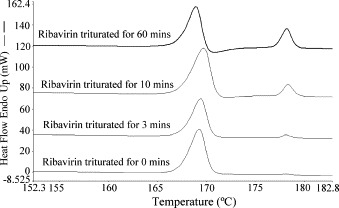
Effect of manual trituration on the DSC profiles of R-RW obtained at 10 K min−1.
Fig. 6.
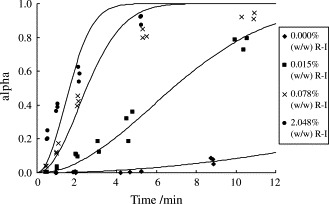
α–Time curves of polymorphic mixtures of ribavirin containing different weight percentages of R-I crystals.
3.3. Construction of a calibration curve from physical mixtures of the two pure polymorphs
The α–time curves of polymorphic mixtures (i.e. R-II mixed with varying weight percentages of R-I crystals) and the R-RW samples triturated manually or using the self-fabricated ball mill for different time periods were fitted to the Avrami equation (Michaelsen and Dahms, 1996). This model considers crystallization reactions to occur via a process of nucleation and growth:
| (2) |
where t is the crystallization time, α the fraction of recrystallized material, K the crystallization rate constant and n is the model exponent, typically an integer between 0 and 3, representing the dimensional order of the nucleation and growth process.
It should be noted that the Avrami equation differs from the Avrami-Erofe’ev equation only in the inclusion of an exponential term in the rate constant, i.e. K = k n, where k is the rate constant in the AE equation. Previous studies employing the AE model for polymorphic purity determination of salmeterol xinafoate showed that the exponent, n, can assume a value of 2, corresponding to the observed two-dimensional platelet morphology of the crystals (Tong et al., 2003). Similarly, for ribavirin that recrystallizes as platelets from melt, the data fitting could also be performed with the n value fixed at 2, as shown in Table 2, Table 3 . Good fit (as revealed by a high R 2) was observed for all the data except for the samples containing higher concentrations of the metastable form produced by the ball milling technique. The reason for the poor fit of data with the latter samples remains obscure, but may be due to a change in nucleation mechanism with milling time. As with salmeterol xinafoate, the recrystallization of ribavirin from melt could be assumed to follow the instantaneous nucleation model (Kashchiev, 2000), leading to the following derived equation (Tong et al., 2003):
| (3) |
where x is the weight fraction of metastable nuclei in the material matrix, and C 1 and C 2 are the constants related to the homogeneous and heterogeneous nucleation in melt, respectively, C 2 being typically much larger than C 1 (i.e. heterogeneous nucleation dominates). It has been shown that in the case of salmeterol xinafoate, Equation (3) holds with an R 2 of 0.967 (Tong et al., 2003). However, for ribavirin, the relationship is apparently not a linear function according to Equation (3) (Fig. 7 ). This highlights the complexity and potential limitations in making prior assumptions on the recrystallization kinetics of different melts analyzed by DSC. The apparent non-linearity would imply a change in two-dimensional crystallization kinetics for R-II samples mixed with increasing proportion of R-I crystals. The fundamental reasons for such variation are outside the scope of this work. To account for the observed non-linearity/kinetic changes, Equation (3) can be empirically modified by inclusion of an exponent, a, as follows:
| (4) |
Table 2.
Parameters of the α–time curves fitted by Avrami equation for different ribavirin polymorphic mixtures with n fixed at 2
| Percentage of ribavirin metastable form |
n Value fixed at 2 |
|
|---|---|---|
| K | R2 | |
| 0.000 | 0.001 (0.000) | 0.867 |
| 0.015 | 0.015 (0.001) | 0.973 |
| 0.038 | 0.034 (0.006) | 0.762 |
| 0.078 | 0.111 (0.016) | 0.951 |
| 0.505 | 0.121 (0.017) | 0.861 |
| 2.048 | 0.263 (0.049) | 0.745 |
Table 3.
Parameters of the α–time curves fitted by Avrami equation (with n fixed at 2) together with the estimated weight percentages of metastable polymorph generated in hand-triturated and ball-milled R-RW samples at different time intervals
| Time (min) | Manual trituration |
Ball milling |
||||
|---|---|---|---|---|---|---|
| K | R2 | % (w/w) | K | R2 | % (w/w) | |
| 0 | 0.003 (0.000) | 0.997 | 0.000 (0.000) | 0.003 (0.000) | 0.907 | 0.000 (0.000) |
| 1 | 0.019 (0.002) | 0.949 | 0.004 (0.001) | 0.005 (0.001) | 0.905 | 0.000 (0.000) |
| 3 | 0.027 (0.003) | 0.921 | 0.010 (0.001) | 0.012 (0.003) | 0.742 | 0.001 (0.000) |
| 6 | 0.038 (0.006) | 0.914 | 0.022 (0.004) | 0.018 (0.006) | 0.618 | 0.004 (0.002) |
| 10 | 0.060 (0.008) | 0.952 | 0.064 (0.011) | 0.041 (0.015) | 0.722 | 0.026 (0.011) |
| 20 | 0.146 (0.045) | 0.878 | 0.532 (0.196) | 0.067 (0.028) | 0.624 | 0.084 (0.042) |
| 30 | 0.178 (0.029) | 0.968 | 0.851 (0.164) | 0.058 (0.030) | 0.429 | 0.059 (0.037) |
| 40 | 0.235 (0.035) | 0.969 | 1.643 (0.296) | 0.151 (0.087) | 0.444 | 0.576 (0.400) |
| 50 | 0.304 (0.043) | 0.973 | 3.025 (0.516) | 0.158 (0.086) | 0.437 | 0.642 (0.420) |
Fig. 7.

Relationship between weight percentages of R-I (ribavirin metastable form) and crystallization rate constant, K, based on the Avrami's equation.
The calibration curve of best fit for ribavirin (R 2 = 0.935) was obtained with C 1 = 4.74 × 10⁻⁸, C 2 = 1.969 and a = 2.369.
3.4. Polymorphic impurity assessment using quantitative phase analysis
By constructing a calibration curve based on Equation (4), the quantity of ribavirin metastable form I nuclei (%, w/w) generated by grinding of the R-RW sample for various time periods can be quantified. Fig. 8 shows the effects of manual trituration and ball milling on the amount of metastable polymorph produced as a function of time. Both grinding techniques afforded an increased amount of metastable form with increasing grinding time. It can be seen from Table 3 that trace quantities of metastable phase of as low as 0.004% (w/w) generated in ribavirin (R-RW) samples by manual trituration and ball milling can be readily determined.
Fig. 8.
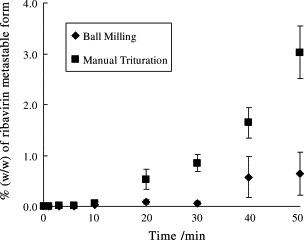
Effect of trituration on the amount of metastable nuclei generated in R-RW.
4. Conclusion
The thermoanalytical approach previously established for quantifying trace levels of polymorphic impurity in commercial salmeterol xinafoate samples has been successfully applied with slight modifications to the enantiotropic polymorphic pair of ribavirin in the present study. The modification involved the incorporation of an empirical exponent into the derived calibration equation (Equation (4)) to account for the observed composition-dependent changes in crystallization kinetics of the reference polymorph mixtures. Such modification has made possible the determination of as low as 0.004% (w/w) metastable polymorph in ribavirin form II samples induced by different forms of grinding treatment. Being relatively insensitive to the prior assumptions made on the crystallization kinetics of the materials studied, the modified approach may find wide application in the quality control of enantiotropically related drug polymorphs.
Acknowledgements
Financial support from the School of Pharmacy, the Chinese University of Hong Kong and from the Macao Polytechnic Institute (Project No. RP/ESS-1/2004 for HHYT) is gratefully acknowledged. Special thanks are also due to Prof. I.D. Williams, Hong Kong University of Science and Technology, for assistance with retrieving and simulating the crystal structure data of ribavirin.
References
- Allen F.H. The Cambridge Structural Database: a quarter of a million crystal structures and rising. Acta Cryst. 2002;B58:380–388. doi: 10.1107/s0108768102003890. [DOI] [PubMed] [Google Scholar]
- Bacon B.R. Managing hepatitis C. Am. J. Manage. Care. 2004;10:S30–S40. [PubMed] [Google Scholar]
- Bruno I.J., Cole J.C., Edgington P.R., Kessler M., Macrae C.F., McCabe P., Pearson J., Taylor R. New software for searching the Cambridge Structural Database and visualizing crystal structures. Acta Cryst. 2002;B58:389–397. doi: 10.1107/s0108768102003324. [DOI] [PubMed] [Google Scholar]
- Burger A., Ramberger R. On the polymorphism of pharmaceuticals and other molecular crystals. I. Theory of thermodynamic rules. Mikrochim. Acta. 1979;11:259–271. [Google Scholar]
- Burger A., Ramberger R. On the polymorphism of pharmaceuticals and other molecular crystals. II. Applicability of thermodynamic rules. Mikrochim. Acta. 1979;11:273–316. [Google Scholar]
- Chan J.P., Tong H.H.Y., Chow A.H.L. Stability of extemporaneous oral ribavirin liquid preparation. I.J.P.C. 2004;8:486–488. [PubMed] [Google Scholar]
- Dong Z.D., Munson E.J., Schroeder S.A., Prakash I., Grant D.J.W. Neotame anhydrate polymorphs. II. Quantitation and relative physical stability. Pharm. Res. 2002;19:1259–1264. doi: 10.1023/a:1020334305038. [DOI] [PubMed] [Google Scholar]
- Hon K.L., Leung C.W., Cheng W.T., Chan P.K., Chu W.C., Kwan Y.W., Li A.M., Fong N.C., Ng P.C., Chiu M.C., Li C.K., Tam J.S., Fok T.F. Clinical presentations and outcome of severe acute respiratory syndrome in children. Lancet. 2003;361:1701–1703. doi: 10.1016/S0140-6736(03)13364-8. [DOI] [PMC free article] [PubMed] [Google Scholar]
- Kashchiev D. Butterworth/Heinemann; Oxford: 2000. Nucleation: Basic Theory with Applications. [Google Scholar]
- Lee N., Hui D., Wu A., Chan P., Cameron P., Joynt G.M., Ahuja A., Yung M.Y., Leung C.B., To K.F., Lui S.F., Szeto C.C., Chung S., Sung J.J. A major outbreak of severe acute respiratory syndrome in Hong Kong. N. Engl. J. Med. 2003;348:1986–1994. doi: 10.1056/NEJMoa030685. [DOI] [PubMed] [Google Scholar]
- Michaelsen C., Dahms M. On the determination of nucleation and growth kinetics by calorimetry. Thermochim. Acta. 1996;288:9–27. [Google Scholar]
- Naoki M., Yoshizawa T., Fukushima N., Ogiso M., Yoshino M. A new phase of hydroquinone and its thermodynamic properties. J. Phys. Chem. B. 1999;103:6309–6313. [Google Scholar]
- Prusiner P., Sundaralingam M. A new class of synthetic nucleoside analogues with broad-spectrum antiviral properties. Nat. New Biol. 1973;244:116–117. doi: 10.1038/newbio244116a0. [DOI] [PubMed] [Google Scholar]
- Schmidt, A.C., Griesser, U.J., 2003. Crystal polymorphism of the ester local anaesthetic chloroprocaine hydrochloride. XVII. ÖPhG-Tagung, Graz, Austria, April 24–26, 2003. Sci. Pharm. 71, 89 (Abstract).
- Shah Y., Joshi S., Jindal K.C., Khanna S. Stability-indicating HPLC method for ribavirin and its pharmaceutical dosage forms. Drug Dev. Ind. Pharm. 1994;20:85–91. [Google Scholar]
- Tong H.H.Y., Shekunov B.Y., York P., Chow A.H.L. Thermal analysis of trace levels of polymorphic impurity in salmeterol xinafoate samples. Pharm. Res. 2003;20:1423–1429. doi: 10.1023/a:1025758127358. [DOI] [PubMed] [Google Scholar]
- Tsang K.W., Ho P.L., Ooi G.C., Yee W.K., Wang T., Chan-Yeung M., Lam W.K., Seto W.H., Yam L.Y., Cheung T.M., Wong P.C., Lam B., Ip M.S., Chan J., Yuen K.Y., Lai K.N. A cluster of cases of severe acute respiratory syndrome in Hong Kong. N. Engl. J. Med. 2003;348:1977–1985. doi: 10.1056/NEJMoa030666. [DOI] [PubMed] [Google Scholar]
- Witkowski J.T., Robins R.K., Sidwell R.W., Simon L.N. Design, synthesis, and broad spectrum antiviral activity of 1-beta-d-ribofuranosyl-1,2,4-triazole-3-carboxamide and related nucleosides. J. Med. Chem. 1972;15:1150–1154. doi: 10.1021/jm00281a014. [DOI] [PubMed] [Google Scholar]
- Yoshino M., Takahashi K., Okuda Y., Yoshizawa T., Fukushima N., Naoki M. Contribution of hydrogen bonds to equilibrium alpha beta transition of resorcinol. J. Phys. Chem. A. 1999;103:2775–2783. [Google Scholar]