

Abstract
Characterizing functional trait variation and covariation, and its drivers, is critical to understand the response of species to changing environmental conditions. Evolutionary and environmental factors determine how traits vary among and within species at multiple scales. However, disentangling their relative contribution is challenging and a comprehensive trait–environment framework addressing such questions is missing in lichens. We investigated the variation in nine traits related to photosynthetic performance, water use and nutrient acquisition applying phylogenetic comparative analyses in lichen epiphytic communities on beech across Europe. These poikilohydric organisms offer a valuable model owing to their inherent limitations to buffer contrasting environmental conditions. Photobiont type and growth form captured differences in certain physiological traits whose variation was largely determined by evolutionary processes (i.e. phylogenetic history), although the intraspecific component was non-negligible. Seasonal temperature fluctuations also had an impact on trait variation, while nitrogen content depended on photobiont type rather than nitrogen deposition. The inconsistency of trait covariation among and within species prevented establishing major resource use strategies in lichens. However, we did identify a general pattern related to the water-use strategy. Thus, to robustly unveil lichen responses under different climatic scenarios, it is necessary to incorporate both among and within-species trait variation and covariation.
Keywords: climate seasonality, functional trait variation, latitudinal gradient, epiphytic lichens, phylogenetic comparative analysis
1. Introduction
Understanding how functional traits vary along ecological gradients is crucial to disentangle the response of species to environmental drivers under the current global change context. Functional traits exhibit a range of values that vary among and within species and across environmental gradients [1], and potentially affect the performance of individuals [2]. The patterns of functional trait variation not only inform about the impact of environmental changes on communities [3], but are also useful for assessing the effect of community changes on ecosystem processes [4].
The variation of functional traits within species is constrained by genetic differentiation and phenotypic plasticity [5] reflecting the evolutionary history and the adaptation of species to environmental conditions [6]. Given the complexity of the sources of functional variation, it is important to adopt a pluralistic framework integrating the phylogenetic dimension of biodiversity and the trait-based approach (i.e. phylogenetic comparative analysis) [7]. Beyond the species level, some aspects of trait variation may differ at different scales such as family and population [8]. Thus, exploring the distribution of functional variation across scales would improve our understanding on the distinct responses of species under different environmental scenarios and the implications for ecosystem functioning [9]. Several studies have assessed the extent of functional variation among and within species, and the trait–environment relationships, mainly in vascular plants (e.g. [10,11]). However, an environment–trait framework addressing such questions is still missing in lichens, although they are placed within the most sensitive early warning indicators of environmental changes [12].
Plant ecologists have gone one step forward in the study of functional variation on the basis of the idea that functional traits covary [13]. Consistent patterns of covariation between functional traits are valuable tools to define general ecological strategies [2]. For instance, the pattern of covariation between leaf traits (e.g. leaf economic spectrum) has been related to rapid resource acquisition versus resource conservation strategies [10]. Thus, functional traits are useful proxies to identify ecological strategies in vascular plants [10,14], but the ecological link between traits and ecological strategies in other organisms such as epiphytic lichens remains almost unexplored. Lichens are useful organisms to address ecological questions about environmental changes, traits and ecosystem processes for two main reasons. First, lichen physiology (e.g. photosynthetic performance, water use and nutrient acquisition) strictly depends on the atmospheric conditions [15], because they lack mechanisms to regulate water and nutrient uptake and loss. Moreover, lichens are among the most nitrogen-sensitive organisms and nitrogen deposition profoundly affects their diversity [16]. Second, their life-history traits respond to environmental changes [17] and directly impact ecosystem functioning [18]. For example, they contribute to forest ecosystem processes including nutrient cycling, soil fertility, water regulation and purification, and primary production (see [18] for review; [19]).
Most studies reporting environmental impacts on lichens using a trait-based approach typically use ‘soft’ traits (sensu [20]) because they provide integrative information about many physiological functions and are easy to obtain. It is well recognized that certain lichen traits such as photobiont type and growth form may be used as indicators of environmental changes [21]. However, the link of these traits with specific functions is weak. Additionally, more information is needed about the variation of more mechanistic physiological traits (i.e. ‘hard’ traits) in a wide set of species under contrasting environments. There is some evidence that traits related to photosynthetic performance, water use and nutrient acquisition respond to environmental drivers. For instance, in certain species, environmental conditions determine the photosynthetic performance (e.g. chlorophyll content, degradation or fluorescence) [22], the specific thallus mass (STM, [23]), the water holding capacity (WHC, [24]) and the nutrient content [25]. Therefore, traits such as chlorophyll content, STM, WHC, nitrogen and carbon content, and isotopic ratios may provide valuable information to explore species responses to environmental changes and to identify general ecological strategies in lichens. For example, species with resource-conservative traits such as low nitrogen content, and high chlorophyll and STM (i.e. the equivalent to specific leaf area in vascular plants) may be favoured in stressful environments [26].
Here, we analysed the functional response of epiphytic lichens from beech forests (Fagus sylvatica L.) across its latitudinal distribution range in Europe covering a broad range of climatic conditions (i.e. temperature, precipitation and seasonality). We used a comparative approach integrating phylogenetic relatedness and a trait-based approach to decouple the effect of phylogeny and environment on lichen functional variation. First, we evaluated if ‘soft’ traits such as photobiont type and growth form capture the variation of nine ‘hard’ traits. Second, we assessed the relative contribution of order, species and population on trait variation to unravel the extent of inter- versus intraspecific variation in lichen traits after accounting for phylogenetic effects. Third, we analysed the response of each functional trait to different environmental drivers: climate and nitrogen deposition. Fourth, we calculated the covariation of functional traits along the gradient to unveil the existence of trade-offs between the studied traits and to evaluate to what extent this covariation is consistent among and within species.
We hypothesized that: (i) photobiont type and growth form indicate differences in ‘hard’ traits related to the photosynthetic performance, water-use strategy and nutrient acquisition; (ii) evolutionary and environmental drivers would determine functional variation of ‘hard’ traits with a more important contribution of inter- than intraspecific variability and with a key role of environment; (iii) under stressful environmental conditions, species with a conservative strategy will be favoured over those with an acquisitive strategy; and (iv) correlation of traits related to general ecological strategies will be similar among and within species.
2. Material and methods
(a). Collection sites and lichen sampling
The present study was carried out in 23 beech forests covering the whole latitudinal range of F. sylvatica in Europe (electronic supplementary material, figure S1). To reduce habitat differences, we selected mature and well-preserved forests at least 5 km away from each other, with a tree cover over 65%, and without tree cutting during the last 50 years. All forests harboured the lichen species Lobaria pulmonaria (L.) Hoffm. to ensure the survey of mature epiphytic communities in the same successional stage [27], thus minimizing the differences related to the community development. The latitudinal gradient represented a large climatic gradient with mean annual temperature ranging from 3.9 to 11.9°C and total annual precipitation ranging from 563 to 1644 mm (electronic supplementary material, table S1). By studying epiphytes on this single host species, we were able to: (i) control as much as possible the habitat differences not related with climate, and (ii) measure functional traits on individuals located at the extremes and at the core area of distribution of the host tree species.
Within each forest, we collected four thalli, whenever possible, of all macrolichen species found (i.e. large and conspicuous lichens) (electronic supplementary material, table S2). Samples were collected from beech trunks between June and September 2015 and 2016. After collection and before measurements, samples were air-dried, cleaned from debris and stored at −20°C [28]. Lichens were stored a maximum of two weeks between collection and storage in the freezer, and from one to three months from frozen storage until measurements.
(b). Functional traits measurement
We classified each species by two categorical functional traits: photobiont type and growth form (electronic supplementary material, table S3). We considered whether the lichens have cyanobacteria (cyanolichens, CY), chlorococcoid algae (chlorolichens, CHL) or both (tripartite lichens, TRI) as photobionts. We classified growth form in six categories (foliose broad-lobed, FB; foliose narrow-lobed, FN; fruticose dorsiventral, FRD; fruticose filamentous, FRF; mixed, MX; and squamulose, SQ) following Nimis & Martellos [29] with slight modifications (see the electronic supplementary material, table S3 for further details).
In addition, we measured nine quantitative functional traits in the sampled thalli (mean values in electronic supplementary material, table S3) related to photosynthetic performance (chlorophyll a (Chla), chlorophyll b (Chlb), and normalized phaeophytinization index, NPQI), water use (STM and WHC) and nutrient acquisition (%C and %N; carbon and nitrogen isotopic ratio, δ13C and δ15N). The number of measures varied depending on the species and functional trait considered (electronic supplementary material, table S4). Details of the protocols used for trait measurements are explained in the electronic supplementary material, Appendix S5.
(c). Phylogenetic analyses
We constructed a phylogenetic tree using four molecular markers (internal transcribed spacer region (nuITS), nuclear large subunit (nuLSU), mitochondrial small subunit (mtSSU) and largest subunit of the RNA polymerase II (RPB1)). For those species absent in GenBank, we generated the sequences following Prieto et al. [30] (23 newly produced sequences for 14 species, electronic supplementary material, table S6). For each molecular marker, we aligned the consensus sequences (MAFFT v. 7) and manually excluded the ambiguous regions and introns using MacClade v. 4.0.1. We analysed each individual gene region with a maximum likelihood (ML) approach implemented in RAxML v. 8.2.10 using a GTRGAMMA model of evolution and 1000 bootstrap replicates. Because we did not find supported nodes in conflict, we combined the individual gene regions and ran a combined ML analysis. The RAxML analysis was run with five distinct partitions (nuITS, nuLSU, mtSSU, first and second codon positions of RPB1 and the third codon position of the RPB1) and the same settings as the individual gene analyses. All analyses were run on the CIPRES Science Gateway v. 3.1.
(d). Environmental drivers: climate and nitrogen deposition
Climatic variables for each forest were obtained from the high-resolution climate dataset CHELSA [31] including 19 bioclimatic variables related to temperature and precipitation. Climatic drivers were summarized using principal components analysis (PCA), with data standardized and using a varimax rotation. We obtained four summary gradients of climatic data that were used as explanatory variables in data analyses. These four PCA axes accounted for 92% of the variance and reflected gradients in temperature and temperature seasonality (33% of explained variance), precipitation (25%), precipitation seasonality (20%) and mean diurnal range and isothermality (14%) (electronic supplementary material, table S7).
Nitrogen deposition estimates at the study sites were obtained from the Meteorological Synthesizing Centre-West (MSC-W) of the European Monitoring and Evaluation Programme (EMEP) model [32]. We used the estimations of nitrogen deposition for deciduous forests during 2017 with a resolution of 0.1° × 0.1° longitude–latitude (http://thredds.met.no/thredds/ncss/data/EMEP/2018_Reporting/EMEP01_L20EC_rv4_17a_year.2017met_2016emis.nc/dataset.html, electronic supplementary material, table S1). Total nitrogen deposition was calculated as the sum of dry and wet total deposition of oxidized nitrogen and total deposition of reduced nitrogen.
(e). Data analyses
We used R v. 3.4.0 (R Core Team, 2018) for data analyses and, when necessary, variables were transformed to meet normality (see figure captions). Because not all species found along the gradient were present in the 23 forests surveyed, we selected for analyses the 52 species present in at least three forests (1486 thalli belonging to three taxonomic orders with 5–80 thalli sampled per species) (electronic supplementary material, table S2).
(i). ‘Hard’ trait variation within functional groups
We assessed the trait differences between species with different photobiont types and growth forms using phylogenetic generalized least-squares linear models (PGLS), given the high phylogenetic signal obtained for the studied functional traits (Pagel's Lambda (λ) close to 1, electronic supplementary material, table S8). We controlled the lack of independence of species with shared ancestry and optimized the branch length using ML to find the best value of lambda transformation [33]. We performed the PGLS linear models using the function pgls in the caper package. When significant differences were observed, we performed pairwise comparisons to unveil differences between groups. We calculated the phylogenetic signal for the quantitative traits with λ using the phylosig function in phytools package. To account for confounding effects between photobiont types and growth forms, we conducted variance partitioning analyses (further details in the electronic supplementary material, figure S2).
(ii). Trait variation and variance decomposition
We quantified the variation of each functional trait using the quartile coefficient of dispersion (QDC) calculated as the ratio between half the interquartile range ((Q3 − Q1)/2) and the average of the quartiles ((Q1 + Q3)/2) (electronic supplementary material, table S9). To assess the level at which trait variation occurs, we conducted a variance component analysis for each trait calculating their variance partitioning across order, species and population with the lme function in the nlme package. We used linear mixed-effects models with a fixed intercept and nested scales as random factors and we compared the magnitude of the random effects variance parameters across orders, species, populations (i.e. all thalli of a given species collected in different forests) and within populations or residual (i.e. the variance among thalli collected in the same population).
(iii). Trait variation in response to climate and nitrogen deposition
We examined the patterns of variation of each ‘hard’ functional trait across climatic (PCA axes, electronic supplementary material, table S7) and nitrogen deposition gradients while accounting for the phylogenetic covariances among species [34]. We fitted phylogenetic generalized linear mixed models (PGLMM) including species (1|sp), forest (1|site), phylogenetic covariance (1|sp__) and phylogenetic attraction (1|sp__@site) as random factors on the intercept [34]. The phylogenetic attraction describes that phylogenetically related species are more likely to occur in the same sites. Before fitting the models, we checked potential multicollinearity among independent variables using variance inflation factors [35]. PGLMMs were fitted using the communityPGLMM function in the phyr package (https://github.com/daijiang/phyr), with Gaussian family as error distribution for modelling and a likelihood-ratio test to assess the significance of fixed effects.
(iv). Trait covariation
We calculated Pearson correlation coefficients accounting for phylogenetic relatedness with restricted maximum likelihood for model fitting using the function corphylo in the ape package. We followed the method of Zheng et al. [36], which assumes Ornstein–Uhlenbeck processes for trait evolution and allows the specification of trait measurement errors. We also performed Pearson correlations within species for each of the 16 most common species, sampled in at least 10 forests (rcorr function in the Hmisc package).
3. Results
(a). ‘Hard’ trait variation within functional groups
Phylogenetically controlled tests showed that the photobiont type and growth form were associated with differences in six of the nine quantitative traits (figure 1). Regarding the photobiont type, cyanolichens had the highest level of %N followed by tripartite and then chlorolichens. Further, cyano- and chlorolichens had higher δ13C than tripartite lichens, while cyano- and tripartite lichens showed higher δ15N than chlorolichens. In relation to growth form, we found significant differences in Chla, Chlb, δ15N and WHC. Foliose broad-lobed and mixed lichens had the highest levels of Chla and Chlb. For δ15N, fruticose lichens (dorsiventral and filamentous) had the lowest level of δ15N. Finally, foliose narrow-lobed and broad-lobed had the highest and lowest WHC, respectively, while fruticose lichens (dorsiventral and filamentous) had intermediate WHC.
Figure 1.

Differences of the functional trait values for different photobiont types (black squares) and growth forms (white squares). Squares represent the mean (± s.e.) derived from fitted phylogenetic least-squares (PGLS). Different letter(s) above the error bars denote significant differences of mean functional trait values between photobiont types or among growth forms accounting for the phylogeny. WHC was loge-transformed to meet normality. Sample size (number of species): cyanolichens (CY) = 15, tripartite lichens (TRI) = 2, chlorolichens (CHL) = 35, foliose broad-lobed (FB) = 23, foliose narrow-lobed (FN) = 11; fruticose dorsiventral (FRD) = 6, fruticose filamentous (FRF) = 6, mixed (MX) = 4 and squamulose (SQ) = 2. Traits: Chla, chlorophyll a content; Chlb, chlorophyll b content; WHC, water holding capacity; %N, nitrogen thallus content; δ13C, carbon isotopic ratio; δ15N, nitrogen isotopic ratio.
(b). Trait variation and variance decomposition
The total amount of variation (figure 2a) and the scales at which such variation occurs (figure 2b) differed among the studied traits. In all cases, excepting Chla and %C, order and species levels (interspecific variation) explained most of the variance. For six out of nine traits, variation among species (i.e. order + species) ranged from 71.5% in NPQI to 79.1% in %N, while variation within species (i.e. population + residual) ranged from 20.9% to 28.5% (figure 2b). In general, most trait variation occurred at the order level (figure 2b) in the most variable traits (%N and δ15N; figure 2a), while the species level was the largest contributor to overall variation for Chlb, NPQI, STM, WHC and δ13C (figure 2b).
Figure 2.

(a) Quartile coefficient of dispersion (QDC) and (b) variance partitioning across different scales for each functional trait. Trait variation explained by the order and species to which a thallus belongs is labelled as ‘order’ and ‘species’. ‘Population’ reflects the trait variation found among all thalli of a given species collected in different forests. ‘Residual’ indicates the variance among thalli collected in the same population. Chla and Chlb were sqrt-transformed, while STM, WHC and %N were loge-transformed to meet normality. Abbreviations: Chla, chlorophyll a content; Chlb, chlorophyll b content; NPQI, normalized phaeophytinization index; STM, specific thallus mass; WHC, water holding capacity; %C, carbon thallus content; %N, nitrogen thallus content; δ13C, carbon isotopic ratio; δ15N, nitrogen isotopic ratio. (Online version in colour.)
Chla and %C showed an opposite pattern, with intraspecific variability accounting for 63.0% and 82.9% of total variation, respectively (figure 2b). For Chlb, variation was approximately equally distributed within (43.8%) and among species (56.2%) (figure 2b).
(c). Trait variation in response to climate and nitrogen deposition
We found significant effects of climate and nitrogen deposition on most functional traits. However, the relationships found were weak (figure 3; electronic supplementary material, table S10). Gradients in temperature fluctuation affected traits related with photosynthetic performance (i.e. Chla, Chlb), water use (i.e. STM, WHC) and nutrient uptake (i.e. %N, δ15N). Thus, lichens with lower Chla, Chlb, %N and δ15N; and with higher STM and WHC were associated with forests with high mean diurnal range and isothermality (figure 3). Further, increases in temperature and decreases in temperature seasonality increased δ13C, while increases in precipitation seasonality reduced %C and increased δ15N (figure 3). Regarding the nitrogen deposition, we found a negative effect on traits related to water use and nutrient uptake: lichens located in forests with high nitrogen deposition had low STM and δ13C (figure 3).
Figure 3.

Response of lichen functional traits to climate and nitrogen deposition. Lines represent predicted regression lines of significant relationships (p < 0.05) between functional traits and climatic PCA axes and nitrogen deposition based on PGLMMs (electronic supplementary material, table S10). Temperature fluctuation reflects a gradient in mean diurnal range and isothermality (PCA axis RC3; electronic supplementary material, table S7). Temperature and temperature seasonality refer to warmer and less seasonal temperatures (PCA axis RC1; electronic supplementary material, table S7). Points illustrate raw data. Chla and Chlb were sqrt-transformed, while STM, WHC, %N and nitrogen deposition were loge-transformed to meet normality. Abbreviations follow figure 2. (Online version in colour.)
(d). Trait covariation
We found different patterns of trait correlation when the 52 species were analysed together and when species were considered separately, implying that trait covariation differed among and within species (figure 4; electronic supplementary material, figure S3). Only the positive correlations STM–WHC and Chla–Chlb were consistent at both levels (i.e. among and within species; figure 4; electronic supplementary material, figure S3).
Figure 4.
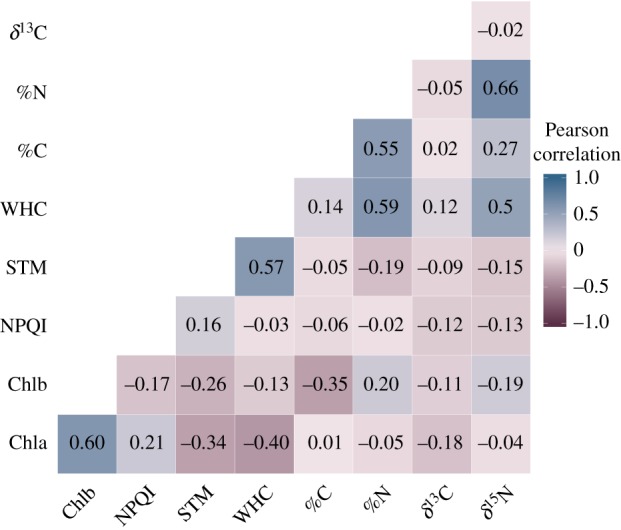
Trait correlation heat map for all the species (n = 52 for all traits except Chlb, n = 37, and STM and WHC, n = 44) accounting for phylogenetic relatedness. Numbers represent pairwise Pearson correlation between traits. STM and WHC were loge-transformed to meet normality. Abbreviations follow figure 2. (Online version in colour.)
4. Discussion
In this study, we investigated the variation of nine functional traits of 52 epiphytic macrolichen species along an environmental gradient throughout Europe. After controlling for the dependence of the species because of shared ancestry, we found that ‘soft’ traits broadly used to characterize lichen functional groups (i.e. photobiont type and growth form) were associated with differences of certain ‘hard’ traits related to photosynthetic performance, water use and nutrient acquisition. According to our initial hypothesis, functional variation was distributed across scales, with order and species having the highest contribution to the overall variation. Although functional variation was higher among than within species, intraspecific variability (particularly within populations) substantially contributed to overall trait variation, and in some cases became dominant (particularly for %C). Temperature fluctuations and nitrogen deposition influenced trait variation along the gradient, and responses to these drivers were trait specific, although the contribution of environmental variables on functional variation was generally low. Based on the patterns of trait covariation, we identified positive correlations related to photosynthetic performance (Chla–Chlb) and to water-use strategies (STM–WHC) that were consistent among and within species. These results provide a step forward on the understanding of functional traits in epiphytic macrolichens and contribute to the foundation of a trait–environment framework for these organisms (figure 5).
Figure 5.

Summary of the main results for the four proposed hypotheses. (a) ‘Soft’ functional traits (photobiont type and growth form) capture the variation of %N, δ15N, δ13C, Chl and WHC (circle area). (b) Circle area is proportional to the amount of trait variation and colours denote the contribution of different drivers to the overall variation accounted for each trait. (c) Effect of climate and nitrogen deposition on trait variation. (d) The positive covariation related to water-use strategies between STM and WHC was consistent among and within species. Abbreviations follow figure 2. (Online version in colour.)
(a). ‘Soft’ traits captured the variation of certain ‘hard’ physiological traits in epiphytic lichens
Interestingly, ‘soft’ traits captured the variation of certain, but not all, ‘hard’ physiological traits, with photobiont type mainly related to nutrient acquisition traits and growth form also informing about water use and photosynthetic performance. Thus, mean values of %N, δ15N and δ13C differed with photobiont type, while Chla, Chlb, δ15N and WHC varied according to growth form, and these associations were not the result of phylogenetic relatedness. Previous studies have identified photobiont type and growth form as easily notable traits with effects on nitrogen-fixation, and lichen nutrient and water status (e.g. [19,37,38]).
Lichens passively acquire nitrogen, and other mineral nutrients, from wet or dry deposition excepting those species with cyanobacteria that also fix atmospheric nitrogen [39]. As found by Palmqvist et al. [37] in 75 lichen species from different biomes, cyano- and chlorolichens had the highest and the lowest nitrogen content, whereas tripartite lichens with green algae and cyanobacteria in cephalodia had intermediate nitrogen content, respectively. According to their different nitrogen metabolisms, with chlorolichens being limited in nitrogen supply, the lowest δ15N found in this group may reflect a higher ammonium uptake capacity likely to compensate for the lack of N2-fixation [40]. The efficiency of lichens at absorbing nutrients from atmospheric sources also depended on the growth form, and may be related to differences in the thallus surface–volume ratio [41]. As such, we found that fruticose lichens exhibited the lowest δ15N, probably owing to this high ratio that provides a high number of cation exchange sites, which help to take up high amounts of ammonium from the atmosphere [40,42]. In relation to carbon acquisition, less negative values of δ13C in cyano- and chlorolichens may reflect the presence of carbon-concentrating mechanisms, in contrast to tripartite lichens in which the mechanism of CO2 supply to the carboxilating system is entirely by diffusion [43].
Concerning growth form, apart from the lichen interception of elements from the atmosphere (as seen above), the morphology of the lichen thallus controlled the chlorophyll content and the WHC. First, foliose broad-lobed and mixed lichens had the highest levels of chlorophyll (a and b), which might reflect higher photosynthetic demands in these groups. Second, the WHC varied depending on thallus morphological constraints, probably reflecting the time needed to become hydrated and, consequently, physiologically active [38,44].
(b). Most functional trait variation occurred between orders and species
Our findings, together with previous studies on vascular plants [8], suggest that trait variation drivers act at different levels. As Coyle [45] found in temperate oak deciduous forests in North America, we also found high trait variation within taxa and a relatively low contribution of environmental conditions. In general, most trait variation occurred at order and species level (i.e. interspecific variation), which points out a strong phylogenetic control shaping the variation of the studied traits. On the contrary, we found that thalli of a given species collected in different forests along the gradient (i.e. population level) or collected in the same population (i.e. residual level) showed more similar trait values. This result suggests that the environmental conditions, or other factors such as genetic differences within species, had a lower contribution with respect to the other levels taken into account, at least in the studied deciduous temperate beech forests.
Regarding the traits showing this general pattern, %N and δ15N variation mostly occurred among orders. In line with Vidal-Russell & Messuti [46], who found that having cyanobacteria as the main photobiont has a strong phylogenetic signal, our results reflect the high conservatism of the photobiont partner within the three studied orders. Caliciales and Lecanorales had green algae versus Peltigerales with nitrogen-fixation by cyanobacteria apart from the general nitrogen inflow from deposition [47]. Conversely, variation in Chlb, NPQI, STM, WHC and δ13C was mainly observed at the species level, suggesting that the species-level quantification becomes necessary in these traits.
Moving forward from this general pattern with interspecific variation (i.e. order and species level) greatly contributing to trait variation in epiphytic macrolichens, we found that intraspecific variation (i.e. population and residual levels), also accounted for a substantial and variable amount of trait variation for some traits, mainly chlorophyll content and %C. For these two traits, we found higher trait variation within than among populations, suggesting that they may respond strongly to within-site environmental conditions. Consequently, our results support the general assumption that functional variation is higher among than within species, but also highlight the need to include the intraspecific variability as an important component of functional trait variation in macrolichens [11,19].
(c). Functional trait variation along environmental gradients responded to climate and nitrogen deposition
Even though traits responded weakly to the environmental variables studied, most of the traits were affected by climate, and two of them also responded to nitrogen deposition. Several traits were sensitive to variables characterizing climatic fluctuations, particularly in temperature, which may determine the conditions when the lichens activate. Our findings are consistent with Ellis et al. [48], who found that temperature and seasonality were the main predictors of photobiont type, growth form and size in epiphytic lichens. Thus, mean diurnal range and isothermality affected chlorophyll content, water-use traits, %N and δ15N. Lichens with lower Chla, Chlb, %N and δ15N; and with higher STM and WHC were associated with beech forests with high mean diurnal range and isothermality. These seasonal climatic effects may determine lichen physiological processes such as photosynthesis [49] or nitrogen-fixation [50]. Because the variation in the metabolic capacity can be attributed to differences in chlorophyll content [51], the decrease in chlorophyll probably results in a lower capacity for energy capture coupled to a lower energy consumption and lower respiration, which may explain the increase of STM. In this line, high climatic fluctuations may be related to longer periods in which lichens remain metabolically inactive and adopt a resource-conservative strategy leading to a reduction of photosynthetic capacity (i.e. chlorophyll content) and, consequently, of net carbon gain [52]. Several studies also support the latter idea and our results (i.e. temperature positively related to δ13C), not only in epiphytic but also in saxicolous lichens and biocrusts [53,54], where high temperatures increased δ13C because of higher respiration rates that led to a decrease of net carbon gain [37]. As pointed out before, lichen trait variation responded in a lesser extent to precipitation than to temperature. However, the lower %C with increasing precipitation seasonality, may also reflect a reduction of net carbon gain.
Regarding the nitrogen deposition, we found that lichens located in forests with high nitrogen deposition had low STM and δ13C, which reflects the growth-limiting effects of high nitrogen loads. From our point of view, the most important conclusions come from the fact that nitrogen deposition was not affecting %N. This suggests that variation in thallus nitrogen content is mainly determined by the photobiont type involved in the lichen symbiosis and its nitrogen-fixation ability rather than by the amount of nitrogen available in the atmosphere.
(d). Patterns of trait covariation differed among and within species
According to our initial hypothesis, lichen functional traits covaried, but the patterns of covariation differed among and within species, as shown in vascular plants [55], apart from the consistent positive correlations observed between STM–WHC and Chla–Chlb. On the one hand, we identified a consistent trade-off related to water-use strategies, confirming that lichens with thicker thallus tend to hold more water per unit area, both among and within species [38,56], implying a trade-off between rapid moisture uptake (low STM and WHC) and conservative water storage strategy (high STM and WHC) [19]. On the other hand, we consistently found that thalli with high Chla content also showed high Chlb, both among and within species. This correlation could be pointing to an adaptation of lichens growing within shady beech forests in which lichens optimize light harvesting under low irradiances [49].
Thus, although we identified a consistent trade-off related to water-use strategies, we found no evidence of strong and consistent trait covariation defining overall resource use strategies in relation to photosynthetic performance and nutrient acquisition. Further research including a wider set of functional traits and species from other environments, and integrating among and within-species trait comparisons, is needed to show the extent to which trait covariation can be used to identify major resource use strategies in lichens, as observed in vascular plants [10,14].
Supplementary Material
Acknowledgements
We thank Manuel Rojo, Mónica Ibáñez, Mercedes Vivas, Rebeca Vicente, Celia Molina, Laura Jiménez, Natalia Álvarez and Jonatan Jiménez for assistance with trait measurements; Simone Mayrhofer, Wilfried Franz and Nieves Carmona for assistance during fieldwork; Mark Theobald for his help with nitrogen deposition data; Talita Amado and Anthony Ives for useful comments on data analyses; Concepción Cano for algae illustrations; and Silvia Matesanz, Greta Vega, Clara Álvarez, Clara Rodríguez-Arribas and Adrián Escudero for valuable comments on the manuscript.
Data accessibility
Data is available in the electronic supplementary material and Figshare http://dx.doi.org/10.6084/m9.figshare.11341760. https://figshare.com/articles/Data_from_DISENTANGLING_FUNCTIONAL_TRAIT_VARIATION_AND_COVARIATION_IN_EPIPHYTIC_LICHENS_ALONG_A_CONTINENTWIDE_LATITUDINAL_GRADIENT_/11341760.
Authors' contributions
I.M., M.P., G.A. and P.H. conceived the study; P.H., M.P., I.M., G.A., P.G., R.B., E.B., J.N., A.K., H.M., S.M. and E.M.D.-P. collected the data; P.H., J.L.-A., J.M.-V. and T.R. analysed the data; P.H. led the writing of the manuscript. All authors contributed critically to the drafts and gave final approval for publication.
Competing interests
We declare we have no competing interests
Funding
This work was supported by Ministerio de Economía y Competitividad (grant nos ECOMETAS GL2014-53840-REDT, EPIDIVERSITY CGL2013-47010-P, NOTHODIVERSITY CGL2016-80562-P) and REMEDINAL TE-CM (grant no. S2018/EMT-4338).
References
- 1.Violle C, Navas ML, Vile D, Kazakou E, Fortunel C, Hummel I, Garnier E. 2007. Let the concept of trait be functional! Oikos 116, 882–892. ( 10.1111/j.0030-1299.2007.15559.x) [DOI] [Google Scholar]
- 2.Reich PB, Wright IJ, Cavender-Bares J, Craine JM, Oleksyn J, Westoby M, Walters MB. 2003. The evolution of plant functional variation: traits, spectra, and strategies. Int. J. Plant Sci. 164, S143–S164. ( 10.1086/374368) [DOI] [Google Scholar]
- 3.Webb CT, Hoeting JA, Ames GM, Pyne MI, LeRoy Poff N. 2010. A structured and dynamic framework to advance traits-based theory and prediction in ecology. Ecol. Lett. 13, 267–283. ( 10.1111/j.1461-0248.2010.01444.x) [DOI] [PubMed] [Google Scholar]
- 4.de Bello F, et al. 2010. Towards an assessment of multiple ecosystem processes and services via functional traits. Biodivers. Conserv. 19, 2873–2893. ( 10.1007/s10531-010-9850-9) [DOI] [Google Scholar]
- 5.Albert CH, Thuiller W, Yoccoz NG, Soudant A, Boucher F, Saccone P, Lavorel S. 2010. Intraspecific functional variability: extent, structure and sources of variation. J. Ecol. 98, 604–613. ( 10.1111/j.1365-2745.2010.01651.x) [DOI] [Google Scholar]
- 6.Díaz S, Cabido M. 2001. Vive la difference: plant functional diversity matters to ecosystem processes. Trends Ecol. Evol. 16, 646–655. ( 10.1016/S0169-5347(01)02283-2) [DOI] [Google Scholar]
- 7.Felsenstein J. 1985. Phylogenies and the comparative method. Am. Nat. 125, 1–15. ( 10.1086/284325) [DOI] [Google Scholar]
- 8.Messier J, McGill BJ, Lechowicz MJ. 2010. How do traits vary across ecological scales? A case for trait-based ecology. Ecol. Lett. 13, 838–848. ( 10.1111/j.1461-0248.2010.01476.x) [DOI] [PubMed] [Google Scholar]
- 9.Violle C, Reich PB, Pacala SW, Enquist BJ, Kattge J. 2014. The emergence and promise of functional biogeography. Proc. Natl Acad. Sci. USA 111, 13 690–13 696. ( 10.1073/pnas.1415442111) [DOI] [PMC free article] [PubMed] [Google Scholar]
- 10.Wright IJ. et al. 2004. The worldwide leaf economics spectrum. Nature 428, 821–827. ( 10.1038/nature02403) [DOI] [PubMed] [Google Scholar]
- 11.Albert CH, Thuiller W, Yoccoz NG, Douzet R, Aubert S, Lavorel S. 2010. A multi-trait approach reveals the structure and the relative importance of intra- vs. interspecific variability in plant traits. Funct. Ecol. 24, 1192–1201. ( 10.1111/j.1365-2435.2010.01727.x) [DOI] [Google Scholar]
- 12.Matos P, Pinho P, Aragón G, Martínez I, Nunes A, Soares AMVM, Branquinho C. 2015. Lichen traits responding to aridity. J. Ecol. 103, 451–458. ( 10.1111/1365-2745.12364) [DOI] [Google Scholar]
- 13.Grime JP, et al. 1997. Integrated screening validates primary axes of specialisation in plants. Oikos 79, 259–281. ( 10.2307/3546011) [DOI] [Google Scholar]
- 14.Díaz S, et al. 2016. The global spectrum of plant form and function. Nature 529, 167–171. ( 10.1038/nature16489) [DOI] [PubMed] [Google Scholar]
- 15.Nimis PL, Scheidegger C, Wolseley PA. 2002. Monitoring with lichens – monitoring lichens. NATO Advanced Science Series Earth and Envir. Ser.7; Dordrect, the Netherlands: Kluwer Academic Publishers. [Google Scholar]
- 16.Bobbink R, et al. 2010. Global assessment of nitrogen deposition effects on terrestrial plant diversity: a synthesis. Ecol. Appl. 20, 30–59. ( 10.1890/08-1140.1) [DOI] [PubMed] [Google Scholar]
- 17.Hurtado P, Prieto M, Aragón G, Escudero A, Martínez I. 2019. Critical predictors of functional, phylogenetic, and taxonomic diversity are geographically structured in lichen epiphytic communities. J. Ecol. 107, 2303–2316. ( 10.1111/1365-2745.13189) [DOI] [Google Scholar]
- 18.Ellis CJ. 2012. Lichen epiphyte diversity: a species, community and trait-based review. Perspect. Plant Ecol. Evol. Syst. 14, 131–152. ( 10.1016/j.ppees.2011.10.001) [DOI] [Google Scholar]
- 19.Asplund J, Wardle DA. 2016. How lichens impact on terrestrial community and ecosystem properties. Biol. Rev. 92, 1720–1738. ( 10.1111/brv.12305) [DOI] [PubMed] [Google Scholar]
- 20.Belluau M, Shipley B. 2018. Linking hard and soft traits: physiology, morphology and anatomy interact to determine habitat affinities to soil water availability in herbaceous dicots. PLoS ONE 13, 1–15. ( 10.1371/journal.pone.0193130) [DOI] [PMC free article] [PubMed] [Google Scholar]
- 21.Giordani P, Brunialti G, Bacaro G, Nascimbene J. 2012. Functional traits of epiphytic lichens as potential indicators of environmental conditions in forest ecosystems. Ecol. Indic. 18, 413–420. ( 10.1016/j.ecolind.2011.12.006) [DOI] [Google Scholar]
- 22.Gauslaa Y, Lie M, Solhaug KA, Ohlson M. 2006. Growth and ecophysiological acclimation of the foliose lichen Lobaria pulmonaria in forests with contrasting light climates. Oecologia 147, 406–416. ( 10.1007/s00442-005-0283-1) [DOI] [PubMed] [Google Scholar]
- 23.Asplund J, Sandling A, Wardle DA. 2012. Lichen specific thallus mass and secondary compounds change across a retrogressive fire-driven chronosequence. PLoS ONE 7, e49081 ( 10.1371/journal.pone.0049081) [DOI] [PMC free article] [PubMed] [Google Scholar]
- 24.Pérez-Ortega S, Fernández-Mendoza F, Raggio J, Vivas M, Ascaso C, Sancho LG, Printzen C, de Los Ríos A. 2012. Extreme phenotypic variation in Cetraria aculeata (lichenized Ascomycota): adaptation or incidental modification? Ann. Bot. 109, 1133–1148. ( 10.1093/aob/mcs042) [DOI] [PMC free article] [PubMed] [Google Scholar]
- 25.Cornelissen JHC, Lang SI, Soudzilovskaia NA, During HJ. 2007. Comparative cryptogam ecology: a review of bryophyte and lichen traits that drive biogeochemistry. Ann. Bot. 99, 987–1001. ( 10.1093/aob/mcm030) [DOI] [PMC free article] [PubMed] [Google Scholar]
- 26.Adler PB, Fajardo A, Kleinhesselink AR, Kraft NJB. 2013. Trait-based tests of coexistence mechanisms. Ecol. Lett. 16, 1294–1306. ( 10.1111/ele.12157) [DOI] [PubMed] [Google Scholar]
- 27.Rose F. 1988. Phytogeographical and ecological aspects of Lobarion communities in Europe. Bot. J. Linn. Soc. 96, 69–79. ( 10.1111/j.1095-8339.1988.tb00628.x) [DOI] [Google Scholar]
- 28.Honegger R. 2003. The impact of different long-term storage conditions on the viability of lichen-forming ascomycetes and their green algal photobiont, Trebouxia spp. Plant Biol. 5, 324–330. ( 10.1055/s-2003-40794) [DOI] [Google Scholar]
- 29.Nimis PL, Martellos S. 2017. ITALIC - the information system on Italian lichens. Version 5.0 University of Trieste, Dept. of Biology; See http://dryades.units.it/italic. [Google Scholar]
- 30.Prieto M, Baloch E, Tehler A, Wedin M. 2013. Mazaedium evolution in the Ascomycota (Fungi) and the classification of mazaediate groups of formerly unclear relationship. Cladistics 29, 296–308. ( 10.1111/j.1096-0031.2012.00429.x) [DOI] [PubMed] [Google Scholar]
- 31.Karger DN, Conrad O, Böhner J, Kawohl T, Kreft H, Soria-Auza RW, Zimmermann NE, Linder HP, Kessler M. 2017. Climatologies at high resolution for the earth's land surface areas. Sci. Data 4, 1–20. ( 10.1038/sdata.2017.122) [DOI] [PMC free article] [PubMed] [Google Scholar]
- 32.Simpson D, Benedictow A, Berge H, Bergström R, Emberson LD, Fagerli H, Flechard CR, Hayman GD, Gauss M. 2012. The EMEP MSC-W chemical transport model – technical description. Atmos. Chem. Phys. 12, 7825–7865. ( 10.5194/acp-12-7825-2012) [DOI] [Google Scholar]
- 33.Freckleton RP, Harvey PH, Pagel MD. 2002. Phylogenetic analysis and comparative data: a test and review of evidence. Am. Nat. 160, 712–726. ( 10.1086/343873) [DOI] [PubMed] [Google Scholar]
- 34.Ives AR. 2018. Mixed and phylogenetic models: a conceptual introduction to correlated data. See https://leanpub.com/correlateddata. [Google Scholar]
- 35.Fox J. 2015. Applied regression analysis and generalized linear models. Thousand Oaks, CA: Sage Publications, Inc. [Google Scholar]
- 36.Zheng L, Ives AR, Garland T, Larget BR, Yu Y, Cao KF. 2009. New multivariate tests for phylogenetic signal and trait correlations applied to ecophysiological phenotypes of nine Manglietia species. Funct. Ecol. 23, 1059–1069. ( 10.1111/j.1365-2435.2009.01596.x) [DOI] [Google Scholar]
- 37.Palmqvist K, Dahlman L, Valladares F, Tehler A, Sancho LG, Mattsson J. 2002. CO2 exchange and thallus nitrogen across 75 contrasting lichen associations from different climate zones. Oecologia 133, 295–306. ( 10.1007/s00442-002-1019-0) [DOI] [PubMed] [Google Scholar]
- 38.Gauslaa Y. 2014. Rain, dew, and humid air as drivers of morphology, function and spatial distribution in epiphytic lichens. Lichenologist 46, 1–16. ( 10.1017/S0024282913000753) [DOI] [Google Scholar]
- 39.Nash TH., III 1996. Nutrients, elemental accumulation and mineral cycling. In Lichen biology (ed. Nash TH., III), pp. 136–153. Cambridge, UK: Cambridge University Press. [Google Scholar]
- 40.Hauck M. 2010. Ammonium and nitrate tolerance in lichens. Environ. Pollut. 158, 1127–1133. ( 10.1016/j.envpol.2009.12.036) [DOI] [PubMed] [Google Scholar]
- 41.Johansson O, Olofsson J, Giesler R, Palmqvist K. 2011. Lichen responses to nitrogen and phosphorus additions can be explained by the different symbiont responses. New Phytol. 191, 795–805. ( 10.1111/j.1469-8137.2011.03739.x) [DOI] [PubMed] [Google Scholar]
- 42.Branquinho C. 2001. Lichens. In Metals in the environment: analysis by biodiversity (ed. Prasad MNV.), pp. 117–158. New York, NY: Marcel Dekker Inc. [Google Scholar]
- 43.Máguas C, Griffiths H, Broadmeadow MSJ. 1995. Gas exchange and carbon isotope discrimination in lichens: evidence for interactions between CO2-concentrating mechanisms and diffusion limitation. Planta 196, 95–102. ( 10.1007/BF00193222) [DOI] [Google Scholar]
- 44.Phinney NH, Solhaug KA, Gauslaa Y. 2018. Rapid resurrection of chlorolichens in humid air: specific thallus mass drives rehydration and reactivation kinetics. Environ. Exp. Bot. 148, 184–191. ( 10.1016/j.envexpbot.2018.01.009) [DOI] [Google Scholar]
- 45.Coyle JR. 2016. Intraspecific variation in epiphyte functional traits reveals limited effects of microclimate on community assembly in temperate deciduous oak canopies. Oikos 126, 111–120. ( 10.1111/oik.03239) [DOI] [Google Scholar]
- 46.Vidal-Russell R, Messuti MI. 2017. Phylogenetic signal of photobiont switches in the lichen genus Pseudocyphellaria s.l. follows a Brownian motion model. Symbiosis 72, 215–223. ( 10.1007/s13199-016-0458-z) [DOI] [Google Scholar]
- 47.Biazrov LG. 2012. Stable nitrogen isotopes (d15N) in thalli of arid vagrant lichen Xanthoparmelia camtschadalis across an altitudinal gradient of the Khangai Plateau of Mongolia. Contemp. Probl. Ecol. 5, 200–207. ( 10.1134/S1995425512020047) [DOI] [Google Scholar]
- 48.Ellis CJ, Coppins BJ, Dawson TP, Seaward MRD. 2007. Response of British lichens to climate change scenarios: trends and uncertainties in the projected impact for contrasting biogeographic groups. Biol. Conserv. 140, 217–235. ( 10.1016/j.biocon.2007.08.016) [DOI] [Google Scholar]
- 49.Kershaw KA. 1985. Phenotypic plasticity and differential strategies. In Physiological ecology of lichens (ed. KA Kershaw), pp. 243–267. Cambridge, UK: Cambridge University Press. [Google Scholar]
- 50.MacFarlane JD, Kershaw KA. 1977. Physiological-environmental interactions in lichens. IV. Seasonal changes in the nitrogenase activity in Peltigera canina (L.) Willd. var. praetextata (Floerke in Somm.) Hue, and P. canina (L.) Willd. var. rufescens (Weiss) Mudd. New Phytol. 69, 403–408. ( 10.1111/j.1469-8137.1977.tb02220.x) [DOI] [Google Scholar]
- 51.Palmqvist K, Campbell D, Ekblad A, Johansson H. 1998. Photosynthetic capacity in relation to nitrogen content and its partitioning in lichens with different photobionts. Plant Cell Environ. 21, 361–372. ( 10.1046/j.1365-3040.1998.00279.x) [DOI] [Google Scholar]
- 52.Palmqvist K, Sundberg B. 2000. Light use efficiency of dry matter gain in five macrolichens: relative impact of microclimate conditions and species-specific traits. Plant Cell Environ. 23, 1–14. ( 10.1046/j.1365-3040.2000.00529.x) [DOI] [Google Scholar]
- 53.Riera P. 2005. δ13C and δ15N comparisons among different cooccurring lichen species from littoral rocky substrata. Lichenologist 37, 93–95. ( 10.1017/S0024282904014446) [DOI] [Google Scholar]
- 54.Concostrina-Zubiri L, Matos P, Giordani P, Branquinho C. 2017. Biocrust tissue traits as potential indicators of global change in the Mediterranean. Plant Soil 429, 159–174. ( 10.1007/s11104-017-3483-7) [DOI] [Google Scholar]
- 55.Rosas T, Mencuccini M, Barba J, Cochard H, Saura-Mas S, Martínez-Vilalta J. 2019. Adjustments and coordination of hydraulic, leaf and stem traits along a water availability gradient. New Phytol. 223, 632–646. ( 10.1111/nph.15684) [DOI] [PubMed] [Google Scholar]
- 56.Esseen PA, Olsson T, Coxson D, Gauslaa Y. 2015. Morphology influences water storage in hair lichens from boreal forest canopies. Fungal Ecol. 18, 26–35. ( 10.1016/j.funeco.2015.07.008) [DOI] [Google Scholar]
Associated Data
This section collects any data citations, data availability statements, or supplementary materials included in this article.
Supplementary Materials
Data Availability Statement
Data is available in the electronic supplementary material and Figshare http://dx.doi.org/10.6084/m9.figshare.11341760. https://figshare.com/articles/Data_from_DISENTANGLING_FUNCTIONAL_TRAIT_VARIATION_AND_COVARIATION_IN_EPIPHYTIC_LICHENS_ALONG_A_CONTINENTWIDE_LATITUDINAL_GRADIENT_/11341760.