

Abstract
This study was conducted to evaluate the relationship between antimicrobial resistance and antimicrobial use in a university hospital in Taiwan. Disk susceptibility data of Escherichia coli, Klebsiella pneumoniae, Enterobacter cloacae, Serratia marcescens, Proteus spp., Pseudomonas aeruginosa, Acinetobacter spp., Stenotrophomonas maltophilia and other non-fermentative Gram-negative bacilli causing nosocomial infections were evaluated. Data on annual patient-days and annual consumption (defined daily dose (DDD) per 1000 patient-days) of extended-spectrum cephalosporins (cefotaxime, ceftriaxone, ceftazidime, flumoxef, cefepime and cefpirome), β-lactam–β-lactamase inhibitor combinations (ticarcillin/clavulanic acid and piperacillin/tazobactam), carbapenems (imipenem and meropenem), aminoglycosides (amikacin, gentamicin and tobramycin), fluoroquinolones (ciprofloxacin (oral and injectable) and oral levofloxacin and moxifloxacin) from 1991 to 2003 were analysed. Increasing trends of incidences of several of these bacteria causing all nosocomial infections or nosocomial bloodstream infections were noted from 1991 to 2003. The annual patient-days of the hospital significantly increased, from 360 210 in 1991 to 672 676 in 2002 (linear regression analysis, P < 0.05), but slightly decreased in 2003 (629 168) owing to the severe acute respiratory syndrome epidemic in Taiwan. The rise in cefotaxime-resistant or ciprofloxacin-resistant E. coli and meropenem-resistant P. aeruginosa was significantly correlated with increased consumption of extended-spectrum cephalosporins, β-lactam–β-lactamase inhibitor combinations, carbapenems, fluoroquinolones and aminoglycosides (for ciprofloxacin-resistant E. coli and meropenem-resistant P. aeruginosa only) in the hospital (Pearson's correlation coefficient, r > 0.72 (or <−0.72) and P-value < 0.05). Increased ciprofloxacin-resistant K. pneumoniae and meropenem-resistant Acinetobacter spp. was significantly associated with the increased usage of extended-spectrum cephalosporins but not with the other four classes of antibiotics. This 13-year study in a hospital demonstrated significant changes in antimicrobial use, which may have affected antimicrobial resistance in certain Gram-negative bacteria at the hospital.
Keywords: Antimicrobial use, Antimicrobial resistance, Nosocomial infection, Gram-negative bacteria, Taiwan
1. Introduction
Antimicrobial resistance is an increasing threat in hospitalised patients, and both mortality and morbidity from infection are greater when caused by antimicrobial-resistant bacteria [1], [2], [3], [4]. Among these resistant bacteria, extended-spectrum cephalosporin-resistant Enterobacteriaceae, carbapenem-resistant Pseudomonas aeruginosa and Acinetobacter baumannii, and ciprofloxacin-resistant Enterobacteriaceae and non-fermentative Gram-negative bacilli (NFGNB) are of great concern because antimicrobial therapy for infections due to these resistant pathogens remains a clinical dilemma in hospitalised patients [5], [6], [7], [8], [9], [10], [11]. Increases in the prevalence of these resistant pathogens in hospitals are frequently related to the high selective pressure of antimicrobials commonly used in hospitalised patients, particularly extended-spectrum cephalosporins, β-lactam–β-lactamase inhibitor combinations, carbapenems, fluoroquinolones and aminoglycosides [12], [13], [14], [15], [16], [17], [18], [19], [20]. Importantly, susceptibility profiles of nosocomial pathogens are affected not only by a single agent but also by use of multiple agents [21]. The higher resistance of organisms to some antimicrobial agents is frequently associated with heavy use of fewer antimicrobials [12], [13], [14], [15], [16], [17], [18], [19], [20], [21], [22]. Understanding the hospital antibiogram and hospital profile of antimicrobial use is mandatory in solving the problem of antimicrobial resistance in hospitals.
This report aims to evaluate antimicrobial usage and antimicrobial resistance trends for prominent nosocomial Gram-negative pathogens from 1991 to 2003 at a university hospital in Taiwan. For each antimicrobial-resistant pathogen, annual resistance rates and the usage of a single agent and several classes of agents were analysed.
2. Materials and methods
2.1. Setting
National Taiwan University Hospital (NTUH) is a tertiary referral centre and a university-affiliated hospital with 2000 beds. There were 175 beds in the intensive care unit and 150 beds in the haemo-oncology ward of this hospital during the study period. The Nosocomial Infection Control Committee of the hospital was established in 1980 [7]. Prior to 2004, no specific and well-established antibiotic control polices were implemented at the hospital. All attending physicians at the hospital can prescribe nearly all antimicrobial agents (except for liposomal amphotericin B, voriconazole, caspofungin, linezolid and ganciclovir) without the permission of the infection disease specialists.
2.2. Incidence of nosocomial infections caused by Gram-negative bacteria
Definitions for nosocomial infections followed the National Nosocomial Infections Surveillance guidelines [23]. Annual incidences of several major Gram-negative bacteria causing all nosocomial infections (bloodstream, respiratory tract, urinary tract, gastrointestinal, surgical site, and skin and soft tissue infections) and nosocomial bloodstream infections were expressed as episodes per 10 000 discharged. These organisms included Escherichia coli, Klebsiella pneumoniae, Enterobacter cloacae, Serraba marcescens, Proteus spp., P. aeruginosa, Acinetobacter spp., Stenotrophomonas maltophilia, and NFGNB other than P. aeruginosa, Acinetobacter spp. and S. maltophilia (Pseudomonas fluorescens, Pseudomonas putida, Acinetobacter junii, Acinetobacter haemolyticus, Acinetobacter lwoffii, Burkholderia cepacia, Chryseobacterium indologenes, Chryseobacterium meningosepticum and Alcaligenes spp.) (hereafter ‘other NFGNB’). These isolates were non-duplicate samples, as several isolates of each species from each patient recovered with 7 days were considered one isolate. Isolates were identified by conventional biochemical tests as well as by two commercial identification kits, VITEK Identification cards (bioMerieux, Hazelwood, MO) and Phoenix System (Becton Dickson, Sparks, MD), if necessary.
2.3. Antibiotic consumption
Data on annual consumption of extended-spectrum cephalosporins (cefotaxime, ceftriaxone, ceftazidime, flumoxef, cefepime and cefpirome), β-lactam–β-lactamase inhibitor combinations (ticarcillin/clavulanic acid and piperacillin/tazobactam), carbapenems (imipenem and meropenem), aminoglycosides (amikacin, gentamicin and tobramycin) and fluoroquinolones (ciprofloxacin (oral and injectable) and oral levofloxacin and moxifloxacin) from 1991 to 2003 were obtained from the Pharmacy Department of the hospital. Antibiotic consumption was expressed as the number of defined daily doses (DDDs)/1000 patient-days) [24].
2.4. Trends in resistance
To determine the secular trend of resistance in major Gram-negative pathogens causing nosocomial infections at NTUH, data on the disk diffusion susceptibilities of these organisms recovered from 1991 to 2003 were retrieved from the annual summary document [25]. To calculate the resistance rates, isolates of each species with identical resistance profiles recovered from each patient within 7 days were calculated once (non-duplicate isolates). Screening for extended-spectrum β-lactamase (ESBL) phenotypes among E. coli and K. pneumoniae isolates began in 2003 [26]. Escherichia coli and K. pneumoniae isolates with an inhibition zone diameter for cefotaxime (30 μg disk) or aztreonam (30 μg disk) of < 27 mm were subjected to the ESBL confirmation method using the following four antimicrobial disks: cefotaxime (30 μg), cefotaxime/clavulanic acid (30/10 μg disk), ceftazidime (30 μg disk) and ceftazidime/clavulanic acid (30/10 μg disk). The results were interpreted based on the National Committee for Clinical Laboratory Standards (NCCLS) criteria [26].
Regular quality assurance was performed among isolates processed using the following American Type Culture Collection (ATCC) strains: E. coli ATCC 25922, K. pneumoniae ATCC 70063 (for confirmation testing of ESBL-producing strains) and P. aeruginosa ATCC 27853. Isolates were classified as susceptible or resistant (including intermediate category) according to the NCCLS criteria [25], [26].
2.5. Statistical analysis
Pearson's correlation coefficient was used to determine the relationship between antibiotic consumption and trends in resistance. Linear regression analysis was used to analyse the trend of hospital patient-days and the trends of rates among Gram-negative pathogens causing all nosocomial infections and nosocomial bloodstream infections with time. Trends of annual resistance rates to each antimicrobial agent for microorganisms were performed using Durbin–Watson statistics. An r-value >0.72 (or <−0.72) and a P-value <0.05 were considered statistically significant. The autoregressive integrated moving average (ARIMA) model was used to demonstrate the time series of antimicrobial resistance and antimicrobial use (cefotaxime resistance in E. coli and ceftazidime resistance in P. aeruginosa) [27], [28].
3. Results
3.1. Incidence of nosocomial infections
Annual rates of major Gram-negative bacilli causing all nosocomial infections and nosocomial bloodstream infections are shown in Fig. 1A and 1B, respectively. For A. baumannii, a 3.6-fold increase in nosocomial bloodstream infections was noted (7.5 episodes/10 000 discharges in 1991 versus 27.1 episodes/10 000 discharges in 2003), along with a 2.1-fold increase in all nosocomial infections (24.5 episodes/10 000 discharges in 1991 versus 50.8 episodes/10 000 discharges in 2003). There was a 2.2-fold increase in other NFGNB causing nosocomial bloodstream infections (4.9 episodes/10 000 discharges in 1991 versus 10.7 episodes/10 000 discharges in 2003). Among the eight Gram-negative bacterial species and other NFGNB isolates, trends of increased incidences were significant (r > 0.72 and P < 0.05) among E. coli and other NFGNB causing all nosocomial infections, and among E. coli, K. pneumoniae, Serratia spp., Proteus spp., P. aeruginosa and Acinetobacter spp. causing nosocomial bloodstream infections (Table 1 ).
Fig. 1.
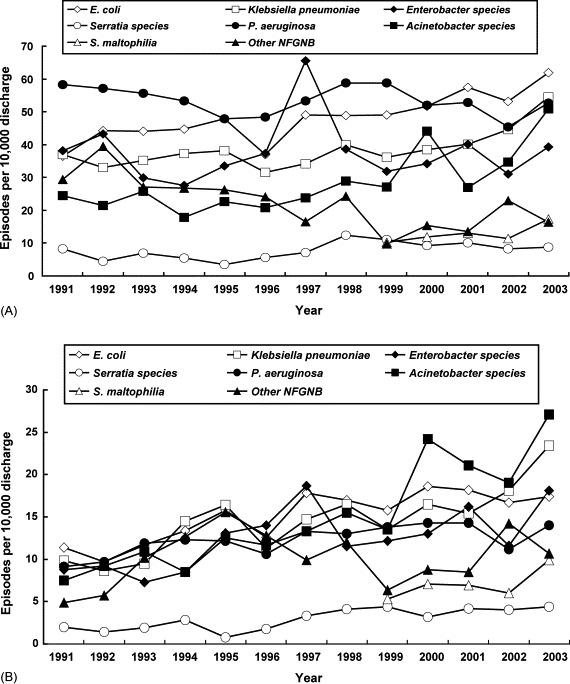
Incidence (episodes per 10 000 discharged) of (A) all nosocomial infections and (B) nosocomial bloodstream infections caused by major Gram-negative bacilli isolated from patients treated at a university hospital in Taiwan from 1991–2003. NFGNB, non-fermentative Gram-negative bacilli.
Table 1.
Trends of incidence rates among Gram-negative pathogens causing all nosocomial infections and nosocomial bloodstream infections at National Taiwan University Hospital, 1991–2003
| Microorganism | All nosocomial infections |
Nosocomial bloodstream infection |
||
|---|---|---|---|---|
| r | P | r | P | |
| Escherichia coli | 0.850 | <0.001* | 0.846 | <0.001* |
| Klebsiella pneumoniae | 0.696 | 0.008 | 0.829 | <0.001* |
| Enterobacter spp. | 0.013 | 0.968 | 0.669 | 0.012* |
| Serratia spp. | 0.555 | 0.049 | 0.810 | <0.001* |
| Proteus spp. | 0.628 | 0.096 | 0.912 | 0.002* |
| Pseudomonas aeruginosa | 0.367 | 0.005 | 0.904 | 0.006* |
| Acinetobacter spp. | 0.730 | 0.218 | 0.729 | <0.001* |
| Stenotrophomonas maltophilia | 0.778 | 0.113 | 0.730 | 0.161 |
| Other NFGNB | 0.758 | 0.003* | 0.258 | 0.395 |
NFGNB, non-fermentative Gram-negative bacilli.
Statistically significant association (r > 0.72, P < 0.05).
3.2. Annual antibiotic consumption
The annual patient-days of the hospital significantly increased, from 360 210 in 1991 to 672 676 in 2002 (linear regression analysis, P < 0.05), but slightly decreased in 2003 (629 168) owing to the severe acute respiratory syndrome epidemic in Taiwan (Fig. 2A). Table 2 shows the annual consumption of several commonly used antimicrobial agents, and Fig. 2B illustrates the annual consumption of five classes of agents from 1991 to 2003. In general, the usage of each individual antimicrobial agent varied with years. A significant stepwise increase in consumption (r > 0.72 and P < 0.05) was found for piperacillin/tazobactam, cefepime, meropenem and ciprofloxacin (Table 2). Antibiotics with significantly decreased annual use in the past 4 years (2000–2003) were amikacin and sulphamethoxazole/trimethoprim (r < −0.72 and P < 0.05). For the five classes of agents, a 4.2-fold, 5.1-fold and 801.3-fold increase in usage was noted for extended-spectrum cephalosporins, carbapenems and fluoroquinolones, respectively, in 2003 compared with 1991. An 8.8-fold increase in usage of β-lactam–β-lactamase inhibitor combinations was noted in 2003 (19.55 DDD per 1000 patient-days) compared with 1994 (2.22 DDD per 1000 patient-days).
Fig. 2.
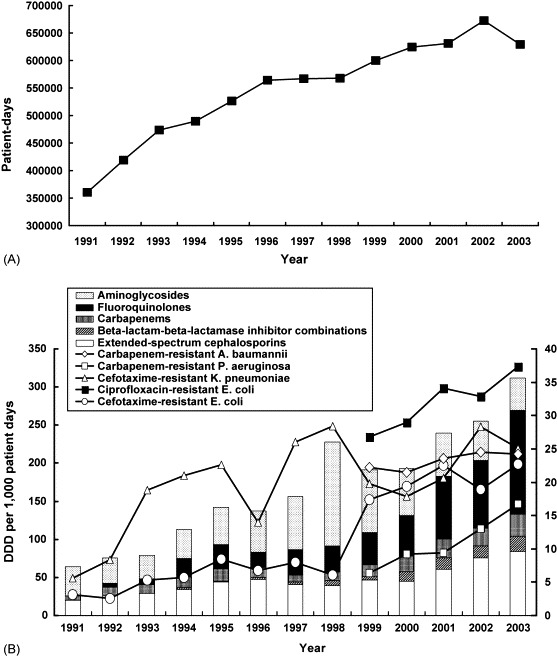
(A) Annual patient-days and (B) annual consumption (defined daily dose (DDD) per 1000 patient-days) of five classes of antimicrobial agents and resistance trends for five drug/organism combinations at a university hospital in Taiwan from 1991–2003.
Table 2.
Annual consumption of several representative antimicrobial agents at National Taiwan University Hospital, 1991–2003
| Antimicrobial agent | Antibiotic consumption (DDD/1000 patient-days) by year |
Correlation |
|||||||||||||
|---|---|---|---|---|---|---|---|---|---|---|---|---|---|---|---|
| 1991 | 1992 | 1993 | 1994 | 1995 | 1996 | 1997 | 1998 | 1999 | 2000 | 2001 | 2002 | 2003 | r | P | |
| Ceftazidime | 7.94 | 9.13 | 13.24 | 15.83 | 23.03 | 25.25 | 24.50 | 19.04 | 18.65 | 15.55 | 14.35 | 14.74 | 13.81 | 0.206 | 0.250 |
| Piperacillin/tazobactam | – | – | – | – | – | – | – | – | – | 4.88 | 6.57 | 10.17 | 16.22 | 0.968 | 0.016* |
| Ticarcillin/clavulanic acid | – | – | – | 2.21 | 0.86 | 2.46 | 3.38 | 6.48 | 5.32 | 7.95 | 8.31 | 5.20 | 3.33 | 0.601 | 0.033 |
| Cefepime | – | – | – | – | – | – | – | 0.92 | 7.75 | 14.72 | 22.88 | 35.17 | 39.37 | 0.994 | 0.028* |
| Imipenem | 5.75 | 11.305 | 11.51 | 14.125 | 16.81 | 13.21 | 9.24 | 12.09 | 11.58 | 14.95 | 14.9 | 12.00 | 19.11 | 0.560 | 0.046 |
| Meropenem | – | – | – | – | – | – | – | 0.10 | 3.40 | 5.66 | 10.10 | 11.28 | 10.39 | 0.943 | 0.005* |
| Imipenem + meropenem | 5.75 | 11.31 | 11.51 | 14.13 | 16.81 | 13.21 | 9.24 | 12.19 | 14.98 | 20.61 | 25 | 23.275 | 29.50 | 0.851 | <0.001* |
| Ciprofloxacin | 0.32 | 5.18 | 7.32 | 10.80 | 14.12 | 25.84 | 13.86 | 15.38 | 20.04 | 22.86 | 24.26 | 26.78 | 34.36 | 0.916 | <0.001* |
| Gentamicin | 13.71 | 10.46 | 10.00 | 15.00 | 24.25 | 30.96 | 52.79 | 58.33 | 71.25 | 48.83 | 45.75 | 42.21 | 35.00 | 0.702 | 0.004 |
| Amikacin | 12.7 | 13.62 | 13.2 | 13.71 | 12.64 | 13.53 | 6.76 | 6.82 | 5.78 | 5.84 | 5.63 | 6.63 | 6.19 | −0.867 | <0.001* |
| Sulphamethoxazole/trimethoprim | 305.43 | 325.47 | 229.51 | 296.22 | 284.14 | 166.11 | 274.32 | 293.74 | 264.62 | 219.2 | 208.77 | 131.11 | 135.53 | −0.727 | 0.002* |
DDD, defined daily dose.
Statistically significant association (r > 0.72, P < 0.05).
3.3. Relationship between antibiotic consumption and rates of resistance
In 2003, the overall rate of resistance to cefotaxime was 22.7% in E. coli and 25.1% in K. pneumoniae. However, based on the NCCLS guidelines for ESBL confirmation testing [26], the rate of ESBL-producing isolates of E. coli and K. pneumoniae in 2003 was 14.2% and 14%, respectively. Table 3 shows the trends of resistance rates among Gram-negative pathogens. A significant increase in resistance rate with time (r > 0.72 and P < 0.05) was found for cefotaxime- and ciprofloxacin-resistant E. coli, cefepime- and ciprofloxacin-resistant K. pneumoniae, cefepime- and meropenem-resistant P. aeruginosa, ceftazidime-, piperacillin/tazobactam-, gentamicin- and amikacin-resistant A. baumannii, and cefepime- and piperacillin/tazobactam-resistant S. maltophilia. A significantly increased susceptibility with time (r < −0.72 and P < 0.05) was found to ceftazidime and amikacin for P. aeruginosa (Table 3).
Table 3.
Trends of resistance rates among Gram-negative pathogens causing nosocomial infections at National Taiwan University Hospital, 1991–2003
| Organism/antimicrobial agent | Antimicrobial resistance (%) by year |
Correlation |
|||||||||||||
|---|---|---|---|---|---|---|---|---|---|---|---|---|---|---|---|
| 1991 | 1992 | 1993 | 1994 | 1995 | 1996 | 1997 | 1998 | 1999 | 2000 | 2001 | 2002 | 2003 | r | P | |
| Escherichia coli | |||||||||||||||
| No. of isolates | 112 | 161 | 180 | 204 | 230 | 196 | 284 | 282 | 313 | 356 | 409 | 415 | 434 | ||
| Cefotaxime | 3.1 | 2.6 | 5.3 | 5.7 | 8.5 | 6.7 | 8 | 6.1 | 17.4 | 19.4 | 22.5 | 18.9 | 22.7 | 0.918 | <0.001* |
| Cefepime | – | – | – | – | – | – | – | – | 8.4 | 10.2 | 11.1 | 6.9 | 8.5 | −0.297 | 0.314 |
| Piperacillin/tazobactam | – | – | – | – | – | – | – | – | – | – | 8.9 | 12.7 | 12.7 | 0.866 | 0.167 |
| Ciprofloxacin | – | – | – | – | – | – | – | – | 26.8 | 29.0 | 34.1 | 32.9 | 37.3 | 0.946 | 0.008* |
| Gentamicin | 23.8 | 30.4 | 36.0 | 32.0 | 45.4 | 42.5 | 36 | 36.5 | 37.7 | 36.4 | 37.6 | 34.0 | 34.6 | 0.327 | 0.138 |
| Klebsiella pneumoniae | |||||||||||||||
| No. of isolates | 113 | 121 | 144 | 170 | 184 | 167 | 198 | 232 | 228 | 267 | 285 | 350 | 382 | ||
| Cefotaxime | 5.6 | 8.4 | 18.8 | 21.0 | 22.6 | 14.0 | 26.0 | 28.4 | 19.8 | 17.9 | 20.6 | 28.3 | 25.1 | 0.68 | 0.005 |
| Cefepime | – | – | – | – | – | – | – | – | 8.9 | 13.6 | 18.1 | 22.5 | 18 | 0.83 | 0.041* |
| Piperacillin/tazobactam | – | – | – | – | – | – | – | – | – | – | 19.5 | 15.1 | 15.9 | −0.768 | 0.221 |
| Ciprofloxacin | – | – | – | – | – | – | – | – | 8.9 | 16.2 | 20.2 | 28.8 | 23.1 | 0.868 | 0.028* |
| Gentamicin | 15.4 | 17.5 | 24.8 | 23.5 | 25.0 | 18.7 | 27.3 | 32.8 | 25.4 | 17.3 | 21.7 | 31.1 | 19.7 | 0.31 | 0.151 |
| Enterobacter cloacae | |||||||||||||||
| No. of isolates | 117 | 155 | 124 | 126 | 161 | 197 | 235 | 222 | 203 | 236 | 289 | 244 | 276 | ||
| Cefotaxime | 44.7 | 48.0 | 50.4 | 48.3 | 51.9 | 63.0 | 60.5 | 62.7 | 62.7 | 48.9 | 60.1 | 58.7 | 51.3 | 0.498 | 0.042 |
| Cefepime | – | – | – | – | – | – | – | – | 7.8 | 7.6 | 10.6 | 16.2 | 9.2 | 0.512 | 0.189 |
| Piperacillin/tazobactam | – | – | – | – | – | – | – | – | – | – | 30.7 | 34.8 | 29.3 | −0.245 | 0.421 |
| Ciprofloxacin | – | – | – | – | – | – | – | – | 6.4 | 15.8 | 14.5 | 19.5 | 15.4 | 0.712 | 0.089 |
| Gentamicin | 38.0 | 37.4 | 32.2 | 22.2 | 22.2 | 34.5 | 34.2 | 39.6 | 35.6 | 29.7 | 34.1 | 29.9 | 26.9 | −0.160 | 0.300 |
| Amikacin | 22.6 | 21.9 | 19.2 | 7.9 | 5.6 | 12.8 | 18.8 | 18.6 | 23.9 | 13.2 | 23.6 | 17.6 | 10.2 | −0.07 | 0.410 |
| Serratia marcescens | |||||||||||||||
| No. of isolates | 24 | 15 | 29 | 24 | 17 | 29 | 41 | 70 | 70 | 63 | 72 | 64 | 61 | ||
| Cefotaxime | 28.6 | 8.3 | 12.0 | 20.8 | 17.6 | 34.4 | 51.2 | 57.1 | 61.1 | 45.2 | 34.7 | 38.1 | 41.0 | 0.635 | 0.010 |
| Cefepime | – | – | – | – | – | – | – | – | 5.6 | 6.0 | 9.2 | 9.5 | 6.6 | 0.474 | 0.210 |
| Piperacillin/tazobactam | – | – | – | – | – | – | – | – | – | – | 23.1 | 26 | 23.9 | 0.267 | 0.414 |
| Ciprofloxacin | – | – | – | – | – | – | – | – | 32.4 | 33.3 | 20.0 | 30.6 | 30.0 | −0.222 | 0.360 |
| Gentamicin | 11.8 | 20.0 | 11.5 | 12.5 | 11.8 | 34.5 | 48.8 | 51.4 | 40.0 | 40.3 | 25.3 | 26.6 | 31.1 | 0.542 | 0.280 |
| Amikacin | 23.8 | 13.3 | 11.1 | 12.5 | 0.0 | 10.3 | 35.9 | 23.2 | 20 | 17.7 | 11.1 | 10.9 | 13.1 | −0.019 | 0.476 |
| Proteus spp. | |||||||||||||||
| No. of isolates | 30 | 29 | 24 | 36 | 37 | 40 | 57 | 51 | 68 | 68 | 84 | 64 | 86 | ||
| Cefotaxime | 0.0 | 0.0 | 9.1 | 0.0 | 8.1 | 2.5 | 1.8 | 3.9 | 3.3 | 1.5 | 1.2 | 4.7 | 5.9 | 0.168 | 0.292 |
| Cefepime | – | – | – | – | – | – | – | – | 0.0 | 1.6 | 0.0 | 0.0 | 2.3 | 0.433 | 0.233 |
| Piperacillin/tazobactam | – | – | – | – | – | – | – | – | – | – | 2.7 | 0.0 | 0.0 | −0.866 | 0.167 |
| Ciprofloxacin | – | – | – | – | – | – | – | – | 6.2 | 5.9 | 7.1 | 4.7 | 14.0 | 0.617 | 0.134 |
| Gentamicin | 21.4 | 24.1 | 13 | 25 | 10.8 | 17.5 | 18.2 | 37.3 | 19.1 | 26.9 | 25 | 23.4 | 24.4 | 0.334 | 0.132 |
| Amikacin | 0.0 | 0.0 | 4.3 | 0.0 | 0.0 | 2.5 | 1.8 | 5.9 | 1.5 | 1.5 | 1.2 | 1.6 | 3.5 | 0.322 | 0.141 |
| Pseudomonas aeruginosa | |||||||||||||||
| No. of isolates | 179 | 204 | 230 | 243 | 231 | 255 | 309 | 324 | 372 | 358 | 376 | 357 | 369 | ||
| Ceftazidime | 13.6 | 22.4 | 18.8 | 9.2 | 10.3 | 11.7 | 8.4 | 10.1 | 12.2 | 9.3 | 10.3 | 11.5 | 9.5 | −0.578 | 0.019 |
| Cefepime | – | – | – | – | – | – | – | – | 6.0 | 8.9 | 9.3 | 12.1 | 11.6 | 0.934 | 0.010* |
| Piperacillin/tazobactam | – | – | – | – | – | – | – | – | 23.4 | 11.0 | 10.0 | 15.0 | 17.0 | −0.259 | 0.337 |
| Meropenem | – | – | – | – | – | – | – | – | 6.4 | 9.2 | 9.4 | 13.0 | 16.7 | 0.969 | 0.003* |
| Ciprofloxacin | – | – | – | – | – | – | – | – | 8.2 | 9.5 | 6.4 | 11.6 | 16.1 | 0.759 | 0.068 |
| Gentamicin | 19.8 | 26.4 | 20.9 | 14.2 | 18.9 | 13.4 | 22.7 | 20.2 | 15.9 | 17.6 | 12.3 | 15.1 | 13.7 | −0. 598 | 0.016 |
| Amikacin | 13.3 | 17.6 | 13.4 | 7.9 | 9.6 | 6.7 | 12.3 | 8.0 | 7.1 | 6.5 | 4.8 | 7.3 | 4.9 | −0.803 | <0.001* |
| Acinetobacter baumannii | |||||||||||||||
| No. of isolates | 75 | 76 | 103 | 74 | 103 | 106 | 132 | 158 | 170 | 302 | 294 | 272 | 356 | ||
| Ceftazidime | 24.3 | 13.9 | 21.3 | 17.4 | 21.2 | 17.5 | 34.5 | 37.8 | 52.4 | 47.3 | 49.8 | 44.3 | 47.9 | 0.871 | <0.001* |
| Cefepime | – | – | – | – | – | – | – | – | 48.5 | 46.2 | 43.0 | 45.8 | 46.5 | −0.353 | 0.280 |
| Piperacillin/tazobactam | – | – | – | – | – | – | – | – | 40.8 | 41.1 | 43.0 | 45.2 | 48.6 | 0.962 | 0.004* |
| Meropenem | – | – | – | – | – | – | – | – | 22.2 | 21.5 | 23.6 | 24.5 | 24.2 | 0.853 | 0.033 |
| Ciprofloxacin | – | – | – | – | – | – | – | – | 46.2 | 42.2 | 44.9 | 48.7 | 48.9 | 0.673 | 0.106 |
| Gentamicin | 20.8 | 18.4 | 26.8 | 17.6 | 25.5 | 17.9 | 33.6 | 40.5 | 49.4 | 47.0 | 53.2 | 53.1 | 54.2 | 0.921 | <0.001* |
| Amikacin | 19.4 | 15.8 | 19.6 | 14.1 | 12.9 | 6.7 | 22.3 | 30.1 | 47.0 | 44.4 | 40.7 | 43.9 | 44.9 | 0.825 | <0.001* |
| Stenotrophomonas maltophilia | |||||||||||||||
| No. of isolates | – | – | – | – | – | – | – | – | 65 | 82 | 94 | 89 | 121 | ||
| Ceftazidime | – | – | – | – | – | – | – | – | 60 | 37.5 | 50 | 47.2 | 56.6 | 0.052 | 0.467 |
| Cefepime | – | – | – | – | – | – | – | – | 80.6 | 79 | 89.4 | 92.1 | 89.9 | 0.841 | 0.037* |
| Piperacillin/tazobactam | – | – | – | – | – | – | – | – | 70.6 | 78.7 | 83.1 | 84.1 | 89.8 | 0.968 | 0.003* |
| Ticarcillin/clavulanic acid | – | – | – | – | – | – | – | – | 47.4 | 29.3 | 39.3 | 32.6 | 42.9 | −0.122 | 0.423 |
| Ciprofloxacin | – | – | – | – | – | – | – | – | 15.2 | 26.8 | 55.4 | 36.4 | 21.7 | 0.228 | 0.356 |
| Sulphamethoxazole/trimethoprim | – | – | – | – | – | – | – | – | – | 15.9 | 10.8 | 26.7 | 26.9 | 0.785 | 0.107 |
| Other NFGNB | |||||||||||||||
| No. of isolates | 91 | 80 | 111 | 122 | 132 | 132 | 100 | 78 | 63 | 104 | 97 | 178 | 113 | ||
| Ceftazidime | 35.4 | 46.2 | 18.8 | 43.4 | 35.5 | 40 | 49.5 | 46.8 | 35 | 37.6 | 45.2 | 34.9 | 35.7 | 0.106 | 0.366 |
| Cefepime | – | – | – | – | – | – | – | – | 25.7 | 34.6 | 34.1 | 35.6 | 30.1 | 0.377 | 0.266 |
| Piperacillin/tazobactam | – | – | – | – | – | – | – | – | 11.8 | 22.3 | 30.8 | 27.2 | 18.2 | 0.375 | 0.267 |
| Meropenem | – | – | – | – | – | – | – | – | 29.6 | 40.8 | 53.7 | 42.7 | 57.8 | 0.683 | 0.159 |
| Ciprofloxacin | – | – | – | – | – | – | – | – | 44.7 | 34.9 | 38.1 | 43.8 | 31.9 | −0.476 | 0.209 |
| Gentamicin | 73.8 | 75.9 | 82.9 | 80.2 | 68.7 | 71 | 22.7 | 74.4 | 68.3 | 69.2 | 73.2 | 80.2 | 69.9 | −0.101 | 0.371 |
| Amikacin | 61 | 73.1 | 75.5 | 73.1 | 56.9 | 63.9 | 12.3 | 8 | 57.1 | 59.6 | 68 | 70.6 | 65.5 | −0.109 | 0.361 |
NFGNB, non-fermentative Gram-negative bacilli (other than P. aeruginosa, A. baumannii and S. maltophilia).
Statistically significant association (r > 0.72 or < − 0.72, P < 0.05).
Relationships between rates of resistant Gram-negative pathogens causing nosocomial infections and the annual consumption of the corresponding antibiotic in the hospital from 1991 to 2003 are shown in Table 4 . Significant positive associations (increased resistance associated with increased consumption) (r > 0.72 and P < 0.05) were found in cefotaxime- and ciprofloxacin-resistant E. coli, cefotaxime- and gentamicin-resistant S. marcescens, ciprofloxacin-resistant P. aeruginosa, and piperacillin/tazobactam-, amikacin- and meropenem-resistant A. baumannii. Significant negative associations (r < −0.72 and P < 0.05) were found in cefepime- and gentamicin-resistant A. baumannii.
Table 4.
Relationship between annual consumption of individual antibiotics and rates of key resistant Gram-negative pathogens causing nosocomial infections at National Taiwan University Hospital, 1991–2003
| Antimicrobial agent |
Escherichia coli |
Klebsiella pneumoniae |
Enterobacter cloacae |
Serratia marcescens |
Proteus spp. |
Pseudomonas aeruginosa |
Acinetobacter baumannii |
Stenotrophomonas maltophilia |
Other NFGNB |
|||||||||
|---|---|---|---|---|---|---|---|---|---|---|---|---|---|---|---|---|---|---|
| r | P | r | P | r | P | r | P | r | P | r | P | r | P | r | P | r | P | |
| Cefotaxime | 0.764 | 0.002* | 0.480 | 0.097 | 0.437 | 0.136 | 0.777 | 0.002* | 0.011 | 0.971 | – | – | – | – | – | – | – | – |
| Ceftazidime | – | – | – | – | – | – | – | – | – | – | −0.543 | 0.045 | 0.008 | 0.980 | 0.327 | 0.591 | 0.245 | 0.420 |
| Cefepime | 0.787 | 0.114 | 0.345 | 0.576 | 0.064 | 0.919 | 0.555 | 0.332 | −0.147 | 0.814 | 0.142 | 0.82 | −0.952 | 0.012* | 0.25 | 0.684 | 0.601 | 0.284 |
| Piperacillin/tazobactam | 0.784 | 0.426 | −0.667 | 0.469 | 0.535 | −0.303 | 0.124 | 0.921 | −0.784 | 0.426 | 0.931 | 0.069 | 0.993 | 0.007* | 0.963 | 0.037 | −0.587 | 0.413 |
| Ciprofloxacin | 0.903 | 0.036* | 0.674 | 0.212 | 0.527 | 0.361 | −0.069 | 0.912 | 0.819 | 0.090 | 0.881 | 0.049* | 0.647 | 0.238 | −0.025 | 0.968 | −0.627 | 0.257 |
| Gentamicin | 0.342 | 0.252 | 0.465 | 0.109 | 0.260 | 0.391 | 0.851 | <0.001* | 0.350 | 0.241 | −0.261 | 0.388 | −0.721 | 0.005* | 1 | −0.404 | 0.171 | |
| Amikacin | – | – | – | – | −0.264 | 0.384 | −0.376 | 0.206 | −0.322 | 0.283 | −0.581 | 0.037 | 0.896 | <0.001* | 1 | 0.394 | 0.183 | |
| Meropenem | – | – | – | – | – | – | – | – | – | – | 0.771 | 0.127 | 0.899 | 0.038* | – | – | 0.786 | 0.214 |
| Ticarcillin/clavulanic acid | – | – | – | – | – | – | – | – | – | – | – | – | – | – | −0.470 | 0.424 | – | – |
| Sulphamethoxazole/trimethoprim | – | – | – | – | – | – | – | – | – | – | – | – | – | – | −0.937 | 0.063 | – | – |
NFGNB, non-fermentative Gram-negative bacilli.
Statistically significant association (r > 0.72 or < − 0.72, P < 0.05).
The rise in cefotaxime-resistant E. coli was significantly correlated with the increased consumption of extended-spectrum cephalosporins (r = 0.8409, P < 0.0001), β-lactam–β-lactamase inhibitor combinations (r = 0.9148, P < 0.0001), carbapenems (r = 0.8929, P < 0.0001) and fluoroquinolones (r = 0.8877, P < 0.0001). The rise in cefotaxime-resistant K. pneumoniae was significantly associated with the use of extended-spectrum cephalosporins (r = 0.7223, P = 0.0281) and fluoroquinolones (r = 0.7810, P < 0.0373) only. The increase in rates of ciprofloxacin-resistant E. coli and meropenem-resistant P. aeruginosa was significantly correlated with increased consumption of extended-spectrum cephalosporins (r = 0.89446, P = 0.0404 and r = 0.9283, P = 0.0218, respectively), β-lactam–β-lactamase inhibitor combinations (r = 0.9323, P = 0.0209 and r = 0.8991, P = 0.0379, respectively), carbapenems (r = 0.8933, P = 0.0412 and r = 0.9283, P = 0.0218, respectively) and fluoroquinolones (r = 0.9612, P = 0.0091 and r = 0.9523, P = 0.0124, respectively). Decreased use of aminoglycosides was significantly associated with an increased incidence of ciprofloxacin-resistant E. coli (r = −0.9221, P = 0.0258) and meropenem-resistant P. aeruginosa (r = −0.9082, P = 0.0264). An increase in meropenem-resistant Acinetobacter spp. was significantly associated with increased usage of extended-spectrum cephalosporins (r = 0.9316, P = 0.0212) and carbapenems (r = 0.9026, P = 0.0412) but not with the other four classes of antibiotics. The relationships between rates of ciprofloxacin resistance in K. pneumoniae and P. aeruginosa and the five classes of antimicrobials were not significant.
3.4. Time series analysis with ARIMA model
Table 5 shows ARIMA and transfer function models for estimating the percentage of cefotaxime resistance among E. coli isolates. An increase of 1 DDD/1000 patient-days for cefotaxime resulted in an increase of 0.98% in the cefotaxime resistance rate. A forecast of cefotaxime resistance in E. coli and ceftazidime resistance in P. aeruginosa up to 2011 is shown in Fig. 3 . In 2011, the predicted cefotaxime resistance percentage for E. coli is 36.3% (95% confidence interval (CI), 26.6–42.5%) and the predicted ceftazidime resistance percentage for P. aeruginosa is 8.79% (95% CI, 3.9–10.6%).
Table 5.
Autoregressive integrated moving average (ARIMA) and transfer function models for estimating percentage of cefotaxime resistance among Escherichia coli isolated at National Taiwan University Hospital, 1991–2003
| Antibiotic use | Parameter (SE)a | T-ratio | P |
|---|---|---|---|
| ARIMA model for percentage of cefotaxime resistance | |||
| MA | 0.9814 (0.0346) | 28.36448 | <0.001 |
| Transfer function for cefotaxime resistance | |||
| Cefotaxime use | 0.9815 (0.03447) | 28.4748 | <0.001 |
| MA | 0.9814 (0.03675) | 26.7021 | <0.001 |
SE, standard error; MA, moving average term, representing disturbance and abrupt changes of resistance.
Size and direction of the effect.
Fig. 3.
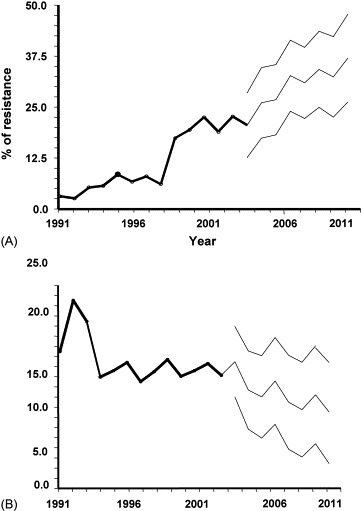
Yearly percentage of (A) cefotaxime-resistant Escherichia coli and (B) ceftazidime-resistant Pseudomonas aeruginosa observed between 1991 and 2003 and predicted values up to 2011 with 95% confidence intervals according to autoregressive integrated moving average (ARIMA) and transfer function models.
4. Discussion
This study regarding the association between antimicrobial resistance in Gram-negative bacteria that cause nosocomial infections and antibiotic use at a Taiwanese teaching hospital with an increase of annual patient-days during a 13-year period discloses three important points. First, the incidence of nosocomial bacteraemia due to the major Gram-negative bacteria generally increased over time. Notable trends in antimicrobial usage demonstrated sharp increases in the use of piperacillin/tazobactam, cefepime, ciprofloxacin and carbapenems, but decreases in the use of amikacin and sulphamethoxazole/trimethoprim.
Second, widespread use of four major classes of antimicrobial agents in the hospital were significantly associated with the increase in cefotaxime and ciprofloxacin resistance in E. coli and carbapenem resistance in P. aeruginosa. Increased use of extended-spectrum cephalosporins was also significantly related to the increased incidence of cefotaxime resistance in K. pneumoniae and carbapenem resistance in Acinetobacter spp. The increased use of fluoroquinolones is also significantly associated with the increased incidence of cefotaxime resistance in K. pneumoniae and carbapenem resistance in P. aeruginosa. Third, the decreasing use of gentamicin and amikacin in recent years is associated with increasing susceptibility of S. marcescens to gentamicin and of P. aeruginosa to amikacin; however, resistance to gentamicin and amikacin in A. baumannii remained high.
The relationship between antimicrobial resistance and antimicrobial usage for a particular drug, or classes of drug, and organism combination is partly in line with other previous studies [12], [13], [14], [15], [16], [17], [18], [19], [20], [21], [22]. A significant positive correlation between the increase in the use of extended-spectrum cephalosporins (particularly ceftazidime) and the increased prevalence of ceftazidime-resistant K. pneumoniae, Enterobacter spp. and P. aeruginosa has been described in many previous reports [17], [29], [30], [31], [32]. Our study further demonstrated this positive association with cefotaxime use and cefotaxime-resistant S. marcescens. However, a significantly increased use of cefepime in NTUH failed to result in an increased rate of cefepime resistance in A. baumannii and even exerted a protective effect against this resistance (r = −0.952 and P = 0.012). Use of piperacillin/tazobactam has been demonstrated to reduce rates of ceftazidime-resistant or ESBL-producing K. pneumoniae [12], [29], [32]. However, our study showed a significantly positive association between piperacillin/tazobactam use and piperacillin/tazobactam-resistant A. baumannii.
Although the consumption of ceftazidime in 2003 decreased to approximately one-half of that in 1996, and although piperacillin/tazobactam use increased dramatically, cefotaxime resistance in K. pneumoniae remained high (25.1% in 2003), and rates of piperacillin/tazobactam resistance in these Gram-negative bacteria remained stable. However, cefotaxime resistance in Enterobacter spp. and ceftazidime-resistant P. aeruginosa declined gradually. Because the incidence of ESBL-producing E. coli and K. pneumoniae was not available prior to 2003, it was not possible to define the relationship between antimicrobial usage and the incidence of ESBL-producing isolates.
Previous reports demonstrated that fluoroquinolones were protective against isolation of third-generation cephalosporin-resistant pathogens [31], [33]. A recent study further demonstrated that higher hospital-level use of fluoroquinolones was associated with an increased proportion of ciprofloxacin resistance among P. aeruginosa isolates causing hospital-acquired infections [34] but not in E. coli isolates. However, MacDougall et al. demonstrated that there was no significant relationship between total hospital fluoroquinolone use and resistance in E. coli [35]. In this study, increased use of fluoroquinolones was not only associated with the increased incidence of cefotaxime-resistant E. coli and K. pneumoniae but also correlated with varying degrees of increase in ciprofloxacin resistance among these Gram-negative bacteria, except for S. maltophilia isolates.
The root causes of the rapid emergence and dissemination of drug-resistant bacteria in hospitals are multifactorial [36], including the high selective pressure that results from inappropriate and widespread use of antimicrobial agents particularly in intensive care units, cross transmission from patient to patient owing to inconsistent application of appropriate infection control measures, interhospital transfer of resistance (clonal spreading of resistant bacteria or horizontal transfer of resistance genes), a community contribution to resistance, or a complex relationship between resistance and the use of a variety of antimicrobials [33], [36], [37], [38]. However, increasing resistance may further drive increased consumption of several so-called ‘last-line’ antimicrobial agents. In this study, the increase in the incidence of nosocomial infections due to multidrug-resistant P. aeruginosa and A. baumannii and cefotaxime-resistant E. coli and K. pneumoniae resulted in an increase in the use of carbapenems. The increased use of these agents was significantly associated with an increase in the incidence of nosocomial infections due to carbapenem-resistant A. baumannii and P. aeruginosa, S. maltophilia and other NFGNB, particularly among patients hospitalised in intensive care units (data not shown). Previous studies have demonstrated that the spread of pauci-clones of carbapenem-resistant or pandrug-resistant A. baumannii and poly-clones of carbapenem-resistant P. aeruginosa in intensive care units and other wards at the hospital contributes significantly to the increased rates of carbapenem resistance among these isolates [6], [10], [11], [12].
Recently, the ARIMA model has been widely used to investigate the relationship between antibiotic use and antibiotic resistance and provides forecasts of resistance based on past antibiotic use and resistance data [27], [28]. Owing to the huge database in this study, this model was used to analyse both cefotaxime resistance in E. coli and ceftazidime resistance in P. aeruginosa. Our results clearly demonstrated the trends of worsening cefotaxime resistance in E. coli and favourable susceptibility in P. aeruginosa to ceftazidime in the next 6 years.
In conclusion, this 13-year study in a hospital demonstrated that significant changes in antimicrobial use might have affected antimicrobial resistance in certain Gram-negative bacteria at the hospital. The changes could have been due to several other factors, most likely in conjunction with one another. Dissemination and feedback of these data to clinicians and decision-makers at the hospital is crucial to improve antibiotic prescribing and to implement effective infection control. More judicious use of antimicrobial agents will be necessary to limit this trend.
References
- 1.Archibald L., Phillips L., Monnet D. Antimicrobial resistance in isolates from inpatients and outpatients in the United States: increasing importance of the intensive care unit. Clin Infect Dis. 1997;24:211–215. doi: 10.1093/clinids/24.2.211. [DOI] [PubMed] [Google Scholar]
- 2.Flamm R.K., Weaver M.K., Thornsberry C. Factors associated with relative rates of antibiotic resistance in Pseudomonas aeruginosa isolates tested in clinical laboratories in the United States from 1999 to 2002. Antimicrob Agents Chemother. 2004;48:2431–2436. doi: 10.1128/AAC.48.7.2431-2436.2004. [DOI] [PMC free article] [PubMed] [Google Scholar]
- 3.Rhomberg P.R., Jones R.N., Sader H.S. Results from the Meropenem Yearly Susceptibility Test Information Collection (MYSTIC) Programme: report of the 2001 data from 15 United States medical centres. Int J Antimicrob Agents. 2004;23:52–59. doi: 10.1016/j.ijantimicag.2003.05.010. [DOI] [PubMed] [Google Scholar]
- 4.Sader H.S., Biedenbach D.J., Jones R.N. Global patterns of susceptibility for 21 commonly utilized antimicrobial agents tested against 48, 440 Enterobacteriaceae in the SENTRY Antimicrobial Surveillance Program (1997–2001) Diagn Microbiol Infect Dis. 2003;47:361–364. doi: 10.1016/s0732-8893(03)00052-x. [DOI] [PubMed] [Google Scholar]
- 5.Fridkin S.K., Steward C.D., Edwards J.R. Surveillance of antimicrobial use and antimicrobial resistance in United States hospitals: project ICARE phase 2. Project Intensive Care Antimicrobial Resistance Epidemiology (ICARE) hospitals. Clin Infect Dis. 1999;29:245–252. doi: 10.1086/520193. [DOI] [PubMed] [Google Scholar]
- 6.Hsueh P.R., Teng L.J., Chen C.Y. Pandrug-resistant Acinetobacter baumannii causing nosocomial infections in a university hospital, Taiwan. Emerg Infect Dis. 2002;8:827–832. doi: 10.3201/eid0808.020014. [DOI] [PMC free article] [PubMed] [Google Scholar]
- 7.Hsueh P.R., Chen M.L., Sun C.C. Antimicrobial drug resistance in pathogens causing nosocomial infections at a university hospital in Taiwan, 1981–1999. Emerg Infect Dis. 2002;8:63–68. doi: 10.3201/eid0801.000454. [DOI] [PMC free article] [PubMed] [Google Scholar]
- 8.Hsueh P.R., Liu Y.C., Yang D. Multicenter surveillance of antimicrobial resistance of major bacterial pathogens in intensive care units in 2000 in Taiwan. Microb Drug Resist. 2001;7:373–382. doi: 10.1089/10766290152773383. [DOI] [PubMed] [Google Scholar]
- 9.Karlowsky J.A., Jones M.E., Thornsberry C. Trends in antimicrobial susceptibilities among Enterobacteriaceae isolated from hospitalized patients in the United States from 1998 to 2001. Antimicrob Agents Chemother. 2003;47:1672–1680. doi: 10.1128/AAC.47.5.1672-1680.2003. [DOI] [PMC free article] [PubMed] [Google Scholar]
- 10.Nordmann P., Poirel L. Emerging carbapenemases in gram-negative aerobes. Clin Microbiol Infect. 2002;8:321–331. doi: 10.1046/j.1469-0691.2002.00401.x. [DOI] [PubMed] [Google Scholar]
- 11.Van Eldere J. Multicentre surveillance of Pseudomonas aeruginosa susceptibility patterns in nosocomial infections. J Antimicrob Chemother. 2003;51:347–352. doi: 10.1093/jac/dkg102. [DOI] [PubMed] [Google Scholar]
- 12.Allegranzi B., Luzzati R., Luzzani A. Impact of antibiotic changes in empirical therapy on antimicrobial resistance in intensive care unit-acquired infections. J Hosp Infect. 2002;52:136–140. doi: 10.1053/jhin.2002.1277. [DOI] [PubMed] [Google Scholar]
- 13.Fish D.N., Piscitelli S.C., Danziger L.H. Development of resistance during antimicrobial therapy: a review of antibiotic classes and patient characteristics in 173 studies. Pharmacotherapy. 1995;15:279–291. [PubMed] [Google Scholar]
- 14.Fluit A.C., Verhoef J., Schmitz F.J. Frequency of isolation and antimicrobial resistance of gram-negative and gram-positive bacteria from patients in intensive care units of 25 European university hospitals participating in the European arm of the SENTRY Antimicrobial Surveillance Program 1997–1998. Eur J Clin Microbiol Infect Dis. 2001;20:617–625. doi: 10.1007/s100960100564. [DOI] [PubMed] [Google Scholar]
- 15.Fridkin SK, Edwards JR, Tenover FC, Gaynes RP, McGowan Jr JE; Intensive Care Antimicrobial Resistance Epidemiology (ICARE) Project; National Nosocomial Infections Surveillance (NNIS) System Hospitals. Antimicrobial resistance prevalence rates in hospital antibiograms reflect prevalence rates among pathogens associated with hospital-acquired infections. Clin Infect Dis 2001;33:324–30. [DOI] [PubMed]
- 16.Gaynes R. The impact of antimicrobial use on the emergence of antimicrobial-resistant bacteria in hospitals. Infect Dis Clin North Am. 1997;11:757–765. doi: 10.1016/s0891-5520(05)70388-3. [DOI] [PubMed] [Google Scholar]
- 17.Gentry C., Flournoy D.J., Reinert R. Analysis of antimicrobial resistance among gram-negative bacilli and antimicrobial use in intensive care unit patients for 5 years in a Veterans Affairs medical center. Am J Infect Control. 2002;30:411–416. doi: 10.1067/mic.2002.124937. [DOI] [PubMed] [Google Scholar]
- 18.Loeffler J.M., Garbino J., Lew D. Antibiotic consumption, bacterial resistance and their correlation in a Swiss university hospital and its adult intensive care units. Scand J Infect Dis. 2003;35:843–850. doi: 10.1080/00365540310016646. [DOI] [PubMed] [Google Scholar]
- 19.Meyer E., Jonas D., Schwab F. Design of a surveillance system of antibiotic use and bacterial resistance in German intensive care units (SARI) Infection. 2003;31:208–215. doi: 10.1007/s15010-003-3201-7. [DOI] [PubMed] [Google Scholar]
- 20.Olson B., Weinstein R.A., Nathan C. Occult aminoglycoside resistance in Pseudomonas aeruginosa: epidemiology and implications for therapy and control. J Infect Dis. 1985;152:769–774. doi: 10.1093/infdis/152.4.769. [DOI] [PubMed] [Google Scholar]
- 21.Friedrich L.V., White R.L., Bosso J.A. Impact of use of multiple antimicrobials on changes in susceptibility of gram-negative aerobes. Clin Infect Dis. 1999;28:1017–1024. doi: 10.1086/514747. [DOI] [PubMed] [Google Scholar]
- 22.Gulbinovic J., Myrback K.E., Bytautiene J. Marked differences in antibiotic use and resistance between university hospitals in Vilnius, Lithuania, and Huddinge, Sweden. Microb Drug Resist. 2001;7:383–389. doi: 10.1089/10766290152773392. [DOI] [PubMed] [Google Scholar]
- 23.Garner J.S., Jarvis W.R., Emori T.G., Horan T.C., Hughes J.M. CDC definitions for nosocomial infections, 1988. Am J Infect Control. 1988;16:128–140. doi: 10.1016/0196-6553(88)90053-3. [Erratum. Am J Infect Control 1988;16:177] [DOI] [PubMed] [Google Scholar]
- 24.Anatomical Therapeutic Chemical (ATC) Classification Index with Defined Daily Doses (DDDs) for Plain Substances. Oslo, Norway: WHO Collaborating Center for Drug Statistics and Methodology; 2001.
- 25.National Committee for Clinical Laboratory Standards. Performance standards for antimicrobial disk susceptibility test; Approved Standards, eighth ed. M2-A7. Wayne, PA: NCCLS; 2002.
- 26.National Committee for Clinical Laboratory Standards. Performance standards for antimicrobial susceptibility testing: 13th Informational Supplement. M100-S13 (M7). Wayne, PA: NCCLS; 2003.
- 27.Mahamat A., Lavigne J.P., Fabbro-Peray P., Kinowski J.M., Daures J.P., Sotto A. Evolution of fluoroquinolone resistance among Escherichia coli urinary tract isolates from a French university hospital: application of the dynamic regression model. Clin Microbiol Infect. 2005;11:301–306. doi: 10.1111/j.1469-0691.2005.01098.x. [DOI] [PubMed] [Google Scholar]
- 28.Lopez-Lozano J.M., Monnet D.L., Yague A. Modelling and forecasting antimicrobial resistance and its dynamic relationship to antimicrobial use: a time series analysis. Int J Antimicrob Agents. 2000;14:21–31. doi: 10.1016/s0924-8579(99)00135-1. [DOI] [PubMed] [Google Scholar]
- 29.Bantar C., Vesco E., Heft C. Replacement of broad-spectrum cephalosporins by piperacillin–tazobactam: impact on sustained high rates of bacterial resistance. Antimicrob Agents Chemother. 2004;48:392–395. doi: 10.1128/AAC.48.2.392-395.2004. [DOI] [PMC free article] [PubMed] [Google Scholar]
- 30.Lesch C.A., Itokazu G.S., Danziger L.H. Multi-hospital analysis of antimicrobial usage and resistance trends. Diagn Microbiol Infect Dis. 2001;41:149–154. doi: 10.1016/s0732-8893(01)00296-6. [DOI] [PubMed] [Google Scholar]
- 31.Neuhauser M.M., Weinstein R.A., Rydman R. Antibiotic resistance among gram-negative bacilli in US intensive care units: implications for fluoroquinolone use. JAMA. 2003;289:885–888. doi: 10.1001/jama.289.7.885. [DOI] [PubMed] [Google Scholar]
- 32.Rice L.B., Eckstein E.C., DeVente J. Ceftazidime-resistant Klebsiella pneumoniae isolates recovered at the Cleveland Department of Veterans Affairs Medical Center. Clin Infect Dis. 1996;23:118–124. doi: 10.1093/clinids/23.1.118. [DOI] [PubMed] [Google Scholar]
- 33.Schwaber M.J., Cosgrove S.E., Gold H.S. Fluoroquinolones protective against cephalosporin resistance in gram-negative nosocomial pathogens. Emerg Infect Dis. 2004;10:94–99. doi: 10.3201/eid1001.020663. [DOI] [PMC free article] [PubMed] [Google Scholar]
- 34.Goldmann D.A., Huskins W.C. Control of nosocomial antimicrobial-resistant bacteria: a strategic priority for hospitals worldwide. Clin Infect Dis. 1997;24(Suppl. 1):S139–S145. doi: 10.1093/clinids/24.supplement_1.s139. [DOI] [PubMed] [Google Scholar]
- 35.MacDougall C., Powell J.P., Johnson C.K., Edmond M.B., Polk R.E. Hospital and community fluoroquinolone use and resistance in Staphylococcus aureus and Escherichia coli in 17 US hospitals. Clin Infect Dis. 2005;41:433–440. doi: 10.1086/432056. [DOI] [PubMed] [Google Scholar]
- 36.White R.L., Friedrich L.V., Mihm L.B. Assessment of the relationship between antimicrobial usage and susceptibility: differences between the hospital and specific patient-care areas. Clin Infect Dis. 2000;31:16–23. doi: 10.1086/313916. [DOI] [PubMed] [Google Scholar]
- 37.Ray G.T., Baxter R., DeLorenze G.N. Hospital-level rates of fluoroquinolone use and the risk of hospital-acquired infection with ciprofloxacin-nonsusceptible Pseudomonas aeruginosa. Clin Infect Dis. 2005;41:441–449. doi: 10.1086/431980. [DOI] [PubMed] [Google Scholar]
- 38.Warren D.K., Fraser V.J. Infection control measures to limit antimicrobial resistance. Crit Care Med. 2001;29(4 Suppl.):N128–N134. doi: 10.1097/00003246-200104001-00013. [DOI] [PubMed] [Google Scholar]