

Abstract
The transmission of infectious, yet vaccine-preventable, diseases is a typical complex social phenomenon, where the increasing level of vaccine update in the population helps to inhibit the epidemic spreading, which in turn, however, discourages more people to participate in vaccination campaigns, due to the “externality effect” raised by vaccination. We herein study the impact of vaccination strategies, pure, continuous (rather than adopt vaccination definitely, the individuals choose to taking vaccine with some probabilities), or continuous with randomly mutation, on the vaccination dynamics with a spatial susceptible-vaccinated-infected-recovered (SVIR) epidemiological model. By means of extensive Monte-Carlo simulations, we show that there is a crossover behavior of the final vaccine coverage between the pure-strategy case and the continuous-strategy case, and remarkably, both the final vaccination level and epidemic size in the continuous-strategy case are less than them in the pure-strategy case when vaccination is cheap. We explain this phenomenon by analyzing the organization process of the individuals in the continuous-strategy case in the equilibrium. Our results are robust to the SVIR dynamics defined on other spatial networks, like the Erdős–Rényi and Barabási–Albert networks.
1. Introduction
Throughout history, many diseases which had swept the whole globe, such as Black Death (Plague) and smallpox, are kept within limits by human. Vaccination plays a very important role against these terrible epidemic diseases. In 2002, Severe Acute Respiratory Syndromes, a newly and seriously disease, broke out and spread to all over the world very quickly [1], [2]. The pathogenesis was studied and the corresponding vaccine was developed by scientists and experts in a very short time [3], [4]. Recently, some scientists believe that the hope of universal influenza vaccines has become more tangible than ever before [5], [6], [7], [8].
It is commonly believed that the compulsory vaccination is difficult to be performed for some social factors, such as religious belief and human rights, etc. Some researches turn to study the dynamical behavior of voluntary vaccination program and present a series of significant results over the past few years [9], [10], [11], [12], [13], [14], [15], [16], [17], [18], [19], [20], [21], [22], [23], [24]. For example, Bauch et al. used game theory to explain the relationship between group interest and self-interest in smallpox vaccination policy [9], [10], [11] and found that voluntary vaccination was unlikely to reach the group-optimal level. Blower et al. found that universal long-term flu vaccine may not prevent severe epidemic [12], and then investigated the effect of voluntary vaccination on the prevalence of influenza based on minority game theory and showed that severe epidemics could not be prevented unless vaccination programs offer incentives [13], [14]. Chen et al. studied a SEIRS epidemic disease model with two profitless delays and vertical transmission, and analyzed the dynamics behaviors of the model under pulse vaccination [15], [16]. Zhang and Fu et al. proposed a game-theoretic model to study vaccination dynamics on classical networks, including well-mixed population, square lattice, Erdős–Rényi (ER) network and Barabási–Albert (BA) network [17], [18], [19]. They found that the population structure behaves as a ‘double-edged sword’ for public health. Zhang investigated the impact of the other-regarding behavior in individuals’ decision making about vaccination dynamics [21]. Recently, Wu and Zhang incorporated the impact of peer pressure into vaccination dynamics, and they found that the peer pressure is also a double-edged sword, which can strongly promote vaccination when its cost is below a critical value, but can strongly impede it if the critical value is exceeded [22].
In most previous studies, the vaccination strategy of every individual is assumed to be pure, i.e. either vaccinate or not vaccinate during the vaccination campaign [17], [18], [19], [20], [21], [22], [25]. As we know, there exists a critical vaccination level in the population such that: if the vaccine coverage is below the vaccination level, an epidemic will occur, otherwise epidemics will be prevented. Based on self-interest, a few studies consider that the action of vaccination is expressed in probability [12], [13], [14]. We call the two cases as pure-strategy case and continuous-strategy case. In the present work, we intend to study how the vaccination dynamics is affected by the two types of vaccination strategy. Our results presented below show that both the final vaccine coverage and the final epidemic size in the continuous-strategy case are less than that in the pure-strategy case in spatial network when the cost for vaccination is low. Furthermore, the impact of the strategy-mutation mechanism on dynamic behavior of epidemic spreading and vaccine coverage is also briefly investigated in the continuous-strategy case.
2. Model
Following previous studies [19], [20], we model the vaccination dynamics as a two-stage, vaccination-stage and epidemic spreading-stage, with a mutual feedback form (see Fig. 1 ). In the vaccination-stage, there is a vaccination campaign, each individual decides whether or not to get vaccinated. To get vaccinated will incur a cost and the vaccine gives perfect immunity to the infectious disease. The cost includes the immediate monetary cost for vaccine and the potential risk of vaccine side-effects. For the pure-strategy case, there are two strategies, to vaccinate or not to vaccinate. For simplicity and efficiency but without loss of generality, we focus on the discretization of continuous strategies in the continuous-strategy case, that is, the individual i can choose a strategy from a strategy set , where the value of denotes the vaccination probability of individual i [26] (we have checked that our results presented below remain the same when the vaccination probabilities of the individuals take continuous real values in the range ). In the epidemic spreading-stage, the epidemic strain infects an initial number of individuals (1‰ of the population size) and then spreads in the population according to the classical susceptible-infected-recovered (SIR) epidemiological model [27], [28], with per-day transmission rate r for each pair of susceptible-infected (SI) contact and recovery rate g for each infected (I) individual getting immune to the disease. The epidemic continues until there are no more newly infected individuals. At this moment, those unvaccinated and uninfected individuals are called free-riders, owning to the fact that they are successfully escaped from the spreading season and pay for nothing. Meanwhile, those unvaccinated and infected individuals incur a cost , which may account for disease complications, expenses for treatment, etc. The final epidemic size and the final vaccination level are decided by the rescaled parameter , whose value is restricted in the region of (otherwise, doing nothing would be better than getting vaccinated).
Fig. 1.
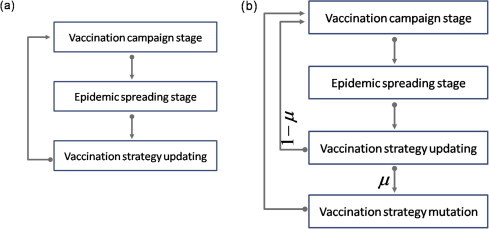
Schematic illustration of the simulation process of vaccination dynamics. The simulation process (a) applies to the pure-strategy case and the continuous-strategy without mutation case, and the simulation process (b) applies to the continuous-strategy with mutation case. is the mutation probability. More detailed description about vaccination-stage, epidemic spreading-stage, update, and mutation see article.
At the end of each epidemic spreading season (i.e., before the next two-stages for vaccination and disease spreading), all individuals will update their vaccination strategy by a Fermi function-like rule before the new epidemic season starts. The individual i chooses an individual j randomly from one’s immediate neighborhood to compare their cost (or payoff) and then adopts the vaccination strategy of j with a probability dependent on the payoff difference [29], [30], [31], [32]. Generally speaking, it would be more realistically that each individual adopts an averaged opinion on taking vaccination from his the nearest neighbors. For the sake of simplicity, in the current work we only consider the simplest case where each individual just updates his vaccination strategy by referring to a randomly chosen neighbor.
| (1) |
| (2) |
where and correspond to the payoffs of the two involved individuals, and denotes the strength of selection. Unless otherwise specified, we select , implying that better-performing individuals are readily imitated, but it is not impossible to adopt the behavior of an individual performing worse. What we are interested in this case is how many individuals are infected and the vaccination level in the final stable state.
We simulate the SIR processes on networks with Gillespie algorithm [33], [34]. The total Monte Carlo (MC) steps are varied from to to ensure an equilibrium state has been reached. In each MC step, all individuals update their strategies in a synchronous way. In the initial vaccination-stage of each independent run, all possible strategies, either in the pure-strategy case or in the continuous-strategy case, are randomly distributed throughout the population. After each epidemic spreading stage, individuals update their vaccination strategies according to Eq. (1). Unless explicitly stated, we fix from now on the total population size ( in square lattice), recovery rate , transmission rate 1 in well-mixed population, in square lattice, in ER network, and in BA network (we checked that our main findings do not depend on the specific choice of and r). The average degree of ER and BA networks are fixed as 4. Our key quantities are the final epidemic size and the final vaccination level which denoted by and respectively, where and are the average number of recovered and vaccinated individuals in the equilibrium state. In this study, we calibrate parameters so that the final epidemic size in different (either well-mixed or structured) populations will be the same when the vaccination compartment is absent in the population. The purpose is to compare the effect of different vaccination strategies on the prevalence of epidemics and the vaccine coverage when the vaccination compartment is introduced into the population. So, in our current work, the basic reproduction number is not our main concern.
3. Analysis and results
We first investigate how the vaccination dynamics changes with the cost for vaccination in both the pure-strategy case and the continuous-strategy case in lattice population. The results are summarized in Fig. 2 where several obvious differences in the final epidemic size and the final vaccination level in square lattice are observed. Firstly, in Fig. 2(a), there exists a value of c at which the final vaccination level in the pure-strategy case is equal to that in the continuous-strategy case, below which the vaccination level is smaller in the continuous-strategy case, while above it the opposite effect takes place. Secondly, in Fig. 2(b), the final epidemic size in the continuous-strategy case is less than that in the pure-strategy case for all c below the high cost threshold. 2 Combining these two aspects, we found an unexpected phenomenon that a lower level of vaccination in the population leads to a lower level of spreading of disease in the continuous-strategy case at low c. The qualitative properties of the results obtained for the vaccination dynamics in both the pure-strategy case and the continuous-strategy case on ER network and BA network are the same as the results on square lattice [Fig. 2(e)–(h)]. Noticeably, in well-mixed population, there is no difference between the pure-strategy case and the continuous-strategy case Figs. 2(c) and (d).
Fig. 2.
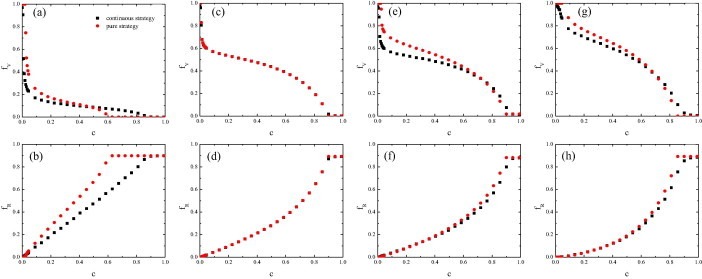
Vaccination dynamics in both the pure-strategy case and the continuous-strategy case. The top (bottom) panels show the final vaccination level (the final epidemic size ) as a function of the cost for vaccination c. (a) and (b) square lattice network; (c) and (d) well-mixed population; (e) and (f) ER network; (g) and (h) BA network. Simulation results are averaged over 100 independent runs.
In order to explain the above results, we show several typical snapshots for the pure-strategy case and the continuous-strategy case in the equilibrium state in Fig. 3 . It is remarkable that the vaccinated population is scattered in the continuous-strategy case and clustered in the pure-strategy case. It is clear that the vaccinated individuals in the inner part of the cluster of vaccinated individuals have no effect on the spread of infectious diseases (during the epidemic spreading-stage). For convenience, we called those individuals, whom are not vaccinated and have at least one vaccinated neighbor, as indirect beneficiaries whom pay for nothing but have decreased infected risk due to their vaccinated neighbors. By doing extensive statistics on the number of indirect beneficiaries for any c, we found that there are more indirect beneficiaries in the continuous-strategy case than those in the pure-strategy case. For example, at , indirect beneficiaries take up of the population in the continuous-strategy case in Fig. 3(b), vs. only in the pure-strategy case in Fig. 3(e). That is to say, although the vaccinated individuals are low, the area of influence (the number of indirect beneficiaries) is high in the continuous-strategy case. As a result, the final epidemic size in the continuous-strategy case is lower than that in the pure-strategy case. That is the reason for the unexpected phenomenon shown in Figs. 2(a) and (c). In the vaccination-stage, the indirect beneficiaries also play an important role, owing to the fact that only the indirect beneficiaries can transform into new vaccinated individuals in the next season. At the end of each spreading season, the indirect beneficiary will be two possible states (free-rider and infected). For small c, the free-riders are the majority of the population [see Figs. 3(a) and (d)]. From the Eq. (1), we know the vaccinated individuals are more likely to imitate the free-riders, and then transform into unvaccinated individuals in the next spreading season. Since the area of influence of vaccination is high in the continuous-strategy case, the vaccinated individuals change their strategy more likely than the vaccinated individuals in the pure-strategy case. Consequently, the vaccination level in the continuous-strategy case is lower than that in the pure-strategy case. For high c, the majority of the population are infected individuals [see Figs. 3(c) and (f)]. The infected individuals are more likely to imitate the vaccinated individuals, and then transform into vaccinated individuals.
Fig. 3.
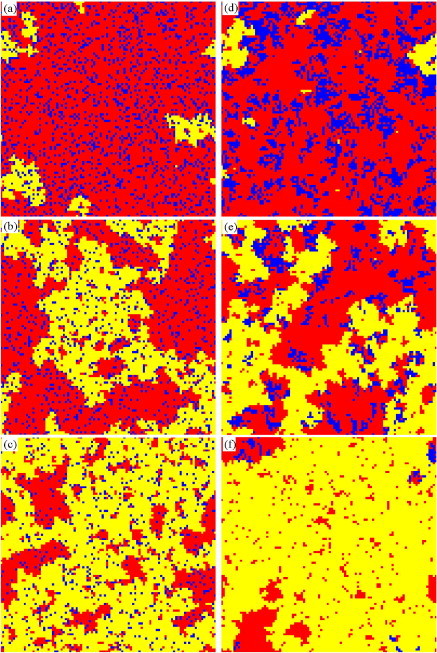
Typical snapshots of the state configuration in the square lattice population in the equilibrium state. Left panels are in the continuous-strategy case and taken at MC step, while the right ones are in the pure-strategy case and taken at MC step. Blue (black) denotes for vaccinated individuals, red (gray) for successful free-riders, and yellow (white) for infected individuals, respectively. The cost for vaccination , 0.3, 0.6 from up panels to down panels. (For interpretation of the references to colour in this figure legend, the reader is referred to the web version of this article.)
In the well-mixed population, it is almost impossible that an individual is surrounded by all vaccinated neighbors. In other words, every vaccinated individual will affect the spread of infectious diseases. Secondly, the area of influence is the same for both the continuous-strategy case and the pure-strategy case. So, there is no difference for the final epidemic size and the final vaccination level in the pure-strategy case and the continuous-strategy case in Figs. 2(c) and (d).
Most of the strategies from the strategy set will disappear when the system reach equilibrium state in a single imitation mechanism [Fig. 5 (a) and (d)]. Considering the diversity of choice in people, we incorporate strategy-mutation mechanism into the continuous-strategy case. We assume that the individuals may randomly choose a vaccination strategy again from the strategy set with probability , which is the mutation probability of the vaccination strategy, after using the Eq. (1) updating their vaccination strategy in every season [Fig. 1(b)]. Because the individuals with strategy mutation randomly choose a vaccination strategy from the strategy set, the possible vaccination strategies for the individuals are conservative. As shown in Fig. 4 (a), there is a value of c, where the final vaccination level for different values of cross at , below which, the lower the mutation probability, the higher vaccination level, while above it the opposite effect takes place. How can we find the special value c? There are two kinds of people, those who experienced strategy mutation and those who don’t, in the whole population. The total vaccine coverage affected by the mutation probability is determined by the change of the number of the two kinds of people. If the proportion of vaccinated is the same among the individuals experienced strategy mutation and those did not, the total vaccine coverage will be independent on . As mentioned before, the individual needs to choose a vaccination strategy from the strategy set in the presence of strategy mutation, such that the average proportion of vaccinated among the individuals with strategy mutation is . If the average proportion of vaccinated individuals in the total population is , there is no difference for any value of mutation probability . So, we can find the value c under which the vaccination level is equal to in . Below the special value c, the vaccination level will be diminished by the individuals with strategy mutation for the vaccination level is greater than in . So, the lower the mutation probability, the higher vaccination level. In Fig. 4(b), we want to focus on the relationship between () in the stationary state for arbitrary c in [0, 1]. We show the relationship between the final vaccination level and the final epidemic size for the pure-strategy case, the continuous-strategy case without mutation and the continuous-strategy case with mutation when the value of c varies from 0 to 1. We can clearly see that the final epidemic size in the pure-strategy case is greater than that in the continuous-strategy case without mutation and the continuous-strategy case with mutation for all values of . The qualitative properties of the results obtained from the continuous-strategy case with mutation on ER network and BA network are the same as the results on square lattice (not shown here).
Fig. 5.
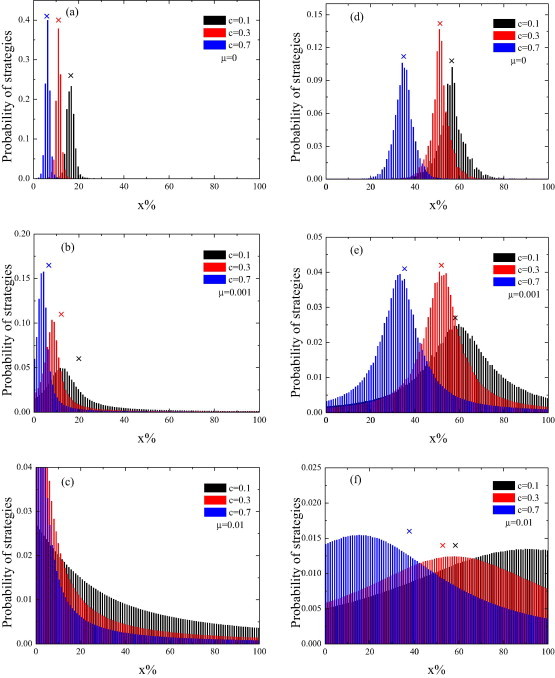
The distribution of vaccination strategy in the continuous-strategy case without mutation and the continuous-strategy case with mutation in square lattice (left panels) and ER network (right panels). The cross symbols are the average percentage of vaccination for the corresponding cost for vaccination c and mutation probability . Simulation results are averaged over 2000 independent runs.
Fig. 4.
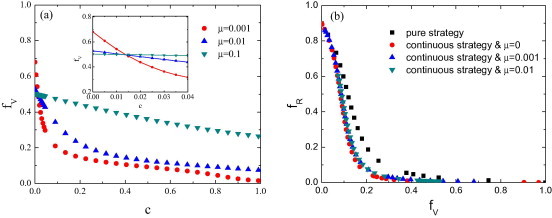
Vaccination dynamics in the continuous-strategy case with mutation in lattice population. (a) The final vaccination level as a function of the cost for vaccination c for several different mutation probabilities . The inset in panel (a) shows a enlargement of crossover behavior. (b) The relationship between the final vaccination level and the final epidemic size in the region of . Simulation results are averaged over 100 independent runs.
Finally, we study the distribution of vaccination strategy for several different c in both the continuous-strategy case without mutation and the continuous-strategy case with mutation. The results are presented in Fig. 5, from which we can see that the peak value is almost identical to the average percentage of vaccination Fig. 5(a), (c) and (d). However, if the distribution of the strategies is truncated by the lower boundary, say , as reflected in Fig. 5(b), the peak value will deviate somewhat from the average percentage of vaccination. It is clearly that the distribution of the strategies in the continuous-strategy case with mutation is more widely than that in the continuous-strategy case without mutation. The strategy-mutation mechanism can effectively guarantee the reappearance of the strategies of vaccination. If the value of the peak is less than (c = 0.1, 0.3, 0.5 in the lattice population and c = 0.1 in the ER network), the peak will move to the left when the mutation probability increases. First, we assume that the population is in an equilibrium state of non-mutation mechanism. In this moment, we incorporate strategy-mutation mechanism to the population. As mentioned before, the average proportion of vaccinated among the individuals with strategy mutation is . That is to say, the equilibrium state will be broken. Due to the self-interest, the rest of people will decrease the vaccination probability to reach a new equilibrium state. So, we obtain that the total vaccine coverage is increasing [Fig. 4(a)] and the peak will move to the left [Fig. 5(a)–(c)] if the value of the peak is less than (the total vaccine coverage is less than ). If the value of the peak is greater than (c = 0.7 in the ER network), the peak will move to the right when the mutation probability increases. If the value of the peak is approximately equal to (c = 0.3 in the ER network), the peak will nearly the same when the mutation probability increases.
4. Conclusion
In summary, considering the self-interest and the critical vaccination level, we have studied how the vaccination dynamics are affected by the continuous-strategy case. We have shown that, in spatial network, there is a crossover behavior of the final vaccination level between the pure-strategy case and the continuous-strategy case, and very interesting, both the final vaccination level and the final epidemic size in the continuous-strategy case are less than that in the pure-strategy case in low cost for vaccination c. We explain these results by analyzing the characteristic spatial distribution of states of the individuals in the equilibrium state. The size of the cluster of vaccinated individuals is smaller in the continuous-strategy case than that in the pure-strategy case for each given value of c, so the area of influence of vaccination or the number of indirect beneficiaries (not vaccinated and have at least one vaccinated neighbor) in the continuous-strategy case is more effective than that in the pure-strategy case. In addition, we have incorporated strategy-mutation mechanism into the continuous-strategy case. We have shown that the final vaccination level will cross at with different mutation probability . We explain the reason that the crossing point is determined by the average vaccination level of the individuals with strategy mutation. By analyzing the macroscopic features of the vaccination dynamics as well as strategy-mutation mechanism in the continuous-strategy case, we have provided further insights as to how the consideration of different vaccination strategies changes the final epidemic size and the final vaccine coverage.
Acknowledgment
This work was supported by the National Natural Science Foundation of China (Grant Nos. 11005051, 11005052, and 11135001).
Footnotes
For the sake of comparison, the value of r is calibrated to guarantee the same final epidemic size in different networks in the absence of vaccination.
No one chooses vaccination and the epidemic size reaches its maximum size when c is above the high cost threshold [18].
Contributor Information
Zhi-Xi Wu, Email: wuzhx@lzu.edu.cn.
Jian-Yue Guan, Email: guanjy@lzu.edu.cn.
References
- 1.He J.-F. Molecular evolution of the sars coronavirus during the course of the sars epidemic in china. Science. 2004;303:1666–1669. doi: 10.1126/science.1092002. [DOI] [PubMed] [Google Scholar]
- 2.Colizza V., Barrat A., Barthelemy M., Vespignani A. Predictability and epidemic pathways in global outbreaks of infectious diseases: the sars case study. BMC Med. 2007;5:34. doi: 10.1186/1741-7015-5-34. [DOI] [PMC free article] [PubMed] [Google Scholar]
- 3.Gao W., Tamin A., Soloff A., D’Aiuto L., Nwanegbo E., Robbins P.D., Bellini W.J., Barratt-Boyes S., Gambotto A. 554. a candidate sars-associated coronavirus vaccine elicits broad immunity in monkeys. Mol Ther. 2004;9:S208. doi: 10.1016/S0140-6736(03)14962-8. [DOI] [PMC free article] [PubMed] [Google Scholar]
- 4.Yang Z.-Y., Werner H.C., Kong W.-P., Leung K., Traggiai E., Lanzavecchia A., Nabel G.J. Evasion of antibody neutralization in emerging severe acute respiratory syndrome coronaviruses. Proc Natl Acad Sci USA. 2005;102:797–801. doi: 10.1073/pnas.0409065102. [DOI] [PMC free article] [PubMed] [Google Scholar]
- 5.Du L., Zhou Y., Jiang S. Research and development of universal influenza vaccines. Microbes Infect. 2010;12:280–286. doi: 10.1016/j.micinf.2010.01.001. [DOI] [PubMed] [Google Scholar]
- 6.Chen G.L., Subbarao K. Attacking the flu: neutralizing antibodies may lead to ’universal’ vaccine. Nat Med. 2009;15:1251–1252. doi: 10.1038/nm1109-1251. [DOI] [PMC free article] [PubMed] [Google Scholar]
- 7.Fiers W., Filette M.D., Bakkouri K.E., Schepens B., Roose K., Schotsaert M., Birkett A., Saelens X. M2e-based universal influenza a vaccine. Vaccine. 2009;27:6280–6283. doi: 10.1016/j.vaccine.2009.07.007. [DOI] [PubMed] [Google Scholar]
- 8.Sui J., Hwang W., Perez S., Wei G., Aird D., Chen L., Santelli E., Stec B., Cadwell G., Ali M. Structural and functional bases for broad-spectrum neutralization of avian and human influenza a viruses. Nat Struct Mol Biol. 2009;16:265–273. doi: 10.1038/nsmb.1566. [DOI] [PMC free article] [PubMed] [Google Scholar]
- 9.Bauch C.T., Galvani A.P., Earn D.J.D. Group interest versus self-interest in smallpox vaccination policy. Proc Natl Acad Sci USA. 2003;100:10564–10567. doi: 10.1073/pnas.1731324100. [DOI] [PMC free article] [PubMed] [Google Scholar]
- 10.Bauch C.T. Imitation dynamics predict vaccinating behaviour. Proc R Soc London Ser B. 2005;272:1669–1675. doi: 10.1098/rspb.2005.3153. [DOI] [PMC free article] [PubMed] [Google Scholar]
- 11.Bauch C.T., Earn D.J.D. Vaccination and the theory of games. Proc Natl Acad Sci USA. 2004;101:13391–13394. doi: 10.1073/pnas.0403823101. [DOI] [PMC free article] [PubMed] [Google Scholar]
- 12.Vardavas R., Breban R., Blower S. A universal long-term flu vaccine may not prevent severe epidemics. BMC Res Notes. 2010;3:92. doi: 10.1186/1756-0500-3-92. [DOI] [PMC free article] [PubMed] [Google Scholar]
- 13.Vardavas R., Breban R., Blower S. Can influenza epidemics be prevented by voluntary vaccination? PLOS Comput Biol. 2007;3:e85. doi: 10.1371/journal.pcbi.0030085. [DOI] [PMC free article] [PubMed] [Google Scholar]
- 14.Breban R., Vardavas R., Blower S. Mean-field analysis of an inductive reasoning game: application to influenza vaccination. Phys Rev E. 2007;76:031127. doi: 10.1103/PhysRevE.76.031127. [DOI] [PubMed] [Google Scholar]
- 15.Pang G., Chen L. A delayed {SIRS} epidemic model with pulse vaccination. Chaos Solitons Fractals. 2007;34:1629–1635. [Google Scholar]
- 16.Meng X., Jiao J., Chen L. Two profitless delays for an {SEIRS} epidemic disease model with vertical transmission and pulse vaccination. Chaos Solitons Fractals. 2009;40:2114–2125. [Google Scholar]
- 17.Zhang H., Zhang J., Zhou C., Small M., Wang B. Hub nodes inhibit the outbreak of epidemic under voluntary vaccination. New J Phys. 2010;12:023015. [Google Scholar]
- 18.Fu F., Rosenbloom D.I., Wang L., Nowak M.A. Imitation dynamics of vaccination behaviour on social networks. Proc R Soc London Ser B. 2011;278:42–49. doi: 10.1098/rspb.2010.1107. [DOI] [PMC free article] [PubMed] [Google Scholar]
- 19.Zhang H., Fu F., Zhang W., Wang B. Rational behavior is a double-edged swordwhen considering voluntary vaccination. Phys A. 2012;391:4807–4815. [Google Scholar]
- 20.Liu X.-T., Wu Z.-X., Zhang L. Impact of committed individuals on vaccination behavior. Phys Rev E. 2012;86:051132. doi: 10.1103/PhysRevE.86.051132. [DOI] [PubMed] [Google Scholar]
- 21.Zhang Y. The impact of other-regarding tendencies on the spatial vaccination game. Chaos Solitons Fractals. 2013;56:209–215. [Google Scholar]
- 22.Wu Z.-X., Zhang H.-F. Peer pressure is a double-edged sword in vaccination dynamics. EPL (Europhys Lett) 2013;104:10002. [Google Scholar]
- 23.Wu B., Fu F., Wang L. Imperfect vaccine aggravates the long-standing dilemma of voluntary vaccination. PLoS ONE. 2011;6(6):e20577. doi: 10.1371/journal.pone.0020577. [DOI] [PMC free article] [PubMed] [Google Scholar]
- 24.Xia S., Liu J. A computational approach to characterizing the impact of social influence on individuals vaccination decision making. PLoS ONE. 2013;8(4):e60373. doi: 10.1371/journal.pone.0060373. [DOI] [PMC free article] [PubMed] [Google Scholar]
- 25.Cardillo A., Reyes-Suárez C., Naranjo F., Gómez-Gardeñes J. Evolutionary vaccination dilemma in complex networks. Phys Rev E. 2013;88:032803. doi: 10.1103/PhysRevE.88.032803. [DOI] [PubMed] [Google Scholar]
- 26.Xu Z., Zhi H., Zhang L. Survival via cooperation in the prisoner’s dilemma game. Phys Rev E. 2011;84:051114. doi: 10.1103/PhysRevE.84.051114. [DOI] [PubMed] [Google Scholar]
- 27.Anderson R.M., May R.M. Oxford University Press; Oxford: 1991. Infectious diseases of humans: dynamics and control. [Google Scholar]
- 28.Keeling M.J., Rohani P. Princeton University Press; Princeton: 2008. Modeling infectious diseases in humans and animals. [Google Scholar]
- 29.Zhang G.-Q., Sun Q.-B., Wang L. Noise-induced enhancement of network reciprocity in social dilemmas. Chaos Solitons Fractals. 2013;51:31–35. [Google Scholar]
- 30.Liu X.-S., Guan J.-Y., Wu Z.-X. Effects of limited interactions between individuals on cooperation in spatial evolutionary prisoner’s dilemma game. Chaos Solitons Fractals. 2013;56:106–112. [Google Scholar]
- 31.Perc M., Grigolini P. Collective behavior and evolutionary games – an introduction. Chaos Solitons Fractals. 2013;56:1–5. [Google Scholar]
- 32.Cai C.-R., Wu Z.-X., Guan J.-Y. Behavior of susceptible-vaccinated-infected-recovered epidemics with diversity in the infection rate of individuals. Phys Rev E. 2013;88:062805. doi: 10.1103/PhysRevE.88.062805. [DOI] [PubMed] [Google Scholar]
- 33.Gillespie D.T. A general method for numerically simulating the stochastic time evolution of coupled chemical reactions. J Comput Phys. 1976;22:403–434. [Google Scholar]
- 34.Gillespie D.T. Exact stochastic simulation of coupled chemical reactions. J Phys Chem. 1977;81:2340–2361. [Google Scholar]