

Abstract
Bismuth compounds have been widely used for the treatment of ulcers and Helicobacter pylori infection, and enzyme inhibition was thought to be crucial for bismuth anti-microbial activity. We have investigated the interaction of colloidal bismuth subcitrate (CBS) with alcohol dehydrogenase and our results demonstrate that bismuth can effectively inhibit the enzyme. Kinetic analysis revealed that CBS acted as a non-competitive inhibitor of yeast alcohol dehydrogenase. Both UV–vis and fluorescence data show that interaction of CBS with the enzyme exhibits biphasic processes. Bismuth can replace only half of Zn(II) from the enzyme (i.e., about one Zn(II) per monomer). Surprisingly, binding of CBS also induces the enzyme dissociation from its native form, tetramer into dimers. The inhibition of Bi(III) on the enzyme is probably due to its direct interference with the zinc sites. This study is likely to provide an insight into the mechanism of action of bismuth drugs.
Keywords: Alcohol dehydrogenase, Bismuth, Inhibition, Mechanism of action
1. Introduction
Bismuth compounds such as bismuth subsalicylate (BSS) and colloidal bismuth subcitrate (CBS) have been widely used for the treatment of gastrointestinal disorders for several decades [1], [2], [3], [4], [5], [6], [7]. Helicobacter pylori (H. pylori), a gram-negative micro-aerophilic bacterium, is believed to be the major cause of gastritis and contributes to the pathogenesis of peptic ulcer disease. The effectiveness of bismuth has been attributed to its bactericidal action against H. pylori. Enzyme inhibition is thought to play an important role in the action of bismuth containing drugs. The mechanism by which bismuth inhibits the growth of H. pylori is still not well understood. It has been demonstrated previously that bismuth drugs can inhibit cytosolic alcohol dehydrogenase (ADH) from H. pylori [8], [9], [10]. ADHs are zinc metalloenzymes that catalyze the oxidation of alcohols to aldehydes or ketones:
| R-CH2-OH+NAD+ →ADH R-CHO+NADH+H+ |
where NAD+/NADH are coenzymes (NAD, nicotinamide adenine dinucleotide; NADH, reduced nicotinamide adenine dinucleotide).
H. pylori contains cytosolic ADH which is capable of producing acetaldehyde, which can form adducts with phospholipids and proteins, from exogenous and endogenous ethanol [11], [12], [13]. Acetaldehyde–protein adducts could further inhibit protein secretion, displace pyridoxal phosphate from its binding sites in proteins or impair some biological functions of enzymes [14], [15], [16]. The acetaldehyde–protein adduct may form in gastric mucosa and would subsequently interfere with the mucosal defense factors that cause gastrointestinal morbidity. The inhibition of ADH by bismuth drugs has been shown to suppress the production of acetaldehyde, which is toxic to mucosal cells [10].
Similar to H. pylori ADH, yeast alcohol dehydrogenase (YADH, EC1.1.1.1) is a tetrameric enzyme with a molecular mass of 150 kDa. Each subunit contains two zinc ions with one zinc ion located at the active site and bound to two cysteines (Cys46, Cys174), and one histidine (His67) and a water molecule [17]. The other zinc ion is bound to four cysteines (Cys97, Cys100, Cys103 and Cys111) and maintains the tertiary structure of the enzymes. The Zn(II) sites are conserved among ADHs from different species (Scheme 1 ). The inhibition of ADH by bismuth has been previously suggested [18]. However, little is known about the mechanism of inhibition [19]. In this paper, we have characterized the inhibition and interaction of ADH with the anti-ulcer agent bismuth citrate using baker's yeast ADH as a model for H. pylori ADH since both ADHs have the same active sites and relatively high sequence identity (47%).
Scheme 1.
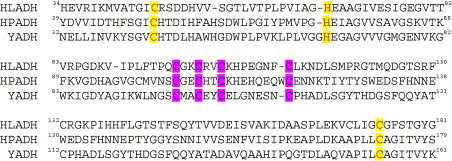
Sequence comparison of alcohol dehydrogenase from various sources, HLADH, horse liver alcohol dehydrogenase (gene code: M64864); HPADH, Helicobacter pylori alcohol dehydrogenase (gene code: JHP1429); YADH, yeast alcohol dehydrogenase (gene code: YOL086C). Those highlighted Cys and His residues are in either catalytic (light gray) or structural site (dark gray). (For a colour version of the figure see the online paper. Here light gray refers to yellow; dark gray refers to purple.)
2. Experimental procedures
2.1. Materials
Baker's yeast alcohol dehydrogenase (YADH, catalog no. A7011), nicotinamide adenine dinucleotide (NAD+, catalog no. N1511) and 5,5′-dithiobis(2-nitrobenzoic acid) (DTNB, catalog no. D8130) were purchased from Sigma. Bismuth subcitrate [Bi(Hcit)] was obtained from Aldrich, and was solubilized by addition of minimum amount of ammonia solution and diluted prior to use. All other reagents used were of analytical grade.
Enzyme concentration was determined spectrophotometrically from the absorbance at 280 nm using an absorption coefficient (ε 280) of 1.89 × 10⁵ M−1 cm−1 [20]. Enzyme activity was determined by the changes of initial rate of absorbance at 340 nm corresponding to the reduction of NAD+ to NADH as previously reported [21]. The concentrations of both NAD+ and NADH were determined spectrophotometrically using the extinction coefficients of 1.8 × 10⁴ and 6.22 × 10³ M−1 cm−1 at 260 and 340 nm, respectively [22]. All UV–vis spectra were recorded on a computer controlled Varian Cary50 spectrometer with thermostated cuvette holders at 298 K.
2.2. Methods
2.2.1. Selection of YADH and NAD+ concentrations
Solutions containing various concentrations of YADH (2.5 μl) were added to a solution containing 1.5 mM NAD+, 0.2 M ethanol (EtOH) and 20 mM tris(hydroxymethyl)aminomethane–HCl (Tris–HCl), pH 8.0 at 298 K. The initial reaction rate, V 0 was measured by UV–vis spectroscopy. The experiment showed that YADH concentration up to 3 nM can be used to ensure a kinetically controlled reaction sequence. Therefore, the enzyme concentration of 2.5 nM was chosen for all activity studies.
YADH was added to a solution containing different concentrations of NAD+, 0.2 M EtOH and 20 mM Tris–HCl at pH 8.0, 298 K. The final concentration of the enzyme in assay system was 2.5 nM. The initial rates (V 0) of the reaction were recorded at different concentrations of NAD+ ranging from 0.03 to 1 mM. The K m calculated from Lineweaver–Burk plots was found to be 0.106 mM. An NAD+ concentration should be of over 10 times of K m value, 1.5 mM was therefore used in all activity studies. Oxidation of ethanol by YADH requires NAD+ as a coenzyme. This two-substrate enzyme-catalyzed reaction obeys the Michaelis–Menten equation with respect to NAD+ at constant concentrations of the other substrate.
2.2.2. Stability of the enzyme and progress of inhibition
A solution of 0.5 μM YADH was incubated in the presence of 20 μM Bi(cit) (40 mol equiv) in 20 mM Tris–HCl at pH 8.0 and 298 K. At regular time intervals, an aliquot of mixtures was withdrawn and added to a solution containing 1.5 mM NAD+, 0.2 M alcohol (EtOH) and 20 mM Tris–HCl at 298 K, pH 8.0. The final volume is 1 ml and the enzyme concentration is 2.5 nM. The activity of the enzyme was assayed by monitoring the change of UV–vis spectrum at 340 nm. The same procedure was applied in the absence of Bi(cit) under identical conditions as a control experiment.
For all kinetic studies, plots of ln[(A ∞−A t)/(A ∞−A 0)] versus time were generated with the computer program Origin (6.0). The slope of the slower process yielded a pseudo-first-order rate constant. The line was extrapolated back to the y-axis. The value of the faster process subtracted from this line and the natural logarithm of the resultant differences were plotted versus time to define the other pseudo-first-order process. The data were also analyzed by a non-linear least-squares program based on exponential fits.
2.2.3. Inhibition study
A solution of 0.5 μM YADH was incubated in the presence of large excess of Bi(cit) in 20 mM Tris–HCl at pH 8.0 and 298 K for 5 min. An aliquot was withdrawn and added to a solution containing 1.5 mM NAD+, 0.2 M EtOH. The final enzyme concentration in assay system was 2.5 nM. The initial rates (V 0) of reaction were recorded at different concentrations of ethanol ranging from 5 to 50 mM. The K m and V max for uninhibited and inhibited reactions were obtained from Lineweaver–Burk plots
| 1V0=KmVmax·1[S]+1Vmax. |
2.2.4. Bi and YADH binding study
After equilibration for ∼10 min in the cuvette, 40 mol equiv of Bi(cit) (0.24 mM) was added to 6 μM YADH in 20 mM Tris–HCl at pH 8.0, 298 K. The course of the reaction was monitored up to 300 min by UV–vis spectroscopy.
2.2.5. Fluorescence spectroscopy
The experiment was performed on a Perkin–Elmer LS50B luminescence spectrometer. The excitation wavelength was at 295 nm. The exit slit was set to 4 nm. A solution of 0.5 μM YADH reacted with 20 μM Bi(cit) (40 mol equiv) in 20 mM Tris–HCl at pH 8.0, 298 K. The changes in emission intensities were obtained at regular time intervals. Each spectrum was corrected by blank subtraction, where 20 mM Tris–HCl at pH 8.0 was used as a blank.
2.2.6. Thiolate group analysis of YADH
The free thiolate content (SH) of YADH before and after reacting with Bi(cit) was determined by Ellman's method [23]. YADH was incubated with 100 mol equiv of Bi(cit) for 3 h at 298 K, in 20 mM Tris–HCl buffer, pH 8.0. A solution of 5,5′-dithiobis(2-nitrobenzoic acid) (DTNB) (10 mM) was added to the mixture. The final solution contained 2 μM YADH, 0.2 mM Bi(cit) and 1 mM DTNB. A DTNB solution (1 mM) was used as a blank. The reaction mixture and the blank were then incubated for further 120 min. The amount of generated p-nitrothiolate was determined using the extinction coefficient (ε 412) of 13,600 M−1 cm−1 [23].
2.2.7. Fast protein liquid chromatography study
A solution of 10 μM YADH was incubated with 40 mol equiv Bi(cit) (0.4 mM) in 100 mM Tris–HCl at pH 8.0, 298 K. At different time interval, 200 μl mixture was withdrawn and separated by fast protein liquid chromatography (FPLC) system. A gel filtration Superose 12 HR column (1 × 30 cm) connected to a Pharmacia Biotech FPLC system was used. A Tris–HCl buffer (100 mM, pH 8.0) was used as an elution solvent. Chromatograms were recorded by monitoring the absorbance at 280 nm with a UV detector. Elution rate was 0.5 ml min−1. Control experiments were performed in the absence of Bi(cit). The molecular mass calibration curve for the column was obtained by using bovine serum albumin (65 kDa), cytochrome C (12 kDa), vitamin B12 (1.3 kDa) and cytidine (0.2 kDa) as standards.
2.2.8. Determination of zinc release from ADH by inductively coupled plasma mass spectrometry
Solutions of 20 μM YADH were incubated with a different mol equiv of Bi(cit) in 100 mM Tris–HCl, pH 8.0 at 298 K for 2 h. The samples (200 μl) were injected into the column, and separated by FPLC system. A Tris–HCl buffer (100 mM, pH 8.0) was used as an elution solvent and subsequently the protein fraction collected were digested by 5% nitric acid, followed by dilution with 1% nitric acid. Thallium (207Tl) was added as an internal standard. The standard curve was obtained by measuring a set of zinc standards in 1% nitric acid.
The system was rinsed with 1% nitric acid for 5 min between each measurement to minimize memory effect. Zinc contents were measured on an Agilent 7500s inductively coupled plasma mass spectrometry (ICP-MS) with 207Tl as an internal standard and the measurement conditions were: forward rf power, 1210 W; carrier gas flow rate, 1.13 l min−1; intermediate gas flow rate, 1.10 l min−1; outer gas flow rate, 14 l min−1; sampling depth, 7 mm; element monitored, 209Bi, 207Tl, 65Zn.
3. Results
3.1. Stability of the enzyme and progress of inactivation
In the absence of other agents, YADH maintains its activity over 90% up to several hours at 298 K. However, in the presence of 40 mol equiv of Bi(cit), its activity decreased dramatically and was completely lost after 90 min. The inactivation process can be simulated by a pseudo-first-order reaction with a rate constant of 6.88 × 10⁻² min−1 and a half-life (t 1/2) of 10 min.
3.2. Inhibition study
The measured rate of ethanol oxidation catalyzed by YADH at different concentrations was shown in Fig. 1 . The kinetics of this reaction can be described by a Michaelis–Menten model. The K m and V max were calculated to be of 6.98 mM and 0.29 min−1, respectively, for the uninhibited reaction. Almost identical K m values were obtained in the presence of 80 and 320 mol equiv of Bi(cit) (Fig. 1). However, the V max decreased dramatically upon an increase in Bi(cit) concentration. The Lineweaver–Burk plots showed a typical pattern of non-competitive inhibition.
Fig. 1.

Lineweaver–Burk plots of the oxidation of ethanol catalyzed YADH, showing uninhibited and inhibited reactions. The assay system is comprised of 2.5 nM YADH and 1.5 mM NAD+ at 298 K, 20 mM Tris–HCl, pH 8.0. Km for uninhibited reaction (■) was found to be 6.98 mM. The value is similar in the presence of 80 (▴) and 320 (♦) mol equiv of Bi(cit).
3.3. Bi and YADH binding study
Previously it was shown that the interaction of Bi(cit) with either the tripeptide glutathione (gsh) and metallothionein leads to a new UV–vis absorption band centered at ca. 350 nm. This band was assigned as S− → Bi(III) ligand-to-metal charge transfer (LMCT) transitions due to Bi(III) binding to the thiolate ligand. Addition of 40 mol equiv of Bi(cit) to YADH also led to a gradual increase in a band at 350 nm. This band was used to monitor the progress of the reaction between Bi(cit) and YADH. The increase in absorbance at 350 nm with time was shown in Fig. 2 , and was characterized by an initial rapid increase in absorbance followed by a progressive increase for the duration of the reaction. The semilogarithmic plot of the data in the inset showed that two-kinetic steps could be resolved which obey first-order kinetics. The curve can therefore be fitted to a bi-exponential growth using the non-linear least square method (Fig. 2, inset)
| A(t)=A1exp(−k1t)+A2exp(−k2t), |
where k 1 and k 2 are the rate constants of the two kinetic phases, A 1 and A 2 are the corresponding amplitudes that show the contribution of the individual kinetic phases to the observed change in absorbance. The fast step completed within a few minutes with a rate constant of 0.33 min−1, and contributed to 38% of reaction, while the slow step represented the rest and had a kinetic constant of 5.5 × 10⁻² min−1.
Fig. 2.
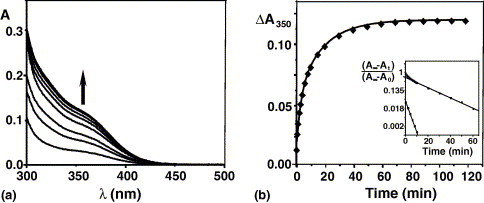
(a) Dependence of absorption spectrum on time for a solution containing YADH (6 μM) and 40 mol equiv of Bi(cit) in 20 mM Tris–HCl at pH 8.0, 298 K. The broad band centered at 350 nm is indicative of formation of Bi(III)-S (thiolate) bonds. Reaction times from bottom to top: 0, 2, 4, 6, 15, 20, 30, 60 and 300 min. (b) Kinetics of the reaction of Bi(III) to YADH at 350 nm. The dependence of absorption spectrum on time for a solution containing YADH (6 μM) and 40 mol equiv of Bi(cit) in 20 mM Tris–HCl at pH 8.0, 298 K. Inset: semilog plot of the data and secondary plot of the fast step with a rate constant of 0.33 min−1 and slow step with a rate constant of 5.5 × 10⁻² min−1.
3.4. Fluorescence spectroscopy
The progress of the reaction was also characterized by monitoring the changes in fluorescence. There are five tryptophan residues in each subunit of YADH, which contribute to the intrinsic fluorescence at 340 nm [24]. The fluorescence emission intensity decreased significantly after addition of Bi(cit), suggesting that conformational changes occurred upon Bi(III) binding. Fluorescence emission spectra of YADH at 340 nm in the presence of 40 mol equiv of Bi(cit) at different time were shown in Fig 3 , and the fluorescence intensity (at 340 nm) decreased by nearly 70% after 60 min. The decrease in intensity of YADH versus time was again in a biphasic processes and can be fitted by a two-exponential function (Fig. 3, inset). The first step had a rate constant of 0.73 min−1 (50%) while the second step of 7.7 × 10⁻² min−1. The rates are slightly higher than the corresponding values obtained from UV–vis spectroscopy.
Fig. 3.

(a) Dependence of fluorescence emission spectrum on time for a solution containing YADH (0.5 μM) and 40 mol equiv of Bi(cit) in 20 mM Tris–HCl at pH 8.0, 298 K with an excitation wavelength of 295 nm. The fluorescence emission intensity was significantly quenched after addition of Bi(cit). Reaction times from top to bottom: 0, 1, 2, 3, 4, 5, 6, 7, 8, 9, 10, 20, 30, 40, 50, 60, 80, 100 and 120 min. (b) Dependence of fluorescence emission intensity at 340 nm on time. The assay solution contained YADH (0.5 μM) and 40 mol equiv of Bi(cit) in 20 mM Tris–HCl at pH 8.0, 298 K with excitation wavelength of 295 nm. Inset: semilog plot of the data and secondary plot of the fast step with a rate constant of 0.73 min−1 and slow step with a rate constant of 7.7 × 10⁻² min−1.
3.5. Thiolate group analysis of YADH
In order to investigate whether Bi(III) binds to free Cys residues of YADH, free thiolate contents were determined using 5,5′-dithiobis(2-nitrobenzoic acid) (DTNB). There are totally 36 free Cys residues in each YADH subunit after treatment with dithiolthreitol (DTT) [25] and there are 20 free SH groups in the native enzyme. After incubation with 100 mol equiv Bi(cit) for 180 min at pH 8.0, 298 K, the number of free thiolate groups was determined to be 16. Therefore, there is one free thiol group loss in each subunit of YADH compared to its intact form. Precipitation was observed in solution of YADH when Cys residues were blocked by iodoacetamide under the conditions used, which prevented a further study.
3.6. Fast protein liquid chromatography study
It is known that metal ions affect signal transduction and protein–protein interaction [26], [27]. We performed this experiment and aimed to find out whether Bi(III) interferes with the quaternary structure of the native YADH. After loading YADH solution into the column, a major and a minor peak were observed at 23.5 and 27.0 min, respectively. The major component corresponds to a 150 kDa species based on the mass calibration curve, while the minor peak to a component with a molecular mass about 37.5 kDa. Therefore, they can be assigned to the tetramer and monomer of YADH, respectively. After incubation with Bi(cit) at different times, the peak with a retention time of 23.5 min decreased in its intensity dramatically, Fig. 4 . While a new peak at 25.0 min appeared and gradually increased in its intensity. This peak corresponds to a species with a molecular mass of about 75 kDa. In contrast, the peak area (integration) corresponding to the monomer remained almost unchanged during the reaction, Fig. 5 . This suggests that tetrameric YADH dissociates into a dimer (D), presumably due to the binding of Bi(III) to the enzyme.
Fig. 4.

FPLC profiles of YADH after incubation with Bi(cit) at different time. A solution of 10 μM YADH was incubated with 40 mol equiv of Bi(cit) in 0.1 M Tris–HCl, pH 8.0. At different time interval 200 μl mixture was separated by FPLC. From bottom to top, native YADH, incubation after 1, 40, 90 and 120 min, respectively. T – tetramer, D – dimer, M – monomer.
Fig. 5.

Time dependence of peak areas obtained from FPLC chromatograms. YADH (10 μM) and 40 mol equiv of Bi(cit) were incubated in 20 mM Tris–HCl at pH 8.0, 298 K. At regular time interval, the solution was withdrawn and separated by FPLC. The tetramer peak area (■) gradually decreased while the dimer peak area (•) gradually increased. The monomer peak area (♦) remained almost unchanged.
3.7. Determination of zinc release from ADH by inductively coupled plasma mass spectrometry
The zinc ions in the yeast ADH are coordinated to cysteine and histidine residues which are essential for both the catalytic and the structural roles. Interaction of Bi(III) could disrupt the Zn(II)/thiol site(s) and therefore inactive the enzyme. YADH solutions in the presence of various mol equiv of Bi(cit) were separated from low molecular mass molecules by gel filtration chromatography. Both Bi(III) and Zn(II) contents in the enzyme fractions were determined subsequently by ICP-MS. The enzyme in the absence of Bi(III) was used as a control and the zinc content was determined to be 2.03 ± 0.04 per ADH monomer. An inverse correlation was found between Bi(III) and Zn(II), i.e., the higher the Bi(III) added into the ADH, the lower the Zn(II) associated with the enzyme. However, it was found that almost no further decreases in Zn(II) content and increases in Bi(III) after 0.88 zinc per ADH monomer was displaced by Bi(III), even addition of 40 mol equiv of Bi(cit) in the enzyme solution (Supplementary Figures ). 1 The final Bi versus Zn ratio was found to be 1.14:1.22(±0.05). These data suggest that the inhibitory effect of Bi(III) is mainly due to its disruption of zinc/thiol site(s).
Back ground data figure.
Back ground data figure
4. Discussion
In spite of extensive use of bismuth in medicine particularly as anti-ulcer drugs [2], [3], the mechanism of action of bismuth still remains not clear. Enzyme inhibition and bismuth–protein interaction appear to play a crucial role for bismuth anti-microbial activities. As a borderline metal ion, Bi(III) binds strongly to thiolate sulphur and oxygen, and can readily form stable complexes with thiolate-containing biomolecules such as, cysteine (and N-acetyl-l-cysteine), the tripeptide glutathione (GSH), and the cysteine-rich proteins metallothionein (MT) and metalloregulatory protein Cadc from Staphylococcus aureus [28], [29], [30]. The Bi–metallothionein complex is stable even at highly acidic conditions (pH ∼ 1). The gradual increase in absorbance at ∼350 nm upon addition of Bi(III) into YADH solution suggests that Bi(III) binds to the thiolate group of YADH, either to free cysteines or those bound at the Zn(II) sites. The thiolate content determined by DTNB confirmed the decrease in thiol groups (–SH) by one per ADH monomer. Our ICP-MS study on intact YADH and in the presence of Bi(III) (separated by FPLC) showed an inverse correlation between Bi(III) and Zn(II), i.e., the more the Bi(III) added into the YADH solution, the lower the concentration of Zn(II) associated with the enzyme (and the higher the concentration of Bi(III) associated with YADH), until about one zinc(II) was replaced by Bi(III) per ADH subunit. This indicates that the binding of bismuth to thiolates group(s) subsequently leads to the replacement of Zn(II) by the metal. Zinc release, as monitored by ICP-MS, coincided with activity loss induced by increasing amounts of Bi(cit). Therefore, the mechanism of Bi(III) inhibition on YADH is probably due to its direct interference with Zn(II) sites. Since Bi(III) acts as a non-competitive inhibitor of ADH, only the structural Zn(II) with four cysteine residues bound is likely to be replaced by the metal. Recently we have showed that Bi(III) complexes effectively inhibit SARS coronavirus helicase (IC50 ∼ 0.4 μM), again probably via interference with zinc sites in the N-terminus [31], which serves as a common feature for Bi(III).
It has previously been shown that inhibition of the ADH occurs before noticeable conformational changes of the enzymes as a whole can be detected during denaturation by guanidine, urea or sodium dodecyl sulfate (SDS) in some enzymes [32], [33], [34]. It was suggested that active sites are usually situated in enzyme where is formed by relatively weak molecular interactions so that they are more fragile to denaturants than the structural sites [35]. Our experimental data showed that Bi(III) significantly quenches the fluorescence of the enzyme with rates slightly higher than those of Bi(III) binding to YADH. The changes in fluorescence are probably due to the changes of protein conformations. This suggested that conformational changes first followed by inhibition of the enzymes.
Interestingly, the binding of Bi(III) also induces enzyme dissociation from a tetramer into dimers (Fig. 4). It is known that the active form of YADH is its tetramer and both its dimer and monomer are inactive [36]. Bi(III) induced YADH dissociation suggested that YADH denatured into dimeric intermediates and finally through its structural collapse in its monomers. The relative stability of the dimer indicated that YADH could be described as a “tetramer of dimers” with two identical interfaces. Previous study has demonstrated that an alcohol dehydrogenase from Kluyveromyces lactis (KlADHs) lost its activity once dissociated from structural active tetramer to a monomer and followed by complete unfolding with addition of more denaturant agent, guanidinium chloride [37]. Bi(III) regulated protein–protein interaction is probably a novel mechanism of action and could be attributed to the binding of Bi(III) to residues (e.g., Cys) on the protein interfaces which further prevents the protein–protein interaction. Surprisingly, the dissociation process causes little secondary structural changes of the enzyme as reflected from CD study (data not shown).
In summary, the work presented here shows that Bi(cit) can effectively inhibit YADH activity. Bi(III) binds to thiolate groups of YADH as it has a high affinity for thiolate sulphur. Both binding of Bi(III) to thiolate groups and the conformational change reflected by fluorescence data exhibited biphasic kinetics. YADH also gradually dissociated from native form tetramer to dimers in the presence of Bi(III). Inhibition of YADH was accompanied by binding to Bi(III) and replacement of about one zinc per monomer. Since Bi(III) inhibition of YADH is via a non-competitive mode, Zn(II) at the structural site with four Cys coordinated is likely to be replaced. As H. pylori ADH has the conserved zinc binding sites and a high sequence identity (47%) with YADH (Scheme 1), the inhibition of Bi(cit) on HPADH is probably via a similar way. It would be of interest for future work to investigate the inhibition of H. pylori ADH directly by bismuth compounds.
5. Abbreviations
- ADH
alcohol dehydrogenase
- Bi(cit)
bismuth subcitrate (Bi(Hcit)) solubilized by dilute ammonia (Bi3+:citrate=1:1)
- DTNB
5,5′-dithiobis(2-nitrobenzoic acid)
- FPLC
fast protein liquid chromatography
- gsh
glutathione
- H. pylori
Helicobacter pylori
- ICP-MS
inductively coupled plasma mass spectrometry
- LMCT
ligand-to-metal charge transfer
- MT
metallothionein
- Tris–HCl
tris(hydroxymethyl)aminomethane–HCl buffer (pH 7.1–8.9)
Acknowledgements
This work was supported by Livzon Pharmaceutical Ltd., Area of Excellence Scheme of University Grants Committee (Hong Kong) and the University of Hong Kong. The ICP-MS used in this work was purchased using funds from Generic Drug Research Program at the University of Hong Kong. We thank the University of Hong Kong for a postgraduate studentship for K. Szeto.
Footnotes
Supplementary data associated with this article can be found, in the online version, at doi:10.1016/j.jinorgbio.2004.03.016.
For supplementary data see the online version of this paper.
References
- 1.Reglinski J. Environmental and medicinal chemistry of arsenic, antimony, and bismuth. In: Norman N.C., editor. Chemistry of Arsenic, Antimony and Bismuth. Blackie Academic & Professional; London, UK: 1998. pp. 403–440. [Google Scholar]
- 2.Lambert J.R., Midolo P. Aliment. Pharmacol. Ther. 1997;11(Suppl. 1):27–33. doi: 10.1046/j.1365-2036.11.s1.13.x. [DOI] [PubMed] [Google Scholar]
- 3.Baxter G.F. Pharm. J. 1989;243:805–810. [Google Scholar]
- 4.Sun H., Zhang L., Szeto K.Y. Metal Ions Biol. Syst. 2004;41:333–378. [PubMed] [Google Scholar]
- 5.Sun H. Metallodrug. In: Grant G.D., Harris R.K., editors. Encyclopedia of Nuclear Magnetic Resonance: Advances in NMR. Wiley; UK: 2002. pp. 413–427. [Google Scholar]
- 6.Sun H., Sadler P.J. Top. Biol. Inorg. Chem. 1999;2:159–186. [Google Scholar]
- 7.Briand G.G., Burford N. Chem. Rev. 1999;99:2601–2658. doi: 10.1021/cr980425s. [DOI] [PubMed] [Google Scholar]
- 8.Blaser M.J. Gastroenterology. 1992;102:720–727. doi: 10.1016/0016-5085(92)90126-j. [DOI] [PubMed] [Google Scholar]
- 9.Roine R.P., Salmela K.S., Hooknidanne J., Kosunen T.U., Salaspuro M. Life Sci. 1992;51:L120–195. doi: 10.1016/0024-3205(92)90632-y. [DOI] [PubMed] [Google Scholar]
- 10.Salaspuro M. Helicobacter pylori alcohol dehydrogenase. In: Jansson B., Jörnvall H., Rydberg U., Terenius L., Vallee B.L., editors. Toward a Molecular Basis of Alcohol Use and Abuse. Birkhäuser Verlag; Basel, Switzerland: 1994. pp. 185–195. [Google Scholar]
- 11.Bode J.C., Rust S., Bode C. Scand. J. Gastroenterol. 1984;19:853–856. [PubMed] [Google Scholar]
- 12.Kenney W.C. Alcohol Clin. Exp. Res. 1982;6:412–416. doi: 10.1111/j.1530-0277.1982.tb05000.x. [DOI] [PubMed] [Google Scholar]
- 13.Sorrell M.F., Tuma D.J. Alcohol Clin. Exp. Res. 1985;9:306–309. doi: 10.1111/j.1530-0277.1985.tb05549.x. [DOI] [PubMed] [Google Scholar]
- 14.Matsuda Y., Baraona E., Salaspuro M., Lieber C.S. Lab. Invest. 1979;41:455–463. [PubMed] [Google Scholar]
- 15.Lumeng L. J. Clin. Invest. 1978;62:286–293. doi: 10.1172/JCI109128. [DOI] [PMC free article] [PubMed] [Google Scholar]
- 16.Roine R.P., Salmela K.S., Hook-Nikanne J. Scand. J. Gastroenterol. 1993;28(Suppl. 197):72. [Google Scholar]
- 17.Magonet E., Delforge D., Delaive E., Remacle J., Hayen P. Biochem. J. 1992;287:361–365. doi: 10.1042/bj2870361. [DOI] [PMC free article] [PubMed] [Google Scholar]
- 18.Salmela K.S., Roine R.P., Hook-Nikanne J., Kosunen T.U., Salaspuro M. Scand. J. Gastroenterol. 1994;29:528–531. doi: 10.3109/00365529409092467. [DOI] [PubMed] [Google Scholar]
- 19.Gorbach S.L. Gastroenterology. 1992;99:615–625. [Google Scholar]
- 20.Buhner M., Sund H. Eur. J. Biochem. 1969;11:73–79. doi: 10.1111/j.1432-1033.1969.tb00741.x. [DOI] [PubMed] [Google Scholar]
- 21.Vallee B.L., Hoch F. Proc. Natl. Acad. Sci. USA. 1952;41:327–338. doi: 10.1073/pnas.41.6.327. [DOI] [PMC free article] [PubMed] [Google Scholar]
- 22.Tkachenko A.G., Winston G.W. Arch. Biochem. Biophys. 2000;380:165–173. doi: 10.1006/abbi.2000.1912. [DOI] [PubMed] [Google Scholar]
- 23.Ellman G.L. Arch. Biochem. Biophys. 1959;82:70–77. doi: 10.1016/0003-9861(59)90090-6. [DOI] [PubMed] [Google Scholar]
- 24.Jornvall H., Eklund H., Brändén C.I. J. Biol. Chem. 1978;253:8414–8419. [PubMed] [Google Scholar]
- 25.Harris J.I. In: Structure and Activity of Enzymes. Goodwin T.W., Harris J.I., Harley B.S., editors. Academic Press; London, New York: 1964. pp. 97–109. [Google Scholar]
- 26.Lippard S.J., Berg J.M. University Science Books; Mill Valley, CA: 1994. Principles of Bioinorganic Chemistry. [Google Scholar]
- 27.Rosenzweig A.C., O'Halloran T.V. Curr. Opin. Chem. Biol. 2000;4:140–147. doi: 10.1016/s1367-5931(99)00066-6. [DOI] [PubMed] [Google Scholar]
- 28.Sadler P.J., Sun H., Li H. Chem. Eur. J. 1996;2:701–708. [Google Scholar]
- 29.Sun H., Li H., Harvey I., Sadler P.J. J. Biol. Chem. 1999;274:29094–29101. doi: 10.1074/jbc.274.41.29094. [DOI] [PubMed] [Google Scholar]
- 30.Busenlehner L.S., Apuy J.L., Giedroc D.P. J. Biol. Inorg. Chem. 2002;7:551–559. doi: 10.1007/s00775-001-0336-9. [DOI] [PubMed] [Google Scholar]
- 31.van Dinten L.C., van Tol H., Gorbalenya A.E., Snijder E.J. J. Virol. 2000;74:5213–5223. doi: 10.1128/jvi.74.11.5213-5223.2000. [DOI] [PMC free article] [PubMed] [Google Scholar]
- 32.Yao Q.Z., Zhou H.M., Hou L.X., Tsou C.L. Biochemistry. 1984;23:2740–2744. doi: 10.1021/bi00307a032. [DOI] [PubMed] [Google Scholar]
- 33.Zhang T., Zhou H.M. Int. J. Biol. Macromol. 1996;19:113–119. doi: 10.1016/0141-8130(96)01111-7. [DOI] [PubMed] [Google Scholar]
- 34.He B., Zhang Y., Zhang T., Wang H.R., Zhou H.M. J. Protein Chem. 1995;14:349–357. doi: 10.1007/BF01886792. [DOI] [PubMed] [Google Scholar]
- 35.Tsou C.L. Science. 1993;268:380–381. doi: 10.1126/science.8211158. [DOI] [PubMed] [Google Scholar]
- 36.Bertini I., Sigel A., Sigel H. Marcel Dekker; New York: 2001. Handbook on Metalloproteins. [Google Scholar]
- 37.Sacchetta P., Di Rado R., Saliola M., Bozzi A., Falcone C., Ilio C.D., Martini F. Biochim. Biophys. Acta. 2001;1545:238–244. doi: 10.1016/s0167-4838(00)00283-1. [DOI] [PubMed] [Google Scholar]