

Abstract
Early detection of breast cancer is the key to improve survival rate. Thermogram is a promising front-line screening tool as it is able to warn women of breast cancer up to 10 years in advance. However, analysis and interpretation of thermogram are heavily dependent on the analysts, which may be inconsistent and error-prone. In order to boost the accuracy of preliminary screening using thermogram without incurring additional financial burden, Complementary Learning Fuzzy Neural Network (CLFNN), FALCON-AART is proposed as the Computer-Assisted Intervention (CAI) tool for thermogram analysis. CLFNN is a neuroscience-inspired technique that provides intuitive fuzzy rules, human-like reasoning, and good classification performance. Confluence of thermogram and CLFNN offers a promising tool for fighting breast cancer.
Keywords: FALCON-AART, Fuzzy adaptive learning control network fuzzy neural network, Thermogram, Breast cancer diagnosis, Complementary learning
1. Introduction
Breast cancer is the second most deadly cancer among women. Each year, 211,240 women are diagnosed with breast cancer and 40,870 of them will die in 2005 (American Cancer Society, 2005). In United States alone, it is estimated that there are 1 million women with undetected breast cancer; to date, the figure of women affected has surged to 1.8 million and 45, 000 women die per year (Diakides & Diakides, 2003). This high death rate has stimulated extensive researches in breast cancer detection and treatment. Recent studies have determined that the key to breast cancer survival rests upon its earliest detection possible. If discovered in its earliest stage, 95% cure rates are possible (Gautherie, 1999, Pacific Chiropractic and Research Center,). On the other side, it is reported that 70 to 90% of the excisional biopsies performed are found to be benign (Lay, Crump, Frykberg, Goedde, & Copeland, 1990). Owing to this high false positive rate, many endeavors have been putted into ameliorate the breast cancer early detection.
Breast imaging is a noninvasive and inexpensive cancer detection technology. Amongst, mammography is accepted as the most reliable and cost-effective imaging modality. However, its false-negative rates is high (up to 30%) (Elmore et al., 1994, Rajentheran et al., 2001). In addition, the danger of ionizing radiation and tissue density, which has been associated with increased cancer risk (Boyd, Byng, & Jong, 1995), is linked with patient who underwent mammography screening. It is also uncomfortable, because the breast has to be compressed between flat surfaces to improve image quality. Furthermore, obtaining adequate images from radiologically dense breasts (with little fat) or in women with breast implants are difficult (Foster, 1998), and it is difficult to detect breast cancer in young women (Gohagan, Rodes, Blackwell, & Darby, 2004). Despite of these limitations, mammogram remains the gold standard for screenings (Gohagan et al., 2004, Moore, 2001). Since early detection is important, new technologies such as Magnetic Resonance Imaging (MRI), Positron Emission Tomography (PET), Computed Tomography-Single Photon Emission Computed Tomography (CT-SPECT) (Del Guerra, Di Domenico, Fantini, & Gambaccini, 2003), and ultrasound have been applied as complement to mammogram (Ng & Fok, 2003). Fig. 1 and Table 1 show the available modalities for breast cancer detection at present, and the reported accuracy, respectively. Note that the reported accuracy is only an estimate because these modalities perform differently on different types of breast cancer, on different age group, apart from the fact that most of the tests are done on small populations.
Fig. 1.
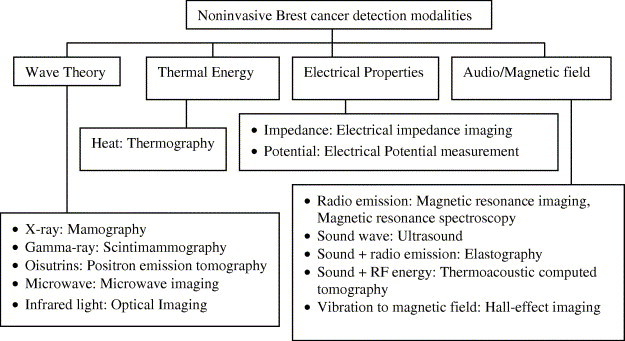
Noninvasive breast cancer detection modalities (adapted from Fok et al., 2002).
Table 1.
Accuracy of breast cancer diagnosis modalities
| Technique | Sensitivity (%) | Specificity (%) | References |
|---|---|---|---|
| Clinical examination | 48.3–59.8 | 90.2–96.9 | Barton, 2002, McDonald et al., 2004 |
| Biopsy | |||
| Surgical/Open biopsy | ≈100 | ≈100 | Imaginis, Breast Cancer Diagnosis (2004) |
| Vacuum-assisted biopsy (Mammotome) | 95 | 98 | Simmon et al. (2000) |
| Large core biopsy | 74–97 | 91–100 | Delle Chiaie and Terinde, 2004, Meyer et al., 1999, Puglisi et al., 2003 |
| FNA (biopsy) | 85–88 | 55.6–90.5 | Pisano et al. (2001) |
| Core needle biopsy | 91–99 | 73–100 | Brenner et al., 2001, Pisano et al., 2001 |
| Breast cyst aspiration | 79 | 94 | Lucas and Cone (2003) |
| Imaging | |||
| FNA (cytology) | 65–99 | 64–100 | Fajardo et al., 1990, Reinikainen, 2003 |
| Mammography | 13–95 | 14–90 | Fajardo et al., 1990, Fletcher et al., 1993, Singhal and Thomson, 2004 |
| Full-Field Digital Mammography (FFDM) | 64.3 | 88.2 | Irwig et al., 2004, Lewin et al., 2002 |
| Thermography | 90 | 90 | Amalu (2003) |
| Ultrasound/Sonography | 13–98.4 | 67.8–94 | Houssami et al., 2003, Singhal and Thomson, 2004, Stavros et al., 1995 |
| MRI | 86–100 | 21–97 | Cecil et al., 2001, Orel, 2000, Singhal and Thomson, 2004, Yeung et al., 2001 |
| Proton Magnetic Resonance Spectroscopy (MRS) | 83–100 | 73–87 | Cecil et al., 2001, Reinikainen, 2003, Yeung et al., 2001 |
| Scintigraphy (CT) | 55–95 | 62–94 | Brem et al., 2003, Singhal and Thomson, 2004 |
| PET | 96 | 100 | Singhal and Thomson (2004) |
| Positron Emission Mammography (PEM) | 80–86 | 91–100 | Levine et al., 2003, Murthy et al., 2000 |
| Electrical Impedance Scanning (EIS) | 62–93 | 52–69 | Glickman et al., 2002, Malich et al., 2003 |
| Gene screening | |||
| Serum protein expression profiling | 90 | 93 | Vlahou et al. (2003) |
| Gene Profiling | 83–91 | 72.7–81.8 | van’t Veer et al. (2002) |
| Gene Testing | 63–85 | Not mentioned | Berry et al. (2002) |
As shown in Table 1, none of the methods possesses high sensitivity (correctly identify women with breast cancer), and high specificity (correctly weed out women without breast cancer), albeit a lot of endeavors have been put in Foster, 1998, Moore, 2001. Each has its limitations. For example, clinical examination is insensitive, examiner-dependent (McDonald, Saslow, & Alciati, 2004); biopsy is invasive, causes complications, leaves scars, and requires long recovery time (Imaginis, Breast Cancer Diagnosis, 2004, Simmon et al., 2000); MRI is inconsistent, costly and low-resolution (Cardillo, Starita, Caramella, & Cilotti, 2001); PET, CT-SPECT, is expensive and scarce; ultrasound images are of poor resolution (Kotre, 1993, Moore, 2001), and operator-dependent (Chen, Chang, & Huang, 2000); microwave imaging requires accurate modeling of the relation between various tissues’ frequency dependency, and its sensitivity is affected by many factors (Bond et al., 2003, Fear et al., 2002, Kosmas et al., 2004); PEM (Thompson, Murthy, Picard, Weinberg, & Mako, 1995) is expensive and insensitive (Moses, 2004); FNA is operator-dependent (Pisano, Fajardo, Caudry, & Sneige, 2001), and incurs complications (Lucas & Cone, 2003); Gene expression analysis on genes BRCA1 and BRCA2, whose mutations are associated with breast cancer, is difficult as the genes are highly complex. The costly blood storage worsens the matter (Spengler, 2003); MRS is technically demanding, and only of confimatory value to MRI (Cecil et al., 2001, He and Shkarin, 1999); EIS requires localization of lesion before hand (Glickman et al., 2002), insensitive, and observer-dependent (Malich et al., 2003). These methods are often too cumbersome, costly inaccessible or invasive to be used as first-line detection modalities alongside clinical examination and mammography (Keyserlingk et al., 2000, Qi and Diakides, 2003).
Thus, thermogram appears as one of the most promising and suitable alternatives for preliminary screening (Amalu, 2003). Thermogram monitors the breast health based on the heat pattern variation that correlates with the patients’ medical condition (Gautherie, 1999, Head et al., 2000). It is cheap, noninvasive, simple, painless, low cost, and highly accurate if done right, safe (no side effect known), practical, and it requires no contact nor compression, no radiation or venous access (Aksenov et al., 2003, Bamberg, 2002, Gautherie, 1989, Head et al., 2000, Keyserlingk et al., 2000). Infrared breast thermography can increase sensitivity at the critical early detection phase by providing an early warning of an abnormality that is not evident by other approaches (Keyserlingk et al., 2000). It is able to warn women up to 10 years before a cancer is found (Amalu, 2003, Pacific Chiropractic and Research Center,). Furthermore, thermography is the only physical method that mediates significant information on breast physiology (Gautherie, 1989). In contrast to other techniques, its result is independent of nodal status, and unrelated to age, tumor location (right or left breast), and estrogen, progesterone receptor status (Head et al., 2000). Hence, thermogram plays a pivotal role in breast cancer, be it risk assessment (Amalu, 2003), detection, diagnosis, or prognosis (Gautherie, 1989, Head et al., 2000).
Unfortunately, despite of the strengths reported, thermogram is associated with some of the limitations such as environment-dependent, operator-dependent (Fok et al., 2002, Ng and Fok, 2003), not descriptive (Aksenov et al., 2003, Bamberg, 2002), difficult to interpret (Amalu, 2003), nonspecific (Jones, 1998), inconsistent (Frize et al., 2002, Head et al., 2003), and no standard analysis procedure (Ohashi and Uchida, 2000, Kaczmarek and Nowakowski, 2003), as pointed out in Breast Cancer Detection Demonstration Projects (BCDDP). As a result, breast thermography is yet to be widely used and is not recommended by National Breast Cancer Centre (National Breast Cancer Centre Position Statement, 2004). Apparently, thermogram performs no better than other modalities. All in all, if the thermography is done right, it offers a very powerful tool for fighting breast cancer. Thus, by providing decision aids using intelligent system (Ng and Fok, 2003, Ng et al., 2002), good and consistent diagnosis performance can be maintained using breast thermography. At the same time, these intelligent tools can lighten the pressures upon the physicians, and ease the burden of examining large number of images (e.g., 1 million pairs of X-ray images per year is needed to be reviewed Kotre, 1993). A summary of the use of complementing breast cancer detection modalities with intelligent tools is given in Table 2 .
Table 2.
Reported accuracy on computer-aided diagnosis
| Methods & applications | Accuracy (%) | Training/Sample size |
|---|---|---|
| Prognostic factors & BP for breast cancer prognosis (Burke et al., 1994) | 85 | NM |
| Prognostic factors & SOM for nodal metastasis detection (Naguib et al., 1996) | 55–84 | 50/81 |
| Prognostic factors & (a) Logistic regression (b) MLP (c) Decision tree for breast cancer survivability prediction (Delen et al., 2005) | (a) 89.2 (b) 91.2 (c) 93.6 | 10-fold cross validation, 202,932 |
| Patient physiological and history data & (a) ANN (b) Data Employment Analysis (c) LDA for breast cancer diagnosis (Pendharkar et al., 1999) | (a) 81.5 (b) 66.5 (c) 66.1 | 227/227 |
| Clinical pathological data & MLP & single threshold system for breast cancer prognosis (Gómez-Ruiz et al., 2004) | 96 | 828/1035 |
| FNA & (a) Fuzzy k-NN (b) logic regression (c) MLP for breast cancer prognosis (Seker et al., 2001) | (a) 88 (b) 82 (c) 87 | Leave-one-out, 100 |
| FNA & (a) Rank NN (Bagui et al., 2003) (b) Evolving ANN (Land & Albertelli, 1998) (c) Memetic pareto ANN and (d) BP (Abass, 2002) (e) CLFNN (Tan, 2005) (f) DA and (g) MARS and (h) BP and (i) MARS and BP (Chou et al., 2004) (j) Evolving ANN and (k) ANN ensembles (four MLP) (Yao & Liu, 1999) (l) Hybrid fuzzy genetic (Andrés et al., 1999) (m) SVM (Liu et al., 2003) for breast cancer diagnosis | (a) 97 (b) 97.1 (c) 98.1 (d) 97.5 (e) 97.81 (f) 95.91 (g) 97.66 (h) 98.25 (i) 98.25 (j) 96–99.8 (k) 99.99 (l) 97.5 (m) 97.07 | (a), (b), (k): 524/699 (d): 400/683 (e), (j), (k), (l): 349/699 (f), (g), (h), (i): 398/569 (m) 547/699 |
| Wavelet features of mammogram & MLP for breast cancer diagnosis (Kocur et al., 1996) | 88 | NM |
| Breast cancer tissue image & fuzzy co-occurrence matrix & MLP for breast cancer diagnosis (Cheng et al., 1995) | 100 | 60/90 |
| Biopsy image & (a) RBF (Schnorrenberg et al., 1997) (b) receptive field function and (c) ANN (Schnorrenberg et al., 2000) (d) singular value decomposition & MLP with Levenberg–Marquardt algorithm (Tsapatsoulis et al., 1997) for breast cancer nuclei detection | (a) 83.7–84.6 (b) 76.4–78.1 (c) 79.3–80.7 (d) 76.8 | Sensitivity |
| Mammogram & (a) Evolving ANN (Fogel et al., 1998) (b) DA (Leichter et al., 1996) (c) SOM & MLP (Santos-André & da Silva, 1999) (d) Bayesian belief network (Wang et al., 1999) for breast cancer diagnosis | (a) 84.64–91.96 (b) 93.8 (c) 60 (d) 89 | (a) Leave-one-out, 216 (b) NM (c) 247/272 (d) 335/419 |
| (a) Mammogram & LDA for parenchymal patterns identification. (b) Mammogram & one-step rule-based & ANN for breast cancer diagnosis (Huo et al., 1998) | (a) 91 (b) 94 | NM |
| (a) Mammogram & patient history data & ANN for breast cancer diagnosis, (b) and for mammographic invasion prediction (Lo & Floyd, 1999) | (a) 82–86 (b) 77.96 | Leave-one-out |
| Mammogram & patient history data & (a) evolutionary programming & Adaboosting (Land et al., 2000) (b) Constraint satisfaction ANN [Tourassi01] for breast cancer diagnosis | (a) 86.1–87.6 (b) 84 | (a) 400/500 (b) 250/500 |
| Mammogram & RBF for (a) abnormalities detection (b) breast cancer diagnosis (Christoyianni et al., 2002) | (a) 88.23 (b) 79.31 | (a) 119/238 (b) 119/119 |
| Ipsilateral mammogram & ANN (BP and Kalman filter) for breast cancer diagnosis (Sun et al., 2004) | About 65 | 60/100 |
| MRI & BP for breast cancer diagnosis (Cardillo et al., 2001) | Improved accuracy | NM |
| (a) Spectrum of radio frequency echo signals in ultrasound (b) B-mode ultrasound & DA for axillary lymph node classification (Tateishi et al., 1998) | (a) 92.5 (b) 80 | NM |
| Sonography & (a) SOM (Chen et al., 2000) (b) ANN (Lo & Floyd, 1999) for breast cancer diagnosis (Chen et al., 2000) | (a) 85.6 (b) 96 | (a) 10-fold cross validation (b) NM |
| Thermogram & (a) Image histogram & Co-occurrence matrix (Jakubowska et al., 2003) (b) Microwave radiation & Karhunen–Loeve transformation (Varga & De Muynck, 1992) (c) CLFNN (Tan et al., 2004) (d) BP for breast cancer diagnosis | (a) Almost 100 (b) Compared well to physician (c) 74–94 (d) 53–64 | (a), (b): NM (c) 39/78 (d) 65/78 |
| Gene expression & k-means clustering & principal component analysis & Bayesian classification tree for (a) lymph-node metastasis and (b) relapse (Huang et al., 2003) | (a) 90 (b) 90 | Leave-one-out, (a) 37, (b) 52 |
Abbreviations: BP: Backpropagation, ANN: Artificial Neural Network, SVM: Support Vector Machine, DA: Discriminant Analysis, LDA: Linear DA, MLP: Multilayer Perceptron, SOM: Self-Organizing Map, NN: Nearest Neighbor, MARS: Multivariate Adaptive Regression Splines, RBF: Radial Basis Function, NM: Not Mentioned.
As shown in Table 2, intelligent tools contribute significantly in improving the breast cancer detection and prognosis. This is consistent with a recent review that computer-aided diagnosis shows incremental improvement in sensitivity (Irwig, Houssami, & van Vliet, 2004). MLP or BP is the favorite algorithm to complement various modalities, in spite of its limitations such as slow learning, likely to be trapped in local minima, etc. SOM is another common adjunct for imaging modalities, albeit its poor classification performance, and high memory requirement. Statistical methods like LDA, Bayesian network, and logistic regression are often applied in assisting diagnosis and prognosis. However, statistical methods are difficult to develop, and oftentimes they work under the assumption that the underlying data is normally distributed. Whereas RBF has heavy computation and memory requirements, decision tree is limited in its representation power due to the use of crisp rule. On the other hand, evolving ANN, although it is able to achieve optimal performance, is time-consuming to develop since it may take a few hundreds to thousands runs before it can find the appropriate parameters. Furthermore, due to the stochastic nature of the algorithm, it may generate inconsistent knowledge base. Most of all, these methods (except decision tree) do not provide any explanations for their computations and reasoning. As a result, the physicians have no way to validate the system operation, and hence, they find it difficult to trust the system.
Complementary Learning Fuzzy Neural Network (CLFNN) is therefore proposed to be Computer-Assisted Intervention (CAI) for breast thermography. CLFNN is a neuroscience-inspired, evolving, and autonomous fuzzy neural network that based on positive and negative learning. CLFNN not only provides good performance in classification, but also fast in learning. Most importantly, CLFNN offers human-like reasoning as well as intuitive fuzzy rules to explain its computations. Since human observer’s image interpretation is often lack of thoroughness and lack of consistency (Bick, 2000), the capacity of CLFNN in providing cognitive interpretation on given thermogram is of great importance for aiding image analysis. Psychophysical evidence demonstrates that even imperfect prompts can enhance human ability in pattern detection (Kotre, 1993). Therefore, CLFNN is believed to enhance the overall accuracy of breast thermography. On the other hand, most of the disease detection works in CAI adopted physic or physically inspired models (Ellis & Peters, 2004), statistical methods such as Bayesian theory and nearest neighbor (Sajda, Spence, & Parra, 2003), or Artificial Neural Network (ANN) (Frigyesi, 2003, Joo et al., 2004). These methods however possess some shortcomings: statistical methods and ANN do not justify, and provide no explanation for their computation. As a result, the output is difficult to trust because it comes without reason. As for model-based system, it is difficult to develop, and many a times requires assumption to be made. This applies to statistical methods as well, as many statistical methods assume that the data is normally distributed. Conversely, other than superior accuracy, CLFNN provides positive and negative fuzzy rules to reason its decisions, and this reasoning is closely akin to diagnostician’s decision-making process. These rules not only can be used to countercheck physician’s diagnosis, they could potentially guide junior physician. Besides, CLFNN can also be adopted to confirm or investigate hypothesis associated with breast cancer such as women having family history of breast cancer belong to high risk group (Cancer Research UK, 2002), temperature difference between left and right breast suggests possible case of cancer (Gautherie, 1989), and so on.
2. FALCON-AART
FALCON-AART is a CLFNN that forms its fuzzy partitions based on visual cortical plasticity, and adjusts its parameters based on psychological theory of learning (Tan, Quek, & Ng, 2004) (for details, see Tan et al., 2004). It generates fuzzy rules autonomously in the form described by Eq. (1).
| (1) |
The fuzzy rule in Eq. (1) is an example of a system with two inputs and two outputs. It consists of five elements:
-
1.
Input linguistic variables (x 1, x 2).
-
2.
Input linguistic terms (A, B). This represents fuzzy entities such as tall, short, thin, fat, and so on. FALCON-AART represents input linguistic terms by using trapezoidal membership function.
-
3.
If–Then rule: links the antecedent part (i.e., input linguistic variables and terms) with the consequent part (i.e., output linguistic variables and terms).
-
4.
Output linguistic variables (y 1, y 2).
-
5.
Output linguistic terms (C, D).
FALCON-ART has five layers and each layer is mapped onto the elements of the fuzzy rule (Fig. 2 ). Before training commences, FALCON-AART consists of input and output layers only. As training progresses, FALCON-AART evolves and automatically constructs its hidden layer by modified Fuzzy ART algorithm (Tan et al., 2004). This algorithm is based on complementary learning paradigm that comprises positive (learn from positive patterns) and negative learning (learn from negative patterns). The modified fuzzy ART algorithm (known as Another ART) improves Fuzzy ART (Baraldi & Bonda, 1999) by functionally models and incorporates the human visual cortical plasticity. With this, FALCON-AART structural learning becomes a function of time (age), which enables FALCON-AART to alleviate the stability–plasticity dilemma as well as to avoid the problem of generating bad clusters as suffered by most competitive learning algorithm. It dynamically partitions the input and output spaces into trapezoidal fuzzy clusters, and subsequently these clusters are finetuned using modified adaptive back-propagation algorithm (Tan et al., 2004). The tuning is done simultaneously to the slope and the location of fuzzy sets. When new training patterns are presented, the stored cluster will resonate if the new training patterns are sufficiently similar to them. The resonant cluster will then expand to incorporate these patterns using the Another ART algorithm. Training terminates when the mean square errors between two consecutive epochs are sufficiently equal.
Fig. 2.
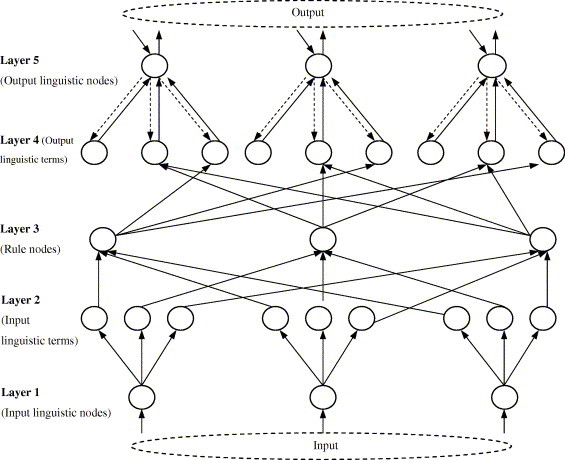
Architecture of FALCON-AART.
The neural memory structure between Layers 2 and 3 is the construct of the complementary learning. Complementary learning refers to positive and negative learning, which is believed to be a mechanism underlies human recognition. When a positive pattern is presented, positive rules will be excited, and negative rules will be inhibited simultaneously, and vice versa. The complementary learning is often practiced in daily life: a child will learn how to recognize an apple more efficiently, if he/she were presented an apple (positive pattern) and other fruits (negative patterns).
Likewise, a radiologist will have to have seen/learned, both abnormal medical image (positive learning) and normal medical images (negative learning), in order for him/her to recognize or analyse the images effectively. Evidences for this complementary learning can be drawn from various neuroscience studies. For instance, hippocampus possesses both positive and negative reinforcement signals; the existence of excitatory (positive) and inhibitory (negative) neurotransmitter systems inside human brain, etc. As shown in Fig. 3 , different objects are registered into different brain areas, lending further support to the complementary learning conjecture. Hence, whenever a car is presented (positive), only areas registered for car (positive rules) will be activated, while the areas registered for other objects (negative rules) will be inhibited simultaneously.
Fig. 3.
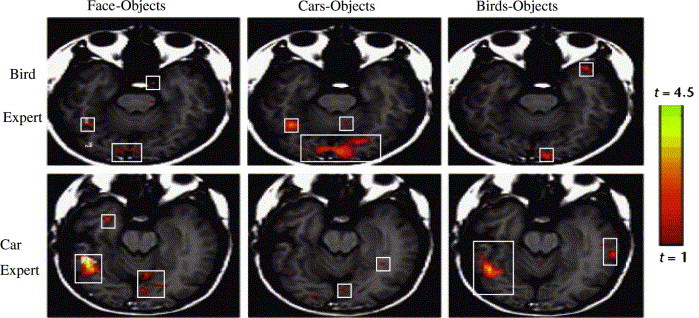
Slices of fusiform gyrus of car and bird expert in face, car, and bird recognition. The rectangular boxes show the activated areas of brain for different recognition task (Adapted from Gauthier et al., 2000).
Thus, FALCON-AART functionally models the biological complementary learning, and is formalized as Eqs. (2), (3). Given a positive sample, {x + = (x 1, x 2, … , x I), d = 1}, x ∈ U, d ∈ V, and , , then:
| (2) |
| (3) |
Hence, whenever a positive sample is presented to the system, , which leads to a correct decision, i.e., d = 1.
3. Experiment and results
3.1. Dataset
The thermograms are obtained from voluntary patients at the Singapore General Hospital (SGH) (Ng et al., 2001, Ng et al., 2002). The thermograms are captured using the AVIO thermal camera TVS-2000 MkIIST system. The thermography process is shown in Fig. 4 .
Fig. 4.
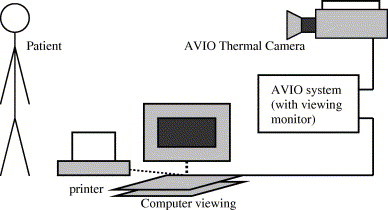
Thermography process.
The patient’s thermal image is captured using thermal camera. The imager component of thermal system converts infrared emitted by the object under observation into electrical signals. Subsequently, the processor components collects these signals, store them in frame memory, then displays them on a LCD display, either as real-time sixteen bit color or monochrome thermographic images. The thermogram is stored, and feature extraction is done to compute the temperatures of the left and right breasts using the AVIO software. Example of thermogram is given in Fig. 5 .
Fig. 5.
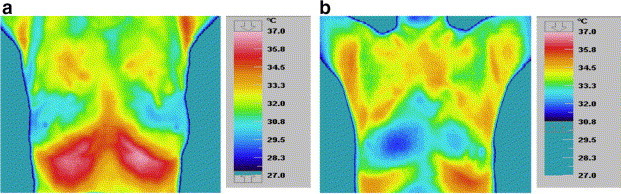
Thermogram of (a) healthy patient-symmetrical temperature (b) unhealthy patient-unsymmetrical temperature.
The volunteers are between the ages of 27 and 90. Screening was carried out from 9.00 am to 11.30 pm of the day as this is the most stable period (Gautherie, 1989). All volunteers were briefed the methodology and process of thermography in advance in order to relief them from any possible emotional stress as well as to obtain their consent. They were advised not to put on any powder, ointments, perfume, or any other wipes that will affect the conduction through the skin, around regions to be examined. Before the examination was carried out, volunteers were required to rest for 15–20 min for acclimatization to room temperature upon arrival at the examination room. This is important to keep patients in basal metabolic rate which will result minimal surface temperature changes for satisfactory thermograms. Since standardized ambient conditions are necessary to minimize variations in thermography, the ambient temperature was carefully observed for the examination. The examination environment was a controlled, air-conditioned room maintained at an ambient temperature of 20–22 °C (maximum variation is ±0.1 °C), with humidity between 55% and 65%. Direct draughts are avoided in the areas where the patient is positioned. Volunteers wore loose gowns that do not restrict airflow for equilibration and do not constrict the skin surface during this equilibration period. It was ensured that patients were within the period of the 5th–12th and 21st day after the onset of menstrual cycle as this is the most suitable period for imaging. This is because women body temperature is known to be stable in this period (Gautherie, 1989), and the vascularisation is at basal level with least engorgement of blood vessels (Ng et al., 2001).
Three thermograms were taken for each patient: one front view and two lateral views. There are total of 78 patients with 28 healthy patients, 43 benign tumor patients, and 7 cancer patients. Mean, median, mode, standard deviation and skewness of each breast temperature are extracted from front-view thermograms using histograms of the temperature distribution, and calculated using the Statistical Package for the Social Sciences (SPSS). Population of patients is shown in Table 3 .
Table 3.
Average mean and modal temperatures of healthy and unhealthy breasts
| Healthy patients | Benign patients | Carcinoma patients | |
|---|---|---|---|
| Average mean temperature of normal breast (left and/or right) (°C) | 32.66 | 32.81 | 33.43 |
| Average mean temperature of abnormal breast (left or right) (°C) | Not available | 33.00 | 33.51 |
| Average modal temperature of normal breast (left and/or right) (°C) | 32.67 | 33.05 | 33.40 |
| Average modal temperature of abnormal breast (left or right) (°C) | Not available | 33.00 | 33.51 |
Table 3 shows that carcinoma patients generally have higher breast temperature compared to healthy patients. This temperature difference arises because the cancerous breast has higher metabolism. The blood vessels in the vicinity of the tumor are engorged with blood and therefore, cancerous breast emits more heat (Ng et al., 2002).
3.2. Experiment
The experiment is to diagnose whether a patient belongs to normal, benign, or malignant based on breast temperatures extracted from thermogram. Five types of file are created, and three training/testing sets are created for each type of file for cross-validation purpose. Each of the stratified training sets contains randomly selected 50% samples from the dataset, and the remaining unseen samples made up the testing sets. The sets are presented below:
-
•
File FH: contains patient age, family history, hormone replacement therapy, age of menarche, presence of palpable lump, previous surgery/biopsy, presence of nipple discharge, breast pain, menopause at age above 50 years, and first child at age above 30 years.
-
•
File T: contains mean, median, modal, standard deviation and skewness of temperature for left and right breasts.
-
•
File TH: combination of FH and T.
-
•
File TD: contains temperature difference of mean, median, modal, standard deviation and skewness for left and right breasts.
-
•
File TDH: combination of TD and FH.
The averaged performance of FALCON-AART is benchmarked against Linear discriminant analysis (LDA) (Hanm & Kamber, 2001), k-Nearest neighbor (kNN) (Hanm & Kamber, 2001), Naı¨ve Bayesian (Hanm & Kamber, 2001), logistic regression (LR) (Hanm & Kamber, 2001), Self-Organizing Map (Chen et al., 2000), Radial Basis Function (RBF) (Hanm & Kamber, 2001), Support Vector Machine (SVM) (Hanm & Kamber, 2001), C4.5 (Hanm & Kamber, 2001), Multilayer Perceptrons (MLP) (Hanm & Kamber, 2001). Apart from that, comparison is made with FALCON-AART ancestors: FALCON-ART (Lin & Lin, 1997) and FALCON-MART (Tung & Quek, 2001). The result is listed in Table 4 . Recall refers to the classification accuracy on the training set, whereas predict refers to the classification accuracy on testing set.
Table 4.
Breast cancer diagnosis result (desired values are in bold)
| Method | FH | T | TH | TD | TDF | |
|---|---|---|---|---|---|---|
| Linear discriminant analysis | Recall (%) | 65.79 | 62.86 | 88.57 | 37.14 | 71.43 |
| Predict (%) | 34.21 | 47.37 | 28.95 | 28.95 | 36.84 | |
| No. of epoch | 1 | 1 | 1 | 1 | 1 | |
| No. of rules | Not applicable | |||||
| Multilayer perceptron | Recall (%) | 82.86 | 77.14 | 97.14 | 65.71 | 88.57 |
| Predict (%) | 42.11 | 55.26 | 57.89 | 47.37 | 42.11 | |
| No. of epoch | 100 | 100 | 100 | 100 | 100 | |
| No. of rules | Not applicable | |||||
| Naı¨ve Beyesian classifier | Recall (%) | 57.14 | 57.14 | 55.88 | 57.14 | 54.29 |
| Predict (%) | 54.29 | 54.29 | 57.14 | 54.29 | 22.86 | |
| No. of epoch | 1 | 1 | 1 | 1 | 1 | |
| No. of rules | Not applicable | |||||
| k-Nearest neighbor | Recall (%) | 25.71 | 88.57 | 97.06 | 74.29 | 91.43 |
| Predict (%) | 40 | 45.71 | 48.57 | 42.86 | 45.71 | |
| No. of epoch | 1 | 1 | 1 | 1 | 1 | |
| No. of rules | Not applicable | |||||
| Support vector machine | Recall (%) | 62.86 | 62.86 | 77.14 | 54.29 | 68.57 |
| Predict (%) | 42.11 | 52.63 | 57.89 | 52.63 | 42.11 | |
| No. of epoch | 1 | 1 | 1 | 1 | 1 | |
| No. of rules | Not applicable | |||||
| C4.5 | Recall (%) | 74.29 | 74.29 | 91.43 | 68.57 | 88.57 |
| Predict (%) | 42.11 | 57.89 | 55.26 | 44.74 | 50 | |
| No. of epoch | 1 | 1 | 1 | 1 | 1 | |
| No. of rules | 7 | 4 | 9 | 4 | 9 | |
| Logistic regression | Recall (%) | 80 | 77.14 | 100.0 | 60.0 | 82.86 |
| Predict (%) | 36.84 | 57.89 | 50 | 44.74 | 42.11 | |
| No. of epoch | 1 | 1 | 1 | 1 | 1 | |
| No. of rules | Not applicable | |||||
| Self organizing map | Recall (%) | 77.14 | 82.86 | 80 | 77.14 | 77.14 |
| Predict (%) | 34.21 | 50.0 | 21.05 | 36.84 | 34.21 | |
| No. of epoch | 2000 | 2000 | 2000 | 2000 | 2000 | |
| No. of rules | Not applicable | |||||
| Radial basis function | Recall (%) | 60.0 | 62.86 | 57.14 | 57.14 | 62.86 |
| Predict (%) | 50.0 | 55.26 | 52.63 | 44.74 | 50.0 | |
| No. of epoch | 1 | 1 | 1 | 1 | 1 | |
| No. of rules | Not applicable | |||||
| FALCON-ART | Recall (%) | 85.71 | 71.43 | 65.71 | 70.37 | 88.57 |
| Predict (%) | 50.0 | 52.63 | 52.63 | 51.28 | 55.26 | |
| No. of epoch | 50 | 50 | 50 | 50 | 50 | |
| No. of rules | 137 | 189 | 148 | 134 | 180 | |
| FALCON-MART | Recall (%) | 37.14 | 97.14 | 100.0 | 70.37 | 97.14 |
| Predict (%) | 34.21 | 65.79 | 52.63 | 51.28 | 52.63 | |
| No. of epoch | 6 | 17 | 10 | 6 | 8 | |
| No. of rules | 34 | 23 | 78 | 54 | 31 | |
| FALCON-AART | Recall (%) | 77.14 | 94.29 | 97.14 | 100.0 | 100.0 |
| Predict (%) | 65.79 | 65.79 | 68.42 | 55.26 | 63.16 | |
| No. of epoch | 4 | 4 | 4 | 4 | 10 | |
| No. of rules | 4 | 22 | 30 | 38 | 31 | |
It is shown that FALCON-AART outperforms the common methods in medical image analysis and its ancestors in all the training/testing sets. While having good recall and relatively superior generalization capability, the average training time of FALCON-AART is significantly shorter than MLP, SOM, and LR. Though statistical algorithms require only one pass of training dataset, it does not necessarily means they are faster than FALCON-AART as this depends on the computational complexity of the algorithm. In this particular case, FALCON-AART is as fast as kNN, LDA, SVM, and Naı¨ve Bayesian classifier in learning (≈245 ms). In contrast to statistical methods, FALCON-AART did not make assumption on the data distribution, and this may give superior classification performance even for non-normally distributed data. Note that this result is not comparable to the one in Table 1, Table 2 as this is a different classification task. This classification task involves normal, benign, and malignant whereas the task in Table 1, Table 2 involves only benign and malignant. In other words, from the experimental result shown in Table 4, complementary learning displays superior capacity in multi-class classification than conventional methods.
One significant advantage FALCON-AART offers is the ability to explain its computed output. In contrast to conventional methods, FALCON-AART constructs intuitive positive and negative fuzzy rules dynamically to depict its reasoning process; these rules can be scrutinized by the physicians and decide upon whether to adopt the system suggestion. In addition, accurate rules identified may be used as a guideline for inexperience physicians in diagnosis. As shown in Table 4, rule generation capability of FALCON-AART is better than its ancestor, in which lesser rules are generated but greater accuracy are attained. Some authors have proposed a few criteria for measuring system interpretability: compactness (lesser number of rule in rule base), coverage (every value in universe of discourse should belong to one of the rule), normality (every rule has at least one pattern exhibit full-matching), and so on (Casillas, Cordón, Herrera, & Magdalena, 2003). FALCON-AART learning is a data-centered learning and therefore, it fulfills the coverage and normality criteria. From this experiment, it can be seen that FALCON-AART generates a smaller rule base then its ancestors. Thus, from this aspect, FALCON-AART offers a more interpretable system than its ancestors. Examples of the rules generated are given in Table 5 .
Table 5.
Fuzzy rules generated by FALCON-AART
| Fuzzy rules (FALCON-AART) | Crisp rules (C4.5) | Diagnostic rule Varga and De Muynck (1992) | |
|---|---|---|---|
| IFmean difference is small, ANDmedian difference is rather big, ANDmodal difference is medium, ANDstandard deviation is big, ANDskewness difference is very small, THEN Normal | IFmodal difference < 0.1 ANDmodal difference < 0.03 ANDmean difference < 0.25 ANDmedian difference < 0.24 ANDskewness difference < 0.05 THEN Normal | IF temperature is generally 0.3–1.5 °C higher than the surrounding normal tissues, THEN Tumor | |
| IFmean difference is medium, ANDmedian difference is very small, ANDmodal difference is very big, ANDstandard deviation is medium, ANDskewness difference is small, THEN Benign | IFmodal difference ⩾ 0.1 ANDmedian difference < 0.07 THEN Benign | IF temperature drops linearly with time THEN normal tissue | |
| IFmean difference is very small, ANDmedian difference is small, ANDmodal difference is very big, ANDstandard deviation is big, ANDskewness difference is medium, THEN Malignant | IFmodal difference < 0.1 ANDmodal difference < 0.03 ANDmean difference ⩾ 0.25 ANDmodal difference < 0.02 AND THEN Malignant | IF temperature remains high but sometimes drops a little THEN Tumor |
As shown in Table 5, fuzzy rules generated by FALCON-AART are highly similar to the diagnostic rules practiced by diagnosticians. Aside from the capacity for uncertainty handling (allowing vagueness in linguistic terms), FALCON-AART rule is relatively more expressive compared to decision-tree rule. FALCON-AART rule encapsulates unnecessary details using linguistic term, and allows the use of linguistic hedges such as “very”, “rather”, etc. Moreover, rules generated by FALCON-AART do not have the confusing repeated antecedent term as in decision tree. Furthermore, because FALCON-AART adopts complementary learning, positive and negative rules are generated. This, aside from better classification performance, models the problem space closer than positive or negative learning systems (system with only positive or negative rule base) because no assumptions are made for the uncovered space by the rule base. Fig. 6 depicts the FALCON-AART reasoning process.
Fig. 6.
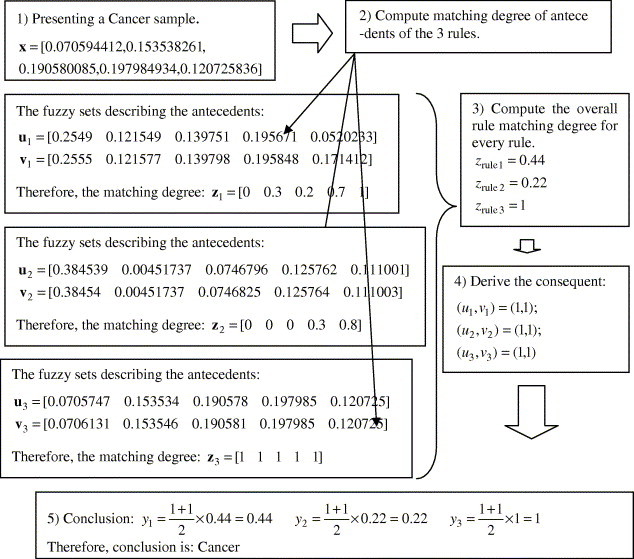
Reasoning process of FALCON-AART.
As shown in Fig. 6, the reasoning process of FALCON-AART is closely akin to how a diagnosis is made: A diagnostician will first observe (presents sample), generates a set of hypotheses (a set of rules), evaluates each hypotheses (compute matching degree of rules), and subsequently derives the conclusion. This human-like reasoning, together with the fuzzy rules generated, which provide insights and interpretations to the thermograms, are useful to aid diagnostician. Table 6 shows the similarity between FALCON-AART and thermogram analyst’s reasoning process. As shown, there is one-to-one mapping of the reasoning process, suggesting the closeness between the two reasoning processes. This is paramount as it facilitates the physicians in analyzing or validating a system, in that he/she can do so in his/her familiar terms, as well as in his/her familiar thought process.
Table 6.
FALCON-AART and analyst reasoning
| Steps | FALCON-AART | Analyst |
|---|---|---|
| 1 | Take in the extracted features from thermogram | Examine the thermogram. Looks for abnormal heat patterns, temperature variations, etc. |
| 2 | Compare the feature values with own positive and negative diagnostic rules (knowledge/ experiences). Computes their matching degree (firing strength/ similarity) | Compare the examined thermogram with previous benign (negative) and malignant (positive) thermograms. Judges and determines their similarity based on own diagnostic rules and experiences |
| 3 | Select the rule with maximum matching degree, and inhibits others | Select the knowledge that best describes the current situation. Eliminates those hypotheses that are not relevant |
| 4 | Determine the consequent linked by the winning rule | Determine the conclusion derived from the knowledge applied |
| 5 | Perform defuzzification and outputs the conclusion | Give the diagnostic conclusion and decision |
FALCON-AART can be used to assess/affirm certain medical hypothesis as well. For example, from Table 4, one can see that the classification accuracy of training/testing set using only breast temperatures alone is lower than that of using breast temperatures and family history. This confirms that family history is important risk factor for breast cancer, lending support to the hypothesis that women who have family history of breast cancer belong to the high-risk group. Another example: the performance of FALCON-AART trained on files TH (FATH) and TDF (FATDF) seemed to be inconsistent with the belief that temperature asymmetry between left and right breast suggests possible case of cancer. This happens because the classification task is to classify three classes, instead of classifying out the cancerous case. In fact, the temperature asymmetry between left and right breast may be more useful in determining the stages of cancer instead of cancer detection (Usuki, Maeta, Maeba, & Wakabayashi, 2000). Nevertheless, the result of detecting cancerous case is illustrated in Task 1 of Table 7 .
Table 7.
Performance of FALCON-AART on breast thermography
| Tasks | Recall (%) | Predict (%) | Sensitivity (%) | Specificity (%) | No. of epoch | No. of rules | |
|---|---|---|---|---|---|---|---|
| 1. Cancer detection | TH | 100.0 | 94.74 | 100.0 | 60.0 | 4 | 14 |
| TDF | 100.0 | 94.74 | 100.0 | 60.0 | 7 | 21 | |
| 2. Breast tumor detection | TH | 100.0 | 84.0 | 33.33 | 90.91 | 11 | 10 |
| TDF | 100.0 | 71.05 | 76.0 | 61.54 | 11 | 17 | |
| 3. Breast tumor classification | TH | 100.0 | 88.0 | 33.33 | 95.45 | 4 | 8 |
| TDF | 100.0 | 84.0 | 33.33 | 90.91 | 11 | 10 | |
Though both FATH and FATDF attain same accuracy, FATDF is better when assessed using Receiver Operating Curve (ROC) plot, which suggests that it is relative easier to classify using temperature asymmetry of left and right breasts. The 45° line signifies the random guessing. As shown in Fig. 7 , FALCON-AART trained on either files deviates far away from the 45° line, achieving good performance for breast cancer detection. The Area Under the Curve index (A Z) is often used in ROC analysis. A Z = 0.5 symbolizes random guessing, and the closer A Z is to 1.0, the better the classifier is. A Z for FATH and FATDF are 0.867 and 0.93, respectively, hence, confirming that asymmetry temperature between the left and right breast is an alarm for breast cancer, and the fact that FALCON-AART is a competent classifier.
Fig. 7.
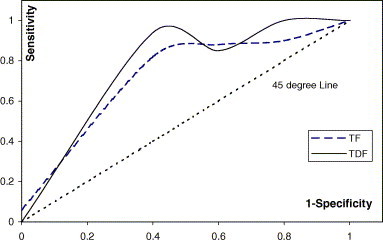
ROC plot of FALCON-AART trained on files TF and TDF.
Thermogram is often employed to detect the presence of breast tumor. Hence, experiment to classify patient with breast tumor is conducted using FALCON-AART. The result is summarized in Task 2 of Table 7. The experimental result reveals that FALCON-AART can detect patient with breast tumor accurately. Therefore, FALCON-AART could assist the physicians in identifying suspected cases where follow-ups are needed. With overall performance close to 90%, good recall and generalization capability is exhibited by FALCON-AART.
Sometimes, it is desired to classify benign and malignant breast cancer. Misdiagnose benign breast tumor as malignant causes unnecessary physical and emotional agony, because the only way to remove breast tumor is surgical biopsy. On the other hand, misdiagnose malignant breast tumor as benign brings fatal consequences. Thus, it is required to diagnose breast tumor as accurate as possible. The experimental result listed in Task 3 of Table 7 demonstrates that FALCON-AART is able to assist in this diagnostic task as well. Giving an overall accuracy about 93%, FALCON-AART demonstrates its competency in tumor classification task. This shows that complementary learning paradigm is a promising recognition approach.
From the results presented in Table 1, Table 2, Table 7, complementary learning exhibits itself as a promising tool for aiding breast cancer diagnosis. Applying FALCON-AART with thermogram shows an improved performance in cancer detection as well as breast tumor classification. This confluence of thermography and CLFNN subsides the problem of high variability in accuracy of breast thermogram analysis. Besides, sensitivity and specificity are offered as high/higher than the reported accuracy on breast thermography alone, as well as other modalities. However, CLFNN is not to replace, rather, is to complement the breast thermography and to assist the physicians in breast cancer diagnosis. The contribution of CLFNN-breast thermography in enhancing the consistency of breast cancer diagnosis accuracy is believed to bring forth better patient outcome. Comparing the results of Table 2, Table 7, confluence of CLFNN and breast thermography shows a superior performance in breast cancer detection over different conventional methods in medical diagnosis and medical imaging analysis. Medley of CLFNN and breast thermography gives as accurate result, if not better, compared to other combinations of ANN and breast imaging modalities in tumor classification and detection. In general, CLFNN has relatively good generalization capability, in that it can classify well using only a small fraction of the data. Together, this supports the application of CLFNN and breast thermography. This also suggests that the confluence of breast thermography and CLFNN is a promising system for fighting breast cancer.
4. Discussion and conclusion
In this study, it is shown that CLFNN complements breast thermography in various ways. The combination of breast thermography and CLFNN gives better or more consistent result than using breast thermography alone. Whether it is cancer detection, tumor classification or breast-cancer diagnosis (multi-class problem), CLFNN outperforms conventional methods, showing the strength of complementary learning in recognition task. FALCON-AART assists the physicians in different diagnostic tasks by providing relative accurate decision support, and hence could potentially enhance patient outcome. FALCON-AART not only gives superior result than conventional methods, but it also offers intuitive positive and negative fuzzy rules to explain its reasoning process. FALCON-AART satisfies the criteria of an interpretable system: normality, compactness, coverage, and therefore is a more interpretable system. The rules generated are useful because it gives insight to the problem space, provides simple cognitive interpretation of medical image, and could potentially serve as guidelines or arguments for its decision to the physicians. Apart from assisting physician in diagnosis, FALCON-AART can also be used to investigate or to support hypothesis associated with the problem domain, i.e., concept validation (Qi & Diakides, 2003). In this study, only two hypotheses were analyzed. In future, more hypotheses can be assessed using CLFNN by proper experiment setup. Examples are thermal challenge test (Eccles, 2003), cold stress (Usuki et al., 2000) or cooling-rewarming tests (Gautherie, 1999) (outside cooling of the breast will increase the temperature contrast if the breast is cancerous), injection of vasoactive substances (Gautherie, 1999), microwave or ultrasonic irradiation (Gautherie, 1999) and so on. Likewise, FALCON-AART can be applied with advanced technologies, which provides more information in thermography: dynamic thermography (Ohashi & Uchida, 2000), 3-dimensional thermography (Aksenov et al., 2003), or thermal texture map (Hassan, Hattery, & Gandjbakhche, 2003), or Dynamic Area Telethermometry (DAT) (Anbar et al., 2000). Conversely, FALCON-AART can complement thermogram in other application areas such as injuries monitoring (Bamberg, 2002), neurology, vascular disorders (e.g., diabetes), rheumatic diseases, tissue viability, oncology (especially breast cancer), dermatological disorders, neonatal, ophthalmology, surgery (Jones, 1998), as well as Severe Acute Respiratory Syndrome (SARS) (Diakides & Diakides, 2003). Alternatively, CLFNN can be used to complement other medical imaging modalities such as MRI, MRS, PET, etc., as well as to serve as a concept validation tool for techniques such as nipple fluid bFGF (Liu, Wang, Chang, Barsky, & Nguyen, 2000), Electrical Impedance Tomography (EIT) (Cherepenin et al., 2001), etc. In current study, FALCON-AART does not perform feature analysis, which is an important area that may improve the system performance and deserved to be studied, as recognition requires one to make decision based on some “important features”. Moreover, performing feature analysis can reduce the number of antecedents of the rule, and hence improve the interpretability of the system. This will be investigated in future.
References
- Abass H.A. An evolutionary artificial neural networks approach for breast cancer diagnosis. Artificial Intelligence in Medicine. 2002;25:265–281. doi: 10.1016/s0933-3657(02)00028-3. [DOI] [PubMed] [Google Scholar]
- Aksenov, P., Clark, I., Grant, D., Inman, A., Vartikovski, L., & Nebel, J. C. (2003). 3D thermography for quantification of heat generation resulting from inflammation. 8th 3D modelling symposium. Paris, France.
- Amalu, W. C. (2003). A review of breast thermography. International Academy of Clinical Thermology. Available from http://www.iact-org.org/articles/articles-review-btherm.html.
- American Cancer Society . American Cancer Society; Atlanta: 2005. Cancer facts and figures 2005. [Google Scholar]
- Anbar, M., Milescu, L., Brown, C., Carty, C., AlDulaimy, K., Geronimo, C., et al. (2000). In Proceedings of 22nd annual international conference of the IEEE Engineering in Medicine and Biology (Vol. 2, pp. 1215–1218).
- Andrés C., Reyes, P., & Sipper M. (1999). Designing breast cancer diagnostic systems via a hybrid fuzzy-genetic methodology. In Proceedings of the 8th IEEE international conference fuzzy system (Vol. 1. pp. 135–139).
- Bagui S.C., Bagui S., Pal K., Pal N.R. Breast cancer detection using rank nearest neighbor. Pattern Recognition. 2003;36:25–34. [Google Scholar]
- Bamberg, P. (2002). Infrared thermography. Biomedical engineering seminar. University of Rhode Island.
- Baraldi A., Bonda P. A survey of fuzzy clustering algorithms for pattern classification-part B. IEEE Transactions on System, Man and Cybernetic. 1999;29(6):786–801. doi: 10.1109/3477.809033. [DOI] [PubMed] [Google Scholar]
- Barton M.B. The clinical breast examination. Harvard Pilgrim Health Care, Harvard Medical School; 2002. [Google Scholar]
- Berry D.A., Iversen E.S., Jr., Gudbjartsson D.F., Hiller E.H. BRCAPRO validation, sensitivity of genetic testing of BRCA1/BRCA2, and prevalence of other breast cancer susceptibility genes. Journal of Clinical Oncology. 2002;20(11):2701–2712. doi: 10.1200/JCO.2002.05.121. [DOI] [PubMed] [Google Scholar]
- Bick U. Computer-assisted data analysis in breast imaging. European Radiology. 2000;10(9):F1. [Google Scholar]
- Bond E.J., Li X., Hagness S.C., Van Venn B.D. Microwave imaging via space-time beamforming for early detection of breast cancer. IEEE Transactions on Antennas and Propagation. 2003;51(8):1690–1705. [Google Scholar]
- Boyd N.F., Byng J.W., Jong R.A. Quantitative classification of mammographic densities and breast cancer risk. Journal of the National Cancer Institute. 1995;87:670–675. doi: 10.1093/jnci/87.9.670. [DOI] [PubMed] [Google Scholar]
- Brem R.F., Kieper D.A., Rapelyea J.A., Majewski S. Evaluation of a high-resolution, breast-specific, small-field-of-view gamma camera for the detection of breast cancer. Nuclear Instruments and Methods in Physics Research A. 2003;497:39–45. [Google Scholar]
- Brenner R.J., Bassett L.W., Fajardo L.L., Dershaw D.D. Stereotactic core-needle breast biopsy: A multi-institutional prospective trial. Radiology. 2001;218:866–872. doi: 10.1148/radiology.218.3.r01mr44866. [DOI] [PubMed] [Google Scholar]
- Burke, H. B., Philip, H., Goodman, H., & Rosen, D. B. (1994). Neural networks for measuring cancer outcomes. In Proceedings of IEEE 10th advanced technologies in instrumentation and measurement technology conference IMTC/94 (Vol. 1(1), pp. 157–159).
- Cancer Research UK. (2002). About breast cancer: Risks and causes. Available at http://www.cancerhelp.org.uk/help/default.asp?page=3293.
- Cardillo, F. A., Starita, A., Caramella, D., & Cilotti, A. (2001). A neural tool for breast cancer detection and classification in MRI. In Proceedings of the 23rd annual EMBS international conference (pp. 2733–2736).
- Casillas J., Cordón O., Herrera F., Magdalena L., editors. Interpretability issues in fuzzy modeling. Vol. 128. Springer-Verlag; Heidelberg: 2003. (Studies in fuzziness and soft computing). [Google Scholar]
- Cecil K.M., Siegelman E.S., Lenkinski R.E. The evaluation of human breast lesions with magnetic resonance imaging and proton magnetic resonance spectroscopy. Breast cancer Research and Treatment. 2001;68(1):45–54. doi: 10.1023/a:1017911211090. [DOI] [PubMed] [Google Scholar]
- Chen D., Chang R., Huang Y. Breast cancer diagnosis using self-organizing map for sonography. Ultrasound in Medicine & Biology. 2000;26(3):405–411. doi: 10.1016/s0301-5629(99)00156-8. [DOI] [PubMed] [Google Scholar]
- Cheng H.D., Chen C.H., Freimanis R.I. A Neural Network for breast cancer detection using fuzzy entropy approach. IEEE International Conference on Image Processing. 1995;3:141–144. [Google Scholar]
- Cherepenin V., Karpov A., Korjenevsky A., Kornienko V., Mazaletskaya A., Mazourov D. Physiological Measurement. 2001;22:9–18. doi: 10.1088/0967-3334/22/1/302. [DOI] [PubMed] [Google Scholar]
- Chou S., Lee T., Shao Y.E., Chen I. Mining the breast cancer pattern using artificial neural networks and multivariate adaptive regression splines. Expert Systems with Applications. 2004;27:133–142. [Google Scholar]
- Christoyianni I., Koutras A., Dermatas E., Kokkinakis G. Computer aided diagnosis of breast cancer in digitized mammograms. Computerized Medical Imaging and Graphics. 2002;26:309–319. doi: 10.1016/s0895-6111(02)00031-9. [DOI] [PubMed] [Google Scholar]
- Del Guerra A., Di Domenico G., Fantini A., Gambaccini M. A dedicated system for breast cancer study with combined SPECT-CT modalities. Nuclear Instruments and Methods in Physics Research. 2003;497:129–343. [Google Scholar]
- Delen D., Walker G., Kadam A. Predicting breast cancer survivability: A comparison of three data mining methods. Artificial Intelligence in Medicine. 2005;34(2):113–127. doi: 10.1016/j.artmed.2004.07.002. [DOI] [PubMed] [Google Scholar]
- Delle Chiaie L., Terinde R. Three-dimensional ultrasound-validated large-core needle biopsy: Is it a realiable method for the histological assessment of breast lesions? Ultrasound in Obstetrics and Gynecology. 2004;23(4):393–397. doi: 10.1002/uog.1001. [DOI] [PubMed] [Google Scholar]
- Diakides, N. A., & Diakides, M. (2003). Infrared imaging in medicine worldwide. 1st international conference of Thermal Texture Maps (TTM) technology in medicine and engineering. September 23–25, Houston, TX, USA.
- Eccles, N. (2003). Thermography – Its role in early breast cancer detection and pain monitoring. Institute of Complementary Medicine Journal. Available at http://www.icmedicine.co.uk/journal/2004/feb/002.htm.
- Ellis R.E., Peters T. Editorial. Medical Image Analysis. 2004;8(4):167. [Google Scholar]
- Elmore J.G., Wells C.F., Carol M.P.H. Variability in radiologists interpretation of mammograms. New England Journal of Medicine. 1994;331(22):1493. doi: 10.1056/NEJM199412013312206. [DOI] [PubMed] [Google Scholar]
- Fajardo L.L., Davis J.R., Wiens J.L., Trego D.C. Mammography-guided stereotactic fine-needle aspiration cytology of nonpalpable breast leasions: Prospective comparison with surgical biopsy results. American Journal of Roentgenology. 1990;155:977–981. doi: 10.2214/ajr.155.5.2120967. [DOI] [PubMed] [Google Scholar]
- Fear E.C., Hagness S.C., Meaney P.M., Okoniewski M., Stuchly M.A. Near-field imaging for breast tumor detection. IEEE Microwave Magazine. 2002;3:48–55. [Google Scholar]
- Fletcher S.W., Black W., Harris R., Rimer B.K., Shapiro S. Report of the international workshop on screening for breast cancer. Journal of the National Cancer Institute. 1993;85:1644–1656. doi: 10.1093/jnci/85.20.1644. [DOI] [PubMed] [Google Scholar]
- Fogel D.B., Wasson E.C., III, Boughton E.M., Porto V.W. Evolving artificial neural network for screening features from mammograms. Artificial Intelligence in Medicine. 1998:317–326. doi: 10.1016/s0933-3657(98)00040-2. [DOI] [PubMed] [Google Scholar]
- Fok S.C., Ng E.Y.K., Tai K. Early detection and visualization of breast tumor with thermogram and neural network. Journal of Mechanics in Medicine and Biology. 2002;2(2):185–195. [Google Scholar]
- Foster K.R. Thermographic detection of breast cancer. IEEE Engineering in Medicine and Biology Magazine. 1998;17:10–14. doi: 10.1109/51.734241. [DOI] [PubMed] [Google Scholar]
- Frigyesi A. An automated method for the detection of pulmonary embolism in V/Q-scans. Medical Image Analysis. 2003;7(2):341–349. doi: 10.1016/s1361-8415(03)00030-6. [DOI] [PubMed] [Google Scholar]
- Frize, M., Herry, C., & Roberge, R. (2002). Processing of thermal images to detect breast cancer: Comparison with previous work. 24th Annual Conference and the Annual Fall Meeting of the Biomedical Engineering Society] EMBS/BMES Conference. In Proceedings of the Second Joint Engineering in Medicine and Biology (Vol. 2, pp. 1159–1160).
- Gautherie M. PADUSA s.r.l.; San Doneto Milanses, Italy: 1989. Atlas of breast thermography. [Google Scholar]
- Gautherie M. Thermopathology of breast cancer: Measurement and analysis of in vivo temperature and blood flow. Annal New York Academy of Science. 1999:383–415. doi: 10.1111/j.1749-6632.1980.tb50764.x. [DOI] [PubMed] [Google Scholar]
- Gauthier I., Skudlarski P., Gore J.C., Anderson A.W. Expertise for cars and birds recruits brain areas involved in face recognition. Nature Neuroscience. 2000;3(2):191–197. doi: 10.1038/72140. [DOI] [PubMed] [Google Scholar]
- Glickman T.A., Filo O., Nachaliel U., Lenington S., Amin-Spector S., Ginor R. Novel EIS postprocessing algorithm for breast cancer diagnosis. IEEE Transactions on Medical Imaging. 2002;21(6):710–712. doi: 10.1109/TMI.2002.800605. [DOI] [PubMed] [Google Scholar]
- Gohagan J.K., Rodes N.D., Blackwell C.W., Darby W.P. Individual and combined effectiveness of palpation, thermography and mammography in breast cancer screening. Preventive Medicine. 2004;9(6):713–721. doi: 10.1016/0091-7435(80)90016-x. [DOI] [PubMed] [Google Scholar]
- Gómez-Ruiz J.A., Jerez-Aragonés J.M., Muñoz-Pérez J., Alba-Conejo E. A neural network based model for prognosis of early breast cancer. Applied Intelligence. 2004;20:231–238. doi: 10.1016/s0933-3657(02)00086-6. [DOI] [PubMed] [Google Scholar]
- Hanm J., Kamber N. Morgan Kanfmann Publishers; San Francisco: 2001. Data mining: Concepts and techniques. [Google Scholar]
- Hassan, M., Hattery, D., & Gandjbakhche, A. H. (2003). Thermal texture map—A new technique for disease assessment and treatment monitoring. 1st International conference of Thermal Texture Maps (TTM) technology in medicine and engineering. September 23–25, Houston, TX, USA.
- He, Q., & Shkarin, P. (1999). Proton magnetic resonance spectroscopy and imaging of human breast cancer by selective multiple quantum coherence transfer. In Bioengineering, proceedings of the Northeast conference (pp. 102–103).
- Head, J. F., Hoekstra, P., Keyserlingk, J., Elliott, R. L., & Diakides, N. A. (2003). Comparison of breast infrared imaging results by three independent investigators. In Proceedings of the 25th annual international conference of the IEEE EMBS (pp. 1125–1128).
- Head J.F., Wang F., Lipari C.A., Elliott R.L. The important role of infrared imaging in breast cancer. IEEE Engineering in Medicine and Biology Magazine. 2000;19(3):52–57. doi: 10.1109/51.844380. [DOI] [PubMed] [Google Scholar]
- Houssami N., Irwig L., Simpson J.M., McKessar M., Blome S., Noakes J. Sydney breast imaging accuracy study: Comparative sensitivity and specificity of mammography and sonography in young women with symptoms. American Journal of Roentgenology. 2003;180:935–940. doi: 10.2214/ajr.180.4.1800935. [DOI] [PubMed] [Google Scholar]
- Huang E., Cheng S.H., Dressman H., Pittman J. Gene expression predictors of breast cancer outcomes. The Lancet. 2003;361:1590–1596. doi: 10.1016/S0140-6736(03)13308-9. [DOI] [PubMed] [Google Scholar]
- Huo, Z., Giger, M. L., Vyborny, C. J., Olopade, F. I., & Wolverton, D. E. (1998). Computer-aided diagnosis: Analysis of mammographic parenchymal patterns and classification of masses on digitized mammograms. In Proceedings of the 20th annual international conference of the IEEE Engineering in Medicine and Biology Society (Vol. 20(2), pp. 1017–1020).
- Imaginis, Breast Cancer Diagnosis. (2004). Available from http://imaginis.com/breasthealth/biopsy/biopsy_methods.asp.
- Irwig L., Houssami N., van Vliet C. New technologies in screening for breast cancer: A systematic review of their accuracy. British Journal of Cancer. 2004;90:2118–2122. doi: 10.1038/sj.bjc.6601836. [DOI] [PMC free article] [PubMed] [Google Scholar]
- Jakubowska, T., Wiecek, B., Wysocki, M., & Drews-Peszynski, C. (2003). Thermal signatures for breast cancer screening comparative study. In Proceedings of the 25th annual international conference of the IEEE EMBS (pp. 1117–1120).
- Jones B.F. A reappraisal of the use of infrared thermal image analysis in medicine. IEEE Transactions on Medical Imaging. 1998;17(6):1019–1027. doi: 10.1109/42.746635. [DOI] [PubMed] [Google Scholar]
- Joo S., Yang Y.S., Moon W.K., Kim H.C. Computer-aided diagnosis of solid breast nodules: Use of an artificial neural network based on multiple sonographic features. IEEE Transactions on Medical Imaging. 2004;23(10):1292–1300. doi: 10.1109/TMI.2004.834617. [DOI] [PubMed] [Google Scholar]
- Kaczmarek, M., & Nowakowski, A. (2003). Analysis of transient thermal processes for improved visualization of breast cancer using IR imaging. In Proceedings of the 25th annual international conference of the IEEE EMBS (Vol. 2(2), pp. 1143–1146).
- Keyserlingk J.R., Ahlgren P.D., Yu E., Belliveau N., Yassa M. Functional infrared imaging of the breast. Journal of IEEE Engineering in Medicine and Biology. 2000;19(3):30–31. doi: 10.1109/51.844378. [DOI] [PubMed] [Google Scholar]
- Kocur C.M., Rogers S.K., Myers L.R., Burns T. Using neural networks to select wavelet features for breast cancer diagnosis. IEEE Engineering in Medicine and Biology. 1996;15(3):95–102. [Google Scholar]
- Kosmas P., Rappaport C.M., Bishop E. Modeling with the FDTD method for microwave breast cancer detection. IEEE Transactions on Microwave Theory and Techniques. 2004;52(8):1890–1897. [Google Scholar]
- Kotre J. Image processing in the fight against breast cancer. Engineering Science and Education Journal. 1993;2(1):41–46. [Google Scholar]
- Land W., Jr., Masters, T., & Lo, J. (2000). Application of a new evolutionary programming/adaptive boosting hybrid to breast cancer diagnosis. In Proceedings of the 2000 congress on evolutionary computation (Vol. 2, pp. 1436–1442).
- Land W.H., Albertelli L.E. Breast cancer screening using evolved neural networks. Proceedings of the IEEE International Conference on Systems, Man & Cybernetics. 1998;2:1619–1624. [Google Scholar]
- Lay S.F., Crump J.M., Frykberg E.R., Goedde T.A., Copeland E.M. Breast biopsy – Changing patterns during a five-year period. The American Surgeon. 1990;56(2):79–85. [PubMed] [Google Scholar]
- Leichter, I., Bamberger, P., Novak, B., Fields, S., Lederman, R., & Behar, D. (1996). Computerized diagnostics in digital mammography. 19th Convention of electrical and electronics engineers in Israel. Proceedings (pp. 406–408).
- Levine E.A., Freimanis R.I., Perrier N.D., Morton K. Positron emission mammography: Initial clinical results. Annals of Surgical Oncology. 2003;10:86–91. doi: 10.1245/aso.2003.03.047. [DOI] [PubMed] [Google Scholar]
- Lewin J.M., D’Orsi C.J., Hendrick R.E., Moss L.J., Isaacs P.K., Karellas A. Clinical comparison of full-field digital mammography and screen-film mammography for detection of breast cancer. American Journal of Roentgenology. 2002;179:671–677. doi: 10.2214/ajr.179.3.1790671. [DOI] [PubMed] [Google Scholar]
- Lin C.J., Lin C.T. An ART-based fuzzy adaptive learning control network. IEEE Transaction on Fuzzy Systems. 1997;5:477–496. [Google Scholar]
- Liu H.X., Zhang R.S., Luan F., Yao X.J., Liu M.C., Hu Z.D. Diagnosing breast cancer based on support vector machines. Journal of Chemical Information and Computer Sciences. 2003;43:900–907. doi: 10.1021/ci0256438. [DOI] [PubMed] [Google Scholar]
- Liu Y., Wang J.L., Chang H., Barsky S.H., Nguyen M. Breast-cancer diagnosis with nipple fluid bFGF. The Lancet. 2000;356:567. doi: 10.1016/S0140-6736(00)02587-3. [DOI] [PubMed] [Google Scholar]
- Lo, J. Y., & Floyd, C. E., Jr. (1999). Application of artificial neural networks for diagnosis of breast cancer. In Proceedings of the 1999 congress on evolutionary computation (Vol. 3, pp. 1755–1759).
- Lucas, J. H., & Cone, D. L. (2003). Breast cyst aspiration. American Family Physician, November 15. [PubMed]
- Malich A., Böhm T., Facius M., Kleinteich I., Fleck M., Sauner D. Electrical impedance scanning as a new imaging modality in breast cancer detection—a short review of clinical value on breast application, limitations and perspectives. Nuclear Instruments and Methods in Physics Research A. 2003;497:75–81. [Google Scholar]
- McDonald S., Saslow D., Alciati M.H. Performance and reporting of clinical breast examination: A review of the literature. CA–A Cancer Journal for Clinicians. 2004;54:345–361. doi: 10.3322/canjclin.54.6.345. [DOI] [PubMed] [Google Scholar]
- Meyer J.E., Smith D.N., Lester S.C., Kaelin C., Di Piro P.J., Denison C.M. Large-core needle biopsy of nonpalpable breast lesions. J. Am. Med. Assoc. 1999;281:1638–1641. doi: 10.1001/jama.281.17.1638. [DOI] [PubMed] [Google Scholar]
- Moore S.K. Better breast cancer detection. IEEE Spectrum. 2001;38(5):50–54. [Google Scholar]
- Moses W.W. Positron emission mammography imaging. Nuclear Instruments and Methods in Physics Research: Section A. 2004;525(1–2):249–252. [Google Scholar]
- Murthy K., Aznar M., Thompson C.J., Loutfi A., Lisbona R., Gagnon J.H. Results of preliminary clinical trails of the positron emission mammography system PEM-I: A dedicated breast imaging system producing glucose metabolic images using FDG. Journal of Nuclear Medicine. 2000;41(11):1851–1858. [PubMed] [Google Scholar]
- Naguib R.N.G., Adams A.E., Horne C.H.W., Angus B., Sherbet G.V., Lennard T.W.J. The detection of nodal metastasis in breast cancer using neural network techniques. Physiological Measurement. 1996;17:297–303. doi: 10.1088/0967-3334/17/4/007. [DOI] [PubMed] [Google Scholar]
- National Breast Cancer Centre Position Statement. (2004). Available from http://www.nbcc.org.au/media/nbccposition.html.
- Ng E.Y.K., Fok S.C. A framework for early discovery of breast tumor using thermography with artificial neural network. The Breast Journal. 2003;9(4):341–343. doi: 10.1046/j.1524-4741.2003.09425.x. [DOI] [PubMed] [Google Scholar]
- Ng, E. Y. K., Fok, S. C., Ng, F. C., & Sim, L. S. J. (2001). Breast tumor detection by thermography. Applied research fund (RG69/98). School of Mechanical and Production Engineering, Nanyang Technological University.
- Ng E.Y.K., Fok S.C., Peh Y.C., Ng F.C., Sim L.S.J. Computerized detection of breast cancer with artificial intelligence and thermograms. Journal of Medical Engineering & Technology. 2002;26(4):152–157. doi: 10.1080/03091900210146941. [DOI] [PubMed] [Google Scholar]
- Ng Y.K., Peh Y.C., Fok S.C., Ng F.C., Sim L.S.J. Noninvasive diagnosis of breast cancer using thermography with artificial neural network. Journal of medical Engineering and Technology. 2002;26(4):152–157. doi: 10.1080/03091900210146941. [DOI] [PubMed] [Google Scholar]
- Ohashi Y., Uchida I. Applying dynamic thermography in the diagnosis of breast cancer. IEEE Engineering in Medicine and Biology Magazine. 2000;19(3):42–51. doi: 10.1109/51.844379. [DOI] [PubMed] [Google Scholar]
- Orel S.G. MR imaging of the breast. Radiologic Clinics of North America. 2000;38:899–913. doi: 10.1016/s0033-8389(05)70208-6. [DOI] [PubMed] [Google Scholar]
- Pacific Chiropractic and Research Center. Breast cancer and early detection. Available at http://www.breastthermography.com.
- Pendharkar P.C., Rodger J.A., Yaverbaum G.J., Herman N., Benner M. Association, statistical, mathematical and neural approaches for mining breast cancer patterns. Expert Systems with Applications. 1999;17:223–232. [Google Scholar]
- Pisano E.D., Fajardo L.L., Caudry D.J., Sneige N. Fine-needle aspiration biopsy of nonpalpable breast lesions in a multicenter clinical trial: Results from the radiologic diagnostic oncology group V. Radiology. 2001;219:785–792. doi: 10.1148/radiology.219.3.r01jn28785. [DOI] [PubMed] [Google Scholar]
- Puglisi F., Zuiani C., Bazzocchi M., Valent F. Role of mammography, ultrasound and large core biopsy in the diagnostic evaluation of papillary breast lesions. Oncology. 2003;65:311–315. doi: 10.1159/000074643. [DOI] [PubMed] [Google Scholar]
- Qi, H., & Diakides, N. A. (2003). Thermal infrared imaging in early breast cancer detection – A survey of recent research. In Proceedings of the 25th annual international conference of the IEEE EMBS (pp. 1109–1112).
- Rajentheran R., Rao C.M., Lim E., Lennard T.W.J. Palpable breast cancer which is mammograpically invisible. The Breast. 2001;10(5):416–420. doi: 10.1054/brst.2000.0270. [DOI] [PubMed] [Google Scholar]
- Reinikainen, H. (2003). Complementary imaging of solid breast lesions: Contribution of ultrasonography, fine-needle aspiration biopsy, and high-field and low-field MR imaging. Academic dissertation. Faculty of Medicine, University of Oulu, Finland.
- Sajda P., Spence C., Parra L. A multi-scale probabilistic network model for detection, synthesis, and compression in mammographic image analysis. Medical Image Analysis. 2003;7(2):187–204. doi: 10.1016/s1361-8415(03)00003-3. [DOI] [PubMed] [Google Scholar]
- Santos-André T.C.S., da Silva A.C.R. A neural network made of a Kohonen’s SOM coupled to a MLP trained via backpropagation for the diagnosis of malignant breast cancer from digital mammograms. International Joint Conference on Neural Networks. 1999;5:3647–3650. [Google Scholar]
- Schnorrenberg F., Pattichis C.S., Kyriacou K.C., Schizas C.N. Computer-aided detection of breast cancer nuclei. IEEE Transactions on Infomration Technology in Biomedicine. 1997;1(2):128–140. doi: 10.1109/4233.640655. [DOI] [PubMed] [Google Scholar]
- Schnorrenberg F., Tsapatsoulis N., Pattichis C.S., Schnizus C.N. Improved detection of breast cancer nuclei using modular neural networks. IEEE Engineering in Medicine and Biology Magazine. 2000;19(1):48–63. doi: 10.1109/51.816244. [DOI] [PubMed] [Google Scholar]
- Seker, H., Odetayo, M., Petrovic, D., Naguib, R. N. G., Bartoli, C., Alasio, L., et al. (2001). Prognostic comparison of statistical neural and fuzzy methods of analysis of breast cancer image cytometric data. In Proceedings of 23rd annual EMBS international conference (pp. 3811–3814).
- Simmon J.R., Kalbhen C.L., Cooper R.A., Flisak M.E. Accuracy and complication rates of US-guided vacuum-assisted core breast biopsy: Initial results. Radiology. 2000;215:694–697. doi: 10.1148/radiology.215.3.r00jn37694. [DOI] [PubMed] [Google Scholar]
- Singhal, H., & Thomson, S. (2004). Breast cancer evaluation. eMedicine.com, Inc. Available from http://www.emedicine.com/med/topic3287.htm.
- Spengler, R. (2003). Breast cancer (BRCA) gene testing, healthwise. Available from http://my.webmd.com/hw/breast_cancer/tu6462.asp.
- Stavros A.T., Thickman D., Rapp C.L., Dennis M.A., Parker S.H., Sisney G.A. Solid breast nodules: Use of sonography to distinguish between benign and malignant lesions. Radiology. 1995;196:123–134. doi: 10.1148/radiology.196.1.7784555. [DOI] [PubMed] [Google Scholar]
- Sun X., Qian W., Song D. Ipsilateral-mammogram computer-aided detection of breast cancer. Computerized Medical Imaging and Graphics. 2004;28:151–158. doi: 10.1016/j.compmedimag.2003.11.004. [DOI] [PubMed] [Google Scholar]
- Tan, T. Z., Quek, C., & Ng, G. S. (2004). FALCON-AART: An improved version of FALCON-ART. Technical report. C2i-TR-04/002. School of Computer Engineering, Nanyang Technological University, Singapore.
- Tan, T. Z. (2005). Complementary learning fuzzy neural network for medical domain and bioinformatics domain applications. First year report, Department of Computer Science, School of Coumpter Engineering, Nanyang Technological University.
- Tan, T. Z., Quek, C., Ng, G. S., & Ng, E. Y. K. (2004). Breast cancer diagnosis using thermography and complementary learning fuzzy neural network. In Proceedings of the first international bioengineering conference (IBEC) (pp. 65–68).
- Tateishi T., Machi J., Feleppa E.J., Oishi R. In vitro diagnosis of axillary lymph node metastases in breast cancer by spectrum analysis of radio frequency echo signals. Ultrasound in Medicine & Biology. 1998;24(8):1151–1159. doi: 10.1016/s0301-5629(98)00100-8. [DOI] [PubMed] [Google Scholar]
- Thompson C.J., Murthy K., Picard Y., Weinberg I.N., Mako R. Positron emission mammography (PEM): A promising technique for detecting breast cancer. IEEE Transaction on Nuclear Science. 1995;42(1):1012–1017. [Google Scholar]
- Tsapatsoulis N., Schnorrenberg F., Pattichis C., Kollias S. An image analysis system for automated detection of breast cancer nuclei. IEEE International Conference on Image Processing. 1997;3:512–515. [Google Scholar]
- Tung W.L., Quek C. A novel approach to the derivation of fuzzy membership functions using Falcon-MART architecture. Pattern Recognition Letters. 2001;22:941–958. [Google Scholar]
- Usuki, H., Maeta, H., Maeba, T., Wakabayashi, H., et al. (2000). Standardization of thermographic breast cancer detection-role of qualitative findings and quantitative findings. In Proceedings of the 22nd annual international conference of the IEEE Engineering in Medicine and Biology Society (Vol. 2(2), pp. 219–1222).
- van’t Veer L.J., Dai H., van de Vijver M.J., He Y.D. Gene expression profiling predicts clinical outcome of breast cancer. Nature. 2002;415:530–536. doi: 10.1038/415530a. [DOI] [PubMed] [Google Scholar]
- Varga, M. J., & De Muynck, P. (1992). Thermal analysis of infra-red mammography. In Proceedings of 11th IAPR international conference on pattern recognition. Conference C: Image, speech and signal analysis (Vol III, pp. 360–364).
- Vlahou A., Laronga C., Wilson L., Gregory B. A novel approach toward development of a rapid blood test for breast cancer. Clinical Breast Cancer. 2003;4(3):203–209. doi: 10.3816/cbc.2003.n.026. [DOI] [PubMed] [Google Scholar]
- Wang X., Zheng B., Good W.F., King J.L., Chang Y. Computer-assisted diagnosis of breast cancer using a data-driven Bayesian belief network. International Journal of Medical Informatics. 1999;54:115–126. doi: 10.1016/s1386-5056(98)00174-9. [DOI] [PubMed] [Google Scholar]
- Yao, X., & Liu, Y. (1999). Neural networks for breast cancer diagnosis. In Proceedings of the 1999 congress on evolutionary computation (Vol. 3, pp. 1760–1767).
- Yeung D.K.W., Cheung H.S., Tse G.M.K. Human breast lesions: Characterization with contrast-enhanced in vivo proton MR spectroscopy-initial results. Radiology. 2001;220:40–46. doi: 10.1148/radiology.220.1.r01jl0240. [DOI] [PubMed] [Google Scholar]