

Abstract
The optimal virulence of a pathogen is determined by a trade-off between maximizing the rate of transmission and maximizing the duration of infectivity. Treatment measures such as curative therapy and case isolation exert selective pressure by reducing the duration of infectivity, reducing the value of duration-increasing strategies to the pathogen and favoring pathogen strategies that maximize the rate of transmission. We extend the trade-off models of previous authors, and represents the reproduction number of the pathogen as a function of the transmissibility, host contact rate, disease-induced mortality, recovery rate, and treatment rate, each of which may be influenced by the virulence. We find that when virulence is subject to a transmissibility-mortality trade-off, treatment can lead to an increase in optimal virulence, but that in other scenarios (such as the activity-recovery trade-off) treatment decreases the optimal virulence. Paradoxically, when levels of treatment rise with pathogen virulence, increasing control efforts may raise predicted levels of optimal virulence. Thus we show that conflict can arise between the epidemiological benefits of treatment and the evolutionary risks of heightened virulence.
Keywords: Evolution, Optimal virulence, Treatment, Mathematical model, Virulence management, Public health interventions, Disease control
1. Introduction
While the development of drug resistance is perhaps the best-known evolutionary response to treatment programs, public health interventions may exert other selective pressures on pathogens. There has been mounting recognition of the need to understand the balance between the immediate epidemiological benefits and longer-term evolutionary risks of interventions (Dieckmann et al., 2002, Gandon and Day, 2003, Elliot, 2003, Galvani, 2003). Recent work has revealed that vaccines that reduce pathogen replication or toxicity favor increased virulence, while vaccines that reduce the susceptibility of hosts to infection select for lower levels of virulence (Gandon et al., 2001, Gandon et al., 2003). Here we explore the effect of treatments that act by reducing the infectious period, such as curative therapy or case isolation measures, on the optimal virulence level of a pathogen.
The evolutionary fitness of a pathogen is quantified by its basic reproduction number (), which is the average number of secondary cases generated by an initial infection in a susceptible population (Anderson and May, 1991, MacDonald, 1952). In the absence of within-host competition among pathogen strains (Nowak and May, 1994), the optimal virulence is determined by maximizing subject to trade-offs between epidemiological parameters that are affected by pathogen virulence (May and Anderson, 1983, Chapin, 1926). However, the trade-off between disease-induced mortality (often taken as the definition of virulence) and pathogen transmissibility (assumed to increase with virulence) has been criticized as too simple (Ebert and Bull, 2003a). Recent work on virulence evolution has explored the importance of host population structure (Read and Keeling, 2003, Boots et al., 2004, Thrall and Burdon, 2003) and more complex interactions between epidemiological parameters (Andre et al., 2003, Ganusov and Antia, 2003).
In this work, we define virulence as the extent of host resource exploitation by the pathogen, which correlates with harm to the host (and reduced fitness) (Sigmund et al., 2002, Galvani, 2003, Poulin and Combes, 1999). We review evidence that as virulence increases, the host may be harmed in four ways: (1) increased mortality, (2) slower recovery from infection, (3) reduced activity, i.e. fewer contacts with other individuals, and (4) increased probability of transmission given a contact. Furthermore, as increasing pathogen virulence worsens symptoms, rates of treatment or isolation of infectious hosts may increase (Tuckett, 1976, Twaddle, 1979). Thus, we consider evolution of pathogens with a wide range of disease manifestations, including non-lethal infectious diseases such as gonorrhea, and show under what circumstances curative therapy or case isolation may change the optimal virulence.
2. The reproduction number
Denoting the level of disease control or treatment effort by u, the reproduction number is the number of secondary cases that would be generated by a single case in a wholly susceptible population in the presence of control at the level u. When there is no control and , ; increasing values of u denote increasing treatment effort. We define the effective contact rate E as the rate at which a susceptible produces new infectives in a wholly susceptible population; for the simple model of disease transmission (Anderson and May, 1991, Bailey, 1975, Kermack and McKendrick, 1927) discussed in the Appendix, , where is the transmission probability per contact and is the number of contacts per unit time; E is independent of treatment effort u in this model. The mean duration of infectivity D is given by (Anderson and May, 1991)
| (1) |
where is the background removal rate, is the disease-specific mortality rate, is the recovery rate, and the per-capita removal rate due to treatment or case isolation. We assume that always increases with the effort u and that . The reproduction number itself is then given simply by Anderson and May (1991); this expresses the trade-off between the effective contact rate and the duration of transmission that determines the evolutionarily optimal level of virulence.
In this paper, we will introduce plausible functional forms for , , , , and in terms of pathogen virulence v, and find explicit expressions for the optimal virulence levels for a set of disease-dependent special cases. This allows us to make predictions regarding the effect of treatment on optimal virulence levels, including cases where treatment rates are higher for more virulent pathogens. We will characterize how changes in treatment effort u affect the values for which is maximized, and show that curative treatment influences optimal virulence by reducing the benefits the pathogen can obtain from strategies that increase the duration of infectiousness.
3. Pathogen strategies
All else being equal, a pathogen benefits from a large transmissibility and host activity level , and a small recovery rate and death rate , thus maximizing both the effective contact rate and duration of infectivity. However, recent theory has emphasized that these parameters may not, in general, vary independently. For instance, increasing transmissibility may be possible only through enhanced virulence, which in turn may lead to an increased mortality or to reduced contact rate (see discussion in Lipsitch and Moxon, 1997). We now review evidence for the dependence of disease-induced death rates, host activity levels, transmissibility, and recovery rates on the level of virulence.
The link between pathogen virulence and disease-induced mortality is clear. Indeed, in many studies virulence is defined as the increase in mortality rate due to disease (Day, 2002). In this study, we treat cases where disease mortality rates are linearly proportional to virulence (the standard assumption), or where the pathogen produces no disease-induced mortality, but harms the host in other ways.
As virulence is increased, the normal activities of the host may become increasingly impeded, leading to a potential reduction of the contact rate (e.g. (Ewald, 1994, Upchurch et al., 1989, Lloyd-Smith et al., 2004)). Symptoms themselves may lead to behavioral changes (such as increased sleep, reduced sexual activity, and decreased mixing in the community) (Dunn and Swiergiel, 1998) arising from pathogen resource exploitation or the cost of immune response (Levin and Antia, 2001). We consider the case where host contact rate is a concave-up decreasing function of pathogen virulence.
Greater pathogen loads within hosts may yield higher transmission probability per contact (“transmissibility”), , due to higher pathogen concentrations in bodily fluids or to more severe symptoms (Ewald, 1994, Levin, 1996). For example, coughing expels droplets which facilitate the spread of airborne infections such as influenza (Kilbourne, 1987) and tuberculosis (Hopewell and Bloom, 1994). Higher densities of pathogen should, all else being equal, result in a more virulent or harmful infection. Thus, a positive relationship between the transmissibility and virulence (Bremermann and Pickering, 1983, May and Anderson, 1983, Ewald, 1994, Lipsitch and Moxon, 1997) may occur in many host-pathogen systems, including Schistosoma mansoni (Davies et al., 2001), trypanosomes (Diffley et al., 1987), influenza (Van dergoot et al., 2003), myxoma virus in rabbits (Fenner and Ratcliffe, 1965, Anderson and May, 1991), Plasmodium species (Mackinnon and Read, 1999), canine parvovirus (Meunier et al., 1985) and HIV (Khouri et al., 1995, Jacquez et al., 1994, Riddler and Mellors, 1997, Katzenstein and Holodniy, 1995/1996, Katzenstein et al., 1996, Coombs et al., 1996, Craib et al., 1997, Fiore et al., 1997, Quinn et al., 2000). We treat the case where transmissibility is a concave-down increasing function of virulence, where necessarily , with an independent parameter determining whether a completely avirulent strain () is still transmissible (as are many commensal microorganisms (Hooper and Gordon, 2001)); see Eq. (9) below for details.
Pathogens are under selection to evade immunity and hence prolong infection. For example, trypanosomes and malarial parasites undergo antigenic variation within single infections. Heightened virulence has been found to prolong the period of infectiousness in lizard malaria Plasmodium mexicanum (Eisen and Schall, 2000), myxoma virus in rabbits (Fenner and Ratcliffe, 1965, Anderson and May, 1991), canine parvovirus (Meunier et al., 1985), Bordetella avium (Temple et al., 1998), hepatitis B virus (Fong et al., 1994) and influenza (Van dergoot et al., 2003). We explore the case in which the recovery rate is a decreasing (or at least non-increasing) function of the virulence parameter v. (Note that a recovery rate that increases with the virulence could be subsumed into the increasing mortality rate without loss of generality.)
4. Disease control strategy
We denote the level of disease control effort by u, such that the treatment rate increases as u increases (i.e. ), and . The effect of treatment is to remove individuals from the infective class at rate ; examples are tuberculosis (Comstock and Cauthen, 1993) and gonorrhea (DeMaio and Zenilman, 1998) for curative therapy, or severe acute respiratory syndrome (SARS) (Lloyd-Smith et al., 2003) and smallpox (e.g. Porco et al., 2004) for case isolation. The treatment rate may also be related to the virulence, since treatment should be sought more often as symptoms become more severe (Tuckett, 1976, Twaddle, 1979). Severe symptoms may also increase control efforts for contact tracing, resulting in prophylactic treatment or quarantine, as occurred during the recent SARS outbreak (e.g. Lloyd-Smith et al. (2003)). We therefore consider the general case where depends on u and v, as well as the special case of virulence-independent treatment.
5. The optimal virulence under treatment
We assume , so if decreases monotonically with v, the optimal virulence is . Otherwise, a local maximum of occurs at if
| (2) |
and
The virulence level at which is maximized may also be found by substituting into Eq. (2) and finding the value which solves
| (3) |
This condition corresponds to that value of the virulence for which gains in effective contact rate are exactly balanced by losses in duration of infectivity, or vice versa. When the form of E is unimodal, let denote the value of v at which E is maximized; similarly, when D is unimodal in v for a particular u, we may denote by that value of v such that D is maximized. In the case of virulence-independent treatment, is independent of u.
We are interested in the sign of , i.e. does increasing treatment effort lead to higher or lower levels of optimal virulence? Differentiating Eq. (2) with respect to u and rearranging leads to an expression for the dependence of the optimal virulence on the control variable u:
| (4) |
provided . If corresponds to a local maximum of and , then . In this case, from Eq. (4) we see that if and only if . Thus, if increases in the control variable u increase the marginal fitness with respect to the virulence, then the treatment program will increase the optimal virulence of the pathogen and thus provide a selective pressure for the pathogen virulence to increase.
To determine the sign of at the optimal virulence, we first observe that Eq. (1) implies that , and since E has no explicit dependence on u, . Since, by definition, ,
Substituting and rearranging leads to
| (5) |
Eqs. (3) and (5) together imply that at ,
| (6) |
Hence for and , and both D and E unimodal in v, Eq. (6) implies that if and only if
| (7) |
Therefore, from condition (4), if and only if Eq. (7) holds. That is, the optimal virulence increases with greater treatment effort if and only if the relative increase in E per unit increase in v outweighs the relative increase in the marginal treatment rate .
6. Virulence-independent treatment
In the case of virulence-independent treatment, . Since by assumption (and ), it follows from (7) that if and only if
| (8) |
In the example shown in Fig. 1 , unimodal curves for E and D are plotted from the functional forms for parameters proposed below. The optimal virulence occurs at the unique intersection of the and curves (Eq. (3)); in Fig. 1A, and , whereas in Fig. 1B, and . Two curves for d are shown: the dashed curve corresponds to a higher treatment rate than the solid curve . Increasing treatment flattens the d-curve, and shifts the optimal virulence away from the duration maximizing value and toward the transmission-rate maximizing value . Hence, the optimal virulence increases when and decreases when . The figure illustrates the following proposition (proven in the appendix).
Proposition
If treatment rates are independent of pathogen virulence, and D and E are differentiable and unimodal, with being the point at which the maximum of E occurs, and being the point at which the maximum of D occurs (being independent of u), then has the same sign as .
Fig. 1.
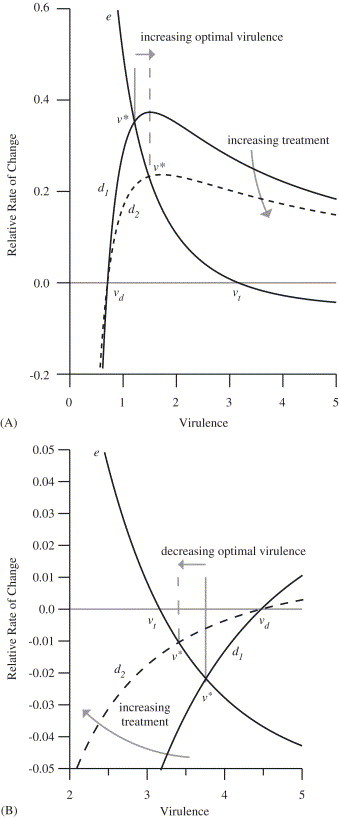
Virulence dependence of the relative rate of change of the effective contact rate () and the duration (, where the solid line and dashed line correspond to lower and higher treatment rates, respectively.) The curves correspond to the case and . (A) Increasing treatment increases the optimal virulence, since the dashed line intersects the e-curve at larger virulence. (Parameter values: per unit time, per unit time, , ,, per unit time, , , ; for the low treatment line, per unit time, and for the high treatment dashed line, per unit time.) (B) Increasing treatment decreases the optimal virulence, since the dashed line intersects the e-curve for smaller values of v. (Parameter values: as in A except per unit time.)
At the value that maximizes transmission, increasing the virulence decreases the effective contact rate (E), but produces a larger proportional increase in the duration of infectivity (D), so the overall product is larger (Fig. 2 ). The effect of treatment is to reduce the potential proportional increase in the duration that is possible by changes in virulence, and by reducing the value of “trading off” transmission for duration, to shift the overall optimum (upwards or downwards) toward the transmission-rate maximizing value . Hence, as the treatment rate increases, recovery and mortality become less important as determinants of duration.
Fig. 2.
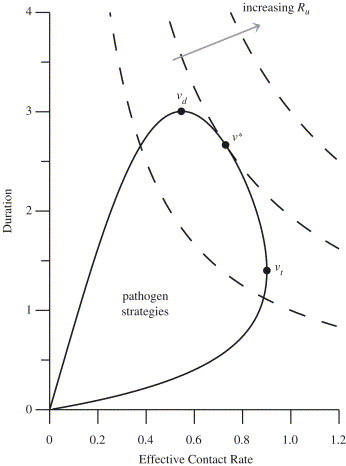
Relationship between , , and as indicated on a parametric plot of the effective contact rate and the duration of infectivity as a function of the virulence; the dashed curves are contours of . At the points labeled and the effective contact rate and duration of infectivity are maximized, respectively. At the point labeled , the reproduction number is maximized. The solid curve corresponds to the case and as given in Fig. 1, with parameters as in Fig. 1A.
Based on the empirical evidence outlined above, plausible functional forms for the four epidemiological parameters are as follows:
| (9) |
| (10) |
| (11) |
and
| (12) |
For the most general case, the change in optimal virulence as the treatment level increases is illustrated numerically for a range of values of (the transmission probability when ) in Fig. 3 . When , the optimal virulence increases as the treatment level increases; by the time , the optimal virulence decreases as the treatment level increases.
Fig. 3.

Changes in optimal virulence due to increasing treatment for the case and (as given in Fig. 1) are illustrated for a range of values of (indicated above each curve). Other parameter values are , , per unit time, , per unit time, per unit time, per unit time, , and .
7. Special cases
There are six simple special cases in which two of the four parameters , , , and vary with the virulence (Table 1 ). In the transmissibility-recovery case, the transmissibility and the recovery rate are functions of virulence and and are constant; then the optimal virulence . In the contact-mortality case, the contact rate decreases with virulence and the mortality rate increases with the virulence, but and remain constant; here, . More interesting are the four remaining cases.
Table 1.
Special cases
Contact–Transmissibility Trade-off (CT): In this case, the transmissibility increases and the contact rate decreases as the virulence increases, while the duration of infectivity is independent of virulence (Table 1). The optimal virulence maximizes the effective contact rate: and does not depend on the treatment rate. Such a scenario may occur when the duration of infectivity is determined by the time required for the host to mount a sufficient immune response.
Recovery–Mortality Trade-off (RM): In this scenario, the mortality rate increases and the recovery rate decreases as pathogen virulence increases (Bremermann and Pickering, 1983, Kaitala et al., 1997, May and Anderson, 1983, van Baalen, 1998), but neither the transmissibility nor the contact rate depend on the virulence (Table 1). Here, the optimal virulence is the duration maximizing value and does not depend on the treatment rate; increasing treatment results in shorter durations of infectivity, but the optimum virulence is unaffected.
Contact–Recovery Trade-off (CR): In this case, as the pathogen becomes more virulent, the contact rate and the recovery rate decrease. We assume that the transmissibility and mortality rates are not dependent on the virulence (, without loss of generality) as shown in Table 1; the maximum effective contact rate is attained at ; the maximum duration of infectivity is attained as . In this case, decreases in v for , provided
| (13) |
Since is positive, Eq. (13) is always satisfied whenever ; whenever Eq. (13) is satisfied, . When Eq. (13) is not satisfied, the optimal virulence is given by
| (14) |
The value of never increases with treatment intensity . When , the optimal virulence is always zero, no matter what the treatment level is. This is because (13) is satisfied for all and must be monotone decreasing. If , so that , then , which is always positive and strictly decreases as increases; increasing treatment results in a decreasing optimal virulence.
Transmission–Mortality Trade-off (TM): We extend the standard assumption of a positive relationship between increased transmissibility and increased mortality (Bremermann and Pickering, 1983, Bremermann and Thieme, 1989, Day, 2002, Frank, 1996, Lipsitch and Moxon, 1997, Lipsitch and Nowak, 1995, Stearns, 2000, van Baalen, 2002, Frank, 2002) to include effects of treatment (see Table 1). As the virulence increases, the transmission rate increases, and the maximum effective contact rate is attained as . If the recovery rate is also unaffected and the mortality rate increases with the virulence according to the assumptions given in Table 1, then as the virulence increases, the duration of infectivity decreases (Bremermann and Pickering, 1983, Lenski and May, 1994); the maximum duration of infectivity is attained at . The optimal virulence is given by
| (15) |
whenever the term under the radical is nonnegative, and zero otherwise. Here, never decreases as increases (or equivalently, since increases as the control effort u increases, ). In this case, the transmission-rate maximizing value , and the duration maximizing value . Since the duration maximizing value is below the transmission-rate maximizing value , increasing levels of treatment lead to a nondecreasing optimal virulence. In particular, whenever , the optimal virulence is greater than zero, and increases as increases. Observe that whenever , the optimal value of v is zero for low treatment values, and remains so until has become sufficiently large.
The increase in optimal virulence with treatment for the case TM is illustrated in a standard graphical approach to determine the evolutionarily stable level of virulence (Dieckmann et al., 2002) (Fig. 4 A). For simplicity, we assume for this figure, so that . The curve shows values for which the relationship is satisfied. All values of v and for which the reproduction number takes on any particular value lie on a straight line; steeper slopes correspond to larger , and the v-intercept is determined by the treatment rate (. For concave-down curves, the optimal virulence is the virulence level corresponding to the point of tangency—where the slope is steepest. As increases under virulence-independent treatment, the intercept moves left, but the point of tangency moves right (the optimal virulence increases).
Fig. 4.
Changes in optimal virulence due to increasing treatment for the transmissibility-mortality case (the case TM in Table 1). The solid curved line in each case shows ; the straight lines show combinations of and v corresponding to constant values of (see text for details). (A) For the case of virulence-independent treatment, the high-treatment dashed line intersects the curve for higher values of the virulence than the low-treatment solid line. (Parameter values: per unit time, , , , , ; for the solid line, per unit time and ; for the dashed line, per unit time and =3.9.) (B) Virulence-dependent treatment illustrated for ; the dashed line corresponds to the largest possible value of for the given -v relationship. The point of tangency occurs at a lower value of virulence: increasing treatment rates for more virulent organisms outweighs the benefit of increased transmission rates, and so increasing treatment effort reduces the optimal virulence. (Parameter values: same as for part A, except per unit time, and for the solid line and for the dashed line.)
In general, continuity of does not guarantee continuity of the value of v which maximizes is, as a function of u (Bank et al., 1983). A simple numerical example is provided by
, , , , and denotes the unit step function. Letting , , , , , , , , and , we find that the product is bimodal, and the value that optimizes jumps from 0 to approximately 2.09 at . Near this value, small additional increases in the control effort cause large changes in the optimal virulence.
8. Virulence-dependent treatment
While selective pressure due to increased treatment of more virulent strains of a pathogen may be expected to reduce the optimal virulence (Galvani, 2003), Eq. (7) shows that it is possible for treatment to increase the optimal virulence even when more virulent strains are treated more rapidly than less virulent strains. Large positive values for reverse the inequality in Eq. (7) so that increasing treatment reduces the optimal virulence. Small positive values of would result in slight increases or decreases in the optimal virulence.
8.1. Example
The bilinear form provides a simple functional form in which the treatment rate increases with increasing control effort u and with the virulence v; substituting in Eq. (7) reveals that the qualitative effect of treatment on optimal virulence levels is determined by how the effective contact rate and marginal treatment rate vary with pathogen virulence. We first assume that virulence affects both contact rates and transmissibility according to Eqs. (9) and (10). Since , the right-hand side of Eq. (7) is ; it can then be shown that for any positive ; Eq. (7) is not satisfied, and increasing treatment necessarily results in a decrease in the optimal virulence when . The same result holds when only or only depends on virulence.
We next reconsider in detail the special case TM (using the parameters in Table 1), under the assumption that the treatment rate increases with pathogen virulence according to . If
| (16) |
then the optimal virulence is given by
which decreases as u increases. As u increases, the left-hand side of the inequality (16) increases, until finally it becomes greater than zero. When this occurs and inequality (16) is not satisfied, monotonically decreases in v, and the optimal virulence is given by . Further increases in u continue to increase the left hand side of the inequality (16), but cannot further decrease below 0. If , the optimal virulence reduces to
which decreases monotonically for all u and approaches 0 as . For a TM trade-off and , therefore, increasing treatment effort u always causes decreases in the optimal virulence level ; this contrasts with the above results for a TM trade-off under virulence-independent treatment, for which (Eq. (15)).
This case (TM trade-off with and ) is illustrated in Fig. 4B. As in Fig. 4A, the curve shows the relationship and straight lines show combinations of and v that yield fixed values of . Steeper lines correspond to higher values of , and the optimal virulence (for a given v-intercept) is determined by the point of tangency. For , the v-intercept of the constant- lines is . Increasing treatment effort u shifts the v-intercept to the right and causes the optimal virulence to decrease, as can be seen by comparing the dashed line (virulence-dependent treatment following ) to the solid line (no treatment).
Other simple formulations of virulence-dependent treatment rates can yield opposite results, though, contrary to the intuitive expectation that targeting more virulent strains will exert selective pressure to decrease virulence. We illustrate with a simple example: . When , the optimal virulence is given by
| (17) |
First note that when treatment is virulence-independent, and increasing the treatment rate increases the optimal virulence as in Fig. 4A. When , the outcome depends on the relative magnitude of the virulence-dependent and -independent components of (i.e. versus k). When , increasing the treatment rate will decrease the optimal virulence. When , however, the treatment rate does not increase fast enough as virulence increases, and so increasing treatment leads to higher optimal virulence for the pathogen (i.e. the same qualitative behavior as the virulence-independent treatment case). Therefore, faster treatment of more virulent strains does not always exert sufficient selective pressure for increasing treatment effort to decrease the optimal virulence; the benefit to the pathogen of increased transmissibility can outweigh the cost of the higher treatment rate.
9. Discussion
The optimal virulence of a pathogen may either increase or decrease in response to treatments that reduce the duration of infectivity, such as curative therapy and case isolation. Under the prevalent theory of virulence evolution, pathogen virulence evolves according to a trade-off between maximizing the number of new cases generated per unit time and maximizing the duration of infectivity. Treatment interventions reduce the value of duration-increasing strategies. Consequently, treatment shifts the optimal virulence toward values which produce larger numbers of new cases per unit time. This may result in increases or decreases of optimal virulence levels, depending on whether the virulence level that maximizes duration (independent of transmission) is below or above the virulence level that maximizes transmission (independent of duration). We applied this result to several special cases, extending trade-off models of previous authors, for the situation where treatment rates are independent of pathogen virulence. We found that when virulence is subject to a transmissibility-mortality trade-off, increasing treatment would lead to an increase in optimal virulence, but that in other cases optimal virulence is decreased (e.g. for the contact–recovery trade-off) or unaffected (e.g. for the recovery–mortality and contact-transmissibility trade-offs) by increasing treatment rates.
Our analysis reveals the possibility that virulence-dependent treatment rates (i.e. faster treatment for more virulent pathogen strains) may counteract evolutionary pressures toward increased virulence, providing an additional benefit to such policies (Galvani, 2003). The model can be extended to explore different modes of intervention (for instance, partially effective therapy or infection control measures that reduce transmissibility instead of duration; c.f. (Gandon et al., 2001, Gandon et al., 2003)) or availability of treatment (such as fixed delays rather than competing exponential risks (Blower et al., 1998)). A further extension could treat sociological effects of treatment availability, such as increasing contact rates or more risky behavior (e.g. Blower and McLean (1994)).
In the most general setting, including coinfection or within-host competition between different strains, strains with the largest reproduction number may not prevail. Within-host competition may lead to increases in the virulence of a pathogen beyond what would optimally maximize the reproduction number (Bremermann and Pickering, 1983, Nowak and May, 1994, Read and Taylor, 2001, van Baalen and Sabelis, 1995, van Baalen, 1998, Williams and Nesse, 1991), although this escalation may be moderate as shown by the intermediate virulence reached by rabbit myxoma (Fenner and Myers, 1978, Fenner and Ratcliffe, 1965, Fenner, 1983). Our model could be extended to include a fitness function which incorporates within-host competition (Regoes et al., 2000), though in this case host demography may also need to be considered (Castillo-Chavez and Velasco-Hernandez, 1998). Other limitations of maximization have been raised (Dieckmann, 2002), including that virulence levels may be coincidental (e.g. Levin, 1996), but it is still a productive approach to the study of optimal virulence (e.g. Gandon et al., 2001, Boots et al., 2004). Within this adaptive framework, we seek to determine the strategy that is evolutionarily optimal to the pathogen under specified model assumptions, but are limited in our predictions of whether such an optimum will actually be reached.
We have defined virulence as the extent of host exploitation by the pathogen, and used it as a driving variable for four epidemiological parameters. This framework is appropriate for pathogens with greatly differing natural histories, including non-lethal diseases (e.g. gonorrhea) that are excluded by narrower definitions of virulence that pertain only to disease-induced death. Furthermore the validity of a simple trade-off between mortality and transmissibility has been challenged (Ebert and Bull, 2003a, Ebert and Bull, 2003b). We have reviewed the empirical evidence for more general trade-offs between epidemiological parameters (see also Day, 2003), and presented analysis of this general case. Our study is also the first, to our knowledge, to explicitly consider the link between virulence and host contact rates. The functional dependence of epidemiological parameters on virulence, however, is difficult to ascertain empirically. A recent study found dramatic differences in virulence evolution among models with markedly different formulations of transmission and host death, suggesting that detailed quantitative understanding of particular host–parasite interactions is required to reliably predict virulence evolution (Ganusov and Antia, 2003). In this paper, we first presented general results applicable to arbitrary functional formulations, then explored examples based on plausible functional forms and special cases representing broad classes of disease natural histories.
The models presented in this paper show that treatment programs may either increase or decrease the optimal virulence of a pathogen, depending on details of the host–pathogen interaction. In conjunction with recent work on vaccination (Gandon et al., 2001, Gandon et al., 2003) and drug resistance (Bonhoeffer, 2002), this study is a step toward understanding the evolutionary consequences of public health interventions. Further research, particularly empirical and interdisciplinary work, may enable evolutionary theory of pathogens to constructively inform public health decision-making.
Acknowledgements
We would like to thank T.J. Aragón, R.S. Cantrell, G.C. Cosner, W.M. Getz, the late E. Karmon, M.H. Katz, T.M. Lietman, and several anonymous reviewers for their helpful comments and suggestions. This work has been supported in part by NIDA grant 5-R01-DA-13510.
Appendix A.
A.1. Transmission model
Denoting the number of susceptible individuals by X, the number of infected individuals by Y, and the number of removed individuals by Z, a simple epidemic model is as follows:
where is the inflow rate of new susceptibles, is the per-capita background removal rate, is the probability of pathogen transmission given a contact between a susceptible and an infective, is the contact rate per susceptible or recovered individual, is the contact rate per infected individual, is the per-capita disease-induced mortality rate, is the per-capita recovery rate from disease, is the per-capita treatment rate, and is the probability that a susceptible will choose an infective partner:
Using standard arguments (Anderson and May, 1991, Bailey, 1975, Kermack and McKendrick, 1927), the basic reproduction number for this model is , which is the product of the effective contact rate and the duration of infectivity . The parameters , , , or may be affected by the pathogen virulence v, and is affected by the level of treatment effort u (and possibly v as well); we define the reproduction number in the presence of treatment effort u as . Since it arises from a linearization of the differential equations shown above, this definition of implicitly assumes an infinite (and hence non-depleting) pool of susceptibles available to be infected by the index case. Recent work has shown that using a finite contact neighborhood places an upper bound on the reproduction number, and that the standard formulation of is an overestimate compared to the value obtained when the susceptible pool is minimal (Keeling and Grenfell, 2000, Aparicio et al., 2000). This effect is strictly quantitative (i.e. it determines how much changes as parameters are varied, but not the direction of those changes), so qualitative conclusions of our study are unlikely to be affected. The impact on quantitative predictions of our analysis (e.g. values of for different special cases) will be limited in most cases, because values of are constrained to a limited range by trade-offs between parameters. An exception is the case TR in Table 1, for which limiting effects such as finite contact neighborhood will prevent the optimal virulence from approaching infinity.
In a system of multiple strains, competition dynamics determine which strain will dominate (and hence the level of optimal virulence). Using the established technique for epidemic models without coinfection (Bremermann and Thieme, 1989, Saunders, 1981, May and Anderson, 1983), we have verified for this model that the pathogen strain with the largest reproduction number is able to invade and competitively exclude all other strains (Gupta and Galvani, 1999). Furthermore, there is no coexistence equilibrium for this model except in the special case where two strains have exactly equal reproduction numbers.
Proof of Proposition
Let . Then, by Eq. (8), , and then by Eq. (3), . Since is unimodal and nonnegative, has one zero at , and if and only if . Thus, since , . A similar argument shows that . Thus, , and so .Similarly, if , , and if , .
References
- Anderson R.M., May R.M. Oxford University Press; Oxford: 1991. Infectious diseases of humans. Dynamics and Control. [Google Scholar]
- Andre J.B., Ferdy J.B., Godelle B. Within-host parasite dynamics, emerging trade-off, and evolution of virulence with immune system. Evolution. 2003;57(7):1489–1497. doi: 10.1111/j.0014-3820.2003.tb00357.x. [DOI] [PubMed] [Google Scholar]
- Aparicio J.P., Capurro A.F., Castillo-Chavez C. Transmission and dynamics of tuberculosis on generalized households. J. Theor. Biol. 2000;206(3):327–341. doi: 10.1006/jtbi.2000.2129. [DOI] [PubMed] [Google Scholar]
- Bailey N.T.J. Griffin; London: 1975. The Mathematical Theory of Infectious Diseases. [Google Scholar]
- Bank B., Guddat J., Klatte D., Kummer B., Tammer K. Birkhäuser Verlag; Basel: 1983. Nonlinear Parametric Optimization. [Google Scholar]
- Blower S.M., McLean A.R. Prophylactic vaccines, risk behavior change, and the probability of eradicating HIV in San Francisco. Science. 1994;265:1451–1454. doi: 10.1126/science.8073289. [DOI] [PubMed] [Google Scholar]
- Blower S.M., Porco T.C., Lietman T.M. Tuberculosis: the evolution of antibiotic resistance and the design of epidemic control strategies. In: Horn M.A., Simonett G., Webb G.F., editors. Mathematical Models in Medical and Health Science. Vanderbilt University Press; Nashville: 1998. pp. 51–72. [Google Scholar]
- Bonhoeffer S. Managing antibiotic resistance: what models tell us? In: Dieckmann U., Metz J.A.J., Sabelis M.W., Sigmund K., editors. vol. 2. Cambridge University Press; Cambridge: 2002. pp. 326–338. (Adaptive Dynamics of Infectious Diseases: In Pursuit of Virulence Management). [Google Scholar]
- Boots M., Hudson P.J., Sasaki A. Large shifts in pathogen virulence relate to host population structure. Science. 2004;303(5659):842–844. doi: 10.1126/science.1088542. [DOI] [PubMed] [Google Scholar]
- Bremermann H.J., Pickering J. A game-theoretical model of parasite virulence. J. Theor. Biol. 1983;100:411–426. doi: 10.1016/0022-5193(83)90438-1. [DOI] [PubMed] [Google Scholar]
- Bremermann H.J., Thieme H.R. A competitive exclusion principle for pathogen virulence. J. Math. Biol. 1989;27:179–190. doi: 10.1007/BF00276102. [DOI] [PubMed] [Google Scholar]
- Castillo-Chavez C., Velasco-Hernandez J.X. On the relationship between evolution of virulence and host demography. J. Theor. Biol. 1998;192:437–444. doi: 10.1006/jtbi.1998.0661. [DOI] [PubMed] [Google Scholar]
- Chapin C.V. Changes in type of contagious disease with special reference to smallpox and scarlet fever. J. Prevent. Med. 1926;1:1–29. [Google Scholar]
- Comstock G.W., Cauthen G.M. Epidemiology of tuberculosis. In: Reichman L.J., Hershfield E.S., editors. Tuberculosis: A Comprehensive International Approach. Marcel Dekker; New York: 1993. pp. 23–47. [Google Scholar]
- Coombs R.W., Welles S.L., Hooper C., Reichelderfer P.S., D’Aquila R.T., Japour A.J., Johnson V.A., Kuritzkes D.R., Richman D.D., Kwok S., Todd J., Jackson J.B., DeGruttola V., Crumpacker C.S., Kahn J. Association of plasma human immunodeficiency virus type I RNA level with risk of clinical progression in patients with advanced infection. J. Infect. Diseases. 1996;174:704–712. doi: 10.1093/infdis/174.4.704. [DOI] [PubMed] [Google Scholar]
- Craib K.J.P., Strathdee S.A., Hogg R.S., Leung B., Montaner J.S.G., O’Shaughnessy M.V., Schechter M.T. Serum levels of human immunodeficiency virus type I (HIV-1) RNA after seroconversion: a predictor of long-term mortality in HIV infection. J. Infect. Diseases. 1997;176:798–800. doi: 10.1086/517305. [DOI] [PubMed] [Google Scholar]
- Davies C., Webster J.P., Woolhouse M.E.J. Trade-offs in the evolution of virulence in an indirectly transmitted macroparasite. Proc. R. Soc. London Ser. B. 2001;268:251–257. doi: 10.1098/rspb.2000.1367. [DOI] [PMC free article] [PubMed] [Google Scholar]
- Day T. Virulence evolution via host exploitation and toxin production in spore-producing pathogens. Ecol. Lett. 2002;5:1–6. [Google Scholar]
- Day T. Virulence evolution and the timing of disease life-history events. Trends Ecol. Evol. 2003;18(3):113–118. [Google Scholar]
- DeMaio J., Zenilman J. Gonococcal infections. In: Evans A.S., Brachman P.S., editors. Bacterial Infections of Humans. Plenum Medical Book Company; New York: 1998. pp. 285–304. [Google Scholar]
- Dieckmann U. Adaptive dynamics of pathogen-host interactions. In: Dieckmann U., Metz J.A.J., Sabelis M.W., Sigmund K., editors. vol. 2. Cambridge University Press; Cambridge: 2002. pp. 39–59. (Adaptive Dynamics of Infectious Diseases: In Pursuit of Virulence Management). [Google Scholar]
- Dieckmann, U., Metz, J.A.J., Sabelis, M.W., Sigmund, K. (Eds.), 2002. Adaptive Dynamics of Infectious Diseases: In Pursuit of Virulence Management. Vol. 2 of Cambridge Series in Adaptive Dynamics. Cambridge University Press, Cambridge.
- Diffley P., Scott J.O., Mama K., Tsen T.N. The rate of proliferation among African trypanosomes is a stable trait that is directly related to virulence. Am. J. Tropical Med. Hygiene. 1987;36(3):533–540. doi: 10.4269/ajtmh.1987.36.533. [DOI] [PubMed] [Google Scholar]
- Dunn A.J., Swiergiel A.H. The role of cytokines in infection-related behavior. Ann. N. Y. Acad. Sci. 1998;840:577–585. doi: 10.1111/j.1749-6632.1998.tb09596.x. [DOI] [PubMed] [Google Scholar]
- Ebert D., Bull J.J. Challenging the trade-off model for the evolution of virulence: is virulence management feasible? Trends Microbiol. 2003;11(1):15–20. doi: 10.1016/s0966-842x(02)00003-3. [DOI] [PubMed] [Google Scholar]
- Ebert D., Bull J.J. Response to: Eliot and Gandon and day: Revisiting virulence management. Trends Microbiol. 2003;11(5):208–209. [Google Scholar]
- Eisen R.J., Schall J.J. Life history of malaria parasite (Plasmodium mexicanum): independent traits and basis for variation. Proc. R. Soc. London Ser. B. 2000;267:793–799. doi: 10.1098/rspb.2000.1073. [DOI] [PMC free article] [PubMed] [Google Scholar]
- Elliot S.L. The virulence-transmission trade-off and virulence management. Trends Microbiol. 2003;11(5):205–206. doi: 10.1016/s0966-842x(03)00071-4. [DOI] [PubMed] [Google Scholar]
- Ewald P.W. Oxford University Press; New York: 1994. Evolution of Infectious Disease. [Google Scholar]
- Fenner F. Biological control, as exemplified by smallpox eradication and myxomatosis. Proc. R. Soc. London Ser. B. 1983;218(1212):259–285. doi: 10.1098/rspb.1983.0039. [DOI] [PubMed] [Google Scholar]
- Fenner F., Myers K. Myxoma virus and myxomatosis in retrospect: the first quarter century of a new disease. In: Kurstak E., Maramorosch K., editors. Viruses and Environment. Academic Press; New York: 1978. pp. 539–570. [Google Scholar]
- Fenner F., Ratcliffe F.N. University Press; Cambridge: 1965. Myxomatosis. [Google Scholar]
- Fiore J.R., Zhang Y.-J., Bjorndal A., di Stefano M., Angarano G., Pastore G., Fenyo E.M. Biological correlates of HIV-1 heterosexual transmission. AIDS. 1997;11:1089–1094. doi: 10.1097/00002030-199709000-00002. [DOI] [PubMed] [Google Scholar]
- Fong T.L., Di Bisceglie A.M., Biswas R., Waggoner J.G., Wilson L., Claggett J., Hoofnagle J.H. High levels of viral replication during acute hepatitis B infection predict progression to chronicity. J. Med. Virol. 1994;43:155–158. doi: 10.1002/jmv.1890430210. [DOI] [PubMed] [Google Scholar]
- Frank S.A. Models of parasite virulence. Quart. Rev. Biol. 1996;71(1):37–78. doi: 10.1086/419267. [DOI] [PubMed] [Google Scholar]
- Frank S.A. Princeton University Press; Princeton: 2002. Immunology and Evolution of Infectious Disease. [PubMed] [Google Scholar]
- Galvani A.P. Epidemiology meets evolutionary ecology. Trends Ecol. Evol. 2003;18(3):132–139. [Google Scholar]
- Gandon S., Day T. Understanding and managing pathogen evolution: a way forward. Trends Microbiol. 2003;11(5):206–207. doi: 10.1016/s0966-842x(03)00074-x. [DOI] [PubMed] [Google Scholar]
- Gandon S., Mackinnon M.J., Nee S., Read A.F. Imperfect vaccines and the evolution of pathogen virulence. Nature. 2001;414(6865):751–756. doi: 10.1038/414751a. [DOI] [PubMed] [Google Scholar]
- Gandon S., Mackinnon M., Nee S., Read A. Imperfect vaccination: some epidemiological and evolutionary consequences. Proc. R. Soc. London Ser. B. 2003;270(1520):1129–1136. doi: 10.1098/rspb.2003.2370. [DOI] [PMC free article] [PubMed] [Google Scholar]
- Ganusov V.V., Antia R. Trade-offs and the evolution of virulence of microparasites: do details matter? Theor. Popul. Biol. 2003;64(2):211–220. doi: 10.1016/s0040-5809(03)00063-7. [DOI] [PubMed] [Google Scholar]
- Gupta S., Galvani A.P. The effects of host heterogeneity on pathogen population structure. Philos. Trans. Roy. Soc. 1999;354:711–719. doi: 10.1098/rstb.1999.0424. [DOI] [PMC free article] [PubMed] [Google Scholar]
- Hooper L.V., Gordon J.I. Commensal host-bacterial relationships in the gut. Science. 2001;292(5519):1115–1118. doi: 10.1126/science.1058709. [DOI] [PubMed] [Google Scholar]
- Hopewell P.C., Bloom B.R. Tuberculosis and other mycobacterial diseases. In: Murray J.F., Nadel J.A., editors. Textbook of Respiratory Medicine. Saunders; Philadelphia: 1994. pp. 1094–1160. [Google Scholar]
- Jacquez J.A., Koopman J.S., Simon C.P., Longini I.M.J. Role of the primary infection in epidemics of HIV infection in gay cohorts. J. Acquired Immune Deficiency Syndromes. 1994;7(11):1169–1184. [PubMed] [Google Scholar]
- Kaitala V., Heino M., Getz W.M. Host–parasite dynamics and the evolution of host immunity and parasite fecundity strategies. Bull. Math. Biol. 1997;59(3):427–450. doi: 10.1007/BF02459459. [DOI] [PubMed] [Google Scholar]
- Katzenstein, D.A., Holodniy, M., 1995/1996. HIV viral load quantification, HIV resistance, and antiretroviral therapy. AIDS Clin. Rev. 277–303. [PubMed]
- Katzenstein D.A., Hammer S.M., Hughes M.D., Gundacker H., Jackson J.B., Fiscus S., Rasheed S., Elbeik T., Reichman R., Japour A., Merigan T.C., Hirsch M.S. The relation of virologic and immunologic markers to clinical outcomes after nucleoside therapy in HIV-infected adults with 200 to 500 CD4 cells per cubic millimeter. N. Engl. J. Med. 1996;335(15):1091–1098. doi: 10.1056/NEJM199610103351502. [DOI] [PubMed] [Google Scholar]
- Keeling M.J., Grenfell B.T. Individual-based perspectives on R0. J. Theoret. Biol. 2000;203(1):51–61. doi: 10.1006/jtbi.1999.1064. [DOI] [PubMed] [Google Scholar]
- Kermack W.O., McKendrick A.G. A contribution to the mathematical theory of epidemics. Proc. Roy. Soc. London A. 1927;115:700–721. [Google Scholar]
- Khouri Y.F., McIntosh K., Cavacini L.M.P., Pagano M., Tuomala R., Marasco W.A. Vertical transmission of HIV-1. Correlation with maternal viral load and plasma levels of CD4 binding site anti-GP 120 antibodies. J. Clin. Invest. 1995;95(2):732–737. doi: 10.1172/JCI117720. [DOI] [PMC free article] [PubMed] [Google Scholar]
- Kilbourne E.D. Plenum; New York: 1987. Influenza. [Google Scholar]
- Lenski R.E., May R.M. The evolution of virulence in parasites and pathogens: reconciliation between two competing hypotheses. J. Theor. Biol. 1994;169:253–265. doi: 10.1006/jtbi.1994.1146. [DOI] [PubMed] [Google Scholar]
- Levin B.R. The evolution and maintenance of virulence in microparasites. Emerging Infect. Diseases. 1996;2(2):93–102. doi: 10.3201/eid0202.960203. [DOI] [PMC free article] [PubMed] [Google Scholar]
- Levin B.R., Antia R. Why we don’t get sick: The within-host population dynamics of bacterial infections. Science. 2001;292(5519):1112–1115. doi: 10.1126/science.1058879. [DOI] [PubMed] [Google Scholar]
- Lipsitch M., Moxon E.R. Virulence and transmissibility of pathogens: what is the relationship? Trends Microbiol. 1997;5(1):31–37. doi: 10.1016/S0966-842X(97)81772-6. [DOI] [PubMed] [Google Scholar]
- Lipsitch M., Nowak M.A. The evolution of virulence in sexually transmitted HIV/AIDS. J. Theor. Biol. 1995;174:427–440. doi: 10.1006/jtbi.1995.0109. [DOI] [PubMed] [Google Scholar]
- Lloyd-Smith J.O., Galvani A.P., Getz W.M. Curtailing transmission of severe acute respiratory syndrome within a community and its hospital. Proc. R. Soc. London Ser. B. 2003;270(1528):1979–1989. doi: 10.1098/rspb.2003.2481. [DOI] [PMC free article] [PubMed] [Google Scholar]
- Lloyd-Smith J.O., Getz W.M., Westerhoff H.V. Frequency-dependent incidence in models of sexually transmitted diseases: portrayal of pair-based transmission and effects of illness on contact behaviour. Proc. R. Soc. London Ser. B. 2004;271(1539):625–634. doi: 10.1098/rspb.2003.2632. [DOI] [PMC free article] [PubMed] [Google Scholar]
- MacDonald G. The analysis of equilibrium in malaria. Trop. Diseases Bull. 1952;49:813–829. [PubMed] [Google Scholar]
- Mackinnon M.J., Read A.F. Genetic relationships between parasite virulence and transmission in the rodent malaria Plasmodium chabaudi. Evolution. 1999;53:689–703. doi: 10.1111/j.1558-5646.1999.tb05364.x. [DOI] [PubMed] [Google Scholar]
- May R.M., Anderson R.M. Epidemiology and genetics in the coevolution of parasites and hosts. Proc. R. Soc. London Ser. B. 1983;219:281–313. doi: 10.1098/rspb.1983.0075. [DOI] [PubMed] [Google Scholar]
- Meunier P.C., Cooper B.J., Appel M.J.G., Slauson D.O. Pathogenesis of canine parvovirus enteritis: the importance of viremia. Vet. Pathol. 1985;22:60–71. doi: 10.1177/030098588502200110. [DOI] [PubMed] [Google Scholar]
- Nowak M.A., May R.M. Superinfection and the evolution of parasite virulence. Proc. Roy. Soc. London Ser. B. 1994;255:81–89. doi: 10.1098/rspb.1994.0012. [DOI] [PubMed] [Google Scholar]
- Porco, T.C., Holbrook, K., Fernyak, S.E., Portnoy, D., Reiter, R., T.J. Aragón, 2004. Logistics of smallpox control through ring vaccination: a stochastic network model. BMC Public Health 4:34. [DOI] [PMC free article] [PubMed]
- Poulin R., Combes C. The concept of virulence: Interpretations and implications—comment. Parasitol. Today. 1999;15(12):474–475. doi: 10.1016/s0169-4758(99)01554-9. [DOI] [PubMed] [Google Scholar]
- Quinn T.C., Wawer M.J., Sewankambo N., Serwadda D., Li C., Wabwirf-Mangen F., Meehan M.O., Lutalo T., Gray R.H. Viral load and heterosexual transmission of human immunodeficiency virus type 1. N. Engl. J. Med. 2000;342:921–929. doi: 10.1056/NEJM200003303421303. [DOI] [PubMed] [Google Scholar]
- Read A.F., Taylor L.H. The ecology of genetically diverse infections. Science. 2001;292:1099–1102. doi: 10.1126/science.1059410. [DOI] [PubMed] [Google Scholar]
- Read J.M., Keeling M.J. Disease evolution on networks: the role of contact structure. Proc. R. Soc. London Ser. B. 2003;270(1516):699–708. doi: 10.1098/rspb.2002.2305. [DOI] [PMC free article] [PubMed] [Google Scholar]
- Regoes R.R., Nowak M.A., Bonhoeffer S. Evolution of virulence in a heterogeneous host population. Evolution. 2000;54(1):64–71. doi: 10.1111/j.0014-3820.2000.tb00008.x. [DOI] [PubMed] [Google Scholar]
- Riddler S.A., Mellors J.W. HIV-1 viral load and clinical outcome: review of recent studies. AIDS. 1997;11(Supplement A):S141–S148. [PubMed] [Google Scholar]
- Saunders I.W. Epidemics in competition. J. Math. Biol. 1981;11:311–318. doi: 10.1007/BF00276899. [DOI] [PubMed] [Google Scholar]
- Sigmund, K., Sabelis, M.W., Dieckmann, U., Metz, J.A.J., 2002. Introduction. In: Dieckmann, U., Metz, J.A.J., Sabelis, M.W., Sigmund, K. (Eds.), Adaptive Dynamics of Infectious Diseases: in Pursuit of Virulence Management. Cambridge University Press, Cambridge, pp. 1–6.
- Stearns S.C. Life history evolution: successes limitations and prospects. Naturwissenschaften. 2000;87:476–486. doi: 10.1007/s001140050763. [DOI] [PubMed] [Google Scholar]
- Temple L.M., Weiss A.A., Walker K.E., Barnes H.J., Christensen V.L., Miyamoto D.M., Shelton C.B., Orndorff P.E. Bordetella avium virulence measured in vivo and in vitro. Infect. Immun. 1998;66(11):5244–5251. doi: 10.1128/iai.66.11.5244-5251.1998. [DOI] [PMC free article] [PubMed] [Google Scholar]
- Thrall P.H., Burdon J.J. Evolution of virulence in a plant host-pathogen metapopulation. Science. 2003;299(5613):1735–1737. doi: 10.1126/science.1080070. [DOI] [PubMed] [Google Scholar]
- Tuckett, D. (Ed.), 1976. An Introduction to Medical Sociology. Tavistock, London.
- Twaddle A.C. G. K. Hall; Boston: 1979. Sickness behavior and the sick role. [Google Scholar]
- Upchurch D.M., Brady W.E., Reichart C.A., Hook E.W., III Behavioral contributions to acquisition of gonorrhea in patients attending an inner city sexually transmitted disease clinic. J. Infect. Diseases. 1989;161:938–941. doi: 10.1093/infdis/161.5.938. [DOI] [PubMed] [Google Scholar]
- van Baalen M. Coevolution of recovery ability and virulence. Proc. R. Soc. London Ser. B. 1998;265:317–325. doi: 10.1098/rspb.1998.0298. [DOI] [PMC free article] [PubMed] [Google Scholar]
- van Baalen, M., 2002. Dilemmas in virulence management. In: Dieckmann, U., Metz, J.A.J., Sabelis, M.W., Sigmund, K. (Eds.), Adaptive Dynamics of Infectious Diseases: in Pursuit of Virulence Management. Cambridge University Press, Cambridge, pp. 60–69.
- van Baalen M., Sabelis M.W. The dynamics of multiple infection and the evolution of virulence. Am. Nat. 1995;146(6):881–910. [Google Scholar]
- Van der Goot J.A., De Jong M.C.M., Koch G., Van Boven M. Comparison of the transmission characteristics of low and high pathogenicity avian influenza A virus (H5N2) Epidemiol. Infect. 2003;131(2):1003–1013. doi: 10.1017/s0950268803001067. [DOI] [PMC free article] [PubMed] [Google Scholar]
- Williams G.C., Nesse R.M. The dawn of Darwinian medicine. Quart. Rev. Biol. 1991;66(1):1–22. doi: 10.1086/417048. [DOI] [PubMed] [Google Scholar]