

Abstract
A heterodinuclear (Ru(II), Co(III)) metal polypyridyl complex [(phen)2Ru(bpibH2)Co(phen)2]5+ {phen = 1,10-phenanthroline, bpibH2 = 1,4-bis([1,10]phebanthroline-[5,6-d]imidazol-2-yl)-benzene} has been designed and synthesized. The comparative study on the interactions of the Ru(II)–Co(III) complex with calf thymus DNA (CT-DNA) and yeast tRNA has been investigated by UV–visible spectroscopy, fluorescence spectroscopy, viscosity, as well as equilibrium dialysis and circular dichroism (CD). The antitumor activities of the complex have been evaluated by MTT {3-(4,5-dimethylthiazol-2-yl)-2,5-diphenyltetrazolium bromide} method and Giemsa staining experiment. These results indicate that the structures of nucleic acids have significant effects on the binding behaviors of metal complexes. Furthermore, the complex demonstrates different antitumor activity against selected tumor cell lines in vitro, and can make the cell apoptosis.
Keywords: Nucleic acid-binding, Binding behavior, Molecular recognition, Cytotoxicity
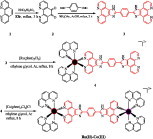
Graphical abstract
Syntheses of ligand bpibH2 and its heterodinuclear (Ru(II), Co(III)) metal polypyridyl complex [(phen)2Ru(bpibH2)Co(phen)2]5+.
1. Introduction
During the past decade, there has been tremendous interest in studies pertaining to the interaction of various transition metal complexes with nucleic acid [1], [2], [3], due to their unique physical properties and potential applications in biology [4], [5]. In particular, the potential application of these complexes in the design and development of synthetic restriction enzymes, new drugs, DNA foot printing agents, stereoselective probes of nucleic acid structure has been explored extensively [4], [6], [7], [8], [9], [10], [11], [12], [13], [14], [15]. Polypyridyl metal complexes can bind to DNA in a non-covalent interaction fashion, such as electrostatic binding for cations, groove binding for large ligands [16], intercalative binding for planar ligands and partial intercalative binding for incompletely planar ligands [17], [18]. However, this activity has primarily focused on the mononuclear complexes, the di- or polynuclear complexes have attracted limited attention. Heterodinuclear metal complexes have some advantages over other complexes as photoprobes and stereochemical probes of nucleic acids, such as increased variations in shape and size, by connecting two chiral centers into a heterodinuclear complex one could hope to amplify the chiral discrimination. More recently, non-intercalating dinuclear ruthenium(II) complexes have been synthesized as probes for DNA structure [13], [14], [15], [17], [18], [19], [20], [21], [22], [23], [24], [25], [26], [27], [28].
RNA is a versatile molecular that plays essential roles in many biological process, and consequently, it is an attractive target for potential therapeutics. The structure diversity present in RNA molecules has led to specific drug recognition sites. Therefore, a considerable amount of new information for RNA–metal complex interactions has also emerged. Metal complexes were usually used as catalyst of RNA hydrolysis cleavage [29], [30]. They were also used as shape-selective probes of RNA tertiary structure [31], agents of RNA oxidation cleavage [32] and recognition of mismatches in RNA [33]. However, investigations of the binding mode and the enantioselectivity for the interaction between metal complexes and RNA have been relatively few. The future development of RNA-targeting drugs will rely on a deeper understanding of these binding processes.
Compared calf thymus DNA (CT-DNA) with yeast tRNA, it is well known that they are different not only in composition of bases, but also in structure. CT-DNA is B form configuration, while yeast tRNA has an A-form configuration with an L-shaped tertiary structure. Although some experimental investigations on RNA–metal complex interactions have been carried out during the past decade as described above, there are still some questions need to be answered for a better understanding of the mechanism and the biological implications of the interactions, for example, how the structures of nucleic acids affect the binding behaviors of metal complexes with them. Thus, a comparative study of the interactions of metal complexes with yeast tRNA and CT-DNA in binding mode, binding strength and enantioselectivity will be very important in understanding the mechanism on the interactions and the biological impact of metal complexes.
Herein, we have synthesized a heteronuclear compound containing both ruthenium(II) and cobalt(III), (Ru,Co) {[(phen)2Ru(bpibH2)Co(phen)2]5+, phen = 1,10-phenanthroline,bpibH2 = 1,4-bis([1], [10]phebanthroline-[5,6-d]-imidazol-2-yl)benzene} has been designed and synthesized (Scheme 1 ). Cobalt was chosen as the second metal ion for some reasons. First, cobalt(III) complexes have not received as much attention as Ru(II) systems but possess the same interesting characteristics of metallointercalation and DNA cleaving properties [12]. Secondly, cobalt being a bio-essential transition-metal ion, its complexes showing the DNA binding and cleavage activity could find better application at the cellular level in comparison to the 4d- or 5d-metal analogues.
Scheme 1.
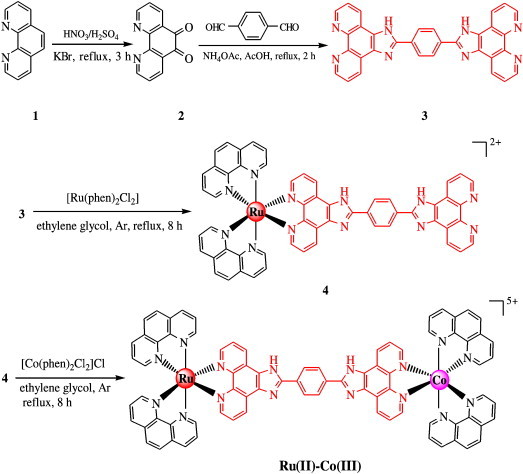
Synthesis of the Ru(II)–Co(III) complex.
In this article, the comparative study on the interaction of the title complex with calf thymus DNA (CT-DNA) and yeast tRNA have been investigated by UV–visible (UV–vis) spectroscopy, fluorescence spectroscopy, viscosity, as well as equilibrium dialysis and circular dichroism (CD). Also, the antitumor activities of the complex have been evaluated by MTT method (MTT = (3-(4,5-dimethylthiazol-2-yl)-2,5-diphenyl-tetrazolium bromide) and Giemsa staining experiment. We hope the results to be of value in understanding the mechanism of the interactions of metal complexes with nucleic acids, and should be useful in the development of nucleic acid molecular probes and new therapeutic regents for some diseases related to viruses such as AIDS (AIDS = acquired immune deficiency syndrome) and SARS (SARS = severe acute respiratory syndrome).
2. Materials and chemicals
2.1. Materials
All reagents and solvents were purchased commercially and used without further purification unless otherwise noted. Doubly distilled water was used to prepare buffers. CT-DNA and the yeast tRNA were obtained from the Sino-American Biotechnology Company. Other materials were commercially available and of reagent grade. Solutions of yeast tRNA and CT-DNA gave ratios of UV absorbance at 260 and 280 nm of over 2.0 and 1.8–1.9 respectively, indicating that both nucleic acids were fully free of protein [34]. The concentrations of yeast tRNA and CT-DNA solutions were determined at 260 nm by absorption spectroscopy using molar absorption coefficients of 7700 M− 1 cm− 1 for yeast tRNA [35] and 6600 M− 1 cm− 1 for CT-DNA [36]. The following buffers were used for the preparation of reagent solutions. 5 mM Tris–HCl buffer (pH 7.2) containing 50 mM NaCl was used for all spectroscopic studies and viscosity measurements of DNA binding of the complex. To avoid the degeneration of RNA induced by metal ions, 5 mM Tris–HCl buffer (pH 7.2) containing 50 mM NaCl and 0.1 mM EDTA (pH 7.2) was used for RNA binding experiments. 1,10-Phenanthroline-5,6-dione [37], cis-[Ru(phen)2Cl2]·2H2O [38], cis-[Co(phen)2Cl2]Cl·3H2O [39] and 1,4-bis(1,10-phenanthroline-[5,6-d]imidazol-2-yl)- benzene (bpibH2) [40] were prepared according to the literature procedures.
2.2. Physical measurements
Microanalyses (C, H and N) were carried out on a Perkin–Elmer 240Q elemental analyzer. 1H NMR spectra were recorded on an Avance-400 spectrometer with d6-DMSO as solvent at room temperature and TMS (tetramethylsilane) as the internal standard. UV–vis spectra were recorded on a Perkin-Elmer Lambda-25 spectrophotometer and emission spectra were recorded on a Perkin-Elmer LS-55 luminescence spectrometer at room temperature. Electrospray mass spectrometry (ES-MS) data were recorded on a LQC system (Finngan MAT, USA) using CH3CN as the mobile phase. Circular dichroism (CD) spectra were measured on a JASCO-J810 spectropolarimeter.
2.3. Synthesis of [(phen)2Ru(bpibH2)Co(phen)2](ClO4)5·2H2O {Ru(II)–Co(III)}
A mixture of cis-[Ru(phen)2Cl2]·2H2O (0.14 g, 0.25 mmol), bpibH2 (0.13 g, 0.25 mmol) and ethylene glycol (15 mL) was thoroughly deoxygenated. The deep brown mixture was heated for 8 h at 150 °C under argon, when the reaction was cool, cis-[Co(phen)2Cl2]Cl·3H2O was added into the solution, the mixture went on heating for 8 h at 150 °C under argon. When the solution finally turned deep red, it was cooled to room temperature and equal volume of saturated aqueous sodium perchlorate solution was added under vigorous stirring. The red-brownish solid was collected and washed with small amounts of water, ethanol and diethyl ether, then dried under vacuum, and purified on a neutral alumina column with acetonitrile–toluene (v/v, 3:1) as eluant. Yield: 0.25 g, 51%. Elemental analysis (%) Calcd for C80H54N16Cl5O22RuCo (1926.04): C 49.84, H 2.83, N 11.63%; found: C 49.79, H 2.96, N 11.52. λ max/nm (ε/M−1 cm−1, MeCN) 459 (45000), 389 (64390), 315 (42500), 288 (75800), 263 (168290). 1H NMR (400 MHz, ppm; d6-DMSO; d, doublet; s, singlet; m, multiplet.): δ 9.04 (d, J = 7.2, 4H), 8.75 (d, J = 7.6, 8H), 8.52 (s, 4H), 8.31 (s, 8H), 8.11 (d, J = 5.6, 4H), 8.09 (d, J = 4.8, 4H), 7.86 (s, 4H), 7.74–7.89 (m, 12H). ESI-MS (m/z, positive mode, MeCN, found (calcd)): 279.9 (278.5) ([M-5ClO4]5+), 349.0 (347.9) ([M-5ClO4-H+]4+), 464.7 (463.5) ([M-5ClO4-2H+]3+), 797.4 (795.8) ([M-3ClO4]2+), 846.6 (845.0) ([M-2ClO4-H+]2+).
2.4. Nucleic acid-binding experiments
Viscosity experiments were carried out using an Ubbelodhe viscometer maintained at a constant temperature at 28.0 ± 0.1 °C in a thermostatic water-bath. CT-DNA samples approximately 200 base pairs in average length were prepared by sonicating in order to minimize complexities arising from DNA flexibility [33]. Flow time was measured with a digital stopwatch and each sample was measured three times, then an average flow time was calculated. Data were presented as (η/η 0)1/3 versus binding ratio [41], where η is the viscosity of CT-DNA in the presence of complex, and η 0 is the viscosity of CT-DNA alone.
Equilibrium dialyses were conducted at ambient temperature with 10 mL DNA or RNA (1.0 mM) sealed in a dialysis bag and 10 mL of the complex (20 μM) outside the bag and the system agitated on a shaker bath. After 32 h the CD (CD = circular dichroism) spectrum of the dialysate outside the bag was measured on a on a JASCO-J810 spectropolarimeter.
2.5. Cytotoxicity assay and Giemsa staining
The MTT (3-{4,5-dimethylthiazol-2-yl}-2,5-diphenyltetrazolium bromide) cellular viability assay was used to determine the toxicity profile of the compounds [42]. Human hepatoma HepG2 cells and human leukemia HL-60 cells (at a density of 2 × 10⁷ cells/L) were treated with tested compounds separately. After 48 h of incubation, MTT (20 μL/well, 5 mg mL−1) was added and incubated for a further 4 h. DMSO was then added to stop the reaction and dissolved the formazan crystals. The absorbance was taken at 490 nm and the percentage cellular viability calculated with appropriated vehicle controls taken in account. The means ± S.D. value of IC50 values are from three independent experiments.
To detect apoptosis using the Giemsa staining, HepG2 cells treated with tested compounds for 48 h were stained with Giemsa stain and observed by microscopy for signs of apoptosis including nuclear condensation, cell shrinkage, and formation of apoptotic bodies.
3. Results and discussion
The synthetic routes to the bridging ligand bpibH2 and the Ru(II)–Co(III) complex is presented in Scheme 1. The ligand bpibH2 was prepared through condensation of 1,10-phenanthroline-5,6-dione (2) with benzene-1,4-dicarbaldehyde according to literature methods [40]. By the action of an ethylene glycol solution of bridging ligand bpibH2 (3) and the precursor complex cis-[Ru(phen)2Cl2] was converted into 4 under Ar atmosphere, then, by the action of an ethylene glycol solution of 4 and the precursor complex cis-[Co(phen)2Cl2]Cl was converted into the title complex under Ar atmosphere (51% yield). The desired Ru(II)–Co(III) complex was isolated as its perchlorates and purified by column chromatography. The title complex was characterized by elemental analyses, mass spectra and NMR spectra. The heterodinuclear Ru(II)–Co(III) complex displayed resolvable 1H NMR spectra in d6-DMSO, all proton resonance signals are assigned through 1H–1H COSY (COSY = correlated spectroscopy) experiments and the 1H NMR spectra of the heterodinuclear complexes. The well-defined 1H NMR spectra of the heterodinuclear Ru(II)–Co(III) complex is given in Fig. 1 , which permit unambiguous identification and assessment of purity. Due to the shielding influences of the adjacent the bridging ligand bpibH2 and phen, the phen protons of complexes exhibit two distinct sets of signals. In addition, the proton resonance on the nitrogen atom of the bridging ligand bpibH2 imidazole ring was not observed, because the proton is active and exchanges quickly between the two nitrogens of the imidazole ring. A similar example has been reported previously [43], [44]. The absorption spectrum of the heterodinuclear complex was recorded in acetonitrile solvent at room temperature (Fig. 2 ), which showed well resolved bands in the 200–600 nm range. The lowest energy absorption bands at 459 nm for heterodinuclear complex are assigned to the metal–ligand charge transfer (MLCT) transition. The high energy absorption bands are attributed to the intragand π → π* transition by comparison with the spectra of the bridging ligand [45].
Fig. 1.

1H NMR spectra of the Ru(II)–Co(III) complex in d6-DMSO.
Fig. 2.

Absorption spectra of the Ru(II)–Co(III) complex in CH3CN.
The application of electronic absorption spectroscopy in DNA/RNA-binding studies is one of the most useful techniques [46]. Complex binding with DNA/RNA through intercalation usually results in hypochromism and bathochromism, due to the intercalative mode involving a strong stacking interaction between an aromatic chromophore and the base pairs of DNA/RNA. The extent of the hypochromism commonly parallels the intercalative binding strength.
Fig. 3 . shows the UV and visible spectra of the Ru(II)–Co(III) complex titrated with CT-DNA and yeast tRNA. As can be seen from Fig. 3, with the increase of the concentration of CT-DNA or yeast tRNA, the UV–vis spectra of the Ru(II)–Co(III) complex showed clearly hypochromism and red shift in absorbance bands. For CT-DNA binding of the Ru(II)–Co(III) complex, the hypochromism reaches as high as 57.3%, 35.2% and 24.9%, and red shifts of 3 nm, 10 nm and 9 nm at a ratio of [DNA]/[Ru–Co] of 2.9 at 263 nm, 377 nm and 459 nm respectively. For yeast tRNA binding of the complex, upon increasing yeast tRNA concentration, the hypochromism reached as high as 54.4% , 29.1% and 23.1% at 263 nm, 377 nm and 459 nm, respectively, with 4-nm, 8-nm and 10-nm red shifts at a molar ratio of [RNA]/[Ru–Co] of 1.9 at 263 nm, 377 nm and 459 nm respectively. Obviously, these spectral characteristics suggested that the Ru(II)–Co(III) complex could strongly interact with CT-DNA and yeast tRNA, and the hypochromism of the Ru(II)–Co(III) complex binding with CT-DNA is higher than that of the Ru(II)–Co(III) complex binding with yeast tRNA. Compared the hypochromism of the UV–visible spectra for both CT-DNA and yeast tRNA binding of the Ru(II)–Co(III) complex with that of CT-DNA binding of its parent complex [Ru(phen)3]2+ (hypochromism in MLCT (MLCT = metal-to-ligand charge transfer) band at 445 nm is 12% and the red shift is 2 nm) [47], which interacts with CT-DNA through a semiintercalation or quasi-intercalation [48], and considering that the UV–vis spectrum of [Ru(bpy)3]2+ (bpy = 2,2′-bipyridine), a typical electrostatic binding complex, has been demonstrated to be unchanged upon the addition of CT-DNA [49], these spectral characteristics obviously suggest that both CT-DNA and yeast tRNA binding of the Ru(II)–Co(III) complex used in this paper are most likely through a mode that involved a stacking interaction between the aromatic chromophore bpibH2 and the base pairs of CT-DNA and yeast tRNA.
Fig. 3.

UV-vis spectra of the Ru(II)–Co(III) complex upon the addition of CT-DNA (a) and yeast tRNA (b) in buffer. [Ru–Co] = 1.0 × 10− 5 M, [DNA] = (0–2.9) × 10− 5 M, [RNA] = (0–1.9) × 10− 5 M. Arrow shows the absorbance changing upon increasing DNA or RNA concentrations. Inset: plots of (εa − εf)/(εb − εf) (in (mol L−1)2 cm) versus [Nucleic acid] (in mol L−1) for the titration of DNA or RNA with the Ru(II)–Co(III) complex for the determination of the binding constant Kb at 263 nm.
In order to further elucidate quantitatively the affinity of the Ru(II)–Co(III) complex binding to CT-DNA and yeast tRNA, the intrinsic binding constants K b were obtained by monitoring the changes in absorbance at the three bands (263 nm, 377 nm and 459 nm respectively) with increasing concentration of CT-DNA or yeast tRNA using the following equation [50]:
| (1a) |
| (1b) |
where [Nucleic acid] is the concentration of CT-DNA or yeast tRNA in base pairs, the apparent absorption coefficients ε a, ε f, and ε b correspond to A obsd/[Ru], the absorbance for the free Ru(II)–Co(III) complex, and the absorbance for the Ru(II)–Co(III) complex in the fully bound form, respectively. K b is the equilibrium binding constant in M−1, C t is the total metal complex concentration, and s is the binding size. The K b values of the Ru(II)–Co(III) complex binding with CT-DNA and yeast tRNA are listed in Table 1 . From Table 1, we can see that although Ru(II)–Co(III) complex yielded hypochromism in the all bands induced by CT-DNA are bigger than that induced by yeast tRNA. Based on that the extent of the hypochromism commonly parallels the intercalative binding strength, the DNA-binding affinity of complex should be greater than that of yeast tRNA affinity, however, the K b values of the Ru(II)–Co(III) complex binding with CT-DNA are smaller than that of the Ru(II)–Co(III) complex binding with yeast tRNA. Some similar examples of complexes binding with DNA have been reported previously [51], [52], [53], [54]. Synthetically considering these reported results, we can further understand that the extent of the hypochromism commonly (but not absolutely) parallels the intercalative binding strength. Therefore, the K b values of the Ru(II)–Co(III) complex binding with CT-DNA and yeast tRNA presented in this article are not conflict with hypochromism. The values are comparable to that of those so-called DNA-intercalative Ru(II) complexes [Ru(bpy)2(dppz)]2+ (dppz = dipyrido-[3,2-a:2′,3′-c]phenazine, > 106 M−1) [55], [Ru(bpy)2(dppx)]2+ (dppx = 7,8-dimethyldipyridophenazine, 8.8 × 10⁶ M− 1) [56], and the known DNA intercalator EB (EB = ethidium bromide, 1.4 × 10⁶ M−1) [57]. However, compared the DNA binding affinities of the Ru(II)–Co(III)complex with those of [L2Ru{DPPZ(11-11′)DPPZ}RuL2]4+ {where L = 1,10-phenanthroline or 2,2′-bipyridyl, DPPZ(11-11′)DPPZ = 11,11′-bi(dipyrido-[3,2-a:2′,3′-c]-phenazinyl, K ≈ l012 M− 1) [25] reported by Lincoln and Nordén, the vast differences in the DNA binding affinities are observed. By the replacement of one Ru(II) for a Co(III) and one bridge DPPZ(11-11′)DPPZ for a bridge bpibH2 in the complex [(phen)2Ru{DPPZ(11-11′)DPPZ}Ru(phen)2]4+, the coordination number and the configuration of the new complex [(phen)2Ru(bpibH2)Co(phen)2]5+ still remain unchanged, which are the same as those of the complex [(phen)2Ru{DPPZ(11-11′)DPPZ}Ru(phen)2]4+, however, which does result in the vast differences in the DNA binding affinities. This data indicates that replacement of one Ru(II) for a Co(III) and one bridge DPPZ(11-11′)DPPZ for a bridge bpibH2 in the complex [(phen)2Ru{DPPZ(11-11′)DPPZ}Ru(phen)2]4+ has a significant effect on the strength of DNA binding, and the most suitable metal ion and bridge ligand leads to the highest affinity of complexes with DNA. But, these are only preliminary and only qualitative results, further studies are underway in detail.
Table 1.
Absorption spectra and DNA-binding constants Kb of the Ru(II)–Co(III) complex.
| Nucleic acid | λmax, free (nm) | λmax, bound (nm) | Δλ (nm) | H (%) | Kb (M−1) | s |
|---|---|---|---|---|---|---|
| CT-DNA | 459 | 467 | 9 | 24.9 | 1.01 × 10⁶ | 0.60 |
| 377 | 387 | 10 | 35.2 | 1.65 × 10⁶ | 0.71 | |
| 263 | 266 | 3 | 57.3 | 3.60 × 10⁶ | 0.86 | |
| Yeast tRNA | 459 | 468 | 10 | 23.1 | 2.85 × 10⁶ | 0.23 |
| 377 | 385 | 8 | 29.1 | 2.44 × 10⁶ | 0.65 | |
| 263 | 267 | 4 | 54.4 | 1.80 × 10⁷ | 0.87 |
Furthermore, comparing the binding constants obtained with those of typical DNA-intercalative Ru(II) complexes (1.1 × 10⁴–4.8 × 10⁴ M− 1) [58] and the parent complexes [Ru(bpy)3]2+ (4.7 × 10³ M−1) and [Ru(phen)3]2+ (5.5 × 10³ M− 1) [59], we can deduce that both binding modes of the Ru(II)–Co(III) complex to CT-DNA and yeast tRNA are most likely intercalation, that is, the bpiH2 ligand of the complex intercalates into the double-helical regions of yeast tRNA as it interacts with CT-DNA [25]. Also, the characteristics of UV and visible spectra, as well as the binding constants obtained demonstrate that yeast tRNA binding of the complex is stronger than CT-DNA binding. A possible explanation for this observation may be due to the A-form configuration and the L-shaped tertiary structure of yeast tRNA, in which the major groove, is wide and shallow, thus its base pairs are well exposed and can be attacked by complexes easily. In addition, the Ru(II)–Co(III) complex may bind to the bugle region of yeast tRNA, and that may be another reason why RNA binding affinity of the complex is greater.
Luminescene spectroscopy is one of the most common and at the same time most sensitive ways to analyze drug-nucleic acid interactions. Support for the above intercalative binding mode also comes from the emission measurement of complex. Upon excitation using a wavelength of 459 nm, the Ru(II)–Co(III) complex is luminescent in Tris buffer at room temperature, with the fluorescence maximum at 604 nm. As shown in the steady-state luminescene spectra of 1 μM solution of the Ru(II)–Co(III) complex in the presence of CT-DNA or yeast tRNA (Fig. 4 ). Upon addition of CT-DNA (Fig. 4a), the fluorescence-emission intensity increases by a factor of ca. 1.74 and saturates at a [DNA]/[Ru–Co] ratio of 2.4. This indicates that the Ru(II)–Co(III) complex strongly interacts with DNA, which efficiently ‘protects’ it, since the hydrophobic environment inside the DNA helix reduces the accessibility of solvent H2O to the complex, and because complex mobility is restricted at the binding site this results in a decrease of the vibrational modes of relaxation and thus higher emission intensity. In contrast, for yeast tRNA binding of the Ru(II)–Co(III) complex, the fluorescence intensity of the complex decreased gradually upon the addition of yeast tRNA (Fig. 4b),which suggested that yeast tRNA can partially quench the fluorescence of Ru(II)–Co(III) complex. This quenching of fluorescence of the Ru(II)–Co(III) complex by yeast tRNA is most probably due to electron or energy transfer between the Ru(II) complex and yeast tRNA caused by a stronger interaction of the complex with yeast tRNA [60]. The hypochromism of the peak reached as high as 64.8% and saturates at a [DNA]/[Ru–Co] ratio of 3.0. Compared with that for CT-DNA, the change in emission for yeast tRNA titration was smaller. In addition, the inset of Fig. 4b shows a Stern–Volmer plot of the quenching of fluorescence of the Ru(II)–Co(III) complex by yeast tRNA, where I 0 and I are the fluorescence intensities in the absence and presence of yeast tRNA. As shown in the inset of Fig. 4b, at higher yeast tRNA concentrations, the quenching curve bended downward obviously and went up slowly, reaching a comparatively saturated situation at the molar ratio of yeast tRNA to the complex of about 3.0.
Fig. 4.

Emission spectra of the Ru(II)–Co(III) complex in Tris–HCl buffer at 298 K in the presence of CT-DNA (a) and yeast tRNA (b). [Ru–Co] = 1.0 × 10⁻⁶ M, [DNA] = (0–2.4) × 10−6 M, [RNA] = (0–3.6) × 10−5 M. Arrow shows the intensity changing upon increasing DNA or RNA concentrations. Inset: plots of relative integrated emission intensity versus [DNA]/[Ru−Co].
Steady-state emission quenching experiments using K4[Fe(CN)6] as quencher may provide further information about complexes binding to DNA or RNA, but cannot determine the mode of binding. We decided to perform some experiments at ambient temperature, using a similar method as that described by Satyanarayana et al. [61]. As illustrated in (Fig. 5 ), in the absence of CT-DNA (Fig. 5, top, dotted lines) or yeast Trna (Fig. 5, bottom, dotted lines), Ru(II)–Co(III) was efficiently quenched by [Fe(CN)6]4−, resulting in a linear Stern–Volmer plot, and the slope, namely K sv is 9.68. However, in the presence of CT-DNA (Fig. 5, top, solid lines) or yeast tRNA (Fig. 5, bottom, solid lines), it is difficult to be quenched, which may be explained by the fact that the bound cations of Ru(II)–Co(III) is protected from the anionic water-bound quencher by the array of negative charges along the DNA and RNA phosphate backbone [41]. Fig. 5 indicated that the fluorescence quenching curves were in good agreement with the linear Stern–Volmer equation. For CT-DNA and yeast tRNA, the slopes, namely K sv are 0.40 and 0.08. In the presence of CT-DNA and yeast tRNA, the final fluorescence intensity was originally 71.1% and 81.8%. The curvature reflects different degrees of protection or relative accessibility of bound cations, a large slope for the Stern–Volmer curve parallels poorer protection and low binding. The result thus further confirms that Ru(II)–Co(III) binds to yeast tRNA more strongly than to CT-DNA.
Fig. 5.
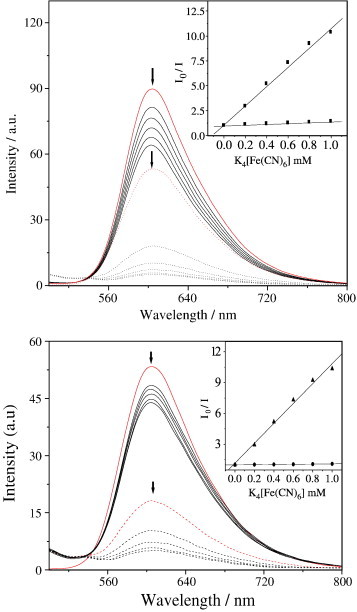
Emission quenching with [Fe(CN)6]4- for the Ru(II)–Co(III) complex in the absence (dotted lines) and the presence of CT-DNA (top, solid lines) or RNA (bottom, solid lines). [Ru–Co] = 1.0 × 10⁻⁶ M, [DNA or RNA]/[Ru–Co] = 40, [Fe(CN)6]4− = (0–1.0) mM, where I0 and I are the fluorescence intensities in the absence and the presence of the quencher, respectively. Inset: plots of I0/I versus [Fe(CN)6]4−.
To further clarify the interactions between the Ru(II)–Co(III) complex and DNA, viscosity measurements were carried out on CT-DNA by varying the concentration of the added complex. Hydrodynamic measurements that are sensitive to length change (i.e., viscosity and sedimentation) are regarded as the least ambiguous and the most critical tests of a binding model in solution in the absence of crystallographic structural data [33]. A classical intercalation model demands that the DNA helix must lengthen as base airs are separated to accommodate the binding ligand, leading to the increase of DNA viscosity. In contrast, a partial or non-classical intercalation ligand could bend (or kink) the DNA helix, reduce its effective length and, concomitantly, its viscosity [62]. The effects of the Ru(II)–Co(III) complex together with ethidium bromide (EB) and [Ru(bpy)3]2+ on the viscosity of rod-like DNA are shown in Fig. 6 . EB has been well known to binding with DNA through the intercalation mode. While for complex [Ru(bpy)3]2+, which has been known to bind with DNA in electrostatic mode, it exerts essentially no effect on DNA viscosity. On increasing the amounts of Ru(II)–Co(III) complex, the relative viscosity of DNA increases steadily, which is similar to the behavior of EB. The increased degree of viscosity, which may depend on its affinity to DNA follow the order of EB > Ru(II)–Co(III) > [Ru(bpy)3]2+. A similar sharp increase in relative viscosity has been observed on the addition [Ru(bpy)2(dppz)]2+, which was proved to be bound to DNA by intercalation. The results suggest that the Ru(II)–Co(III) complex binds to DNA through a classical intercalation model. Such a result is consistent with the foregoing hypothesis.
Fig. 6.
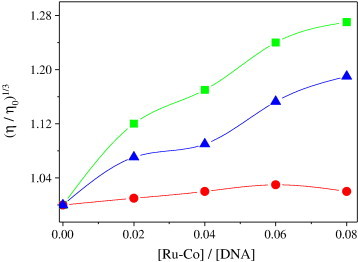
Effect of increasing amounts of ethidium bromide (■), [Ru(bpy)3]2+ (●), and the Ru(II)–Co(III) complex (▼) on the relative viscosity of calf thymus DNA at 28 (± 0.1) °C. The total concentration of DNA is 0.5 mM.
However, viscometry cannot be used to study the interaction between yeast tRNA and metal complexes, since yeast tRNA is not a linear structure. In fact, no obvious change in viscosity was observed for yeast tRNA in the presence of the Ru(II)–Co(III) complex.
Equilibrium dialysis experiments may offer the opportunity to examine the enantioselectivity of complexes binding to nucleic acid [63]. Racemic solutions of the Ru(II)–Co(III) complex dialyzed against CT-DNA or yeast tRNA for 32 h, and then subjected to CD analysis. During the course of the dialysis at intervals of time, the CD signals started from none, increased to the maximum magnitude after 32 h dialysis of the complex, then no longer changed. That is to say, the CD signals of the complex neither increased nor decreased at the end. The CD spectra in the region of 230–630 nm for complex the Ru(II)–Co(III) complex after its racemic solution had been dialyzed against CT-DNA and yeast tRNA are shown in Fig. 7 . As shown in Fig. 7, the dialysates of the Ru(II)–Co(III) complex dialyzed against CT-DNA and yeast tRNA showed two distinct sets of CD signals, with two positive peaks at about 280 nm and 420 nm, two negative peaks at about 300 nm and 470 nm, and the CD signals for the dialysate of the complex dialyzed against yeast tRNA were much stronger than those for the complex dialyzed against CT-DNA. The presence of CD signals indicates enrichment of the enantiomer binding less favorably to yeast tRNA or CT-DNA. Although the complex was not resolved into the pure enantiomers, and we cannot determine which enantiomer binds preferentially yeast tRNA or CT-DNA, it is evident that the complex interact enantioselectivly with both yeast tRNA and CT-DNA, and that the complex is a better candidate for an enantioselective binder to yeast tRNA than to CT-DNA. According to the proposed binding model by Barton and co-workers [11], the Δ enantiomer of the complex, a right-handed propeller-like structure, displays a greater affinity than the Λ enantiomer with the left-handed CT-DNA helix due to more-appropriate steric matching. Although the configuration of CT-DNA is different from that of yeast tRNA, both yeast tRNA and CT-DNA have the same right-handed helix structure. Therefore, we can deduce that the Δ enantiomer of the complex may bind more favorably to both yeast tRNA and CT-DNA than the Λ enantiomer does. In addition, the phenomenon that the CD signals for the dialysate of the complex dialyzed against yeast tRNA are much stronger than those for the complex dialyzed against CT-DNA, which implies that the Ru(II)–Co(III) complex binding with yeast tRNA shows more enantioselective than that with CT-DNA. Therefore, for yeast tRNA, the Ru(II)–Co(III) complex is a better enantioselective binder.
Fig. 7.

CD spectra of the Ru(II)–Co(III) complex after 32 h of dialysis against yeast tRNA (solid line) or CT-DNA (dotted line) in stirred aqueous solution. [Ru–Co] = 20.0 μM, [DNA] = 1.0 mM.
The Ru(II)–Co(III) complex was tested in a cell proliferation assay on two human cell lines, HL-60 and HepG2 cells. Cis-platin has been included as the control, and it shows high cytotoxicity, which are in accordance with the literature reports [64]. The IC50 values were calculated after 48 h of incubation with complexes and are listed in Table 2 . As shown in Table 2, the Ru–Co complex demonstrated different cytotoxicity against selected tumor cell lines in vitro, namely, the human HL-60 cells are more sensitive to the Ru–Co complex than HepG2 cells. Compared the Ru–Co complex with cis-platin, the former displayed lower antitumor activity against the tumor cells tested. The results indicated that the toxicity of the Ru–Co complex was found to be concentration dependent, namely, the cell viability decreased with increasing complex concentration. Although higher complex concentration reduced the percentages of cell survival, there is a significant difference in susceptibility between the Ru–Co complex and cis-platin. It's well known that, due to exist leaving group (chloride ion) in cis-platin, its cytotoxic effects through covalent binding to DNA form cis-DDP-DNA adducts, which interferes with DNA replication and transcription and ultimately induces cell death. However, no leaving group exists in the Ru(II)–Co(III) complex, therefore, the anti-tumor mechanism of the Ru(II)–Co(III) complex may not occur with the DNA cross-linking reaction. Furthermore, the anti-tumor mechanism of the Ru(II)–Co(III) complex does not seem entirely like that of some organic molecules, such as drugs adriamycin and daunorubicin, which inhibit tumor by inserting DNA. According to the results, we speculate that the antitumor activity of the Ru(II)–Co(III) complex not only may be related to inserting DNA, but also related to the specific molecular shape of Ru(II)–Co(III) complex and the chemical structure and nature of the inserted ligand.
Table 2.
IC50 (μM) of the Ru(II)–Co(III) complex and drug against different tumor cell. Each IC50 is the mean ± standard error obtained from at least three independent experiments.
| Complex | IC50 (μM) |
|
|---|---|---|
| HL-60 | HepG2 | |
| Ru(II)–Co(III) | 46.75 ± 3.68 | 54.33 ± 4.33 |
| cis-platin | 5.85 ± 0.60 | 11.18 ± 2.48 |
The purpose of the Giemsa staining was to gain information about the apoptosis of complexes on HepG2 cells. After exposuring to 20 μM tested complexes, the majority of the HepG2 cells displayed classic morphological features of apoptosis, including nuclear condensation, cell shrinkage, and formation of apoptotic bodies which shows purple and cytoplasmic concentration which shows dark red (Fig. 8a, c), while the control cells showed red (Fig. 8b. The results suggested that complex induce HepG2 cells reduction in viable cell number partially through induction of HepG2 cells apoptosis. However, which only qualitatively depicts apoptosis of the cells influenced by the Ru(II)–Co(III) complex. Further studies in detail are currently underway to quantitatively determine the complex effect on the cells apoptosis.
Fig. 8.

Cell viability of the Ru(II)–Co(III) complex on tumor (Hep-G2) cell proliferation in vitro. Light microscopy of HepG2 cell line after treated for 48 h in the absence (control) and presence of same concentrations complexes: [Ru–Co] = 20.0 mM; Cell was observed using an inverted microscope and photographed by a digital camera. cis-Platin (a); absence of complexes (b); the Ru(II)–Co(III) complex (c).
4. Conclusions
On the basis of the spectroscopic results, the binding mode of the Ru(II)–Co(III) complex to CT-DNA and yeast tRNA are intercalation, RNA binding of the complex is more stronger than DNA binding; the Δ enantiomer of the complex may bind more favorably to both CT-DNA and yeast tRNA, and the complex is a better candidate for an enantioselective binder to yeast tRNA than to CT-DNA. The results can be explained by the different structure and configuration between CT-DNA and yeast tRNA reasonably, suggesting that the configuration and structure of nucleic acids have significant effects on the binding behaviors of metal complexes. At the same time, the human HL-60 cells are more sensitive to the Ru(II)–Co(III) complex than HepG2 cells in vitro. Furthermore, the complex could make the HepG2 cell apoptosis. Information obtained from the present study can enhance our understanding of the mechanism for the binding of metal polypyridyl complexes to nucleic acids, and is helpful to the development of nucleic acid molecular probes and new therapeutic regents.
Acknowledgements
The authors are grateful to the supports of the National Natural Science Foundation of the People’s Republic of China (21071120), the Provincial Natural Science Foundation of Hunan (09JJ6019), the Science Foundation of Hunan Provincial Education Department (08B086) and the Scientific Research Foundation of Key Lab of Environment-friendly Chemistry and Application in Ministry of Education (Xiangtan University).
References
- 1.Hegg E.L., Burstyn J.N. Coord. Chem. Rev. 1998;173:133–165. [Google Scholar]
- 2.Komiyama M., Sumaoka J. Curr. Opin. Chem. Biol. 1998;2:751–757. doi: 10.1016/s1367-5931(98)80113-0. [DOI] [PubMed] [Google Scholar]
- 3.Aoki S., Kimura E. Chem. Rev. 2004;104:769–787. doi: 10.1021/cr020617u. [DOI] [PubMed] [Google Scholar]
- 4.B. Norden, P. Lincoln, B. Akerman, E. Tuite, in: A. Sigel, H. Sigel (Eds.), Marcel Dekker, New York. 33 (1996) 177−252. [PubMed]
- 5.Delaney S., Yoo J., Stemp E.D.A., Barton J.K. Proc. Natl. Acad. Sci. U. S. A. 2004;101:10511–10516. doi: 10.1073/pnas.0403791101. [DOI] [PMC free article] [PubMed] [Google Scholar]
- 6.Tan L.F., Liang X.L., Liu X.H. J. Inorg. Biochem. 2009;103:441–447. doi: 10.1016/j.jinorgbio.2008.12.010. [DOI] [PubMed] [Google Scholar]
- 7.Schatzschneider U., Niesel J., Ott I., Gust R., Alborzinia H., Wölfl S. ChemMedChem. 2008;3:1104–1109. doi: 10.1002/cmdc.200800039. [DOI] [PubMed] [Google Scholar]
- 8.Liu Y.J., Zeng C.H., Huang H.L., He L.X., Wu F.H. Eur. J. Med. Chem. 2010;45:564–571. doi: 10.1016/j.ejmech.2009.10.043. [DOI] [PubMed] [Google Scholar]
- 9.Liu Y.J., Zeng C.H., Liang Z.H., Yao J.H., Huang H.L., Li Z.Z., Wu F.H. Eur. J. Med. Chem. 2010;45:3087–3095. doi: 10.1016/j.ejmech.2010.03.042. [DOI] [PubMed] [Google Scholar]
- 10.Zou X.H., Ye B.H., Li H., Zhang Q.L., Chao H., Liu J.G., Ji L.N., Li X.Y. J. Biol. Inorg. Chem. 2001;6:143–150. doi: 10.1007/s007750000183. [DOI] [PubMed] [Google Scholar]
- 11.Barton J.K. Science. 1986;233:727–734. doi: 10.1126/science.3016894. [DOI] [PubMed] [Google Scholar]
- 12.Tan L.F., Shen J.L., Chen X.J., Liang X.L. DNA Cell Biol. 2009;28:461–468. doi: 10.1089/dna.2009.0889. [DOI] [PubMed] [Google Scholar]
- 13.Zhou C.F., Du X.S., Li H. Bioelectrochemistry. 2007;70:446–451. doi: 10.1016/j.bioelechem.2006.07.002. [DOI] [PubMed] [Google Scholar]
- 14.Peng B., Chao H., Sun B., Li H., Gao F., Ji L.N. J. Inorg. Biochem. 2007;101:404–411. doi: 10.1016/j.jinorgbio.2006.11.008. [DOI] [PubMed] [Google Scholar]
- 15.Liu X.W., Lu J.L., Chen Y.D., Li L., Zhang D.S. Inorg. Chem. Commun. 2010;13:449–451. [Google Scholar]
- 16.Foley F.M., Keene F.R., Collins J.G. Dalton Trans. 2001:2968–2974. [Google Scholar]
- 17.Van Gijte O., Kirsch-De Mesmaeker A. Dalton Trans. 1999:951–956. [Google Scholar]
- 18.Jiang C.W. J. Inorg. Biochem. 2004;98:497–501. doi: 10.1016/j.jinorgbio.2003.12.020. [DOI] [PubMed] [Google Scholar]
- 19.Milkevitch M., Storrie H., Brauns E., Brewer K.J., Shirley B.W. Inorg. Chem. 1997;36:4534–4538. doi: 10.1021/ic970054i. [DOI] [PubMed] [Google Scholar]
- 20.Zou X.H., Ye B.H., Liu J.G., Xiong Y., Ji L.N. Dalton Trans. 1999:1423–1428. [Google Scholar]
- 21.Carlson D.L., Huchital D.H., Mantilla E.J., Shirley R.D., Murphy W.R.J. J. Am. Chem. Soc. 1993;115:6424–6425. [Google Scholar]
- 22.Tan L.F., Chen X.J., Shen J.L., Liang X.L. J. Chem. Sci. 2009;121:397–405. [Google Scholar]
- 23.O'Reilly F., Kelly J.M., Kirsch-De Mesmaeker A. Chem. Commun. 1996:1013–1014. [Google Scholar]
- 24.Brodkorb A., Kirsch-De Mesmaeker A., Rutherford T.J., Keene F.R. Eur. J. Inorg. Chem. 2001;40:2151–2160. [Google Scholar]
- 25.Lincoln P., Norden B. Chem. Commun. 1996:2145–2146. [Google Scholar]
- 26.Westerlund F., Lincoln P. Biophys. Chem. 2007;129:11–17. doi: 10.1016/j.bpc.2007.04.011. [DOI] [PubMed] [Google Scholar]
- 27.Morrow J.R., Iranzo O. Curr. Opin. Chem. Biol. 2004;8:192–200. doi: 10.1016/j.cbpa.2004.02.006. [DOI] [PubMed] [Google Scholar]
- 28.Forconi M., Herschlag D. Meth. Enzymol. 2009;468:91–106. doi: 10.1016/S0076-6879(09)68005-8. [DOI] [PubMed] [Google Scholar]
- 29.Schaak J.E., Yakhnin H., Bevilacqua P.C., Babitzke P. J. Mol. Biol. 2003;332:555–574. doi: 10.1016/s0022-2836(03)00969-0. [DOI] [PubMed] [Google Scholar]
- 30.Lambert D., Leipply D., Shiman R., Draper D.E. J. Mol. Biol. 2009;390:791–804. doi: 10.1016/j.jmb.2009.04.083. [DOI] [PMC free article] [PubMed] [Google Scholar]
- 31.Carter P.J., Cheng C.C., Thorp H.H. J. Am. Chem. Soc. 1998;120:632–642. [Google Scholar]
- 32.Abramov M., Schepers G., Aerschot A.V., Hummelen P.V., Herdewijn P. Biosens. Bioelectron. 2008;23:1728–1732. doi: 10.1016/j.bios.2008.01.033. [DOI] [PubMed] [Google Scholar]
- 33.Chaires J.B., Dattagupta N., Crothers D.M. Biochemistry. 1982;21:3933–3940. doi: 10.1021/bi00260a005. [DOI] [PubMed] [Google Scholar]
- 34.Marmur J. J. Mol. Biol. 1961;3:208–211. doi: 10.1016/s0022-2836(61)80023-5. [DOI] [PubMed] [Google Scholar]
- 35.Reichmann M.F., Rice S.A., Thomas C.A., Doty P. J. Am. Chem. Soc. 1954;76:3047–3053. [Google Scholar]
- 36.Meadows K.A., Liu F., Sou J., Hudson B.P., McMillin D.R. Inorg. Chem. 1993;32:2919–2923. [Google Scholar]
- 37.Yamada M., Tanaka Y., Yoshimato Y., Kuroda S., Shimao I. Bull. Chem. Soc. Jpn. 1992;65:1006–1011. [Google Scholar]
- 38.Sullivan B.P., Salmon D.J., Meyer T.J. Inorg. Chem. 1978;17:3334–3341. [Google Scholar]
- 39.Vlcek A.A. Inorg. Chem. 1967;6:1425–1427. [Google Scholar]
- 40.Chao H., Ye B.H., Li H., Li R.H., Zhou J.Y., Ji L.N. Polyhedron. 2000;19:1975–1983. [Google Scholar]
- 41.Cohen G., Eisenberg H. Biopolymers. 1969;8:45–49. [Google Scholar]
- 42.Mosmann T. J. Immunol. Methods. 1983;65:55–63. doi: 10.1016/0022-1759(83)90303-4. [DOI] [PubMed] [Google Scholar]
- 43.Xiong Y., He X.F., Zou X.H., Wu J.Z., Chen X.M., Ji L.N., Li R.H., Zou J.Y., Yu K.B. Dalton Trans. 1999:19–23. [Google Scholar]
- 44.Zails S., Drchal V. Chem. Phys. 1987;118:313–317. [Google Scholar]
- 45.Wang R., Vos J.G., Schehl R.H., Hage R. J. Am. Chem. Soc. 1992;114:1964–1970. [Google Scholar]
- 46.Barton J.K., Dannenberg J.J., Raphael A.L. J. Am. Chem. Soc. 1984;106:2172–2176. [Google Scholar]
- 47.Xiong Y., Ji L.N. Coord. Chem. Rev. 1999;185:711–733. [Google Scholar]
- 48.Lincoln P., Norden B. J. Phys. Chem. B. 1998;102:9583–9594. [Google Scholar]
- 49.Deng H., Xu H., Yang Y., Li H., Zou H., Qu L.H., Ji L.N. J. Inorg. Biochem. 2003;97:207–214. doi: 10.1016/s0162-0134(03)00279-4. [DOI] [PubMed] [Google Scholar]
- 50.Carter M.T., Rodriguez M., Bard A. J. Am. Chem. Soc. 1989;111:8901–8911. [Google Scholar]
- 51.Pyle A.M., Rehmann J.P., Meshoyrer R., Kumar C.V., Turro N.J., Barton J.K. J. Am. Chem. Soc. 1989;1989(111):3051–3058. [Google Scholar]
- 52.Liu F.R., Wang K.Z., Bai G.Y., Zhang Y.G., Gao L.H. Inorg. Chem. 2004;43:1799–1806. doi: 10.1021/ic035109x. [DOI] [PubMed] [Google Scholar]
- 53.Xu H., Zheng K.C., Chenc Y., Li Y.Z., Lin L.J., Li H., Zhang P.X., Ji L.N. J. Chem. Soc., Dalton Trans. 2003:2260–2268. [Google Scholar]
- 54.Xu H., Liang Y., Zhang P., Du F., Zhou B.R., Wu J., Liu J.H., Liu Z.G., Ji L.N. J. Biol. Inorg. Chem. 2005;10:529–538. doi: 10.1007/s00775-005-0007-3. [DOI] [PMC free article] [PubMed] [Google Scholar]
- 55.Friedman A.E., Chambron J.C., Sauvage J.P., Turro N.J., Barton J.K. J. Am. Chem. Soc. 1990;112:4960. [Google Scholar]
- 56.Olson E.J.C., Hu D., Hormann A., Jonkman A.M., Arkin M.R., Stemp E.D.A., Barton J.K., Barbara P.F. J. Am. Chem. Soc. 1997;119:11458. [Google Scholar]
- 57.Lepecp J.B., Paoletti C. J. Mol. Biol. 1967;27:87. doi: 10.1016/0022-2836(67)90353-1. [DOI] [PubMed] [Google Scholar]
- 58.Pyle A.M., Rehmann J.P., Meshoyrer R., Kumar C.V., Turro N.J., Barton J.K. J. Am. Chem. Soc. 1989;111:3051–3058. [Google Scholar]
- 59.Morgan J.L., Buck D.P., Turley A.G., Collins J.G., Keene F.R. Inorg. Chim. Acta. 2006;359:888–898. [Google Scholar]
- 60.Watson R.T., Desai N., Wildsmith J., Wheeler J.F., Kane-Maguire N.A.P. Inorg. Chem. 1999;38:2683–2687. [Google Scholar]
- 61.Satyanarayana S., Dabroniak J.C., Chaires J.B. Biochemistry. 1993;32:2573–2584. doi: 10.1021/bi00061a015. [DOI] [PubMed] [Google Scholar]
- 62.Barton J.K., Goldberg J.M., Kumar C.V., Turro N.J. J. Am. Chem. Soc. 1986;108:2081–2088. [Google Scholar]
- 63.Liu J.G., Zhang Q.L., Shi X.F., Ji L.N. Inorg. Chem. 2001;40:5045–5050. doi: 10.1021/ic001124f. [DOI] [PubMed] [Google Scholar]
- 64.Jiang Q., Zhu J.H., Zhang Y.M., Xiao N., Guo Z.J. Biometals. 2009;22:297–305. doi: 10.1007/s10534-008-9166-3. [DOI] [PubMed] [Google Scholar]