

Graphical abstract
Phlorotannins have been isolated and are the first of their type showing competitively inhibitory activity toward SARS-CoV 3CLpro. Dieckol showed the most potent SARS-CoV 3CLpro trans/cis-cleavage inhibitory effects with high association rate.
Abbreviations: SARS, severe acute respiratory syndrome; CoV, coronavirus; IC50, the inhibitor concentration leading to 50% activity loss; Ki, inhibition constant; KD, dissociation constant; NMR, nuclear magnetic resonance; SPR, surface plasmon resonance; Luc, luciferase
Keywords: Phlorotannin, SARS-CoV, Dieckol, Eckol, Ecklonia cava
SARS-CoV 3CLpro plays an important role in viral replication. In this study, we performed a biological evaluation on nine phlorotannins isolated from the edible brown algae Ecklonia cava. The nine isolated phlorotannins (1–9), except phloroglucinol (1), possessed SARS-CoV 3CLpro inhibitory activities in a dose-dependently and competitive manner. Of these phlorotannins (1–9), two eckol groups with a diphenyl ether linked dieckol (8) showed the most potent SARS-CoV 3CLprotrans/cis-cleavage inhibitory effects (IC50s = 2.7 and 68.1 μM, respectively). This is the first report of a (8) phlorotannin chemotype significantly blocking the cleavage of SARS-CoV 3CLpro in a cell-based assay with no toxicity. Furthermore, dieckol (8) exhibited a high association rate in the SPR sensorgram and formed extremely strong hydrogen bonds to the catalytic dyad (Cys145 and His41) of the SARS-CoV 3CLpro.
1. Introduction
Brown algae have long been used traditionally as foodstuffs and folk medicines in Asian countries. Recently, a commercially available Ecklonia cava extract was approved as a new dietary ingredient (NDI) by the U.S. Food and Drug Administration (FDA) in 2008 (FDA-1995-S-0039-0176). Marine algae have been identified as rich sources of structurally diverse bioactive compounds with great pharmaceutical and biomedical potential. Eckolina cava (Laminariaceae) is an edible brown alga that grows abundantly in the subtidal regions of Jeju Island, Korea. E. cava is used to produce food ingredients, animal feed, fertilizers, and folk gynecopathic medicines.1 E. cava contains a variety of compounds, including carotenoids, fucoidan, and phlorotannins, that show different biological activities.2, 3 The phlorotannin components, which are oligomeric polyphenols with phloroglucinol units, are responsible for the pharmacological activities of E. cava.4 Ecklonia species have been used extensively as traditional medicines for the treatment of goiter, scrofula, urinary diseases, stomach ailments, hemorrhoids, boils, constipation, and postpartum women.5 Previous studies have presented a wealth of evidence showing that E. cava exhibits antioxidant,6 anticancer,7 immunomodulatory,8, 9 and tyrosinase inhibitory activity.10 E. cava also exhibits anti-virus activities against HIV-1 reverse transcriptase11 and influenza virus neuraminidase.12 However, to the best of our knowledge, there have been no reports of the phlorotannins from E. cava eliciting severe acute respiratory syndrome coronavirus (SARS-CoV) 3C-like proteinase (3CLpro) inhibitory activity.
SARS is a life-threatening form of atypical pneumonia caused by infection with a novel human coronavirus (SARS-CoV).13, 14, 15 Its 3CLpro, a chymotrypsin-like cysteine proteinase essential for viral replication, has been recognized as a key target for anti-SARS drug design. The active site of SARS-CoV 3CLpro contains a catalytic dyad composed of Cys145 and His41, where the cysteine residue (Cys145) acts as a nucleophile and the histidine residue (His41) acts as the general acid–base in the proteolytic process.16 Until now, SARS-CoV 3CLpro inhibitors have been reported from both synthetic peptidyl compound libraries and natural product-derived libraries.17 The synthetic inhibitory compounds include C 2-symmetric diols,18 quinolinecarboxylic acids,19 and anilides.20 The natural-derived inhibitors include betulinic acid,21 indigo,22 aloeemodin,22 quinone-methide triterpenoids23 and biflavonoids amentoflavones.24
The aim of this present study was to investigate a SARS-CoV 3CLpro inhibitor isolated from E. cava. We characterized the anti-SARS-CoV 3CLpro effect of isolated phlorotannins from E. cava using cell-free cleavage and cell-based cleavage assays. To examine the trans-cleavage of SARS-CoV 3CLpro in the cell-free assay, the proteolytic activity of 3CLpro was tested against a fluorogenic substrate (Dabcyl-KTSAVLQSGFRKME-Edans) and analyzed with a fluorescence resonance energy transfer (FRET) assay. The cis-cleavage of SARS-CoV 3CLpro was determined with a cell-based assay; the in-frame construction of 3CLpro, the substrate (SAVLQSGFRK), and luciferase (Luc) was transfected into the Vero cells, and the cis-cleavage activities of SARS-CoV 3CLpro were determined using a luciferase assay. We also assessed the effect of the inhibitor on the SARS-CoV 3CLpro interaction using a surface plasmon resonance (SPR) analysis and a binding model.
2. Results and discussion
2.1. Preparation of SARS-CoV 3CLpro and effect of isolated phlorotannins on SARS-CoV 3CLprotrans-cleavage assay
Because of the numerous functions and requisite roles of cysteine proteases in viral replication and pathogenesis, they may serve as attractive targets for antiviral drugs. The severe acute respiratory syndrome (SARS) coronavirus (CoV) depends on a chymotrpsin-like cysteine protease (3CLpro) to process the translated polyproteins into functional viral proteins. This enzyme is a target for potential anti-SARS drugs. Ultimately, our goal is to develop a naturally derived SARS-CoV 3CLpro inhibitor for use as anti-SARS drug. Our first step toward this goal was to expressed and purified SARS-CoV 3CLpro from E. coli BL21 (DE3) CodonPlus-RIL cells as described in Section 2. The purified protease ran at approximately 33 kDa on sodium dodecyl sulface–polyacrylamide gel electrophoresis (SDS–PAGE) with greater than 90% purity. The purified 3CLpro from Escherichia coli cells had a specific activity of 32.0 ± 5.2 μM towards the Dabcyl-KTSAVLQSGFRKME-Edans substrate.
A bioassay-guided investigation of the ethanol extract of Ecklonia cava resulted in the isolation of nine phlorotannins:phloroglucinol (1), triphloretol A (2), eckol (3), dioxinodehydroeckol (4), 2-phloroeckol (5), 7-phloroeckol (6), fucodiphloroethol G (7), dieckol (8), and phlorofucofuroeckol A (9) (Fig. 1 ). First, we examined the effect of nine phlorotannins 1–9 on the cell-free SARS-CoV 3CLpro trans-cleavage assay. The percent inhibition at 200 μM concentrations of compounds 1–9 was initially determined, and the results are reported in Table 1 . As shown in Table 1 and Figure 2 A, all of the phlorotannins investigated, except phloroglucinol (1), exhibited a dose-dependent inhibitory effect on 3CLpro hydrolysis with IC50 values ranging from 2.7 to 164.7 μM against cell-free 3CLpro trans-cleavage. As the concentrations of the inhibitors were increased, the residual SARS-CoV 3CLpro activity decreased dramatically. All inhibitors exhibited a similar relationship between enzyme activity and enzyme concentration. As an example, the relevant data for dieckol (8) is illustrated in Figure 2B. Plots of the residual enzyme activity versus enzyme concentration at various concentrations of dieckol (8) yielded a series of straight lines with an axis intercept of 0, indicating that all inhibitors are reversible. Augmenting the concentration of dieckol (8) reduced the slopes of the lines. Of the isolated phlorotannins, eckol (3, IC50 = 8.8 μM) and dieckol (8, IC50 = 2.7 μM) displayed remarkable inhibitory activity against SARS-CoV 3CLpro cell-free cleavage.
Figure 1.
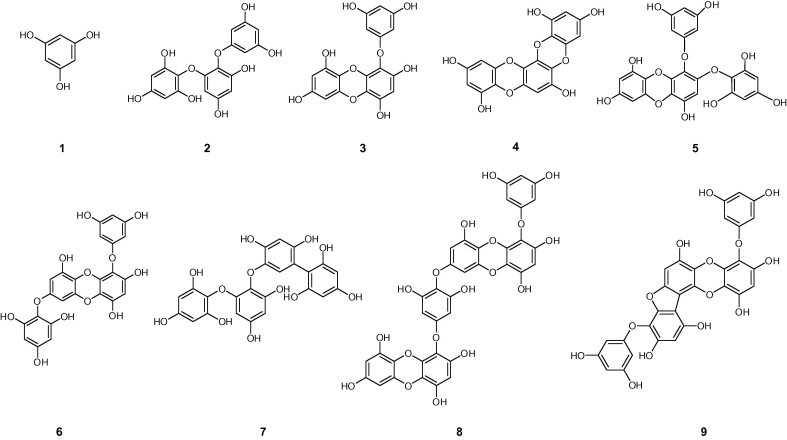
Chemical structures of isolated phlorotanins from Ecklonia cava.
Table 1.
Inhibitory effects of isolated phlorotannins (1–9) on the cell-free cleavage activity of SARS-CoV 3CLpro
| Compounds | Cell-free trans-cleavage |
|
|---|---|---|
| IC50a (μM) | Inhibition type (Ki, μM) | |
| 1 | >200 | NTb |
| 2 | 164.7 ± 10.8 | NT |
| 3 | 8.8 ± 3.5 | Competitive (8.2 ± 0.9) |
| 4 | 158.3 ± 8.2 | NT |
| 5 | 13.3 ± 0.8 | Competitive (24.0 ± 1.5) |
| 6 | 42.1 ± 2.2 | Competitive (19.3 ± 1.4) |
| 7 | 22.5 ± 4.6 | Competitive (63.5 ± 7.1) |
| 8 | 2.7 ± 0.6 | Competitive (2.4 ± 0.2) |
| 9 | 16.7 ± 3.3 | Competitive (10.6 ± 1.0) |
All compounds were examined in a set of triplicates experiment; IC50 (50% inhibitory concentration) values of compounds represent the concentration that caused 50% enzyme activity loss.
Not tested.
Figure 2.
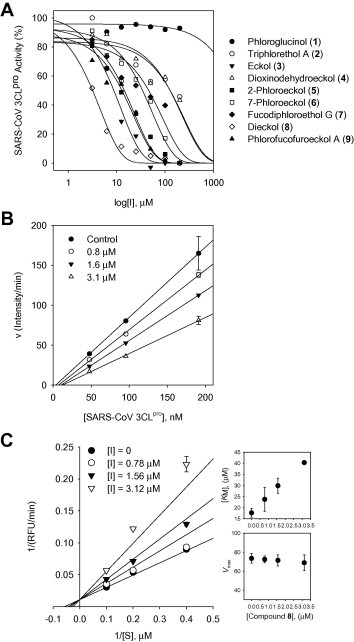
(A) Effects of compounds 1–9 on the activity of SARS-CoV 3CLpro for proteolysis of substrate. (B) The catalytic activity of SARS-CoV 3CLpro as function of enzyme concentration at different concentrations of compound 8. (C) Lineweaver–Burk plots for inhibition of dieckol (8) on SARS-CoV 3CLpro for the proteolysis of substrate. The values of KM and Vmax on the concentrations of compound 8 (inset).
2.2. Biological evaluation, structure–activity relationship, and discussion of isolated phlorotannins
The inhibition activity was slightly affected by subtle changes in structure. Initially, we compared a closed-chain trimer of phloroglucinol (3, eckol) with an opened-chain trimer of phloroglucinol (2, triphloretol A), and we found that the activity of eckol (IC50 = 8.8 μM) was 20-fold higher than that of the trimer itself (IC50 = 164.7 μM). Replacement of the 3,5-dihydrophenoxy group by a dioxinodehydro group (4, IC50 = 158.3 μM) led to weaker inhibition compared to 3; however it was still more active than 2. Similar to this relationship, substitution of the 3,5-dihydrophenyl group on the opened-chain trimer that formed a biaryl linkage tended to increase the activity (7, IC50 = 22.5 μM vs 2, IC50 = 164.7 μM). However, substitution of the 3,5-dihydrophenoxy group of eckol yielded the tetremeric phlorotannins 4–6 with reduced activities. When we compared a series of phloroeckols (5 and 6), we found that introduction a 3,5-dihydrophenoxy substituent at the 2C-position of the 3,5-dihydrophenoxy group (phloro-) increased the inhibitory activity ∼3-fold; 2-phloroeckol (5) had an IC50 = 13.3 μM and 7-phloroeckol (6) had an IC50 = 42.1 μM. Interestingly, blocking of one of the hydroxy units (C7) on the A ring, which contains a five-membered closed ring, appear to exert a variable (9, IC50 = 16.7 μM) but not insignificant effect on the activity. As evidenced from the SARS-CoV 3CLpro inhibition data, the eckol structure is essential and crucial for good inhibition of 3CLpro. Most importantly, we found that dieckol (8), which possesses two eckol groups linked through a diphenyl ether, showed the most potent SARS-CoV 3CLpro inhibitory activity (IC50 = 2.7 μM). In addition, the inhibitory effect of dieckol (8) was comparable to that of a naturally derived quinone-methide triterpene (IC50 = 2.6 μM), which we isolated during our previous investigation on 3CLpro inhibitors from Tripterygium regelii. 24 Dieckol (8) showed 30-, 50-, and 60-fold greater activities than the positive control, hesperetin (60 μM), daidzein (105 μM), and aloeemodin (132 μM), respectively, previously reported by Lin and co-workers.22 To the best of our knowledge, this is the first report on the biological activities of phlorotannins isolated from E. cava toward SARS-CoV 3CLpro.
Next, we studied the kinetic mechanism of the interaction of these inhibitors with SARS-CoV 3CLpro. The enzymatic activity was measured with a series of substrate concentrations and various inhibitor concentrations. The inhibition data were globally fit to all of the possible kinetic models. As shown in Figure 2C, the kinetic plots show that dieckol (8) has competitive inhibition profiles because the Lineweaver–Burk plot (1/V vs 1/[S]) is a series of straight lines with the same y-axis intercept for the SARS-CoV 3CLpro inhibitors. All of the isolated inhibitors exhibited the same mode of action for inhibition. The K i values in Table 1 were calculated from the Dixon plots, which are useful for determining the K i value of the inhibitor (see Supplementary data Fig. 4S). The predominant inhibition mode shown by the naturally occurring viral enzyme inhibitors was noncompetitive. Interestingly, the inhibition of SARS-CoV 3CLpro by the phlorotannins isolated from E. cava was rarely competitive, encouraged us to further investigate this phenomenon with a more detailed biological study.
2.3. Effect of isolated phlorotannins on SARS-CoV 3CLprocis-cleavage assay
We subsequently performed the cell-based cis-cleavage assay to confirm the inhibitory activities of the isolated phlorotannins against SARS-CoV 3CLpro. All of the tested phlorotannins, except 1–3, exhibited dose-dependent cell-based SARS-CoV 3CLpro cis-cleavage inhibitory activities. In the cell-based cleavage assay, the isolated phlorotannins 4–9 inhibited the cis-cleavage activity of the SARS-CoV 3CLpro with IC50 values ranging from 68 to 177 μM (Fig. 3 and Table 2 ) in a dose-dependent manner. Moreover, all of the phlorotannins were non-toxic to Vero cells with CC50 values greater than 200 μM. Active phlorotannins were less effective when evaluated with the SARS-CoV 3CLpro cis-cleavage assay than when evaluated by the cell-free trans-cleavage assay. The explanation for this result may be that several of the compounds cannot permeate the cellular membranes to reach the intracellular SARS-CoV 3CLpro. The cell-based assay indicated that dieckol (8, IC50 = 68.1 μM) is the most efficient at blocking the cleavage processing of the 3CLpro, which agreed with the cell-free cleavage FRET assay data. Dieckol (8) showed a strong correlation between the effects on the cell-free and cell-based cleavage of the SARS-CoV 3CLpro. In particular, dieckol (8) was more efficient at blocking the cleavage of 3CLpro than indigo, sinigrin, beta-sitosterol, and aloeemodin, which were previously reported plant-derived phenolic compounds.22 Although diekcol (8) is considerably less effective than hesperetin (IC50 = 8.3 μM),22 it is the first report of a phlorotannin chemotype dieckol (8) that significantly blocks the cleavage of a SARS-CoV 3CLpro.
Figure 3.
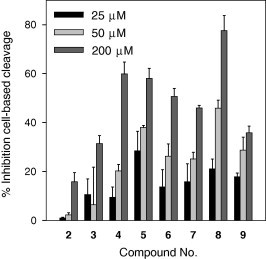
Inhibition of the cell-based cis-cleavage of the SARS-CoV 3CLpro by the isolated phlorotannins (2–9).
Table 2.
Inhibitory effects of isolated phlorotannins (1–9) on the cell-based cis-cleavage activity of SARS-CoV 3CLpro
| Compounds | Cell-based cleavage |
||
|---|---|---|---|
| IC50a (μM) | CC50b (μM) | SIc | |
| 1 | NDd | >200 | ND |
| 2 | 15% at 200 μM | >200 | <1 |
| 3 | 30% at 200 μM | >200 | <1 |
| 4 | 146.5 ± 12.5 | >200 | >1.4 |
| 5 | 112.2 ± 6.1 | >200 | >1.8 |
| 6 | 112.0 ± 5.8 | >200 | >1.8 |
| 7 | 177.1 ± 10.1 | >200 | >1.1 |
| 8 | 68.1 ± 2.2 | >200 | >2.9 |
| 9 | 174.6 ± 9.7 | >200 | >1.1 |
All compounds were examined in a set of triplicates experiment; IC50 (50% inhibitory concentration) values of compounds represent the concentration that caused 50% enzyme activity loss.
All compounds were examined in a set of triplicates experiment; CC50 (50% cytotoxic concentration) was the concentration giving half the OD570–630 nm of mock cells in MTT assay.
SI means selective index (CC50/IC50).
Not detected.
2.4. Real-time analysis of diekcol (8) interaction with SARS-CoV 3CLpro by surface plasmon resonance (SPR)
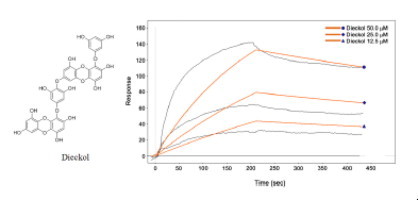
Surface plasmon resonance (SPR) is a useful technique for monitor molecular reactions in real-time and has been used to determine binding specificity as well as the rates of association and dissociation between ligands and protein. In this study, the SARS-CoV 3CLpro was immobilized on the sensor chip, and the most potent 3CLpro inhibitor, dieckol (8), isolated from E. cava was passed over the sensor’s surface. To analyze whether dieckol’s (8) interaction is due to a specific binding event, the SPR sensorgram of the compound was recorded at several different concentrations. The binding responses in resonance units (RUs) were continuously recorded and presented graphically as a function of time. The association was described by a simple equilibrium of the A + B ↔ AB type (A, analyte; B, ligand; and AB, complex). The SPR sensorgram was used to determine the kinetic binding parameters, the association rate constant k on [μM−1 s−1] and the dissociation rate constant k off [s−1]. For SARS-CoV 3CLpro, diekcol (8) increased the SPR sensorgram in a significant and dose-dependent manner (Fig. 4 A). The dissociation constant K D (k off/k on) was calculated by globally fitting the kinetic data at various dieckol (8) concentrations (12.5, 25, and 50 μM) to the Langmuir binding model (K D = 10.3 μM). The K D for the dieckol (8) interaction was thus simulated as a classical type of interaction (several analyte concentrations flowed serially across an immobilized ligand with a surface regeneration step between each infection)34 with k on = 73.5 μM−1 s−1 and k off = 0.000843 s−1, which quantitatively revealed a higher association rate than that of hesperetin (K D = 24.5 μM) (see Supplementary data Fig. 7S).
Figure 4.
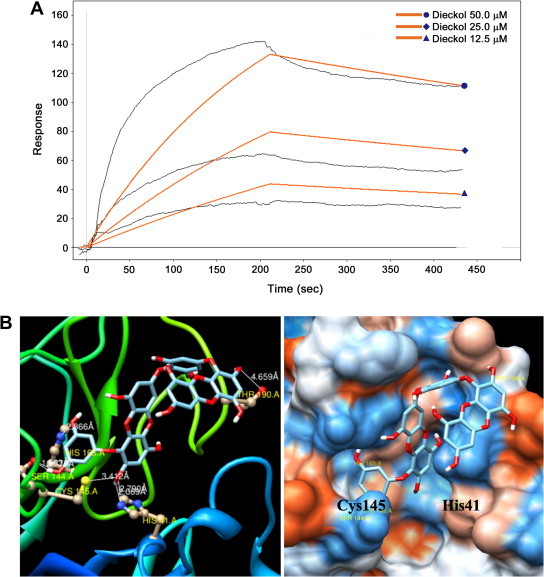
(A) Sensorgrams for the interaction of dieckol (8) with SARS-CoV 3CLpro. (B) The binding pose of dieckol (8) in SARS-CoV 3CLpro. Ribbon plots of dieckol (8) complexed to 3CLpro with hydrogen bonding.
2.5. In silico molecular docking simulation of dieckol (8)
The promising results outlined above encouraged us to further investigate the principal interactions between the phlorotannin and SARS-CoV 3CLpro. To gain further insight into the inhibition mechanism, a docking experiment was performed. The most potent inhibitor of SARS-CoV 3CLpro, dieckol (8), was analyzed by molecular docking analysis for its interactions with protein residues in the original ligand-binding site. The 3-dimensional structure of SARS-CoV 3CLpro complex to an inhibitor (coded 2ZU5)32 obtained from the Protein Data Bank (PDB; http://www.rcsb.org/pdb/) was used for the modeling analysis. The conformation analysis was conducted using AutoDock 3.0.5 because of its powerful conformational search capabilities.
Phlorotannins (1–9), which have been identified as competitive inhibitors of the trans/cis-cleavage assays of SARS-CoV 3CLpro, were fit into the substrate-binding pocket (S1 pocket) of the enzyme in the docking simulation. The results of the simulation showed that the tested compounds (1–9) had docking energies ranging from −5.83 to −11.76 kcal/mol (see Supplementary data Table 2S). Most poignantly, dieckol (8), which possess two eckol groups linked by a diphenyl ether, showed the lowest binding energy of −11.51 kcal/mol. Previously, we found that the eckol structure is essential and crucial for good inhibition of SARS-CoV 3CLpro. As shown in Figure 4B, the C2″ hydroxyl group of dieckol (8) forms a hydrogen bond with Thr190 (4.66 Å), and the C5′ hydroxyl group forms a hydrogen bond with His163 (2.87 Å). Additionally, the C3′ hydroxyl group forms a hydrogen bond with Ser144 (2.78 Å), and the C2 hydroxyl group of dieckol (8) formed two H-bonds with His41 (2.79 Å) and Cys145 (3.41 Å), the catalytic residues of SARS-CoV 3CLpro. Simulating the docking interactions between dieckol (8) and the amino acid residues in the active site of 3CLpro revealed that dieckol (8) bound to the S1 site of SARS-CoV 3CLpro through H-bonds. Additionally, we confirmed that dieckol (8) formed especially strong hydrogen bonds to the catalytic dyad (Cys145 and His41) of SARS-CoV 3CLpro. These docking experiments support the inferences drawn from the enzymatic assay that revealed the important inhibitory action of dieckol (8) on SARS-CoV 3CLpro.
3. Conclusions
In this study, we report for the first time that phloratannins from E. cava competitively inhibited SARS-CoV 3CLpro in the cell-free/based systems. The inhibition activities of phlorotannins against 3CLpro were assessed with a cell-free/based analysis confirmed by FRET and luciferase. From these results, we evaluated the binding affinity of the phlorotannins isolated from E. cava for 3CLpro by SPR analysis and a molecular binding study. All of the phlorotannins (1–9), except phloroglucinol (1), showed a dose-dependent inhibitory effect on 3CLpro hydrolysis with IC50 values ranging from 2.7 to 164.7 μM against cell-free 3CLpro trans-cleavage. All 3CLpro inhibitors (2–9) manifested competitive inhibition. In particular, dieckol (8), which possesses two eckol groups linked by a diphenyl ether, showed the most potent SARS-CoV 3CLpro inhibitory activity (IC50 = 2.7 μM). Additionally, dieckol (8) had the most potent inhibitory activity on the cell-based 3CLpro cis-cleavage assay, and its potency was greater than the other phlorotannin derivatives and the natural reference inhibitors. In addition, our detailed protein-inhibitor binding affinity analyses by SPR and molecular docking simulations of dieckol (8) unveiled that it has a high association rate and forms strong hydrogen bonds to the catalytic dyad (Cys145 and His41) of SARS-CoV 3CLpro with the lowest binding energy.
4. Materials and methods
4.1. General apparatus and chemical
1H and 13C NMR data were obtained on a JNM-ECA 400 (Jeol, Japan) spectrometer in DMSO-d 6 and MeOH-d 3, and using tetramethylsilane (TMS) as an internal standard. ESI mass spectra were collected in negative ion mode. HPLC spectra were collected with an Agilent 1200 series equipped with a binary pump and VWD and analyzed with the Chemstation software program. The analytical column was an Agilent ZARBOX Bonus-RP (5 m, 150 × 4.6 mm i.d.). All reagent grade chemicals were purchased from Sigma Chemical Co. (St. Louis, MO, USA). Chromatographic separations were carried out using Thin-Layer Chromatography (TLC) (E. Merck Co., Darmastdt, Germany) on commercially available glass plates pre-coated with silica gel and visualized under UV light at 254 and 366 nm. Column chromatography was carried out using 230–400 mesh silica gel (kieselgel 60, Merck, Germany). Sephadex LH-20 (Amersham Biosciences) and RP-18 (ODS-A, 12 nm, S-150 mM, YMC) were used for column chromatography.
4.2. Extraction and isolation
Dried powder of brown Alga Ecklonia cava (3 kg) was extracted with ethanol (3 × 15 L) for a week at room temperature. The concentrated extract (230 g) was suspended in H2O (2 L), and the aqueous layer was partitioned sequentially with n-hexane (10 L), ethyl acetate (20 L), and water. The obtained ethyl acetate layer (85 g) was chromatographed over silica gel using a chloroform:methanol (100:0–1:3, v/v) gradient to produce 15 fractions (fr. 1–fr. 15). Fraction 4 (fr. 4) was repeatedly subjected to silica gel column chromatography using a mixture chloroform:methanol (100:0–1:3, v/v) to give 3 fractions (fr. 41–fr. 43). Dioxinodehydroeckol (4) was purified from a sub-fraction (fr. 42) by MPLC using a gradient solvent system containing chloroform:methanol (100:0–7:3, v/v). Triphloretol-A (2) and dieckol (8) were obtained by purifying fraction 7 (fr. 7) using C-18 column chromatography with a mixture of water:methanol (100:0–1:4, v/v). Fraction 5 (fr. 5) was purified on a silica gel column using a gradient solvent system containing chloroform:methanol (100:0–1:5, v/v) to yield 5 fractions (fr. 51–fr. 55) based on TLC analysis. Phlorofucofuroeckol A (9) was purified by MPLC using a chloroform:methanol solvent mixture (100:0–7:3, v/v) and was obtained from a sub-fraction (fr. 53). Fraction 55 (fr. 55) was subjected to C-18 column chromatography using water:methanol (100:0–1:4, v/v) to give 7-phloroeckol (6), fucodiphloroethol G (7) and eckol (3) based on TLC analysis. Fraction 51 (fr. 51) was re-purified through a C-18 column with methanol, and two compounds were obtained, phloroglucinol (1) and 2-phloroeckol (5).
4.3. Characteristic data of the isolated compounds
4.3.1. Phloroglucinol (1)
White powder; mp 218–219 °C; ESI-MS m/z = 125 [M−H], [calcd C6H6O3, 126]; 1H NMR (400 MHz, methanol-d 4) δ 5.80 (s, 3H, H-2, H-4, H-6); 13C NMR (75 MHz, methanol-d 4) δ 158.7 (C-1, C-3, C-5), 94.0 (C-2, C-4, C-6).
4.3.2. Triphlorethol A (2)
White powder; ESI-MS m/z = 373 [M−H]−, [calcd C18H14O9, 374]; 1H NMR (400 MHz, methanol-d 4) δ 6.06 (d, J = 2.93 Hz, 1H, H-5), 6.01 (d, J = 1.95 Hz, 2H, H-6, H-2″), 5.94 (t, J = 2.44 Hz, 1H, H-4″), 5.90 (s, 2H, H-5′, H-3′), 5.76 (d, J = 2.44 Hz, 1H, H-3); 13C NMR (100 MHz, methanol-d 4) δ 162.5 (C-1″), 160.4 (C-3″, C-5″), 156.5 (C-4′), 156.3 (C-4), 153.8 (C-6), 152.7 (C-2), 152.2 (C-6′, C-2′), 125.8 (C-1), 124.8 (C-1′), 98.2 (C-3), 97.6 (C-4″), 96.3 (C-5′, C-3′), 95.5 (C-2″, C-6″), 95.0 (C-5).
4.3.3. Eckol (3)
Light brown powder; mp 235 °C; ESI-MS m/z = 371 [M−H], [calcd C18H12O9, 372]; 1H NMR (400 MHz, methanol-d 4) δ 6.15 (s,1H, H-3), 5.96 (s, 2H, H-3, H-6), 6.03 (s, 3H, H-2′, H-4′, H-6′); 13C NMR (100 MHz, methanol-d 4) δ 161.9 (C-1′), 160.3 (C-3′, H-5′), 154.6 (C-7), 147.3 (C-2), 147.2 (C-9), 144.3 (C-5a), 143.4 (C-4), 138.6 (C-10a), 125.7 (C-1), 124.9 (C-4a), 124.6 (C-9a), 99.9 (C-8), 99.5 (C-3), 97.8 (C-4′), 95.9 (C-6), 95.5 (C-4′, C-6′).
4.3.4. Dioxinodehydroeckol (4)
White powder; ESI-MS m/z = 371 [M+H]+, [calcd C18H10O9, 370]; 1H NMR (400 MHz, methanol-d 4) δ 6.15 (s, 1H, H-7), 6.02 (d, J = 2.93 Hz, 1H, H-2), 6.01 (d, J = 2.44 Hz, 1H, H-10), 5.99 (d, J = 2.93 Hz, 1H, H-4), 5.96 (d, J = 2.93 Hz, 1H, H-12); 13C NMR (100 MHz, methanol-d 4) δ 147.3 (C-1), 147.2 (C-9), 144.0 (C-4a), 143.7 (C-12a), 141.5 (C-6), 139.4 (C-7a), 133.3 (C-13b), 128.0 (C-5a), 125.1 (C-8a), 125.0 (C-13a), 124.7 (C-14a), 100.2 (C-2), 100.0 (C-10), 99.1 (C-7), 96.0 (C-4), 96.0 (C-5).
4.3.5. 2-Phloroeckol (5)
Light brown powder; mp 201–205 °C; ESI-MS m/z = 495 [M−H]−, [calcd C24H16O12, 495]; 1H NMR (400 MHz, DMSO-d 6) δ 9.51 (s, 1H, OH-9), 9.40 (s, 1H, OH-4), 9.17 (s, 1H, OH-7), 9.12 (s, 1H, OH-3″, 5″), 9.07 (s, 1H, OH-2″, 6″), 8.96 (s, 1H, OH-4″), 5.97 (d, J = 2.93 Hz, 1H, H-8), 5.86 (d, J = 1.95 Hz, 2H, H-2′, 6′), 5.84 (s, 2H, H-3″, 5″), 5.82 (t, J = 1.95 Hz, 1H, H-4′), 5.81 (s, 1H, H-3), 5.79 (d, J = 2.93 Hz, 1H, H-5); 13C NMR (100 MHz, DMSO-d 6) δ 159.9 (C-1′), 158.3 (C-3′, C-5′), 154.3 (C-4″), 152.7 (C-7), 150.7 (C-2″, H-6″), 147.3 (C-2), 145.7 (C-9), 142.1 (C-5a), 141.2 (C-4), 136.7 (C-10a), 123.8 (C-4a), 122.2 (C-1), 121.4 (C-9a), 98.2 (C-8), 95.9 (C-4′), 95.5 (C-3), 94.4 (C-3″, 5″), 93.7 (C-2′, C-6′), 93.4 (C-6).
4.3.6. 7-Phloroeckol (6)
Light brown powder; ESI-MS m/z = 495 [M−H]−, [calcd C24H16O12, 496]; 1H NMR (400 MHz, DMSO-d 6) δ 9.60 (s, 1H, OH-9), 9.40 (s, 1H, OH-4), 9.20 (s, 1H, OH-2), 9.12 (s, 1H, OH-3′, 5′), 9.11 (s, 1H, OH-2″, 6″), 8.99 (s, 1H, OH-4′), 6.14 (s, 1H, H-3), 6.00 (d, J = 2.93 Hz, 1H, H-8), 5.85 (s, 2H, H-3″, 5″), 5.80 (t, J = 1.95 Hz, 1H, H-4′), 5.78 (d, J = 2.93 Hz, 1H, H-6), 5.85 (d, J = 2.44 Hz, 2H, H-2′, 6′); 13C NMR (100 MHz, DMSO-d 6) δ 160.2 (C-1′), 158.7 (C-3′, C-5′), 154.7 (C-4″), 154.5 (C-7), 151.1 (C-2″, H-6″), 146.0 (C-9), 145.8 (C-2), 142.3 (C-5a), 141.8 (C-4), 137.0 (C-10a), 123.9 (C-9a), 123.1 (C-4a), 122.1 (C-1″), 122.1 (C-1), 98.2 (C-3), 98.1 (C-8), 96.2 (C-4′), 94.8 (C-3″), 93.6 (C-2′).
4.3.7. Fucodiphloroethol G (7)
White powder; ESI-MS m/z = 499 [M+H]+, [calcd C24H16O12, 498]; 1H NMR (400 MHz, methanol-d 4) δ 6.13 (d, J = 2.44 Hz,1H, H-4″), 6.07 (s, 2H, H-3′′′, H-5′′′), 6.03 (s, 1H, H-6″), 6.03 (d, J = 0.98 Hz, 1H, H-5), 5.92 (s, 2H, H-3′, H-5′), 5.70 (d, J = 2.44 Hz, 1H, H-3); 13C NMR (100 MHz, methanol-d 4) δ 159.6 (C-5″), 159.5 (C-1″), 159.3 (C-3″), 159.2 (C-4′′′), 158.1 (C-4′), 157.6 (C-2), 156.5 (C-2′′′, C-6′′′), 153.9 (C-4), 152.3 (C-2′, C-6′), 152.1 (C-6), 124.9 (C-1), 124.4 (C-1′), 102.1 (C-2″), 101.9 (C-1′′′), 98.1 (C-3), 97.6 (C-4″), 96.8 (C-5′′′), 96.4 (C-3′′′, C-5′, C-3′), 94.6 (C-5), 94.3 (C-6″).
4.3.8. Dieckol (8)
Light brown powder; mp 278 °C; ESI-MS m/z = 741 [M−H]−, [C30H18O14,742]; 1H NMR (400 MHz, methanol-d 4) δ 6.16 (s, 1H, H-3′′), 6.14 (s, 1H, H-3), 6.10 (s, 2H, H-2′′′, H-6′′′), 6.07 (d, 1H, J = 2.93 Hz, H-6), 6.06 (d, 1H, J = 2.93 Hz, H-8), 5.99 (d, 1H, J = 2.93 Hz, H-6″), 5.96 (d, 1H, J = 2.93 Hz, H-8″), 6.10 (s, 3H, H-4′, H-2′ H-6′); 13C NMR (C-7′′′), 152.5 (C-3′′′, C-5′′′), 147.5 (C-2), 147.4 (C-9′), 147.3 (C-9″), 147.1 (C-2″), 144.4 (C-5a″), 144.3 (C-5a), 143.5 (C-4), 143.4 (C-4a″), 138.8 (C-10a), 138.6 (C-10a′), 126.6 (C-4′′′), 126.3 (C-9a), 125.8 (C-4a), 125.7 (C-4a″), 125.0 (C-9a″), 124.8 (C-1″), 124.7 (C-1), 100 (C-8″), 99.9 (C-3″), 99.6 (C-3), 99.5 (C-8), 97.8 (C-4′), 96.3 (C-2′′′, C-6′′′), 96.0 (C-6″), 95.9 (C-6), 95.5 (C-2′, C-6″).
4.3.9. Phlorofucofuroeckol A (9)
Colorless amorphous solid; mp 278 °C; ESI-MS m/z = 601 [M−H]−, [calcd C30H18O14, 602]; 1H NMR (400 MHz, methanol-d 4) δ 6.64 (s, 1H, H-13), 6.41 (s, 1H, H-9), 6.27 (s, 1H, H-3), 6.07 (d, 1H, J = 2.93 Hz, H-6), 5.99 (d, 2H, J = 1.95 Hz, H-2′, H-6′), 5.95 (t, 1H, J = 1.95 Hz, H-4′), 5.93 (t, 1H, J = 1.95 Hz, H-4″), 5.90 (d, 2H, J = 1.95 Hz, H-2″, H-6″); 13C NMR (100 MHz, methanol-d 4) δ 162.0 (C-1′, C-1″), 160.3 (C-3″, C-5″, C-3′, C-5′), 153.3 (C-12a), 151.8 (C-10), 151.3 (C-11a), 146.1 (C-14), 144.1 (C-4), 138.5 (C-15a), 135.4 (C-5a), 128.3 (C-14a), 125.2 (C-4a), 124.8 (C-1), 122.5 (C-11), 105.5 (C-7), 105.4 (C-6), 100.1 (C-9), 99.5 (C-3), 97.9 (C-4″), 97.8 (C-4′), 96.3 (C-13), 95.5 (C-2′, C-6′, C-2″, C-6″).
4.4. Expression and purification of SARS-CoV 3CLpro
The gene encoding the 3CL protease (nucleotide residues 9970-10887, GenBank accession no. AY345987) of SARS-CoV was synthesized based on the sequence reported by Sun et al.25 (GenScript, Piscataway, NJ, USA). Recombinant SARS-CoV 3CLpro was expressed E. coli BL21 (DE3) CodonPlus-RIL cells (Stratagene, La Jolla, CA, USA) by transforming the pET23d(+)-SARS-3CLpro to produce a C-terminal fusion with six histidine residues. The expression and purification of SARS-CoV 3CLpro were performed as previously described.26, 27 Briefly, cells were grown in 1 L of LB broth containing 100 μg/ml of ampicilline at 37 °C until OD600 reached 0.5 and were then induced with 0.5 mM isopropyl β-d-thiogalactopyranoside for 8 h at 16 °C. After centrifugation at 6000×g at 4 °C for 25 min, the pellet was washed, frozen, and suspended in buffer A (20 mM sodium phosphate, 300 mM NaCl, 10 mM imidazole, 0.1% Triton X-100, pH 7.5). The suspended cells were sonicated and centrifuged at 15,000×g at 4 °C for 30 min. The resulting supernatant was applied to a nickel-affinity chromatography throughout the procedure. The protein in the final column fraction was dialyzed overnight against 20 mM Tris–HCl buffer (pH 7.5) with 1 mM dithiothreitol and stored at −80 °C. The enzyme concentration was determined spectrophotometrically at 562 nm using the BioRad protein assay. The purity and molecular weight of SARS-CoV 3CLpro was verified by SDS–PAGE. The purified protease ran approximately to the calculated size of 33 kDa on SDS–PAGE.
4.5. SARS-CoV 3CLprotrans-cleavage assay
As described, the inhibitory effect of each compound on SARS-CoV 3CLpro was measured using a FRET method.26, 27 In this assay, the 14-mer fluorogenic peptide Dabcyl-KTSAVLQSGFRKME-Edans (Anygen Co., Republic of Korea) was used as a substrate, and the enzyme activity was determined by measuring the increase in fluorescence by continuously monitoring the reactions at 590/40 nm with excitation at 360 nm using a fluorescence plate reader (Flx800, BioTeck Instrument Inc., USA). The IC50 values of the isolated compounds were measured in a reaction mixture containing 10 μg/ml of the 3CLpro (final concentration, 2.5 μg), the test compounds (from 0 to 200 μM), and 10 μM of the fluorogenic 14-mer peptide substrate in 20 mM Bis–Tris buffer (pH 7.5). To determine the enzyme activity, the experimental data was fit to a logistic curve with Eq. 1, a time-drive protocol was used and the initial velocity was recorded over a range of concentrations, and the data were analyzed using a nonlinear regression program [Sigma Plot (SPCC Inc., Chicago, IL)]:
| (1) |
where C is the fluorescence of the control (enzyme, buffer, and substrate) after 60 min of incubation, C 0 is the fluorescence of the control at 0 min, S is the fluorescence of the tested samples (enzyme, sample solution, and substrate) after incubation, and S 0 is the fluorescence of the tested samples at 0 min.
To study the kinetics of SARS-CoV 3CLpro inhibition by isolated compounds 1–9, various concentrations of compounds 1–9 were added to 3CLpro in assay buffer containing the predetermined substrate. The K i values were calculated by nonlinear regression analysis by fitting different models of enzyme inhibition to the kinetic data using SigmaPlot Enzyme Kinetics Module 1.3 (SPSS Inc., Chicago, IL). The inhibition mechanism of the compounds was determined by comparing the statistical results, including the Akaike’s information criterion values, of different inhibition models and selecting the one with the best fit.28
4.6. SARS-CoV 3CLprocis-cleavage assay
For the cell-based cis-cleavage assay, the in-frame construction of 3CLpro, the substrate, and luciferase formed the plasmid pcDNA3.1-3CLpro-S-Luc. 22, 29 The constructed plasmid DNA was transfected into Vero cells with lipofectamin according to the manufacturer’s instructions (Invitrogen, USA). The transfected cells were incubated in Dulbeccos modified Eagle’s medium (DMEM) containing 10% bovine serum (FBS) for 4 h at 37 °C under a 5% CO2 atmosphere. Then, the media was removed and replaced by DMEM containing the tested compounds at different concentrations. After 5 h of incubation, the activity of luciferase in the cell lysate was measured using the dual Luciferase Reporter Assay System (Promega, USA) and a Luminometer Centro XS3 LB 960 (Berthold Technology, Inc.). Because the greater than 33 kDa protein fused to the N-terminus of luciferase remarkably decreased luciferase activity,30 the detection of luciferase activity was considered a measure of the cis-cleavage by the SARS-CoV 3CLpro.22
4.7. Real-time analysis of ligand interaction with SARS-CoV 3CLpro by surface plasmon resonance (SPR)
SPR measurements were performed on a Reichert SPR SR7500 instrument kindly provided on loan from WooJung BSC Inc. The enzyme was dialyzed in PBS buffer prior to immobilization. The surface was activated with a 7 min injection of EDC/sulfo-NHS mixture at 200/50 mM concentration. The protein was diluted to 100 μg/mL with 20 mM acetate buffer (pH 5.0) and injected for 10 min. The active sites were quenched with 1 M ethanolamine buffer at pH 8.0 and washed with phosphate-buffered saline at pH 7.2 (PBS). The binding surface was stabilized with 3–5 blank injections of PBS. PBS was used as a running and sample dilution buffer for all of the experiments. The tested inhibitors were first prepared as 20 mM stock solutions in dimethyl sulfoxide (DMSO) and further diluted into PBS immediately prior to the experiments. Analyte binding was analyzed using automated runs of the twofold dilution series and two ‘zero concentration’ injections. Regeneration steps were performed using 10 mM NaOH. The data was analyzed with the Scrubber2 software. Referenced and blanked binding dissociation curves were fit globally to a two-state binding kinetics model.
4.8. Molecular docking simulation study
Docking experiments were conducted using Autodock 3.0.5 with a Lamarckian Genetic Algorithm (LGA).31 A 3-dimensional coordinate in the X-ray crystal structure of SARS-CoV 3CLpro (PDB accession code 2ZU5)32 obtained from the Protein Data Bank (PDB; http://www.pdb.org) was used for the docking studies. After removing the water molecules, the polar hydrogen (H) atoms were added to the macromolecule, the histidine residues were made neutral, and the Kollman charges were assigned for all atoms.33 The 3-dimensional atomic coordinates of the compounds were generated by the Corina program (Molecular Networks GmbH, Erlangen, Germany). AutoDock version 3.0.5 was used for the computational molecular docking simulation of the flexible small molecules to the rigid proteins. The docking results were ranked according to the docking energy scores. The Chimera software 1.4.1 program (University of California, San Francisco) was used to identify the potential H-bonds between the residues in the active site pocket of SARS-CoV 3CLpro.
Acknowledgments
This research was supported by National Research Foundation Grant founded by Korea Government (MEST) (No. 2012-0001110) and KRIBB Research Initiative Program, Republic of Korea.
Footnotes
Supplementary data associated with this article can be found, in the online version, at http://dx.doi.org/10.1016/j.bmc.2013.04.026.
Supplementary data
References and notes
- 1.Jung W.-K., Heo S.-J., Jeon Y.-J., Lee C.-M., Park Y.-M., Byun H.-G., Choi Y.H., Park S.-G., Choi I.-W. J. Agric. Food Chem. 2009;57:4439. doi: 10.1021/jf9003913. [DOI] [PubMed] [Google Scholar]
- 2.Kim K.N., Heo S.J., Yoon W.J., Kang S.M., Ahn G., Yi T.H., Jeon Y.J. Eur. J. Pharmacol. 2010;649:369. doi: 10.1016/j.ejphar.2010.09.032. [DOI] [PubMed] [Google Scholar]
- 3.Lee S.-H., Heo S.-J., Hwang J.-Y., Han J.-S., Jeon Y.-J. J. Sci. Food Agric. 2010;90:349. doi: 10.1002/jsfa.3833. [DOI] [PubMed] [Google Scholar]
- 4.Choi J.-G., Kang O.-H., Brice O.-O., Lee Y.-S., Chae H.-S.C., Oh Y.-C., Sohn D.-H., Park H., Choi H.-G., Kim S.-G., Shin D.-W., Kwon D.-Y. Foodborne Pathog. Dis. 2010;7:436. doi: 10.1089/fpd.2009.0434. [DOI] [PubMed] [Google Scholar]
- 5.Zeng C., Teseng C., Zhang J., Chang C. Hydrobiologia. 1984;116:152. [Google Scholar]
- 6.Ahn G.-N., Kim K.-N., Cha S.-H., Song C.-B., Lee J., Heo M.-S., Yeo I.-K., Lee N.-H., Jee Y.-H., Kim J.-S., Heu M.-S., Jeon Y.-J. Eur. Food Res. Technol. 2007;226:71. [Google Scholar]
- 7.Kim M.-M., Ta Q.V., Mendis E., Rajapakse N., Jung W.-K., Byun H.-G., Jeon Y.-J., Kim S.-K. Life Sci. 2006;79:1436. doi: 10.1016/j.lfs.2006.04.022. [DOI] [PubMed] [Google Scholar]
- 8.Crockett S.L., Wenzig E.M., Kunert O., Bauer R. Phytochem. Lett. 2008;1:37. doi: 10.1016/j.phytol.2007.12.003. [DOI] [PMC free article] [PubMed] [Google Scholar]
- 9.Kang K.A., Lee K.H., Park J.W., Lee N.H., Na H.K., Surh Y.J., You H.J., Chung M.H., Hyun J.W. FEBS Lett. 2000;2007:581. doi: 10.1016/j.febslet.2007.04.022. [DOI] [PubMed] [Google Scholar]
- 10.Yoon N.Y., Eom T.K., Kim M.M., Kim S.K. J. Agric. Food Chem. 2009;57:4124. doi: 10.1021/jf900006f. [DOI] [PubMed] [Google Scholar]
- 11.Artan M., Li Y., Karadeniz F., Lee S.-H., Kim M.-M., Kim S.-K. Bioorg. Med. Chem. 2008;16:7921. doi: 10.1016/j.bmc.2008.07.078. [DOI] [PubMed] [Google Scholar]
- 12.Ryu Y.B., Jeong H.J., Yoon S.Y., Park J.-Y., Kim Y.M., Park S.-J., Rho M.-C., Kim S.-J., Lee W.S. J. Agric. Food Chem. 2011;59:6467. doi: 10.1021/jf2007248. [DOI] [PubMed] [Google Scholar]
- 13.Ksiazek T.G., Erdman D., Goldsmith C.S., Zaki S.R., Peret T., Emery S., Tong S., Urbani C., Comer J.A., Lim W., Rollin P.E., Dowell S.F., Ling A.-E., Humphrey C.D., Shieh W.-J., Guarner J., Paddock C.D., Rota P., Fields B., DeRisi J., Yang J.-Y., Cox N., Hughes J.M., LeDuc J.W., Bellini W.J., Anderson L.J. N. Eng. J. Med. 2003;348:1953. doi: 10.1056/NEJMoa030781. [DOI] [PubMed] [Google Scholar]
- 14.Stadler K., Masignani V., Eickmann M., Becker S., Abrignani S., Klenk H.D., Rappuoli R. Nat. Rev. Microbiol. 2003;1:209. doi: 10.1038/nrmicro775. [DOI] [PMC free article] [PubMed] [Google Scholar]
- 15.Ziebuhr J. Curr. Opin. Microbiol. 2004;7:412. doi: 10.1016/j.mib.2004.06.007. [DOI] [PMC free article] [PubMed] [Google Scholar]
- 16.Yang H., Yang M., Ding Y., Liu Y., Lou Z., Zhou Z., Sun L., Mo L., Ye S., Pang H., Gao G.F., Anand K., Bartlam M., Hilgenfeld R., Rao Z. Proc. Natl. Acad. Sci. U.S.A. 2003;100:13190. doi: 10.1073/pnas.1835675100. [DOI] [PMC free article] [PubMed] [Google Scholar]
- 17.Cinatl J., Jr., Michaelis M., Hoever G., Preiser W., Doerr H.W. Antiviral Res. 2005;66:81. doi: 10.1016/j.antiviral.2005.03.002. [DOI] [PMC free article] [PubMed] [Google Scholar]
- 18.Wu C.Y., Jan J.T., Ma S.H., Kuo C.J., Juan H.F., Cheng Y.S., Hsu H.H., Huang H.C., Wu D., Brik A., Liang F.S., Liu R.S., Fang J.M., Chen S.T., Liang P.H., Wong C.H. Proc. Natl. Acad. Sci. U.S.A. 2004;101:10012. doi: 10.1073/pnas.0403596101. [DOI] [PMC free article] [PubMed] [Google Scholar]
- 19.Kao R.Y., Tsui W.H.W., Lee T.S.W., Tanner J.A., Watt R.M., Huang J.-D., Hu L., Chen G., Chen Z., Zhang L., He T., Chan K.-H., Tse H., To A.P.C., Ng L.W.Y., Wong B.C.W., Tsoi H.-W., Yang D., Ho D.D., Yuen K.-Y. Chem. Biol. 2004;11:1293. doi: 10.1016/j.chembiol.2004.07.013. [DOI] [PMC free article] [PubMed] [Google Scholar]
- 20.Shie J.J., Fang J.M., Kuo C.J., Kuo T.H., Liang P.H., Huang H.J., Yang W.B., Lin C.H., Chen J.L., Wu Y.T., Wong C.H. J. Med. Chem. 2005;48:4469. doi: 10.1021/jm050184y. [DOI] [PubMed] [Google Scholar]
- 21.Wen C., Kuo Y., Jan J., Liang P., Wang S., Liu H., Lee C., Chang S., Kuo C., Lee S., Hou C., Hsiao P., Chien S., Shyur L., Yang N. J. Med. Chem. 2007;50:4087. doi: 10.1021/jm070295s. [DOI] [PubMed] [Google Scholar]
- 22.Lin C.W., Tsai F.J., Tsai C.H., Lai C.C., Wan L., Ho T.Y., Hsieh C.C., Chao P.D. Antiviral Res. 2005;68:36. doi: 10.1016/j.antiviral.2005.07.002. [DOI] [PMC free article] [PubMed] [Google Scholar]
- 23.Ryu Y.B., Park S.J., Kim Y.M., Lee J.Y., Seo W.D., Chang J.S., Park K.H., Rho M.C., Lee W.S. Bioorg. Med. Chem. Lett. 1873;2010:20. doi: 10.1016/j.bmcl.2010.01.152. [DOI] [PMC free article] [PubMed] [Google Scholar]
- 24.Ryu Y.B., Jeong H.J., Kim J.H., Kim Y.M., Park J.-Y., Kim D., Nguyen T.T., Park S.-J., Chang J.S., Park K.H., Rho M.-C., Lee W.S. Bioorg. Med. Chem. 2010;18:7940. doi: 10.1016/j.bmc.2010.09.035. [DOI] [PMC free article] [PubMed] [Google Scholar]
- 25.Sun H., Luo H., Yu C., Sun T., Chen J., Peng S., Qin J., Shen J., Yang Y., Xie Y., Chen K., Wang Y., Shen X., Jiang H. Protein Expression Purif. 2003;32:302. doi: 10.1016/j.pep.2003.08.016. [DOI] [PMC free article] [PubMed] [Google Scholar]
- 26.Park J.-Y., Jeong H.J., Kim J.H., Kim Y.M., Park S.-J., Kim D., Park K.H., Lee W.S., Ryu Y.B. Biol. Pharm. Bull. 2012;35:2036. doi: 10.1248/bpb.b12-00623. [DOI] [PubMed] [Google Scholar]
- 27.Park J.-Y., Kim J.H., Kim Y.M., Jeong H.J., Kim D.W., Park K.H., Kwon H.-J., Park S.-J., Lee W.S., Ryu Y.B. Bioorg. Med. Chem. 2012;20:5928. doi: 10.1016/j.bmc.2012.07.038. [DOI] [PMC free article] [PubMed] [Google Scholar]
- 28.Li X.-Q., Andersson T.B., Ahlström M., Weidolf L. Drug Metab. Dispos. 2004;32:821. doi: 10.1124/dmd.32.8.821. [DOI] [PubMed] [Google Scholar]
- 29.Lin C.W., Tsai C.H., Tsai F.J., Chen P.J., Lai C.C., Wan L., Chiu H.H., Lin K.H. FEBS Lett. 2004;574:131. doi: 10.1016/j.febslet.2004.08.017. [DOI] [PMC free article] [PubMed] [Google Scholar]
- 30.Joubert P., Pautigny C., Madelaine M.F., Rasschaert D. J. Gen. Virol. 2000;81:481. doi: 10.1099/0022-1317-81-2-481. [DOI] [PubMed] [Google Scholar]
- 31.Morris G.M., Goodsell D.S., Halliday R.S., Huey R., Hart W.E., Belew R.K., Olson A.J. J. Comput. Chem. 1998;19:1639. [Google Scholar]
- 32.Lee C.C., Kuo C.J., Ko T.P., Hsu M.F., Tsui Y.C., Chang S.C., Yang S., Chen S.J., Chen H.C., Hsu M.C., Shih S.R., Liang P.H., Wang A.H. J. Biol. Chem. 2009;284:7646. doi: 10.1074/jbc.M807947200. [DOI] [PMC free article] [PubMed] [Google Scholar]
- 33.Sanner M.F., Olson A.J., Spehner J.C. Biopolymers. 1996;38:305. doi: 10.1002/(SICI)1097-0282(199603)38:3%3C305::AID-BIP4%3E3.0.CO;2-Y. [DOI] [PubMed] [Google Scholar]
- 34.Tassa C., Duffner J.L., Lewis T.A., Weissleder R., Schreiber S.L., Koehler A.N., Shaw S.Y. Bioconjugate Chem. 2010;21:14. doi: 10.1021/bc900438a. [DOI] [PMC free article] [PubMed] [Google Scholar]
Associated Data
This section collects any data citations, data availability statements, or supplementary materials included in this article.