

Abstract
Gender, preoperative function, and other variables were explored as predictors of recovery after total hip and knee arthroplasty. One hundred fifty-two subjects (63.8 ± 10.2 years) were repeatedly assessed in the first 4 postoperative months. Average recovery curves for the Western Ontario and McMaster Universities Osteoarthritis Index, 6-minute walk test, and timed up and go test were characterized using hierarchical linear modeling. Recovery predictors were sequentially modeled after validation of the basic developmental models. Gender was a significant predictor (P ≤ .003) of physical performance measure scores 1 week after surgery. Thereafter, men and women had similar rates of improvement. Preoperative score was a significant predictor (P ≤ .001) in all models. Patients' and surgeons' expectations of outcome need to take preoperative function into account.
Key words: total hip and knee arthroplasty, hierarchical linear modeling, disability, performance measurement, outcome
A growing number of studies suggest that poor preoperative functional status is associated with poorer outcome in terms of both function and pain after total joint arthroplasty 1, 2, 3, 4, 5. This has important implications, particularly for women who, in a number of studies, have been shown to have more disability at the time of surgery and a willingness to accept greater decline in function before considering surgery 6, 7, 8, 9, 10. In examining the relationship between function preoperatively and postoperatively, self-report measures of disability have been used. It is not known whether a similar relationship exists with performance measures.
Although a number of studies have documented that women have greater disability at the time of surgery, more research is needed on the impact of gender postoperatively. Holtzman et al [7] studied gender differences in functional status and pain in a Medicare sample and found that women were more disabled at the time of total hip arthroplasty (THA) and did not do as well at 1 year. Weaver et al [11] examined the relationship between patient characteristics and outcomes in veterans after total joint arthroplasty and found that women post–total knee arthroplasty (TKA) were more likely to have complications and longer average hospital lengths of stay.
A better understanding of the patterns of early recovery after THA and TKA, and their relationship to baseline preoperative function, gender, and other potential predictors is required. Although comorbidity and age have been reported to be significant predictors of complications, length of hospital stay, need for inpatient rehabilitation, and mortality 12, 13, their reported impact on postoperative function is variable 14, 15, 16, 17, 18.
The purposes of this study were twofold: first, to establish the average pattern of recovery for the pain and physical function subscales of the Western Ontario and McMaster Universities Osteoarthritis Index (WOMAC), the 6-minute walk test (6MWT), and the timed up and go test (TUG) in the early postoperative period after TKA and THA; second, to explore gender, site of arthroplasty, preoperative baseline function, age, number of comorbidities, and the interactions among these variables as predictors of recovery.
Materials and Methods
The sample for this study consisted of patients with end-stage osteoarthritis who underwent THA or TKA. All of the surgery was conducted at a specialized orthopedic tertiary care facility in Toronto. Subject recruitment was based on the following criteria: diagnosis of osteoarthritis scheduled for primary total joint arthroplasty; sufficient language skills to communicate in written and spoken English; and absence of neurological, cardiac, and psychiatric disorders or other medical conditions that would significantly compromise physical function. Exclusion criteria included individuals scheduled for revision arthroplasty or bilateral arthroplasties, either simultaneous or staged.
Ethics approval for the study was received from the institution's research ethics review board. Data were collected on 188 patients who provided informed consent between October 2001 and March 2003. Of these patients, 36 had only baseline assessments and were lost to follow-up for the following reasons: canceled surgery, loss of follow-up due to the outbreak of Severe Acute Respiratory Syndrome in Toronto from April to June 2003, additional operative procedures, postoperative medical reasons, or patient choice. The demographic and preoperative baseline characteristics of the remaining 152 (81%) patients are summarized in Table 1 . All subjects who completed at least one postoperative assessment were retained for the analysis.
Table 1.
Summary of Study Participants by Site of Arthroplasty and Gender
| Patient characteristics and baseline preoperative function | Women, N = 75 |
Men, N = 77 |
||
|---|---|---|---|---|
| THA, n = 31 | TKA, n = 44 | THA, n = 38 | TKA, n = 39 | |
| Age (y) | 60.3 (10.84) | 66.4 (7.9) | 60.2 (11.61) | 67.2 (8.64) |
| No. of comorbidities | 1.7 (1.30) | 2.5 (1.71) | 1.5 (1.29) | 1.6 (1.27) |
| Body mass index (kg/m2) | 28.0 (4.84) | 32.4 (5.15) | 29.1 (4.33) | 30.4 (3.91) |
| TUG (s) | 11.4 (4.55) | 11.3 (3.65) | 9.1 (2.48) | 8.8 (3.22) |
| 6MWT (m) | 379.0 (115.35)⁎ | 352.9 (83.61)† | 456.4 (105.50) | 459.9 (130.40)‡ |
| WOMAC pain | 10.3 (3.52) | 10.0 (2.70) | 8.6 (3.13) | 8.5 (3.18) |
| WOMAC PF | 36.3 (10.79) | 35.9 (11.84) | 30.9 (9.95) | 28.6 (10.81) |
Data are given as mean (SD). PF indicates physical function subscale.
n = 29.
n = 43.
n = 38.
Design
This longitudinal, observational study used a repeated measures design to examine recovery profiles in arthroplasty patients using a number of self-report and physical performance measures. All patients underwent a baseline preoperative assessment 1 to 2 weeks before surgery. Postoperatively, all patients were treated using a standardized inpatient protocol, following either a primary total hip or knee care pathway. Patients undergoing TKA were permitted to be full weight bearing and participated in a progressive program of range of motion, strengthening exercises, and functional training. Patients after THA were educated about postoperative movement restrictions, and mobility and strengthening exercises were initiated. In this sample, most of the patients had weight-bearing restrictions.
The study focused on the early recovery period encompassing the first 4 months after surgery. To provide an accurate representation of change over time, the timing of the patients' follow-up measurements was not standardized. Three assessments were scheduled; the first assessment in most cases occurred at discharge from hospital and subsequent visits often coincided with surgeon follow-up.
Measures
The WOMAC, 6MWT, and TUG were chosen as measures able to provide a comprehensive assessment of the recovery of function. Because the main goals of arthroplasty are to decrease pain and improve function, similar to other research 2, 3, 19, only the pain (5 items) and physical function subscales (17 items) of the WOMAC were profiled. The WOMAC is considered one of the leading self-report measures of outcome in the arthroplasty population, and numerous studies have examined its reliability, validity, and responsiveness. McConnell et al [20] have provided an excellent summary of this work. In the current study, patients completed the full-length Likert scaled version of the WOMAC (LK 3.1). Each subscale is rated on a scale of 0 to 4 with a maximum score of 20 on the pain subscale and 68 on the physical function subscale with higher scores representing more pain and worse function. The total scores from each of the pain and physical function subscales were used in the analyses.
The 6MWT has been shown to be a valid and reliable measure of mobility in older adults 21, 22. It has been used to monitor decline and recovery in the arthroplasty population 19, 23, 24, 25, 26, and its responsiveness has been demonstrated in patients after TKA 19, 27.
To complete the 6MWT, patients were instructed to cover as much distance as possible during the 6-minute time frame, with opportunity to stop and rest if required. The test was conducted on a premeasured, 46-m uncarpeted, rectangular indoor circuit. The course was marked off in meters, and the distance traveled by each subject was measured to the nearest meter. Because encouragement has been shown to improve performance [28], standardized encouragement such as, “You are doing well, keep up the good work,” was provided at 60-second intervals.
The TUG, a less physically challenging measure, suited for the early postoperative period [29] has been used in a number of studies with arthroplasty patients 10, 30, 31, 32. The reliability and validity of the TUG in quantifying functional mobility have been established in frail elderly persons [33].
To complete the TUG, patients were required to rise from a standard arm chair, walk at a safe and comfortable pace to a tape mark 3-m away, then return to a sitting position in the chair [33]. The outcome for the TUG is the time required to perform the activity with time measured, using a stopwatch, to the nearest one hundredth of a second. For both the TUG and 6MWT, patients were permitted to use the regular walking aids used at the given stage of recovery.
Analysis
Descriptive statistics including the mean and standard deviation were calculated for each of the measures according to gender and site of arthroplasty. Independent t tests were performed to compare those subjects lost to follow-up with those who completed testing. Hierarchical linear modeling (HLM) was used to characterize the average pattern of recovery for each of the measures 34, 35, 36. In addition to estimating average change over time and the effects of selected predictors on change, HLM produces estimates of the degree of individual differences in the pattern of change. Hierarchical linear modeling does not require the same number of measurements for each patient, nor does it require the measurements to be taken at the same points in time.
To aid in the interpretation of the model, the data were centered at 1 week after surgery, because this corresponded to the time when many patients had their first assessment and represented their lowest point of function. The basic model of change in function over time, without considering clinical predictors, includes parameters that estimate the patients' self-reported or actual measured function at 1 week postsurgery and the patients' rate of change (slope) in function for every week thereafter. Recognizing that the rate of improvement would eventually slow the model also includes the square of time as a predictor to estimate the change in the growth rate for each week after 1 week. This type of quadratic model is a standard method of allowing for curvilinear change within a linear regression framework. In HLM analyses, individual differences in the recovery pattern are estimated as variances in the parameters of change.
After validation of the basic developmental model, the following were investigated as predictors of recovery: gender, site of arthroplasty (hip or knee), age, number of comorbidities, and baseline preoperative function. The number of comorbidities was recoded into a binary variable, less than 3 comorbidities or 3 or more comorbidities. Age and baseline preoperative function were modeled as continuous variables. In each case, the baseline preoperative scores of the outcome measure being modeled were used.
Predictors were explored individually: first, to evaluate their effects on overall average score; second, as interactions with time (growth parameters) to test their effects on the overall average growth rate. During this sequential model building, the decision to retain a predictor was based on its level of significance and the change in the likelihood-based statistics. At each stage, terms introduced earlier in the equation remained if they were significant. All of the analyses were conducted using the statistical software package SPSS 11.5 (SPSS Inc, Chicago, Ill).
Results
Nonparticipants (lost to follow-up) and participants were similar in terms of preoperative function, number of comorbidities, and body mass index, but nonparticipants were older. All participants completed baseline preoperative assessments and had at least one assessment during the 4 months postoperative period with 50.7%, 26.4%, and 5.6% assessed 2, 3, and 4 times, respectively.
As can be seen in Fig. 1, Fig. 2, Fig. 3, Fig. 4 , pain and disability declined and 6MWT increased fairly steadily between 1 and 9 to 12 weeks. Site of arthroplasty (Fig. 1) was a significant predictor of the estimated WOMAC pain score at 1 week after surgery. Fig. 2 illustrates the impact of preoperative scores by plotting each curve based on the preoperative WOMAC pain score for the 25th, 50th, and 75th percentile scores for the patients. Interactions of the predictors with time were tested but were not significant, indicating that these variables did not affect change over time. In terms of the WOMAC pain scores, there was significant variation between individuals in pain at 1 week postsurgery, but thereafter, the subsequent rate of change was similar among patients. Therefore, patterns of improvement of WOMAC pain were similar for patients with TKA and THA and for individuals with different preoperative pain levels.
Fig. 1.

Predicted growth curves for the WOMAC pain subscale averaged across other predictors.
Fig. 2.
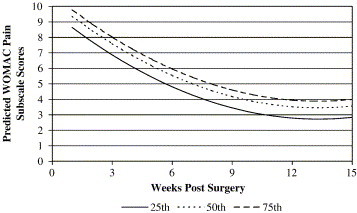
Predicted growth curves for the WOMAC pain subscale post-TKA illustrating the impact of preoperative WOMAC pain scores (percentiles).
Fig. 3.
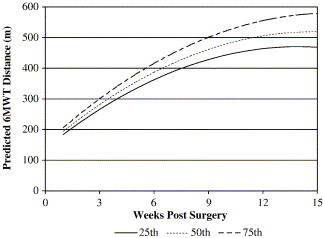
Predicted growth curves for men post-THA illustrating the impact of preoperative 6MWT scores (percentiles).
Fig. 4.
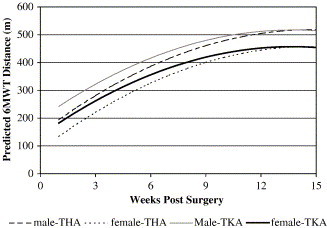
Predicted growth curves for the 6MWT illustrating the impact of gender post-THA and TKA.
A model with similar parameters provided the best fit for the WOMAC physical function subscale scores. The only difference was that site of arthroplasty was not a significant predictor. During model development, gender was a predictor of 1-week score until preoperative baseline score was added, at which time, it was no longer significant (P = .084). The interaction of the predictors with time was not significant, indicating that these clinical variables did not affect change over time.
Preoperative 6MWT score, gender, and site of arthroplasty were all significant predictors of 6MWT distances at 1 week after surgery (Fig. 3, Fig. 4). Fig. 3 shows that patients with higher preoperative 6MWT distance scores had higher function at 1 week postoperatively than patients with lower preoperative scores. A significant interaction was found with baseline preoperative 6MWT score and weeks after surgery, such that patients with higher preoperative scores are predicted to have a faster rate of improvement than those beginning with lower scores (ie, shorter distances). The interaction of the growth parameter with site of arthroplasty indicates that the instantaneous rate of change differs for patients after THA and TKA at 1 week after surgery, with individuals undergoing TKA showing a slower gain in distance over time (Fig. 4). Although women begin with lower 6MWT scores, their rate of improvement is similar to men.
Predictors for the TUG model included gender, site of arthroplasty, baseline TUG function, and an interaction between time and arthroplasty site. One week after surgery, women have worse TUG function than men, and patients post-THA are slower than those post-TKA. Similar to the 6MWT model, there was an interaction between time and site of arthroplasty, with patients after THA demonstrating a faster rate of recovery than patients post-TKA. As in the other models, the TUG model indicated that patients varied according to their initial score, 1 week after surgery, but the pattern of growth was the same among patients. Comorbidities and age were not predictive variables for any of the models.
Discussion
This study has examined early recovery of physical performance and self-report function, during the period of greatest change after THA and TKA. Using HLM techniques, different patterns of recovery and predictors of change were observed for the self-report and performance measures. In addition to producing typical recovery curves, differences between patients were explored and demonstrated that the only significant variation occurred in patients' starting points with respect to pain and function, 1 week after surgery. During 6MWT modeling, there was a significant random effect for weeks after surgery, indicating that individual variation did exist in the rate of recovery. However, this effect disappeared once baseline function was added. In this case, knowing where people started before surgery accounted for a substantial portion of the variance observed in the growth rates in the early postoperative period.
The predicted growth curves for the WOMAC pain subscale demonstrate that patients post-TKA have higher levels of pain than patients post-THA at 1 week postoperatively. Several studies have documented higher levels of pain in patients post-TKA compared with THA 37, 38, 39. The absence of an interaction between the growth parameters and site of arthroplasty indicates that the subsequent predicted rate of improvement is similar for patients with either THA or TKA. Although gender was initially a significant predictor during model development, it was no longer significant once baseline preoperative function was added. This was also the case during modeling of the WOMAC physical function scores. However, baseline function would, to some extent, have already accounted for gender because women demonstrated greater disability preoperatively than men 8, 10.
The model for the physical function subscale was the simplest of the 4 measures. In addition to the growth parameters and the intercept, baseline preoperative function was the only other model parameter influencing the estimated score at 1 week. Lingard et al [40] similarly found that preoperative WOMAC function score was the strongest determinant of the WOMAC function score at 1 and 2 years postoperatively.
The growth models for the performance measures were more complex. In terms of the 6MWT, both baseline score and site of arthroplasty impacted the rate of change. Both were also predictors of the distance walked at 1 week. Although patients undergoing THA are predicted to start postoperatively at a lower 6MWT distance than those undergoing TKA, their rate of recovery is faster. As depicted in the growth curves (Fig. 4), they catch up with the patients post-TKA at around 11 to 12 weeks. Their initial slower start is probably a reflection of their early postoperative restrictions, including positional restrictions to avoid dislocation; in this sample, almost 70% of the patients had weight-bearing restrictions. It is noteworthy that although women start with worse 6MWT distances, their rate of recovery is predicted to be similar to men. The impact of gender was the same for the TUG model with women having worse scores 1 week after surgery and thereafter, a similar rate of recovery as men.
Patients with better preoperative scores are predicted to improve their 6MWT distances faster. The importance of baseline preoperative function cannot be overlooked, as it was a significant predictor in both the self-report and performance measure models. These findings support the recent studies, which have found that worse preoperative functional status is associated with worse outcome 2, 3, 4, 5, 40 and have important implications concerning the preoperative management of arthroplasty candidates. It is likely that baseline function also accounts for the fact that age and number of comorbidities were not significant predictors; their influence would be captured in the preoperative scores.
By characterizing the typical recovery curves of commonly used measures in the assessment of patients postarthroplasty, this study has provided useful guidelines to researchers and clinicians interested in monitoring change. Comparison of measured scores to predicted scores at specific time points on the graphs can be used to monitor progress and guide treatment decisions. It is important to realize that the results should not be extrapolated beyond the time points used to generate the model. For example, values at zero weeks should not be interpreted as initial testing began approximately 1 week after surgery.
Researchers conducting longitudinal studies are often confronted with the problem of missing data across time points. This was also the case in this study. In the present study, it was expected that patients would have a minimum of 2 visits in approximately 4 months, although the scheduled times were not standardized across patients. As noted in the results, only 83% of the patients had 2 or more visits. The strength of HLM is its well-established methods for handling missing data and irregular measurement intervals 34, 41. Use of this technique does not require the number and timing of observations to be the same across all subjects. In the case of the arthroplasty patients who had data for only one time point, the mixed effects model would stabilize their estimates by anchoring them to the group average. Hierarchical linear modeling will give unbiased estimates of change curves if the reasons for lack of data are unrelated to the score patients would have obtained if they had been measured.
A consequence of the limited data points was its potential impact on the random effects of the growth curves. Having fewer data points restricts the complexity of the random effects possible. In all of the described models, the only significant random effect was the intercept, indicating that individuals varied in their starting point 1 week after surgery.
Another potential limitation of this study was the sample. The mean scores of the performance measures preoperatively (Table 1) indicated higher function than those reported in other studies 10, 19, 24, 42. One potential explanation was the age of our sample with 25% of the patients 58 years or younger. As noted in the Canadian Joint Replacement Registry, the numbers of THA and TKA in the 45 to 54 years age group have increased between 1994/1995 and 1999/2000 [43]. The older age of the subjects lost to follow-up may have been a consideration; however, they did not differ on their preoperative scores. In addition, individuals with higher disability may have chosen not to participate because of the performance measure requirement. The aforementioned factors could alter the estimation of the growth curves. Therefore, it is important to replicate the findings in new samples and different settings.
This study has contributed new knowledge about the early recovery patterns and predictors of change of the 6MWT, TUG, and the WOMAC pain and physical function subscales in arthroplasty patients. gender was a predictor in only the physical performance measure models. In these models, although women began with worse function 1 week after surgery, their rate of recovery was similar to men. Baseline preoperative score was a predictor of outcome in all of the models. Understanding the early postoperative physical disability of patients can be of assistance in determining resource allocation and discharge destination as lengths of stay continue to decrease. Surgeons' expectations of outcome need to take preoperative function into account. Similarly, the importance of preoperative function as a predictor of postoperative recovery has significant implications for the preoperative treatment and education of arthroplasty candidates.
Acknowledgments
We are grateful to each of the orthopedic surgeons at the Orthopaedic and Arthritic Institute, Ontario, Canada, for their support and provision of patients for this study. Special thanks is extended to Anne Marie Macleod, Chief Operating Officer of the Orthopaedic and Arthritic Institute of Sunnybrook and Women's College Health Sciences Centre, Ontario, Canada, and also to Stephanie Nicholson (BScPT), Charmaine Newland (MS, PT), and Research Assistant Neil Reid for their dedication to these projects.
A research grant from the Orthopaedic and Arthritic Foundation supported this research.
During the study, Deborah Kennedy was supported by a Studentship Award from the Provincial Rehabilitation Research Program, funded by the Ministry of Health and Long Term Care and the Toronto Rehabilitation Institute Foundation.
Footnotes
Benefits or funds were received in partial or total support of the research material described in this article from the Orthopaedic and Arthritic Foundation.
References
- 1.Jones C.A., Voaklander D.C., Suarez-Almazor M.E. Determinants of function after total knee arthroplasty. Phys Ther. 2003;83:696. [PubMed] [Google Scholar]
- 2.Fortin P.R. Outcomes of total hip and knee replacement: preoperative functional status predicts outcomes at six months after surgery. Arthritis Rheum. 1999;42:1722. doi: 10.1002/1529-0131(199908)42:8<1722::AID-ANR22>3.0.CO;2-R. [DOI] [PubMed] [Google Scholar]
- 3.Fortin P.R. Timing of total joint replacement affects clinical outcomes among patients with osteoarthritis of the hip or knee. Arthritis Rheum. 2002;46:3327. doi: 10.1002/art.10631. [DOI] [PubMed] [Google Scholar]
- 4.Kennedy L.G. When should we do knee replacements? Knee. 2003;10:161. doi: 10.1016/s0968-0160(02)00138-2. [DOI] [PubMed] [Google Scholar]
- 5.Holtzman J., Saleh K., Kane R. Effect of baseline functional status and pain on outcomes of total hip arthroplasty. J Bone Joint Surg Am. 2002;84-A:1942. doi: 10.2106/00004623-200211000-00006. [DOI] [PubMed] [Google Scholar]
- 6.Karlson E.W. Gender differences in patient preferences may underlie differential utilization of elective surgery. Am J Med. 1997;102:524. doi: 10.1016/s0002-9343(97)00050-8. [DOI] [PubMed] [Google Scholar]
- 7.Holtzman J., Saleh K., Kane R. Gender differences in functional status and pain in a Medicare population undergoing elective total hip arthroplasty. Med Care. 2002;40:461. doi: 10.1097/00005650-200206000-00003. [DOI] [PubMed] [Google Scholar]
- 8.Hawker G.A. Differences between men and women in the rate of use of hip and knee arthroplasty. N Engl J Med. 2000;342:1016. doi: 10.1056/NEJM200004063421405. [DOI] [PubMed] [Google Scholar]
- 9.Katz J.N. Differences between men and women undergoing major orthopedic surgery for degenerative arthritis. Arthritis Rheum. 1994;37:687. doi: 10.1002/art.1780370512. [DOI] [PubMed] [Google Scholar]
- 10.Kennedy D. Comparison of gender and group differences in self-report and physical performance measures in total hip and knee arthroplasty candidates. J Arthroplasty. 2002;17:70. doi: 10.1054/arth.2002.29324. [DOI] [PubMed] [Google Scholar]
- 11.Weaver F. Preoperative risks and outcomes of hip and knee arthroplasty in the Veterans Health Administration. J Arthroplasty. 2003;18:693. doi: 10.1016/s0883-5403(03)00259-6. [DOI] [PubMed] [Google Scholar]
- 12.Kreder H.J. Provider volume and other predictors of outcome after total knee arthroplasty: a population study in Ontario. Can J Surg. 2003;46:15. [PMC free article] [PubMed] [Google Scholar]
- 13.Forrest G. Factors affecting length of stay and need for rehabilitation after total hip and knee arthroplasty. J Arthroplasty. 1998;13:186. doi: 10.1016/s0883-5403(98)90097-3. [DOI] [PubMed] [Google Scholar]
- 14.Nilsdotter A.K., Lohmander L.S. Age and waiting time as predictors of outcome after total hip replacement for osteoarthritis. Rheumatology (Oxford) 2002;41:1261. doi: 10.1093/rheumatology/41.11.1261. [DOI] [PubMed] [Google Scholar]
- 15.Wasielewski R.C. Patient comorbidity: relationship to outcomes of total knee arthroplasty. Clin Orthop. 1998;356:85. [PubMed] [Google Scholar]
- 16.Jones C.A. The effect of age on pain, function, and quality of life after total hip and knee arthroplasty. Arch Intern Med. 2001;161:454. doi: 10.1001/archinte.161.3.454. [DOI] [PubMed] [Google Scholar]
- 17.Hawker G. Health-related quality of life after knee replacement. J Bone Joint Surg Am. 1998;80-A:163. doi: 10.2106/00004623-199802000-00003. [DOI] [PubMed] [Google Scholar]
- 18.Imamura K., Black N. Does comorbidity affect the outcome of surgery? Total hip replacement in the UK and Japan. Int J Qual Health Care. 1998;10:113. doi: 10.1093/intqhc/10.2.113. [DOI] [PubMed] [Google Scholar]
- 19.Parent E., Moffet H. Comparative responsiveness of locomotor tests and questionnaires used to follow early recovery after total knee arthroplasty. Arch Phys Med Rehabil. 2002;83:70. doi: 10.1053/apmr.2002.27337. [DOI] [PubMed] [Google Scholar]
- 20.McConnell S., Kolopack P., Davis A.M. The Western Ontario and McMaster Universities Osteoarthritis Index (WOMAC): a review of its utility and measurement properties. Arthritis Care Res. 2001;45:453. doi: 10.1002/1529-0131(200110)45:5<453::aid-art365>3.0.co;2-w. [DOI] [PubMed] [Google Scholar]
- 21.Harada N.D., Chiu V., Stewart A.L. Mobility-related function in older adults: assessment with a 6-minute walk test. Arch Phys Med Rehabil. 1999;80:837. doi: 10.1016/s0003-9993(99)90236-8. [DOI] [PubMed] [Google Scholar]
- 22.Bean J.F. The 6-minute walk test in mobility-limited elders: what is being measured? J Gerontol A Biol Sci Med Sci. 2002;57:M751. doi: 10.1093/gerona/57.11.m751. [DOI] [PubMed] [Google Scholar]
- 23.Laupacis A. Comparison of total hip arthroplasty performed with and without cement: a randomized trial. J Bone Joint Surg Am. 2002;84-A:1823. doi: 10.2106/00004623-200210000-00013. [DOI] [PubMed] [Google Scholar]
- 24.Mahon J.L. Health-related quality of life and mobility of patients awaiting elective total hip arthroplasty: a prospective study. Can Med Assoc J. 2002;167:1115. [PMC free article] [PubMed] [Google Scholar]
- 25.Boardman D.L. The accuracy of assessing total hip arthroplasty outcomes: a prospective correlation study of walking ability and 2 validated measurement devices. J Arthroplasty. 2000;15:200. doi: 10.1016/s0883-5403(00)90242-0. [DOI] [PubMed] [Google Scholar]
- 26.Shields R.K. Reliability, validity, and responsiveness of functional tests in patients with total joint replacement. Phys Ther. 1995;75:169. doi: 10.1093/ptj/75.3.169. [DOI] [PubMed] [Google Scholar]
- 27.Kreibich D.N. What is the best way of assessing outcome after total knee replacement? Clin Orthop. 1996:221. doi: 10.1097/00003086-199610000-00031. [DOI] [PubMed] [Google Scholar]
- 28.Guyatt G.H. Effect of encouragement on walking test performance. Thorax. 1984;39:818. doi: 10.1136/thx.39.11.818. [DOI] [PMC free article] [PubMed] [Google Scholar]
- 29.Stratford P.W. Validation of the LEFS on patients with total joint arthroplasty. Physiother Can. 2000;52:97. [Google Scholar]
- 30.Ouellet D., Moffet H. Locomotor deficits before and two months after knee arthroplasty. Arthritis Rheum. 2002;47:484. doi: 10.1002/art.10652. [DOI] [PubMed] [Google Scholar]
- 31.Freter S.H., Fruchter N. Relationship between timed ‘up and go’ and gait time in an elderly orthopaedic rehabilitation population. Clin Rehabil. 2000;14:96. doi: 10.1191/026921500675545616. [DOI] [PubMed] [Google Scholar]
- 32.Walsh M. Perioperative functional performance of women and men following total knee arthroplasty. Physiother Can. 2001;53:92. [Google Scholar]
- 33.Podsiadlo D., Richardson S. The timed “Up and Go”: a test of basic functional mobility for frail elderly persons. J Am Geriatr Soc. 1991;39:142. doi: 10.1111/j.1532-5415.1991.tb01616.x. [DOI] [PubMed] [Google Scholar]
- 34.Byrk A.S., Raudenbush S.W. Sage; Newbury Park: 1992. Hierarchical linear models: applications and data analysis methods. [Google Scholar]
- 35.Raudenbush S.W. Comparing personal trajectories and drawing causal inferences from longitudinal data. Annu Rev Psychol. 2001;52:501. doi: 10.1146/annurev.psych.52.1.501. [DOI] [PubMed] [Google Scholar]
- 36.Snijders T.A.B., Bosker R.J. Sage; London: 2002. Multilevel analysis: an introduction to basic and advanced multilevel modeling. [Google Scholar]
- 37.Aarons H. Short-term recovery from hip and knee arthroplasty. J Bone Joint Surg Br. 1996;78-B:555. [PubMed] [Google Scholar]
- 38.Jones C.A. Health related quality of life outcomes after total hip and knee arthroplasties in a community based population. J Rheumatol. 2000;27:1745. [PubMed] [Google Scholar]
- 39.Salmon P. Recovery from hip and knee arthroplasty: patients' perspective on pain, function, quality of life, and well-being up to 6 months postoperatively. Arch Phys Med Rehabil. 2001;82:360. doi: 10.1053/apmr.2001.21522. [DOI] [PubMed] [Google Scholar]
- 40.Lingard E.A. Predicting the outcome of total knee arthroplasty. J Bone Joint Surg Am. 2004;86-A:2179. doi: 10.2106/00004623-200410000-00008. [DOI] [PubMed] [Google Scholar]
- 41.Bryk A.S., Raudenbush S.W. Application of hierarchical linear models to assessing change. Psychol Bull. 1987;101:147. [Google Scholar]
- 42.Laupacis A. The effect of elective total hip replacement on health-related quality of life. J Bone Joint Surg Am. 1993;75:1619. doi: 10.2106/00004623-199311000-00006. [DOI] [PubMed] [Google Scholar]
- 43.Canadian Joint Replacement Registry (CJRR) Canadian Institute for Health Information; Ottawa: 2002. 2002 Report total hip and total knee replacements in Canada. [Google Scholar]