

Abstract
The evolutionary responses of infectious pathogens often have ruinous consequences for the control of disease spread in the population. Drug resistance is a well-documented instance that is generally driven by the selective pressure of drugs on both the replication of the pathogen within hosts and its transmission between hosts. Management of drug resistance therefore requires the development of treatment strategies that can impede the emergence and spread of resistance in the population. This study evaluates various treatment strategies for influenza infection as a case study by comparing the long-term epidemiological outcomes predicted by deterministic and stochastic versions of a homogeneously mixing (mean-field) model and those predicted by a heterogeneous model that incorporates spatial pair-wise correlation. We discuss the importance of three major parameters in our evaluation: the basic reproduction number, the population level of treatment, and the degree of clustering as a key parameter determining the structure of heterogeneous interactions. The results show that, as a common feature in all models, high treatment levels during the early stages of disease outset can result in large resistant outbreaks, with the possibility of a second wave of infection appearing in the pair-approximation model. Our simulations demonstrate that, if the basic reproduction number exceeds a threshold value, the population-wide spread of the resistant pathogen emerges more rapidly in the pair-approximation model with significantly lower treatment levels than in the homogeneous models. We tested an antiviral strategy that delays the onset of aggressive treatment for a certain amount of time after the onset of the outbreak. The findings indicate that the overall disease incidence is reduced as the degree of clustering increases, and a longer delay should be considered for implementing the large-scale treatment.
Keywords: Drug resistance, Treatment strategies, Epidemic models, Pair-approximation, Monte Carlo simulations
1. Introduction
At the beginning of the 21st century, the emergence and spread of drug resistant pathogens presents a growing problem worldwide. The evolution of resistance is primarily affected by factors that govern pathogen–host interactions, with regard to both survival (such as the ability to replicate) and extinction (such as treatment regimens). These, combined with the ensuing processes of between-host pathogen transmission, call for a better understanding of mechanisms by which pathogens overcome the pressures that are applied to limit their replication and spread (Domingo and Holland, 1997). Management of drug-resistance at both the individual and population levels has therefore become a crucial component of interventions directed against persistent pathogens (e.g., HIV, tuberculosis, influenza) and preparedness strategies for emerging infectious diseases (e.g., influenza pandemic) (Blower and Chou, 2004, Blower et al., 2003, Blower et al., 2004, Bright et al., 2005, de Jong et al., 2005, Kiso et al., 2004, Moscona, 2005).
Since resistance is both a cause and a consequence of drug use, integrated efforts are required to prioritize and develop effective treatment strategies that address the influence of immunological/epidemiological characteristics of the individuals/population on the emergence of resistance. Mathematical models have proven to be essential tools for evaluating the impact of these competing strategies, by incorporating critical parameters that describe the dynamics of pathogen evolution and transmission (Dieckmann et al., 2002, Keeling and Rohani, 2008). For instance, models describing the within-host infectious dynamics have provided new insights into the treatment regimens for acute self-limiting infections, and suggested that drug-resistance is unlikely to develop if treatment is initiated after the time at which the immune responses reach a certain threshold (Lloyd and Wodarz, 2006, Wodarz, 2001, Wodarz and Lloyd, 2004). Recent studies have capitalized on such findings to design strategies for the prudent use of drugs at the population level, in order to reduce the pressure to select resistant pathogens (Alexander et al., 2007, Moghadas, 2008, Moghadas et al., 2008). The results obtained from these studies for influenza infection as a case study show that, in the absence of pre-existing pathogen-specific immunity in the population, resistance is less likely to emerge if the large-scale treatment is delayed for a certain amount of time after the introduction of the pathogen. The principal mechanism underlying this treatment strategy is to sufficiently deplete the pool of susceptible hosts through initial prevalence of the drug-sensitive pathogen, which will in turn avert population-wide spread of resistance should selection occur when intensive treatment is implemented (Moghadas, 2008).
In this study, we further investigate the merits of this adaptive treatment strategy in order to identify key parameters that affect its long-term epidemiological outcomes. To this end, the findings of a homogeneously mixing (mean-field) population dynamical model (Moghadas, 2008) is compared with its stochastic version. We extend this comparison to a more realistic situation, by considering heterogeneity of the population and incorporating local spatial correlations. In general, an individual (site) can potentially transmit infection to a small number of individuals through local contacts with neighbours. The set of these local interactions define a contact network, and disease spreads along the edges of this network. Such network models have been shown to offer a better approximation to the behaviour of large-scale epidemics than homogeneous models (Newman, 2002, Newman, 2005). Here, we consider the simplest case, the so-called pair-approximation, in which the dynamics of only pair-wise interactions of neighbouring individuals is taken into account. Specifically, the pair-approximation assumes that the correlation between states of two neighbouring sites is independent of the state of any other randomly selected neighbour of the focal pair (Rand, 1999). Taking correlations into account could significantly impact the spatial dynamics of an epidemic, particularly when pathogen strains with different characteristics/transmissibility compete for a single host population. In the following, we describe the assumptions that are embedded in the core of these models, and formulate their equations. To provide a comparative evaluation of treatment strategies, we simulate these models for influenza infection using parameter estimates extracted from recent modelling and clinical studies. Finally, we present the results and discuss the significance of our findings in the context of disease epidemiology and public health.
2. Development of the models
To formulate the models for disease transmission, we assume that the population is initially entirely susceptible to the invading pathogen that is sensitive to the drugs, but can subsequently develop resistance. Susceptible individuals may become infected through contacts with sensitive or resistant infections. Individuals infected with the sensitive pathogen may receive treatment and develop drug resistance during the course of treatment. Since the evolution of resistance is generally associated with fitness cost (Domingo and Holland, 1997), we assume that the resistant pathogen is less transmissible than the sensitive pathogen. It is assumed that treatment reduces the infectiousness level of the sensitive infection (and therefore its transmissibility), but remains ineffective against resistant infection. For outbreaks with short duration, we ignore rates of birth and natural death, but consider disease-induced mortality. We also assume that recovered individuals acquire immunity that confers full protection against all pathogen strains.
2.1. Mean-field model
Assuming homogeneous mixing, we divided the population into classes of susceptible , infected with the sensitive pathogen who are untreated and treated , infected with the resistant pathogen , recovered , and dead individuals. Fig. 1 shows the movements of individuals between these classes during the course of infection. Since treatment is ineffective against the resistant pathogen, we combined classes of untreated and treated resistant infection into a single population compartment . Taking into account the above assumptions, the model can be expressed as the following system of deterministic equations:
| (1) |
| (2) |
| (3) |
| (4) |
| (5) |
| (6) |
where the prime ‘’ denotes the derivative of the compartments with respect to time; is the baseline transmission rate of the sensitive pathogen; represents the reduction in transmission of the sensitive pathogen from treated infected individuals; is the relative transmissibility of the resistant pathogen; and are disease-induced death rates of sensitive and resistant pathogens, respectively; is the disease-induced death rate of treated infected individuals; and represent recovery rates of untreated and treated infected individuals, respectively; is the rate at which treated individuals develop drug-resistance; and is the fraction of infected individuals which receives treatment, referred to as the treatment level. Further details of the model structure can be found in Moghadas (2008).
Fig. 1.
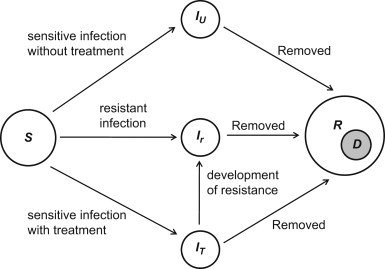
Model diagram for the movements of individuals between population compartments.
2.2. Stochastic model
Again assuming homogeneity, we develop an alternative stochastic model for the dynamics of pathogen transmission in the context of drug-resistance, using the same classes of individuals as described for the mean-field model. Considering time as a continuous variable, we define the following random vector for :
and . Thus, the transition probability associated with the movements of individuals between the model compartments during the time interval is defined as
| (7) |
where
The function describes the change in the status of an individual in the population by moving from one class to another during the time interval . It is assumed that is sufficiently small to allow for the occurrence of at most one change in every state of the model. Thus, the corresponding continuous time Markov chain model is fully described through possible transition rates given in Table 1 . Based on transition probabilities, the Itô stochastic differential equation (SDE) model can be formulated as
| (8) |
where is the drift vector, is the diffusion matrix, and is a vector of independent Wiener processes (Allen, 2003). The stochastic differential model can be explicitly expressed by defining , where, for example,
Hence, is determined by the right hand side of the equations in the corresponding mean-field model. The term in (8) is given by the square root of the covariance matrix , where
Table 1.
Possible transitions between compartments of the stochastic model that can occur in unit of time.
| Event | Transition during | Transition rate |
|---|---|---|
| Infection of a susceptible | ||
| Increase of untreated infection | ||
| Increase of treated infection | ||
| Development of drug resistance | ||
| Increase of resistant infection | ||
| Recovery from untreated infection | ||
| Recovery from treated infection | ||
| Recovery from resistant infection | ||
| Increase in immune population | ||
| Death from untreated infection | ||
| Death from treated infection | ||
| Death from resistant infection | ||
| Increase in death |
2.3. Pair-approximation model
The homogeneous mixing approach, in either its deterministic or stochastic formulation considered above, assumes that populations are uniformly spread through space and that individuals mix rapidly. More realistically, disease propagation occurs through localized, discrete interactions between susceptible and infected individuals, and therefore it is imperative to determine the effects of including spatial effects. A previous study of species interactions (Durrett and Levin, 1994), represented by various models excluding mean-field and including spatial structure and stochastic effects, exhibited qualitatively different behaviours. More recently, stochastic, individual-based SIR models (Schütz et al., 2008) and other types of disease mechanism have shown the existence of stable spatial structures and other qualitative differences with the mean-field model. It is therefore essential to compare the results derived from the models considered above, with those that incorporate spatial structure. Inevitably, the latter possess parameters (e.g., the number of nearest neighbours and the degree of clustering in the population) that have no counterparts in the mean-field model, and it will be necessary to examine their behaviour over some realistic ranges of these parameters.
While agent-based models can fully capture spatial effects through the dynamics of individual interactions, there are various methods that include some aspects of these effects and the simplest and most tractable way is to consider pair-wise correlations between neighbouring individuals (Keeling, 1999, Morris, 1997, Rand, 1999). The resulting system is comprised of a coupled infinite hierarchy of pair-, triplet-, and higher-order correlations; and therefore some form of moment closure assumption is required. The lowest-order closure (no correlations) yields the mean-field model. The next order, which is considered below, includes pair-wise interactions exactly and employs a closure assumption for representing triplets in terms of singlets and pairs. The population is represented by nodes of a contact network, and contacts between individuals by edges between nodes. Let represent the states of individual nodes, and the number of individuals in state , the number of pairs, and the number of triplets, using the convention that counts both and pairs (also, note that but , etc.). Therefore, all correlations of order three or higher are effectively treated as random noise (Rand, 1999). It is worth mentioning that despite its simplicity, the pair-approximation appears to provide good quantitative agreement with stochastic simulation modelling of disease spread across a network (Keeling, 1999).
Let be the fraction of all triplets that also form triangles (Keeling, 1999, Morris, 1997), and consider the triplet : if this forms an open triangle (no edge between and ) there is no correlation between and , whereas for a closed triangle correlation exists. For the entire population of nodes, each node having neighbours, the correlation between nodes of type and is defined as (Keeling, 1999)
| (9) |
Thus, when , and are uncorrelated and randomly located with respect to each other. To formulate closure in the pair-approximation model, we use the pair-closure assumption (Morris, 1997, van Baalen, 2000)
| (10) |
Local interactions describing the pair dynamics in our model can be obtained in a similar way to the stochastic formulation above, as was also done in the standard 3-state model (Keeling, 1999). In the present model, the transmission rate per infected-susceptible pair is given by , where is the initial size of the susceptible population. Also, both recovery and (disease-induced) death remove individuals from further interactions in the system, and for purposes of simplifying the dynamics can be merged into ‘absorbing states’ and for recovery or death from sensitive and resistant pathogens, respectively. This reduces the model to a 6-state system: , , , , , whose pair-dynamics are described by equations (see Appendix A). The corresponding singlet dynamics (number of individuals in each state at a given time) follow from the general relationship (Keeling, 1999):
| (11) |
which allows for a direct comparison with the mean-field and stochastic models. Note that since the total population , one of the 21 equations is redundant; however, it is retained in order to track numerical accuracy of the simulations (see Appendix A).
3. Reproduction numbers
One of the most important parameters in disease transmission models is the basic reproduction number, defined as the number of new infections generated by a single infected individual introduced into an entirely susceptible population (Diekmann and Heesterbeek, 2000). This threshold quantity, which characterizes whether or not an invasion is successful, is the product of three important parameters: the number of contacts with susceptible hosts per unit time; the probability of pathogen transmission; and the generation time. A related quantity is the control reproduction number that can be used to evaluate the potential impact of public health intervention strategies on containment of disease spread.
For evaluating and comparing the outcome of an adaptive treatment strategy in models developed above, we first compute the control reproduction number when treatment is put in place. Since sensitive and resistant pathogens may have different transmissibility, we need to consider the introduction of each one into the population in the absence of the competing pathogen. In the mean-field model, assuming that an individual infected with the sensitive pathogen is introduced into the population of size such that , and , the number of new infections generated during treatment is . Without treatment, the number of secondary cases is given by , and therefore the total number of infections with the sensitive pathogen is
| (12) |
A sensitive infection can develop drug-resistance during treatment with probability , and thereby generate a number of new resistant cases given by
| (13) |
Assuming that an individual infected with the resistant pathogen introduced into the population such that , , and considering that treatment is ineffective, the total number of secondary cases with the resistant pathogen is given by . Using the next generation matrix (Diekmann and Heesterbeek, 2000), the control reproduction number is given by . In the absence of treatment , reduces to as the basic reproduction number of the sensitive pathogen. It is generally expected that if the basic reproduction number is less than one, then the pathogen will be unsuccessful in invading the population and causing an outbreak. This motivates the implementation of public health measures (such as treatment) for reducing the transmissibility of a pathogen, should it invade with a reproduction number greater than one.
Since the mean-field and stochastic models are concerned with the dynamics of individuals on a global scale, the method of next generation matrix can also be employed for the stochastic model, which leads to the same reproduction number as obtained above. However, the pair-approximation model describes the dynamics of pairs of individuals at a local scale, and the first generation of infection occurs when an infected individual transmits infection to neighbouring individuals. Assuming in the pair model that each individual has neighbours, and introducing one infected into a purely susceptible population, each of its neighbours has a finite probability of infection in one generation. Since infected-neighbour pairs are state-independent, the expression for in the absence of treatment is given by . A generalization of a previously established technique for computing the control reproduction number in SIR models (Keeling, 1999) is presented in Appendix B when correlations are taken into account.
4. Simulations and results
For the purpose of simulations, we consider influenza infection for which drug resistance is a well-documented evolutionary consequence of antiviral agents used for treatment of clinical disease. Here, we investigate a scenario in which drug resistant mutants are initially absent, and resistance may emerge during the course of an outbreak as a result of treatment. To simulate the models formulated above, estimated parameters are taken from the published literature for influenza, with the values of in the range 1–3 (see Table 2 ).
Table 2.
Description of model parameters with their baseline values for influenza infection obtained from the published literature (Ferguson et al., 2005, Handel et al., 2006, Longini et al., 2005, Regoes and Bonhoeffer, 2006).
| Parameter | Description | Baseline value (range) | Unit |
|---|---|---|---|
| Transmission rate of the sensitive strain | Variable | ||
| Treatment level of infected individuals | Variable (0-1) | – | |
| Relative transmissibility of treated sensitive infection | 0.4 | – | |
| Relative transmissibility of the resistance strain | 0.8 (0-1) | – | |
| Rate of developing resistance during treatment | |||
| Recovery rate of untreated infection | 1/4.1 | ||
| Recovery rate of treated infection | 1/4.1 | ||
| Disease-induced death rate of untreated sensitive infection | 0.002 | ||
| Disease-induced death rate of treated sensitive infection | 0.0002 | ||
| Disease-induced death rate of resistant infection | |||
| Basic reproduction number | Variable (1–3) | – |
For a particular value of , the transmission rate of the sensitive strain can be obtained using the expression .
We consider a susceptible population of size , and assume fixed values of and . We also assume that the resistant strain is initially absent , but emerges with a relative transmissibility during the outbreak. Furthermore, we seed the population with infections such that each infected individual makes initial contact with only susceptible neighbours. This would be the case, for example, if infected individuals were initially uniformly distributed through the population. Figs. 2 a–c show the final size of the outbreak (the total number of infections caused by both strains at the end of the epidemic including recovered and dead individuals) in each model as a function of treatment level , for different values of . Since treatment reduces the transmission of the sensitive strain, a substantial reduction in morbidity (and therefore mortality) of the population is achieved when treatment is maintained at low to moderate levels. However, high treatment levels exert significant selective pressure that allows the resistant strain to gain enough competitive advantage to establish a self-sustaining resistant outbreak, thereby increasing the total number of infections. These simulations indicate that there is an optimal treatment level associated with each value of that minimizes the final size of the outbreak. While these models produce qualitatively similar results, the emergence of resistance in the pair-approximation model (Fig. 2c) requires a higher reproduction number with a significantly lower optimal treatment level compared to the homogeneous models (Figs. 2a and b). As is evidence, treatment levels above approximately 40% leads to the wide-spread resistance for , 1.8, 2.2 (solid, dashed, dotted curves in Figs. 2a and b, respectively) in both mean-field and stochastic models, whereas the spread of disease is largely controlled in the pair-approximation model with very few resistant infected cases.
Fig. 2.
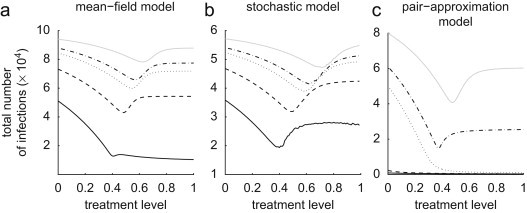
Total number of infections (final size of the outbreak) caused by both sensitive and resistant strains as a function of the treatment level , for different reproduction numbers of the sensitive strain. (: black solid line, 1.4; black dashed line, 1.8; black dotted line, 2.2; black dot–dashed line, 2.4; grey solid line, 3). Transmission rate is computed for each value of , and baseline values of other parameters are given in Table 2.
To illustrate the time course of the outbreak when treatment is maintained at a constant level, we assume , corresponding to the dot–dashed curves in Fig. 2. For a low treatment level (30%), the sensitive strain spreads quickly (with slower rate in the pair-approximation model) and depletes the susceptible population (Figs. 3 a–c, solid curves), and therefore a limited number of resistant cases is generated (Figs. 3a–c, dashed curves). Increasing treatment in each model to the optimal level associated with leads to the further reduction in the spread of the sensitive strain, but the generation of more resistant infections. In this case, while emergent resistant strains cause a small outbreak (Figs. 3d–f, dashed curves), the total number of infections is minimal. Further increase in the treatment level to 80% enhances the spread of drug-resistance by shifting the competitive balance in favor of the resistant strain. As shown in Figs. 3g and h (dashed curves), a single wave of outbreak (virtually identical to the total number of infections) is largely caused by the spread of resistance in both mean-field and stochastic models. However, in the pair-approximation model, we observe two distinct infection curves: the earlier (smaller) outbreak is caused by the sensitive strain (which can account for the establishment of the disease in the population, the so-called seeding phase of the pathogen), and the subsequent (larger) outbreak is driven by the resistant strain (Fig. 3i, solid and dashed curves). This phenomenon can also be observed for a wide range of treatment levels above the optimal level (37%), with the possibility of distinct large outbreaks of both sensitive and resistant infections. As illustrated in Fig. 4 a for a 37.4% treatment level with a smaller number of initial infections , the first wave of infections unfolds with a magnitude comparable to that of the second outbreak triggered by the emergence of highly transmissible resistance. Increasing treatment to higher levels leads to a more rapid emergence of resistance (with less prevalence of the sensitive strain), and an earlier occurrence of the subsequent resistant outbreak with a larger magnitude (Fig. 3i). The magnitude and the peak time for these outbreaks depend not only on the treatment level, but also on other parameters involved in the spread of pathogen strains, such as the fitness of resistance. This is shown in Fig. 4b for slightly lower fitness of resistance and a 39% treatment level with , demonstrating a lower magnitude of outbreaks with further delay in the spread of resistance. Our simulations also indicate that when treatment is maintained at low levels or sufficiently close to the optimal level, the final size of infections in each outbreak has very marginal dependence on the initial number of infections (Figs. 5 a–c). This suggests that the epidemic has spread well beyond the establishment phase (Figs. 4a and b).
Fig. 3.
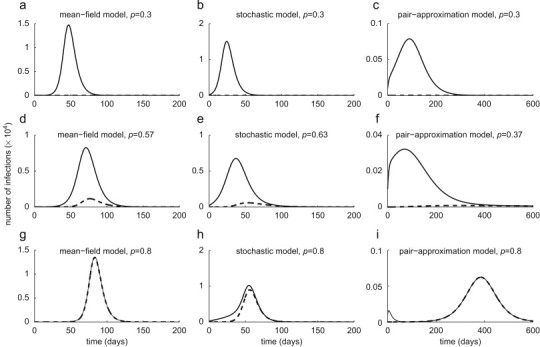
Time-courses of total infections (solid curves) and resistant infections (dashed curves), with . Optimal treatment levels (corresponding to dot–dashed curves in Fig. 2) are: 57% in mean-field model, 63% in stochastic model, and 37% in pair-approximation model.
Fig. 4.
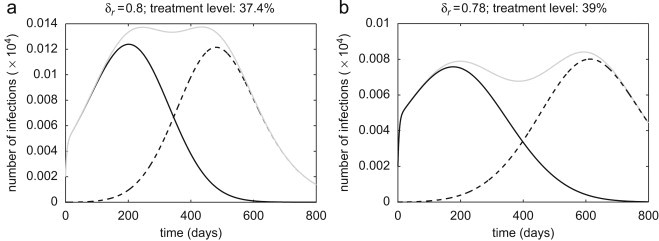
Time-courses of sensitive infections (solid curves), resistant infections (dashed curve), and total infections (grey curves) in the pair-approximation model for , with (a) , 37.4% treatment level; and (b) , 39% treatment level. Initial number of infections is taken to be .
Fig. 5.
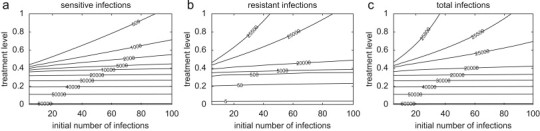
Contour plots for the total number of: (a) sensitive infections; (b) resistant infections; and (c) infections caused by both strains, as a function of the initial number of infections and the treatment level. Parameter values are the same as those used in Fig. 2 with .
To prevent the spread of resistance in the population, previous studies suggest an alternative strategy that delays the onset of large-scale treatment for a certain amount of time after the introduction of the drug-sensitive pathogen (Moghadas, 2008, Moghadas et al., 2008). Here, we investigate this strategy by allowing the treatment level to change during the outbreak, and compare the outcome with the scenario in which treatment is kept constant at the optimal level for each model. With an initial 20% treatment level, we compute the total number of infections when, after a delay, treatment changes to a higher level during the outbreak. Figs. 6 a–c show the ratio , where represent the total number of infections with a constant treatment at the optimal level (57% in mean-field model; 63% in stochastic model; 37% in pair-approximation model). These comparative simulations reveal a higher final size of infection if intensive treatment is administered too early (thus promoting resistance) or too late (allowing the sensitive strain to propagate widely). In contrast, the prevalence of resistance can be prevented, and in addition a significant reduction in the size of outbreak achieved, if a timely increase in the level of treatment is managed. While this outcome is common to all models, the optimal timing and increase in the level of treatment depend greatly on the type of model, with a larger morbidity-reduction being achieved in mean-field and stochastic models than in the pair-approximation model. This is due to the fact that in homogeneously mixing models, the sensitive strain spreads more readily than the resistant strain due to higher transmissibility and more frequent interactions between individuals. By contrast, large-scale resistance spreads more rapidly in the pair-approximation model with even lower treatment levels, where heterogeneity in population interactions lessens the superiority in the fitness-advantage of the drug-sensitive strain, resulting in its less extensive propagation than in a homogeneous structure.
Fig. 6.
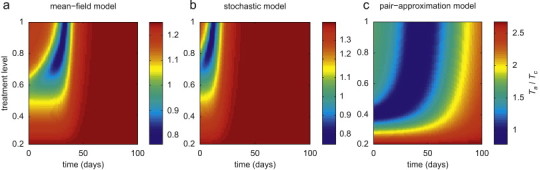
The effect of changing treatment level during the outbreak on the total number of infections caused by both sensitive and resistant strains, with . Other parameter values are given in Table 2. Simulations were run with an initial treatment level of 20% and then changed to the level shown on the vertical axis at the time displayed on the horizontal axis (corresponding to the time-course of the outbreak). The colour bars illustrate the ratio of the total number of infections caused by both strains in adaptive treatment strategy to that generated when treatment is maintained constant at the optimal level associated with in each model . (For interpretation of the references to colour in this figure legend, the reader is referred to the web version of this article.)
To further explore the effect of contact structure in the pair-approximation model on the emergence of drug-resistance, the model was simulated for the final size of outbreak as a function of , when the initial 20% treatment level is raised to 80% during the outbreak. Assuming , Fig. 7 a shows that for low values of (approximately ), there is an optimal timing ( days after the start of outbreak) at which increasing the treatment level minimizes the total number of infections. Fig. 7c shows that the early onset of intensive treatment leads to a large outbreak by promoting the spread of resistance. As increases, the existence of an optimal timing can be observed for a wider range of (approximately ), as illustrated in Fig. 7b for . This clearly indicates that, in addition to the transmissibility of the pathogen and the treatment level, network structure of the population can play a major role in determining the complex dynamics of competition between sensitive and resistant strains.
Fig. 7.
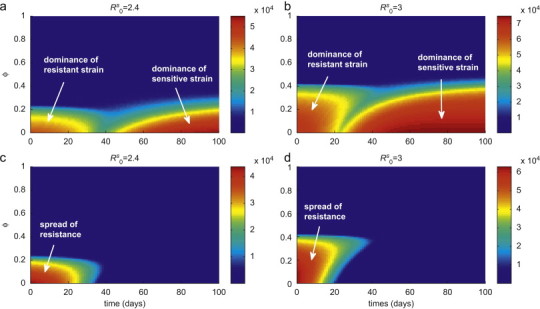
The combined effect of clustering degree and changing treatment level during the outbreak, on the total number of infections caused by both sensitive and resistant strains. Simulations were run with an initial treatment level of 20% and then changed to 80% at the time displayed on the horizontal axis (corresponding to the time-course of the outbreak). Other parameter values are given in Table 2. The colour bars in (a) and (b) illustrate the total number of infections with and 3, respectively. The corresponding total numbers of resistant infections are shown by colour bars in (c) and (d). (For interpretation of the references to colour in this figure legend, the reader is referred to the web version of this article.)
5. Discussion
This paper compares three models for the propagation of drug-resistant infection that initially arises from the treatment of a drug-sensitive pathogen strain. A number of strategies for drug treatment were considered and compared between the models. The first two models assume homogeneous mixing of the population, and ignore spatial effects such as correlations between neighbouring individuals; thus they implement a mean-field approach. These homogeneous models are either deterministic or stochastic, the latter incorporating fluctuations in the onset and transmission of disease in individuals which may be important for the occurrence of an outbreak with a small number of initial infections (see Appendix C). The third model implements a pair-correlation approximation, representing the simplest way to include spatial effects, in which higher-order correlations are treated as ‘stochastic noise’. In order to provide closure for the pair-approximation equations, a triplet approximation was used that includes a parameter for specifying the fraction of triplets that also form triangles, thereby providing a simple description of social structure within the population. When is large, clustering is high and most (but not all) interactions occur within local groups. However, for small , clustering is low and interactions are more uniformly spread.
A number of key findings have emerged from this comparative study. Foremost is the result that, when the reproduction number exceeds a threshold value, the emergence of resistance occurs more quickly with lower treatment levels in heterogeneous populations (in which local social interactions comprise the majority of contacts) than in homogeneous populations (in which all contacts between individuals are equally probable). For example, simulations in Fig. 8 a for show that population-wide spread of resistance can occur in the pair-approximation model with a 50% treatment level. However, despite a much larger magnitude of outbreak for a similar scenario in homogeneous interactions, few resistant cases are generated and the final size of infections (largely caused by the sensitive strain) can still be reduced in the mean-field and stochastic models by a further 5–10% increase in the treatment level above 50%. We observed similar comparisons for higher reproduction numbers, as illustrated in Fig. 8b for a particular value of . While the resistant strain is generally out-competed by the sensitive strain due to the latter's higher transmissibility, more complex dynamics may arise from competition between pathogen strains at high treatment levels. For homogeneous structure, aggressive treatment beyond the optimal level (that minimizes the total number of infections in a constant treatment strategy) will significantly interrupt the transmission of the dominant competitor (sensitive strain), and therefore promote the emergence and the large-scale propagation of resistance. The extent to which resistance spreads in the population depends not only on the treatment level, but also the time at which selection of resistance occurs during the outbreak. If a significant number of susceptible hosts have already been infected with the sensitive strain, the selective advantage of the resistant strain may not be enough for a subsequent resistant outbreak. In heterogeneous populations, while the outbreak occurs with a smaller magnitude than in homogeneous populations, the effects of resistance emergence are much more pronounced for high treatment levels. This is evident from Fig. 3i (see also Fig. 4) where the resistant strain dominates the sensitive strain after several weeks and causes a subsequent wave of infection. However, due to a larger number of contacts (essentially, the entire population) in the homogeneous models, resistance appears within the single wave of outbreak earlier than in pair-approximation model (Figs. 3g and h). Comparisons between constant and adaptive treatment strategies in Fig. 6 show that the dominance of local interactions in heterogeneous populations can largely subdue the fitness-advantage of the sensitive strain; thereby providing an opportunity for the resistant strain to spread readily through edges of connected sites in local groups. This is highlighted in Fig. 7, which underscores the timely implementation of intensive treatment for minimizing the likelihood of resistant outbreaks.
Fig. 8.
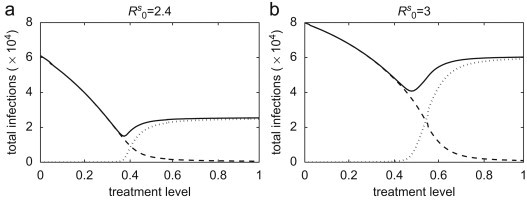
Total number of sensitive infections (dashed curves), resistant infections (dotted curves), and infections caused by both pathogen strains (solid curves) in the pair-approximation model with (a) ; and (b) , as a function of the treatment level.
The models considered in this study include a number of key parameters, such as basic reproduction number, degree of clustering, and treatment level. Considering realistic ranges of these parameters, the results of simulations enable us to determine under what conditions the homogeneous and pair-wise models are expected to exhibit similar behaviour. However, it is of greater importance to determine differences in their predictions that could influence policy making. For example, due to the assumption of random mixing, homogeneous models generally represent larger epidemic outbreaks and may overestimate the final size of infections. This was highlighted in the spread of severe acute respiratory syndrome (SARS), for which estimates of the reproduction number led to predictions of epidemic size that far exceeded what was observed (Meyers et al., 2005). On the other hand, the pair-approximation model displays a much later peak time of outbreak than homogeneous models and this can have important implications for policy implementation, as retarding the progression of disease in the population is generally beneficial for the development of more aggressive pathogen-specific control measures during the outbreak. Furthermore, we observed that the minimum in the final size of infections occurs at some intermediate treatment level when the reproduction number exceeds a threshold-value, and this threshold is lower for the homogeneous models than for the pair model—as illustrated in Fig. 2, for a fixed value of . Further investigation revealed that as , the profile more closely resembles that of a homogeneous model. However, for heterogeneous structures, raising the degree of clustering causes a reduction in the overall disease incidence in the population, which occurs at a higher as the reproduction number increases (Figs. 7a and b). This fact is also evident in Figs. 7c and d, where for a fixed delay in treatment, an increase in rapidly quenches the resistant outbreak. An important observation is that the implementation of intensive treatment in the adaptive strategy requires longer delay (represented by the green valley between the red areas in Figs. 7a and b) as increases or the reproduction number decreases. Finally, we demonstrated that a second (resistant) wave of infection can potentially occur after a sufficiently long delay following the outbreak of sensitive infection (Fig. 4). Moreover, this phenomenon occurs despite the much reduced number of total infections relative to the homogeneous models. This feature is entirely absent from the homogeneous models, and represents a phenomenon peculiar to inhomogeneous (clustering) models when a constant treatment strategy is put in place.
The results of this study are based on dynamical approaches that consider a constant structure of contact patterns. However, in addition to being heterogeneous, network contacts generally evolve during the course of a disease outbreak, due to changes that occur in individuals’ mobility patterns according to their clinical/epidemiological status in the population. For example, infected individuals tend to isolate from the rest of the population for the duration of their infection, and reconnect once they have recovered (and acquired immunity). The co-evolution of individual disease states and the contact network has recently been considered for simple SIS and SIRS models (Risau-Gusman and Zanette, 2008, Shaw and Schwartz, 2008, Zanette and Risau-Gusman, 2007), and new phenomena (such as backward bifurcations) not encountered in traditional models were found. Generalization of the models presented in this paper to incorporate co-evolution of contacts and individual disease progression could suggest alternative control strategies for mitigating the spread of infection. Although this study considers treatment as a single intervention strategy, a combination of control measures (e.g., vaccination, isolation/quarantine, and other social distancing mechanisms) is likely to take place during an outbreak, which can profoundly influence the dynamics of network contacts and spread of resistance in the population. This further underscores the importance of optimizing control strategies from a societal point of view, especially in the face of inadequate resources and limited capacity to cope with surging demand in healthcare.
Our results have important implications for the management of public health crises, particularly those caused by the emergence of novel infectious pathogens such as pandemic influenza viruses. This is currently a major global concern due to outbreaks of the deadly avian strain H5N1 (Jennings and Peiris, 2006) that claims a high mortality rate amongst infected humans (WHO, 2008). Several strategies have been proposed and evaluated to mitigate the impact of a nascent pandemic virus, and antiviral therapy has been rationalized as the first line defense in the absence of an effective virus-specific vaccine (Ferguson et al., 2005, Gani et al., 2005, Gardam et al., 2007, Longini et al., 2005). Considering the risk of containment failure at the source of a pandemic, potential evolutionary-epidemiological consequences of drug use should be taken into account when developing more nuanced, targeted, or geographically specific antiviral strategies (Moghadas, 2008, Moghadas et al., 2008). In the presence of antiviral treatment, emergence of resistance can result in a rapid and wasteful depletion of available drug supplies that are currently being stockpiled, and therefore strategies that prolong the effectiveness of drugs should be prioritized. A recent study, using a stochastic modelling approach, indicates that an adaptive treatment strategy may be suitable if a secondary resistant outbreak is unavoidable (Handel et al., 2009). While being appropriate for management of resistance and minimizing the final size of infections, this strategy may involve decisions for rationing of drug supplies and possibly withholding treatment from infected individuals at low risk of disease-induced complications or death (Handel et al., 2007). The ethical framework of such decisions is complex; however, comparison of the potential consequences of competing strategies will allow public health authorities to optimize policy decisions for maximum protection of community health.
Authors contributions
Developed mean-field and stochastic models, and performed simulations: S.M., Y.H.; developed pair-approximation model and performed simulations: M.A., S.D.; designed the study: S.M.; wrote the paper: S.M., M.A. All the authors have read the paper and approved its content.
Competing interests
The authors declare that they have no competing interests.
Acknowledgements
This research was partially supported by the Natural Sciences and Engineering Research Council of Canada (NSERC) and Mathematics of Information Technology and Complex Systems (MITACS). The authors would like to thank the reviewers for their insightful comments that have greatly improved the paper.
Appendix A. Equations for the pair-approximation model
Define , , and . Then, the pair dynamics are governed by the following exact equations:
Here, the triplets are approximated using the closure relation (Keeling, 1999), where is an extra parameter chosen in the range [0,1] and its effect on disease spread and development of resistance is investigated.
Appendix B. Reproduction numbers of the pair-approximation model with correlations
When correlations are taken into account, the dynamics of the infectious states are given by
We are primarily interested in the dynamics of the system at the onset of the outbreak. The variables , , and may be expressed in terms of the pair correlation functions , , and (see Eq. (9)), so the above equations may be written in the form
where during the initial phase of disease outset (assuming ). The coefficient matrix of the above system has negative eigenvalues provided and , where
| (14) |
| (15) |
where and correspond to the homogeneous case described in Section 3. It is clear that the correlations , , and play a significant role in determining whether an epidemic outbreak occurs. For the initial conditions used in the simulations (Section 4), we have ; ; and , from which we obtain initial values of ; . Numerical simulations (not reported here) suggest that these correlations converge to equilibrium values soon after the onset of the outbreak. For uncorrelated distributions , the expressions in (14), (15) reduce to the homogeneous case, so that and . Preliminary analysis confirms that the equilibrium value of , and therefore , is a decreasing function of . The analysis of the corresponding behaviour of (involving and ) as a function of appears to be more complicated and is currently being investigated.
Appendix C. Algorithm for stochastic simulations
We used the Markov Chain Monte Carlo method to simulate the stochastic dynamic model. In simple stochastic SIR models, the basic reproduction number can be used to assess the likelihood of an outbreak taking place, which is determined by the probability (Allen, 2003), where is the initial number of infections. In our model, this means that if is greater than one but small (for example ), then the probability of transition for is initially low for small . This reflects the fact that stochastic effects dominate in the system at the beginning of the transition period. For the purpose of simulations, we chose the initial number of infections sufficient to result in an outbreak. A key parameter in stochastic simulations is the step-size of the Monte Carlo method. Using a fixed step-size requires a large number of steps for the stochastic system to guarantee that every member of the infected population can transmit the disease, which is computationally very demanding in terms of both timing and resources. To reduce such computational load, the sampling scheme can be improved and an adaptive step-size used. We therefore employed a sampling method introduced by Rohani et al. (2002) to estimate the transition time to the next event by calculating the sum of the frequencies of all possible events, given by . Then, letting , where is uniform distribution in the interval [0,1], we ordered all possible events as an increasing fraction of and generated another uniform deviate to determine the nature of next event. These simulations were run for a large number of samples to guarantee the convergence of the results, and we considered the average of sample realizations of the stochastic process to generate the infection curve.
References
- Alexander M.E., Bowman C.S., Feng Z., Gardam M., Moghadas S.M., Röst G., Wu J., Yan P. Emergence of drug-resistance: implications for antiviral control of pandemic influenza. Proc. R. Soc. B. 2007;274:1675–1684. doi: 10.1098/rspb.2007.0422. [DOI] [PMC free article] [PubMed] [Google Scholar]
- Allen L.J.S. Prentice-Hall; Upper Saddle River, NJ: 2003. An Introduction to Stochastic Processes with Applications to Biology. [Google Scholar]
- Blower S., Chou T. Modeling the emergence of the ‘host zones’: tuberculosis and the amplification dynamics of drug-resistance. Nature Med. 2004;10:1111–1116. doi: 10.1038/nm1102. [DOI] [PubMed] [Google Scholar]
- Blower S., Bodine E., Khan J., McFarland W. The antiretroviral rollout and drug-resistant HIV in Africa: insights from empirical data and theoretical models. AIDS. 2004;19:1–14. doi: 10.1097/00002030-200501030-00001. [DOI] [PubMed] [Google Scholar]
- Blower S., Ma L., Farmer P., Koenig S. Predicting the impact of antiretrovirals in resource-poor settings: preventing HIV infection whilst controlling drug resistance. Curr. Drugs Targets Infect. Disord. 2003;3:345–353. doi: 10.2174/1568005033480999. [DOI] [PubMed] [Google Scholar]
- Bright R.A., Medina M.J., Xu X., Perez-Oronoz G., Wallis T.R., Davis X.M., Povinelli L., Cox N.J., Klimov A.I. Incidence of adamantane resistance among influenza A (H3N2) viruses isolated worldwide from 1994 to 2005: a cause for concern. Lancet. 2005;366:1175–1181. doi: 10.1016/S0140-6736(05)67338-2. [DOI] [PubMed] [Google Scholar]
- de Jong M.D., Thanh T.T., Khanh T.H., Hien V.M., Smith G.J.D., Chau N.V., Cam B.V., Qui P.T., Ha D.Q., Guan Y., Peiris J.S.M., Hien T.T., Farrar J. Oseltamivir resistance during treatment of influenza A (H5N1) infection. N. Engl. J. Med. 2005;353:2667–2672. doi: 10.1056/NEJMoa054512. [DOI] [PubMed] [Google Scholar]
- Dieckmann, U., Metz, J.A.J., Sabelis, M.W., Sigmund, K. (Eds.), 2002. Adaptive Dynamics of Infectious Diseases: In Pursuit of Virulence Management. Cambridge University Press, Cambridge.
- Diekmann O., Heesterbeek J.A.P. Wiley; Chichester: 2000. Mathematical Epidemiology of Infectious Diseases. [Google Scholar]
- Domingo E., Holland J.J. RNA viruses mutations and fitness for survival. Annu. Rev. Microbiol. 1997;51:151–178. doi: 10.1146/annurev.micro.51.1.151. [DOI] [PubMed] [Google Scholar]
- Durrett R., Levin S. The importance of being discrete (and spatial) Theor. Popul. Biol. 1994;46:363–394. [Google Scholar]
- Ferguson N.M., Cummings D.A.T., Cauchemez S., Fraser C., Riley S., Meeyai A., Iamsirithaworn S., Burke D.S. Strategies for containing an emerging influenza pandemic in Southeast Asia. Nature. 2005;437:209–214. doi: 10.1038/nature04017. [DOI] [PubMed] [Google Scholar]
- Gani R., Hughes H., Fleming D., Griffin T., Medlock J., Leach S. Potential impact of antiviral drug use during influenza pandemic. Emerg. Infect. Dis. 2005;9:1355–1362. doi: 10.3201/eid1109.041344. [DOI] [PMC free article] [PubMed] [Google Scholar]
- Gardam M., Liang D., Moghadas S.M., Wu J., Zeng Q., Zhu H. The impact of prophylaxis of healthcare workers on influenza pandemic burden. J. R. Soc. Interface. 2007;4:727–734. doi: 10.1098/rsif.2006.0204. [DOI] [PMC free article] [PubMed] [Google Scholar]
- Handel A., Longini I.M., Jr., Antia R. Antiviral resistance and the control of pandemic influenza: the role of stochasticity, evolution and model details. J. Theor. Biol. 2009;256:117–125. doi: 10.1016/j.jtbi.2008.09.021. [DOI] [PMC free article] [PubMed] [Google Scholar]
- Handel A., Longini I.M., Jr., Antia R. What is the best control strategy for multiple infectious disease outbreaks? Proc. R. Soc. B. 2007;274:833–837. doi: 10.1098/rspb.2006.0015. [DOI] [PMC free article] [PubMed] [Google Scholar]
- Handel A., Regoes R.R., Antia R. The role of compensatory mutations in the emergence of drug resistance. PLoS. 2006;2:1262–1270. doi: 10.1371/journal.pcbi.0020137. [DOI] [PMC free article] [PubMed] [Google Scholar]
- Jennings L.C., Peiris M. Avian influenza H5N1: is it a cause for concern? Intern. Med. J. 2006;36:145–147. doi: 10.1111/j.1445-5994.2006.01036.x. (Editorial) [DOI] [PubMed] [Google Scholar]
- Keeling M.J. The effects of local spatial structure on epidemiological invasions. Proc. R. Soc. London B. 1999;266:859–867. doi: 10.1098/rspb.1999.0716. [DOI] [PMC free article] [PubMed] [Google Scholar]
- Keeling M.J., Rohani P. Princeton University Press; Princeton, NJ: 2008. Modelling Infectious Diseases in Humans and Animals. [Google Scholar]
- Kiso M., Mitamura K., Sakai-Tagawa Y., Shiraishi K., Kawakami C., Kimura K., Hayden F.G., Sugaya N., Kawaoka Y. Resistant influenza A viruses in children treated with oseltamivir: descriptive study. Lancet. 2004;364:759–765. doi: 10.1016/S0140-6736(04)16934-1. [DOI] [PubMed] [Google Scholar]
- Lloyd A.L., Wodarz D. Disease Evolution: Models, Concepts, and Data Analyses, DIMACS Series in Discrete Mathematics and Theoretical Computer Science. AMS; Providence, RI: 2006. Drug-resistance in acute viral infections: Rhinovirus as a case study; pp. 193–212. [Google Scholar]
- Longini I.M., Jr., Nizam A., Xu S., Ungchusak K., Hanshaoworakul W., Cummings D.A.T., Halloran M.E. Containing pandemic influenza at the source. Science. 2005;309:1083–1087. doi: 10.1126/science.1115717. [DOI] [PubMed] [Google Scholar]
- Meyers L.A., Pourbohloul B., Newman M.E.J., Skowronski D.M., Brunham R.C. Network theory and SARS: predicting outbreak diversity. J. Theor. Biol. 2005;232:71–81. doi: 10.1016/j.jtbi.2004.07.026. [DOI] [PMC free article] [PubMed] [Google Scholar]
- Moghadas S.M. Management of drug resistance in the population: influenza as a case study. Proc. R. Soc. B. 2008;275:1163–1169. doi: 10.1098/rspb.2008.0016. [DOI] [PMC free article] [PubMed] [Google Scholar]
- Moghadas S.M., Bowman C.S., Röst G., Wu J. Population-wide emergence of antiviral resistance during pandemic influenza. PLoS ONE. 2008;3:e1839. doi: 10.1371/journal.pone.0001839. [DOI] [PMC free article] [PubMed] [Google Scholar]
- Morris, A.J., 1997. Representing spatial interactions in simple ecological models. Ph.D. Thesis, Warwick University.
- Moscona A. Oseltamivir resistance—disabling our influenza defenses. N. Engl. J. Med. 2005;353:2633–2636. doi: 10.1056/NEJMp058291. [DOI] [PubMed] [Google Scholar]
- Newman M.E.J. Spread of epidemic disease on networks. Phys. Rev. E. 2002;66:016128. doi: 10.1103/PhysRevE.66.016128. [DOI] [PubMed] [Google Scholar]
- Newman M.E.J. Threshold effects for two pathogens spreading on a network. Phys. Rev. Lett. 2005;95:108701. doi: 10.1103/PhysRevLett.95.108701. [DOI] [PubMed] [Google Scholar]
- Rand D.A. Correlation equations and pair approximations for spatial ecologies. In: McGlade J.M., editor. Advanced Ecological Theory: Advances in Principles and Applications. Blackwell; Oxford, UK: 1999. [Google Scholar]
- Regoes R.R., Bonhoeffer S. Emergence of drug-resistance influenza virus: population dynamical considerations. Science. 2006;312:389–391. doi: 10.1126/science.1122947. [DOI] [PubMed] [Google Scholar]
- Risau-Gusman, S., Zanette, D.H., 2008. Contact switching as a control strategy for epidemic outbreaks. arXiv:0806.1872v1 (q-bio.PE). [DOI] [PubMed]
- Rohani P., Keeling M.J., Grenfell B.T. The interplay between determinism and stochasticity in childhood diseases. Am. Nat. 2002;159:469–481. doi: 10.1086/339467. [DOI] [PubMed] [Google Scholar]
- Schütz, G.M., Brandau, M., Trimper, S., 2008. Exact solution of a stochastic SIR model. ArXiv:0866.4440v1 (cond-mat.stat-mech). [DOI] [PubMed]
- Shaw L.B., Schwartz I.B. Fluctuating epidemics on adaptive networks. Phys. Rev. E. 2008;77:066101. doi: 10.1103/PhysRevE.77.066101. [DOI] [PubMed] [Google Scholar]
- van Baalen M. Pair approximations for different spatial geometries. In: Dieckmann U., Law R., Metz J.A.J., editors. The Geometry of Ecological Interactions: Simplifying Spatial Complexity. Cambridge University Press; Cambridge: 2000. pp. 359–387. [Google Scholar]
- WHO 2008. http://www.who.int/csr/disease/avian_influenza/country/cases_table_2008_09_10/en/index.html.
- Wodarz D. Helper-dependent vs. helper-independent CTL responses in HIV infection: implications for drug therapy and resistance. J. Theor. Biol. 2001;213:447–459. doi: 10.1006/jtbi.2001.2426. [DOI] [PubMed] [Google Scholar]
- Wodarz D., Lloyd A.L. Immune responses and the emergence of drug-resistant virus strains in vivo. Proc. R. Soc. B. 2004;271:1101–1109. doi: 10.1098/rspb.2003.2664. [DOI] [PMC free article] [PubMed] [Google Scholar]
- Zanette, D.H., Risau-Gusman, S., 2007. Infection spreading in a population with evolving contacts. arXiv:0711.0874v1 (q-bio.PE). [DOI] [PMC free article] [PubMed]