

Abstract
With the rapid development of the economy and the accelerated globalization process, the aviation industry plays a more and more critical role in today’s world, in both developed and developing countries. As the infrastructure of aviation industry, the airport network is one of the most important indicators of economic growth. In this paper, we investigate the evolution of the Chinese airport network (CAN) via complex network theory. It is found that although the topology of CAN has remained steady during the past few years, there are many dynamic switchings inside the network, which have changed the relative importance of airports and airlines. Moreover, we investigate the evolution of traffic flow (passengers and cargoes) on CAN. It is found that the traffic continues to grow in an exponential form and has evident seasonal fluctuations. We also found that cargo traffic and passenger traffic are positively related but the correlations are quite different for different kinds of cities.
Keywords: Complex network, Chinese airport network, Transportation, Evolution
1. Introduction
Ranging from biological systems to economic and social systems, many real-world complex systems can be represented by networks, including chemical-reaction networks, neuronal networks, food webs, telephone networks, the World Wide Web, railroad and airline routes, social networks and scientific-collaboration networks [1], [2], [3]. Obviously, real networks are neither regular lattices nor simple random networks. Since the small-world network model [4] and the scale-free network model [5] were put forward at the end of the last century, people have found that many real complex networks are actually associated with the small-world property and a scale-free, power-law degree distribution. In the past ten years, the theory of complex networks has drawn continuous attention from diverse scientific communities, such as network modelling [6], [7], [8], synchronization [9], [10], information traffic [11], [12], [13], [14], epidemic spreading [15], [16], cascading failures [17], [18], [19], [20], evolutionary games [21], [22], [23], [24], [25], social dynamics [26] etc. One interesting and important research direction is understanding transportation infrastructures in the framework of complex network theory [27], [28], [29], [30], [31], [32], [33], [34].
With the acceleration of the globalization process, the aviation industry plays a more and more critical role in the economy and many scientists have paid special attention to the airline transportation infrastructure. Complex network theory is naturally a useful tool since the airports can be denoted by vertices and the flights can be denoted by edges. In the past few years, some interesting research has been reported studying airport networks from the point of view of network theory. For example, Amaral et al. and Guimerà et al. comprehensively investigated the worldwide airport network (WAN) [35], [36]. They found that WAN is a typical scale-free small-world network and the most connected nodes in WAN are not necessarily the most central nodes, which means critical locations might not coincide with highly-connected hubs in the infrastructures. This interesting phenomenon inspired them to propose a geographical–political-constrained network model. Barrat et al. and Colizza et al. further investigated the intensity of WAN’s connections in the view of weighted networks and found correlations between weighted quantities and topology [37], [38]. They proposed a weighted evolving network model to expand our understanding of the weighted features of real systems. Furthermore, they proposed a global epidemic model to study the role of WAN in the prediction and predictability of global epidemics. Also, several empirical works on the Chinese Airport Network [39], [40], [41] and the Indian Airport Network [42] reveal that the scale of national airport networks can exhibit different properties from the global scale of WAN, i.e., the two-regime power-law degree distribution and the disassortative mixing property.
As the aviation industry is an important indicator of economic growth, it is necessary and very meaningful to investigate the evolution of the airport network. Recently, Gautreau et al. studied the US airport network in the time period 1990–2000. They found that most statistical indicators are stationary and that intense activity takes place at the microscopic level, with many disappearing/appearing links between airports [43]. Rocha studied the Brazilian airport network (BAN) in the time period 1995–2006. He also found the network structure is dynamic, with changes in the importance of airports and airlines, and the traffic on BAN has doubled during a period in which the topology of BAN has shrunk [44]. Inspired by their interesting work, we investigate the evolution of Chinese Airport Network (CAN) from the year 1950 to 2008 (1991–2008 for detailed traffic information and 2002–2009 for detailed topology information). It is found that the airway traffic volume increased in an exponential form while the topology had no significant change.
The paper is organized as follows. In the next section, the description of CAN data is presented. The statistical analysis of CAN topology is given in Section 3. In Section 4, we analyze the evolution of traffic flow on CAN. The paper is concluded in the last section.
2. Development of CAN with Chinese GDP
The airport network is the backbone of the aviation industry. It includes airports and direct flights linking airport pairs. Since the aviation industry is closely related to economic development, we firstly investigate the development of the Chinese economy, airports and flights. Fig. 1 (a) shows the development of Chinese GDP from 1950 to 2008. One can see that it has greatly increased in those 58 years. However, the development of airlines (Fig. 1(b)) and airports (Fig. 1(c)) is not consistent with that of GDP. For the development of airports (Fig. 1(c)), one can see that the number of airports grew in 1950–1975, 1987–1995 and 2005–2008, but stayed constant in 1975–1987 and 1995–2005. The first increase (1950–1975) mainly connected large prefecture-level cities, and the second increase (1987–1995) mainly connected medium prefecture-level cities. The third increase (2005–2008) is due to the rapid development of the Chinese economy and China plans to build more airports by 2020. From Fig. 1(b), one can also see that the number of airlines has remained constant since 1995 and rose again in year 2007 and 2008.
Fig. 1.

(Color online) The development of Chinese gross domestic product (a), number of airlines (b) and number of airports (c) from 1950 to 2008.
The data are obtained from Ref. [45].
Although the airline infrastructure (e.g., airports and airlines) does not keep growing due to various constraints, the traffic on CAN keeps growing with the GDP. As shown in Fig. 2 , the traffic (passengers and cargoes) grows almost linearly with GDP. By calculation, one can see that 1 million RMB of GDP can support about 7 passengers and 153 kg of cargo. Moreover, the Chinese aviation industry was also shocked by the 2008 global financial crisis. The top 3 Chinese airline companies have reported their operating information for 2008 and the most important indicators are declining. This has been demonstrated by the annual report of the Civil Aviation Administration of China (CAAC) and we can find in Fig. 2 that the traffic for 2008 is almost the same as that of 2007.
Fig. 2.
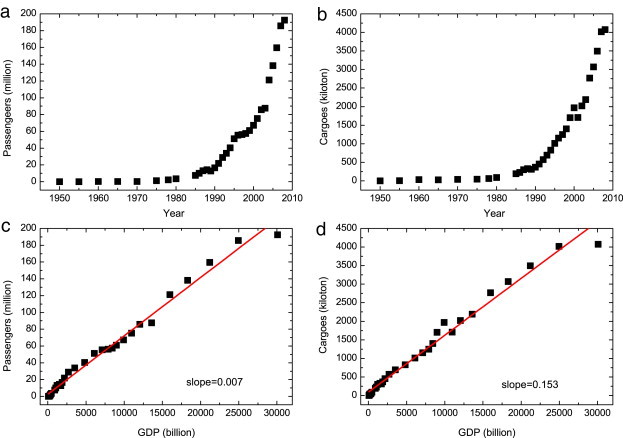
(Color online) (a) The development of passengers, (b) The development of cargoes, (c) Relation of passengers over GDP, (d) Relation of cargoes over GDP.
The data are obtained from Ref. [45].
3. Topological properties of CAN
The topology data of CAN are obtained from 14 timetables provided by the Civil Aviation Administration of China (CAAC) from 2002 to 2009 (2 timetables for years 2003–2008, and 1 timetable for the second half of 2002 and the first half of 2009). It should be noted that:
-
•
The timetable contains both domestic and international airlines. As we only focus on the domestic information, the international airlines are excluded.
-
•
Since Ref. [45] is a statistical yearbook edited by CAAC, it contains not only the scheduled flights but also the temporary flights, whereas the timetables only comprise the scheduled flights. Thus the number of airlines in the timetable is smaller than the data in Ref. [45] by about 150.
-
•
Airports in one city are view as one airport. For instance, there are 3 airports in Shanghai and Chengdu, and 2 airports in Beijing.
-
•
The timetables are not perfectly consistent with real flights due to weather or emergencies.
Fig. 3 shows some basic topological characteristics of CAN in the first half year of 2009. Fig. 3(a) shows the degree distribution of CAN, which follows a two-regime power-law distribution with two different exponents as in Refs. [39], [40], [41] (i.e., for small degrees, and ; and for large degrees, and ). We also investigated the directed CAN and it is found that and are almost the same as , where is the ingoing degree and is the outgoing degree. Fig. 1(b) shows the correlation between and . One can see that the in-out degree correlation is very strong: the slope is 1.000421. This means that one can fly from one airport to another and return using the same airline. Another important topological property is the degree–degree correlation. It is defined as the mean degree of the neighbors (, which is closely related to the network modularity [46]) of a given airport. Fig. 3(c) shows the results of degree–degree correlation of undirected CAN and we can find that the degrees of adjacent airports have significant linear anti-correlation. Fig. 3(d) exhibits the relationship of clustering coefficient and degree . As it shows, lower degree nodes have larger clustering coefficient. All the results above are well in accordance with the results reported by Li and Cai [39], Liu and Zhou [40] and Liu et al. [41].
Fig. 3.

(Color online) (a) Degree distribution of CAN; (b) Correlation between and of CAN; (c) The degree–degree correlation of CAN; (d) The clustering-degree correlation of CAN in the first half year of 2009.
In networks, a node participating in more shortest paths is usually more important. Thus the betweenness is proposed to quantify the node’s importance in traffic [47]. Fig. 4 shows the relation between degree and betweenness. One can see that betweenness generally obeys an exponential function of degree but there exist three nodes whose betweenness is obviously much larger: Urumqi, Xi’an and Kunming. The three nodes are all located in west China: Kunming is the central city of the southwest, Xi’an is the central city of the northwest and Urumqi is the central city of the far northwest. The western population needs to be connected to the political centers (e.g., Beijing) and economic centers (e.g. Shanghai and Shenzhen) in the east. However, due to the long distance from western China to eastern China (over 3000 km), it is costly and unnecessary to make all western airports directly link to the eastern airports. Thus some transit airports are naturally formed as the bridge between east and west China.
Fig. 4.

(Color online) The degree-betweenness correlation of CAN in the first half year of 2009. The fitting function is with and .
Now we study the evolution of the topological properties of CAN. It can be seen from Table 1 that the topological properties of CAN do not significantly change from 2002 to 2009. Similarly, the topological properties of the Brazilian airport network did not significantly change during a long period of time [44]. Next we make a comparison between the two networks.
Table 1.
Evolution of topology parameters of CAN from year 2002 to 2009. is average degree, is ingoing degree, is outgoing degree, is average shortest path length, is network diameter, is clustering coefficient, is a reciprocity parameter to measure the asymmetry of directed networks and is defined as with [44]. Here if there is direct flight from airport to , otherwise .
| Year | |||||||||
|---|---|---|---|---|---|---|---|---|---|
| 2002(2) | 13.90 | −0.42 | −2.66 | 13.78 | 13.78 | 0.990 | 0.75 | 2.21 | 5 |
| 2003(1) | 12.85 | −0.44 | −2.79 | 12.71 | 12.71 | 0.988 | 0.70 | 2.24 | 5 |
| 2003(2) | 11.81 | −0.41 | −2.63 | 11.69 | 11.69 | 0.989 | 0.71 | 2.26 | 5 |
| 2004(1) | 12.78 | −0.43 | −2.58 | 12.68 | 12.68 | 0.991 | 0.75 | 2.22 | 4 |
| 2004(2) | 11.70 | −0.45 | −2.53 | 11.61 | 11.61 | 0.991 | 0.77 | 2.23 | 4 |
| 2005(1) | 11.55 | −0.45 | −2.67 | 11.24 | 11.24 | 0.970 | 0.79 | 2.27 | 4 |
| 2005(2) | 12.03 | −0.45 | −2.52 | 11.90 | 11.90 | 0.988 | 0.79 | 2.25 | 4 |
| 2006(1) | 11.71 | −0.47 | −2.77 | 11.66 | 11.66 | 0.995 | 0.77 | 2.28 | 4 |
| 2006(2) | 12.55 | −0.46 | −2.81 | 11.94 | 11.94 | 0.944 | 0.81 | 2.22 | 4 |
| 2007(1) | 12.33 | −0.45 | −2.52 | 12.23 | 12.23 | 0.991 | 0.79 | 2.28 | 4 |
| 2007(2) | 12.85 | −0.47 | −2.96 | 12.88 | 12.88 | 0.994 | 0.79 | 2.25 | 4 |
| 2008(1) | 13.22 | −0.47 | −2.64 | 13.38 | 11.37 | 0.990 | 0.78 | 2.23 | 4 |
| 2008(2) | 12.06 | −0.46 | −2.70 | 11.96 | 11.96 | 0.991 | 0.76 | 2.29 | 4 |
| 2009(1) | 13.07 | −0.49 | −2.63 | 12.97 | 12.97 | 0.991 | 0.79 | 2.27 | 4 |
Fig. 5 (a) compares average shortest path length of CAN and BAN. One can see that of CAN is around 2.25 and is slightly smaller than that of BAN. Fig. 5(b) shows the diameter , which is also slightly smaller in CAN. This means that CAN is more convenient for passengers. Table 2 gives detailed results of shortest paths of CAN in the first half year of 2009. About 10% paths are direct connections and over 98% paths consist of no more than 2 flights. Fig. 5(c) shows that average clustering coefficient of CAN is apparently larger than that of BAN and Fig. 5(d) shows that CAN is more reciprocal than BAN.
Fig. 5.

(Color online) (a) The average shortest path length , (b) The diameter , (c) The clustering coefficient , (d) The reciprocity parameter of CAN and BAN.
The data of BAN is reproduced from Ref. [44].
Table 2.
Distribution of shortest paths in the first half year of 2009.
| Shortest path | Number of paths | Percentage of paths | Number of flights to be changed |
|---|---|---|---|
| 1 | 902 | 9.54 | 0 |
| 2 | 5561 | 58.83 | 1 |
| 3 | 2853 | 30.18 | 2 |
| 4 | 137 | 1.45 | 3 |
From the discussions above, we know that CAN is an asymmetric small-world network with a two-regime power-law degree distribution, a high clustering coefficient, a short average path length, a negative degree–degree correlation, a negative clustering-degree correlation and an exponential betweenness-degree correlation. Although the topology characteristics of CAN is quite steady from year 2002 to 2009, a dynamic switching process underlies the evolution of CAN. Fig. 6 shows the measured fluctuation of CAN from year 2002 to 2009. Fig. 6(a) shows the fluctuation of airports and we can see that the fluctuation (including the added airports and removed airports) is usually between 5 and 15. But for the second half year of 2007 and the first half year of 2008, the fluctuation is evidently more vigorous. Fig. 6(b) shows that the percentage of changed airlines is usually smaller than 20% and the majority of changes is mainly induced by and . But for the second half year of 2007 and the first year of 2008, when many airports were added and removed, and contribute the majority of changes.
Fig. 6.

(Color online) (a) The fluctuation of airports: added indicates the new airports and removed indicates the removed airports; (b) the fluctuation of airlines: indicates the added airlines between old airports, indicates the added airlines between old and new airports, indicates the added airlines between new airports, indicates the deleted airlines between old airports, indicates the deleted airlines between old and removed airports and indicates the deleted airlines between removed airports.
4. The traffic of CAN
This section investigates evolution of traffic on CAN.
As shown in Fig. 7 , the traffic (including cargoes and passengers) has evident seasonal fluctuations as in the United States. If the seasonal fluctuations are averaged out, one finds that the traffic of CAN increases exponentially. We can also observe similar growth (Fig. 8 ) of the average traffic per-link and per-node. It is found that the average traffic of CAN has increased about 200% during the 17 years. It is worth noting that there exists a sudden drop of passenger traffic in year 2003 (see Figs. 7(b), 8(a) and (b)). This was mainly caused by the outbreak of Severe Acute Respiratory Syndrome (SARS). However, the cargo traffic was not affected by SARS (see Figs. 7(a), 8(c) and (d)).
Fig. 7.

(Color online) Evolution of total traffic on CAN: (a) cargoes; (b) passengers.
Fig. 8.

(Color online) Evolution of total traffic on CAN: (a) passengers per-link; (b) passengers per-node; (c) cargoes per-link; (d) cargoes per-node.
Fig. 9 displays the cumulative distribution of node strength , namely the throughput of each airport including passengers (, see Fig. 9(a)) and cargoes (, see Fig. 9(b)). The distributions are quite broad: 5 orders of magnitude for passengers and 7 for cargoes. The correlations of and are also presented. Fig. 9(c) shows the dependence of on , and Fig. 9(d) shows the dependence of on in year 2008. One can find that there exists a clear non-linear behavior denoting a strong correlation between strength and topology: and . We also examined the data from year 2002 to 2007 and the results are similar.
Fig. 9.

(Color online) (a) : the passenger throughput of each airport, (b) : the cargo throughput of each airport in years 1992, 1996, 2000, 2004 and 2008; (c) the correlation between and , (d) the correlation between and in year 2008.
Fig. 10 shows the correlations of cargo traffic and passenger traffic from year 2001 to 2008. One can find a strong linear correlation between cargo traffic and passenger traffic for both the total traffic of CAN and the traffic of a single airport/city. However, the ratios of cargo traffic and passenger traffic are quite different. As shown in Fig. 10(a), the slope is 0.045 for the total traffic of CAN. For municipalities Beijing (Fig. 10(b)) and Shanghai (Fig. 10(c)), the slopes are obviously smaller. Because Beijing and Shanghai are the most important central cities of politics, economy and culture in China, they are aggregating centers and distributing centers for over 51% of Chinese goods flow (only 27% of Chinese passenger flow). For tourism cities Chengdu (Fig. 10(d)) and Kunming (Fig. 10(e)), the slopes are obviously larger, indicating that the passenger traffic is more active in these two cities.
Fig. 10.

(Color online) The correlations of cargo traffic and passenger traffic from year 1991 to 2008 for: (a) the whole country, (b) Beijing, (c) Shanghai, (d) Chengdu and (e) Kunming.
5. Conclusion
In summary, we investigate the evolution of Chinese airport network (CAN), including the topology, the traffic and the interplay between them. We relate the evolution of CAN to the development of the Chinese economy. The traffic on CAN (passengers and cargoes) grew almost linearly with Chinese GDP: 1 million RMB of GDP can support about 7 passengers and 153 kg cargoes. We also found that there exists a dynamic switching process inside the network, i.e., from the year 2002 to 2009, although the main topological indicators of CAN were quite stationary, there were airports and airlines added and/or removed.
Moreover, the traffic flow (including passengers and cargoes) on CAN is studied. The traffic grew at an exponential rate with seasonal fluctuations, and the traffic throughput of an airport has a power-law correlation with its degree: and . Our comparative studies also show that cargo traffic and passenger traffic are positively related, but with different ratios for different kinds of cities. We also found that the outbreak of global epidemic diseases can greatly affect passenger traffic. For example, during the epidemic spreading period of Severe Acute Respiratory Syndrome (SARS, 2003), the passenger traffic decreased sharply while the cargo traffic was not affected.
Our work can provide some insights in understanding the evolution of the airport network as affected by some social factors such as the development of economy and the outbreak of disease.
Acknowledgements
We thank Gang Yan, Rui Jiang and Mao-Bin Hu for their useful discussions. This work is supported by the Program for New Century Excellent Talents in University (NCET-07-0787) and the Foundation for Innovative Research Groups of the National Natural Science Foundation of China (No. 60921001).
References
- 1.Albert R., Barabási A.-L. Rev. Modern Phys. 2002;74:47. [Google Scholar]
- 2.Boccaletti S., Latora V., Moreno Y., Chavez M., Hwang D.-U. Phys. Rep. 2006;424:175. [Google Scholar]
- 3.Newman M.E.J. SIAM Rev. 2003;45:167. [Google Scholar]
- 4.Watts D.J., Strogatz S.H. Nature. 1998;393:440. doi: 10.1038/30918. [DOI] [PubMed] [Google Scholar]
- 5.Barabási A.-L., Albert R. Science. 1999;286:509. doi: 10.1126/science.286.5439.509. [DOI] [PubMed] [Google Scholar]
- 6.Barrat A., Barthélemy M., Vespignani A. Phys. Rev. Lett. 2004;92:228701. doi: 10.1103/PhysRevLett.92.228701. [DOI] [PubMed] [Google Scholar]
- 7.Wang W.-X., Wang B.-H., Hu B., Yan G., Ou Q. Phys. Rev. Lett. 2005;94:118702. doi: 10.1103/PhysRevLett.94.188702. [DOI] [PubMed] [Google Scholar]
- 8.Zhou T., Yan G., Wang B.-H. Phys. Rev. E. 2005;71:046141. doi: 10.1103/PhysRevE.71.046141. [DOI] [PubMed] [Google Scholar]
- 9.Arenas A., Diaz-Guilera A., Kurths J., Moreno Y., Zhou C.-S. Phys. Rep. 2008;469:93. [Google Scholar]
- 10.Yan G., Fu Z.-Q., Ren J., Wang W.-X. Phys. Rev. E. 2007;75:016108. doi: 10.1103/PhysRevE.75.016108. [DOI] [PubMed] [Google Scholar]
- 11.Yan G., Zhou T., Hu B., Fu Z.-Q., Wang B.-H. Phys. Rev. E. 2006;73:046108. doi: 10.1103/PhysRevE.73.046108. [DOI] [PubMed] [Google Scholar]
- 12.Wang W.-X., Yin C.-Y., Yan G., Wang B.-H. Phys. Rev. E. 2006;74:016101. doi: 10.1103/PhysRevE.74.016101. [DOI] [PubMed] [Google Scholar]
- 13.Arenas A., Díz-Guilera A., Guimerà R. Phys. Rev. Lett. 2001;86:3196. doi: 10.1103/PhysRevLett.86.3196. [DOI] [PubMed] [Google Scholar]
- 14.Wu Z.-X., Wang W.-X., Yeung K.H. New J. Phys. 2008;10:023025. [Google Scholar]
- 15.Yan G., Zhou T., Wang J., Fu Z.-Q., Wang B.-H. Chin. Phys. Lett. 2005;22:510. [Google Scholar]
- 16.Pastor-Satorras R., Vespignani A. Phys. Rev. Lett. 2001;86:3200. doi: 10.1103/PhysRevLett.86.3200. [DOI] [PubMed] [Google Scholar]
- 17.Wang W.-X., Chen G. Phys. Rev. E. 2008;77:026101. doi: 10.1103/PhysRevE.77.026101. [DOI] [PubMed] [Google Scholar]
- 18.Huang L., Park K., Lai Y.-C., Yang L., Yang K.-Q. Phys. Rev. Lett. 2006;97:164101. doi: 10.1103/PhysRevLett.97.164101. [DOI] [PubMed] [Google Scholar]
- 19.Watts D.J. Proc. Natl. Acad. Sci. USA. 2002;99:5766. doi: 10.1073/pnas.082090499. [DOI] [PMC free article] [PubMed] [Google Scholar]
- 20.Wang J.-W., Rong L.-L. Physica A. 2009;388:1731. [Google Scholar]
- 21.Szabó G., Fáth G. Phys. Rep. 2007;446:97. [Google Scholar]
- 22.Szolnoki A., Perc M. New J. Phys. 2008;10:043036. [Google Scholar]
- 23.Szolnoki A., Perc M., Danku Z. Europhys. Lett. 2008;84:50007. [Google Scholar]
- 24.Rong Z.-H., Li X., Wang X.-F. Phys. Rev. E. 2007;76:027101. doi: 10.1103/PhysRevE.76.027101. [DOI] [PubMed] [Google Scholar]
- 25.Wu Z.-X., Guan J.-Y., Xu X.-J., Wang Y.-H. Physica A. 2007;379:672. [Google Scholar]
- 26.Castellano C., Fortunato S., Loreto V. Rev. Modern Phys. 2009;81:591. [Google Scholar]
- 27.Jung W.-S., Wang F.-Z., Stanley H.E. Europhys. Lett. 2008;81:48005. [Google Scholar]
- 28.Latora V., Marchiori M. Physica A. 2002;314:109. [Google Scholar]
- 29.Seaton K.A., Hackett L.M. Physica A. 2004;339:635. [Google Scholar]
- 30.Sienkiewicz J., Holyst J.A. Phys. Rev. E. 2005;72:046127. doi: 10.1103/PhysRevE.72.046127. [DOI] [PubMed] [Google Scholar]
- 31.Brockmann D., Hufnagel L., Geisel T. Nature. 2006;439:462. doi: 10.1038/nature04292. [DOI] [PubMed] [Google Scholar]
- 32.Chen Y.-Z., Li N., He D.-R. Physica A. 2007;376:747. [Google Scholar]
- 33.Chi L.-P., Cai X. Internat. J. Modern Phys. B. 2004;18:2394. [Google Scholar]
- 34.Li W., Cai X. Physica A. 2007;382:693. [Google Scholar]
- 35.Amaral L.A.N., Scala A., Barthélemy M., Stanley H.E. Proc. Natl. Acad. Sci. USA. 2003;97:11149. doi: 10.1073/pnas.200327197. [DOI] [PMC free article] [PubMed] [Google Scholar]
- 36.Guimerà R., Mossa S., Turtschi A., Amaral L.A.N. Proc. Natl. Acad. Sci. USA. 2005;102:7794. doi: 10.1073/pnas.0407994102. [DOI] [PMC free article] [PubMed] [Google Scholar]
- 37.Barrat A., Barthélemy M., Pastor-Satorras R., Vespignani A. Proc. Natl. Acad. Sci. USA. 2004;101:3747. doi: 10.1073/pnas.0400087101. [DOI] [PMC free article] [PubMed] [Google Scholar]
- 38.Colizza V., Barrat A., Barthélemy M., Vespignani A. Proc. Natl. Acad. Sci. USA. 2006;103:2015. doi: 10.1073/pnas.0510525103. [DOI] [PMC free article] [PubMed] [Google Scholar]
- 39.Li W., Cai X. Phys. Rev. E. 2004;69:046106. doi: 10.1103/PhysRevE.69.046106. [DOI] [PubMed] [Google Scholar]
- 40.Liu H.-K., Zhou T. Acta Phys. Sinica. 2007;56:106. [Google Scholar]
- 41.Liu H.-K., Zhang X.-L., Cao L., Wang B.-H., Zhou T. Sci. China Ser. G. 2009;39:935. [Google Scholar]
- 42.Bagler G. Physica A. 2008;387:2972. [Google Scholar]
- 43.Gautreau A., Barrat A., Barthélemy M. Proc. Natl. Acad. Sci. USA. 2009;106:8847. doi: 10.1073/pnas.0811113106. [DOI] [PMC free article] [PubMed] [Google Scholar]
- 44.da Rocha L.E.C. J. Stat. Mech. 2009:P04020. [Google Scholar]
- 45.Statistical data on civil aviation of China 1992–2009, Chinese Civil Aviation Press, This book of year 1994 is out of print.
- 46.Guimerà R., Sales-Padro M., Amaral L.A.N. Nat. Phys. 2007;3:63. doi: 10.1038/nphys489. [DOI] [PMC free article] [PubMed] [Google Scholar]
- 47.Freeman L.C. Soc. Networks. 1979;1:215. [Google Scholar]