

Abstract
This work describes and applies a methodology for estimating the impact of recirculating heating, ventilating, and air-conditioning (HVAC) particle filters on the control of size-resolved infectious aerosols in indoor environments using a modified version of the Wells-Riley model for predicting risks of infectious disease transmission. Estimates of risk reductions and associated operational costs of both HVAC filtration and equivalent outdoor air ventilation are modeled and compared using a case study of airborne transmission of influenza in a hypothetical office space. Overall, recirculating HVAC filtration was predicted to achieve risk reductions at lower costs of operation than equivalent levels of outdoor air ventilation, particularly for MERV 13–16 filters. Medium efficiency filtration products (MERV 7–11) are also inexpensive to operate but appear less effective in reducing infectious disease risks.
Keywords: Influenza, Wells-Riley, Infectious disease risk, Infectious aerosols, Droplet nuclei, Indoor air quality
Graphical abstract

Highlights
-
•
We modeled the impact of HVAC filters on influenza risks in an office environment.
-
•
The model is a modified version of the Wells-Riley model.
-
•
Higher-efficiency HVAC filters may yield lower risks of influenza infection.
-
•
HVAC filtration appears more cost effective than outdoor air ventilation.
1. Introduction
The airborne transmission of respiratory pathogens such as measles, tuberculosis, severe acute respiratory syndrome (SARS), influenza, rhinovirus, and others in indoor environments and the associated risk of infection presented to uninfected occupants are governed by several complex physical and biological processes. Communicable respiratory illnesses lead to large excesses in expenses associated with healthcare, absence from work, and lost worker productivity [1], but the control of airborne infectious disease transmission in indoor environments is not yet entirely understood [2]. Several studies have shown that building design and operational characteristics such as increased outdoor air ventilation rates, lower occupant density, and use of UV germicidal irradiation can reduce the risk of infectious disease transmission inside buildings [3], [4], [5], [6], [7]. Similarly, commonly available particle filters in recirculating heating, ventilating, and air-conditioning (HVAC) systems may also be used to reduce the risk of airborne infectious disease transmission, depending on the nature of infectious aerosols and some important building characteristics [2], [4], [8], [9], [10], [11], [12].
However, key questions remain about (i) the effectiveness of particle filtration for controlling airborne infectious aerosols, (ii) the associated risk reductions achievable with HVAC filtration, and (iii) the relative costs of risk reduction by HVAC filtration versus other control mechanisms such as increased outdoor air ventilation rates. To address these questions, this article describes and applies a methodology for estimating the impact of recirculating HVAC filters on the control of size-resolved infectious aerosols in indoor environments using a modified version of the Wells-Riley model for predicting risks of airborne infectious disease transmission. Estimates of likely risk reductions and associated operational costs of both HVAC filtration and equivalent outdoor air ventilation are modeled and compared using a case study of airborne transmission of influenza in a hypothetical office space in multiple climates.
2. Background
2.1. Estimating risks of airborne disease transmission
Aerosol transmission has been shown to be a predominant route of transmission for a number of communicable diseases, including rhinovirus [7], [13], influenza [14], [15], [16], tuberculosis [17], and SARS [18]. There is also growing empirical evidence that increased outdoor air ventilation rates in buildings can reduce the transmission of some of these same diseases [19], which further confirms the likely importance of airborne transmission via infectious aerosols in indoor environments. One often-used approach to estimating the risks associated with airborne transmission of respiratory diseases is the Wells-Riley model, as shown in Equation (1) [20].
| (1) |
where P infection = the probability of infection; cases = the number of infection cases; susceptibles = number of susceptible individuals; I = number of infector individuals; p = pulmonary ventilation rate of a person (m3/hour); q = quanta generation rate (1/hr); t = exposure time (hr); and Q oa = room ventilation rate with pathogen-free air (m3/hour).
The Wells-Riley model is based on a concept of “quantum of infection,” whereby the rate of generation of infectious airborne particles (or quanta) can be used to model the likelihood of an individual in a steady-state well-mixed indoor environment being exposed to the infectious particles and subsequently succumbing to infection. Note that some researchers have also expanded this model to include time-varying exposures [21] and others have developed zonal versions that account for incomplete mixing in an indoor environment [22].
The quantum of infection term (q) in this risk model is not an actual physical unit; it is a hypothetical infectious dose unit that is typically back calculated from observational epidemiological studies. Conceptually, it describes the number of infectious particles in a way that implicitly accounts for both the amount of particles generated over time and the infectivity of particles, which also inherently captures susceptibility of individuals and particle size effects such as the probability of deposition in relevant regions of the respiratory system. Because of the empirical nature of the model in Equation (1), existing literature on quanta generation rates (q) is relatively limited. Published ranges of q for several infectious airborne diseases are shown in Table 1 .
Table 1.
Summary of quanta generation rates reported in existing literature.
It is also important to note the assumption of well-mixed indoor environments in this model and in previous derivations of quanta generation rates. Because of this assumption, the model cannot distinguish between long-range transport of smaller infectious aerosols (i.e., droplet nuclei) and close-contact airborne spread of infectious diseases that occurs when expelled infectious aerosols deposit directly on susceptible parts of the human body (i.e., large droplets). However, quanta generation rates are usually back calculated from scenarios where long-range transport was very likely a major factor. For example, Rudnick and Milton (2003) estimated quanta generation rates of 15–128 per hour for influenza (depending on steady-state or dynamic assumptions) using data from a grounded passenger airplane where the majority of passengers throughout the airplane acquired the influenza virus from one infected individual [23]. While the quanta generation rates in this case may have accounted for some close-range transport, it is reasonable to assume that many passengers would also have been infected by longer-range aerosol transport.
Despite some of these limitations, the Wells-Riley model has been used previously to show that some building factors, particularly outdoor air ventilation rates, can be an important removal mechanism for airborne infectious agents [17], [30], [31]. Because the removal mechanisms of any aerosol (including HVAC filtration) are primarily functions of particle size [32], [33], it is important to consider the actual particle size distributions of infectious aerosols in indoor environments for use with this model. Although the original Wells-Riley model does not explicitly account for the size-resolved nature of infectious aerosols, modifications have been made by others to do so [4], [34], [35]. Therefore, the next sections describe previous efforts to integrate other size-dependent loss terms into the Wells-Riley equation and then review existing knowledge of particle size distributions of infectious aerosols to inform the modeling effort herein. Infectious particle size distributions are explored with the specific intent of generalizing for use with the particle size range relevant to a common HVAC filtration standard: ASHRAE Standard 52.2 [36].
2.2. Incorporating size-dependent loss terms into the Wells-Riley equation
From a mass balance perspective, HVAC filtration and other removal mechanisms are treated similarly to outdoor air ventilation because they both can be used to reduce indoor concentrations of airborne infectious particles. In fact, the steady-state Wells-Riley equation has previously been modified in other investigations to include additional removal terms other than outdoor air ventilation, including filtration by personal respirators, UV degradation, particle deposition, and HVAC particle filtration [3], [4], [10], [31]. Equation (2) follows the same procedures by including both HVAC filtration and deposition loss terms.
| (2) |
where V = indoor air volume (m3); λ ventilation = outdoor air ventilation rate (Q oa/V, 1/hr); k filtration = infectious particle removal rate due to filtration (1/hr); and k deposition = infectious particle deposition rate (1/hr). Deposition removal rates (k deposition) depend primarily on particle size, density, and room characteristics such as airspeeds and surface areas [35], [37]. Filtration removal rates (k filtration) depend on the rate of airflow through the HVAC filter (Q filter), the fractional operation time of the HVAC system (f HVAC), and the size-resolved infectious particle removal efficiency of the filter or air-cleaning device installed (η filter) as shown in Equation (3). The airflow rate through the filter divided by the volume of the indoor air space served and multiplied by fractional operation time is also called the recirculation rate (λ recirculated).
| (3) |
where f HVAC = fractional HVAC operation time (−); Q filter = airflow rate through filter (m3/hr); η filter = particle removal efficiency of the filter (−); and λ recirculated = recirculation rate through the HVAC filter (1/hr). Depending on the nature of the virus or bacteria of concern inside of expelled droplets or droplet nuclei, some rate of inactivation may also occur as aerosols are exposed to indoor air [34]. This rate has been explored for some viruses [38], [39] and is dependent in part on environmental conditions such as relative humidity. However, we have excluded this loss rate in this work in part because of a lack of existing data on size-resolved inactivation rates for multiple infectious aerosols of concern and in part because quanta generation rates, when back calculated using Equation (1), should inherently account for any inactivation that occurred during the case study period. Additionally, although Equations (2), (3) are shown without explicitly considering particle size effects, both the filtration and deposition loss parameters (k deposition and k filtration) are size-dependent. Therefore, the following sections describe existing knowledge of the particle size distributions of infectious aerosols.
2.3. Particle size distributions of infectious aerosols
When an individual coughs, sneezes, speaks, or breathes, droplets consisting of liquid water, proteins, salts, and various other organic and inorganic matter are expelled into the air. If the emitter is infected with a particular respiratory infection, those droplets may also contain smaller infectious particles themselves, which may be viruses or bacteria depending on the type of infection. Viruses are typically an order of magnitude or more smaller in size than bacteria: ∼20–200 nm for viruses vs. ∼0.2–5 μm for most bacteria [40]. In other explorations of the impacts of particle filtration and other size-dependent processes on virus and bacteria disease transmission, some researchers have assumed that the individual virus or bacteria particles are aerosolized and exist suspended as individual organisms [11], [41]; however, it is likely more appropriate to consider the particles as larger expelled droplets that contain aggregates of the smaller infectious particles within Refs. [8], [35], [42], [43].
Once expelled from a high relative humidity environment (the human body) to a relatively less humid environment (most indoor environments), droplets rapidly decrease in size as the surrounding liquid evaporates. Several studies have shown that this liquid evaporation typically occurs within less than 1 s of emission for particles smaller than ∼50 μm in diameter [44]. After rapid evaporation, droplet nuclei containing the mix of solid particles (including any infectious particles) remain. Droplet nuclei typically have particle diameters that are 40–50% of the original droplet size [35], [39].
It is commonly believed that droplet nuclei particles average 1–3 μm in diameter [42], although several recent studies have shown considerable variation in the size distribution of expelled droplets and droplet nuclei. Nicas et al. [35] summarized nearly 50 years of measurements of particle size distributions of droplets emitted by humans during coughing and sneezing and reported that cough-generated aerosols could be divided into two lognormally distributed modes: (i) a small particle size distribution with a geometric mean diameter of ∼10 μm (ii) a large particle size distribution with a geometric mean diameter of ∼160 μm. However, the smaller particle size distribution was found to contain the majority of cough particles (∼70%). Given that the same authors described some evidence of smaller particles being more infectious than larger particles, it appears that smaller (i.e., <10 μm) particles are likely of greatest concern for droplet nuclei transmission of infectious diseases. Several more recent studies utilizing more advanced measurement techniques have revealed a general consensus that the majority (often 80–90%) of particles expelled during various human activities are actually smaller than 1–2 μm in diameter [45], [46], [47], [48], [49], [50], although it is not clear whether actual virus content scales more with particle number, surface area, or volume distributions.
2.4. Infectious particles within droplet nuclei
While previous studies have been helpful for identifying the size of particles expelled during human activities, several more recent studies have utilized more sophisticated techniques (e.g., quantitative polymerase chain reaction, or q-PCR) to identify the presence of viruses or bacteria in expelled droplets and droplet nuclei collected on multi-stage bioaerosol samplers [46], [51], [52], [53], [54], [55]. These studies offer insight not only into what size aerosols exist after expulsion from the human body, but in what size-fractions are viruses or bacteria actually present and are thus of most concern for infectious disease transmission. Several of these recent studies have focused on the particle size distributions of influenza in indoor and personal airborne particulate matter in indoor environments, as summarized in Table 2 .
Table 2.
Review of recent studies detecting influenza virus in size-resolved particulate matter samplers.
| Source | Sampling environment | Sampling location(s) | Particle size distribution of influenza virus reported | Assumed distribution of influenza virus in modified ranges for use with ASHRAE Standard 52.2 (Fi) |
||||
|---|---|---|---|---|---|---|---|---|
| 0.3–1 μm | 1–3 μm | 3–10 μm | ||||||
| [51] | Urgent care clinic | Personal indoor | <1.7 μm | 1.7–4.9 μm | >4.9 μm | 19% | 20% | 62% |
| 32% | 16% | 52% | ||||||
| Stationary indoor (lower floor) | <1 μm | 1–4.1 μm | >4.1 μm | 13% | 24% | 63% | ||
| 13% | 37% | 50% | ||||||
| Stationary indoor (upper floor) | <1 μm | 1–4.1 μm | >4.1 μm | 9% | 17% | 74% | ||
| 9% | 27% | 64% | ||||||
| [52] | Hospital emergency room | Combination of personal and stationary indoor | <1 μm | 1–4 μm | >4 μm | 4% | 33% | 63% |
| 4% | 49% | 47% | ||||||
| [53] | Cough aerosol collection system | Personal cough airstream | <1 μm | 1–4 μm | >4 μm | 42% | 15% | 43% |
| 42% | 23% | 35% | ||||||
| [54] | Health center, daycare center, and airplanes | Stationary indoor | <1 μm | 1–2.5 μm | >2.5 μm | 36% | 37% | 27% |
| 36% | 28% | 36% | ||||||
| [55] | Patient room with breathing manikin | Combination of personal and stationary indoor | <1 μm | 1–4 μm | >4 μm | 20% | 50% | 30% |
| 19.5% | 75.5% | 5% | ||||||
| Mean viral distribution across all studies | 20% | 29% | 51% | |||||
| Standard deviation | 14% | 12% | 18% | |||||
| Relative standard deviation | 0.70 | 0.44 | 0.36 | |||||
In these recent investigations, the amount of influenza virus content in a range of particle sizes was quantified using a variety of bioaerosol samplers installed in a variety of locations and indoor environments. Sampling environments included healthcare centers, daycare centers, hospital emergency rooms, simulated patient rooms, and in the coughing/breathing zone of both people and manikins. Sampling locations within each environment included both stationary indoor measurements and personal measurements. Importantly, the variety of aerosol samplers used also varied in their particle size cut-off points. However, each study characterized virus content in three generally similar bins: (i) particles smaller than 1 μm, (ii) particles 1 μm to 2.5–4.9 μm, depending on the sampler type, and (iii) particles larger than bin (ii). Influenza virus content varied widely in each of these size bins across each study. For example, the average virus content in the smallest size bin (<1 μm) ranged from 4% in a hospital emergency room to 42% in the immediate vicinity of coughing human subjects. Conversely, the largest size bin contained 5–64% of virus content, depending on sampler and environment, although the majority of studies revealed that at least 35% of virus content was associated with the largest size bin.
Fortunately for this work, the size bins from the selected studies aligned relatively closely to the three size bins outlined in the most commonly used HVAC filtration standard in the U.S., ASHRAE Standard 52.2, which classifies filtration efficiency in bins of 0.3–1 μm, 1–3 μm, and 3–10 μm [36]. Therefore, we adjusted each of the reported size distributions in Table 2 to fit within those three particle size ranges by assuming that the virus content has a uniform distribution in each particle size bin. These assumed distributions are shown in the rightmost columns in Table 2. Although this assumption introduces some uncertainty, we have no way of directly quantifying the magnitude at this time. We do however explore uncertainty in a later section using both the mean and relative standard deviations of the assumed viral size distributions, as summarized in the bottom of Table 2, which can place likely bounds on risk estimates made using Equation (2).
On average across all of these studies, we estimate that approximately 20% of influenza virus content is associated with particles in the 0.3–1 μm size range in these recent studies; 29% is associated with the 1–3 μm size range, and 51% is associated with the 3–10 μm size range. The smallest size range has the highest relative standard deviation from that mean (70%), followed by the middle size range (44%) and the largest size range (36%). At this point, we have reviewed enough background knowledge of the nature of infectious particles emitted during various human activities and the likelihood of those aerosols containing virus content to inform a mechanistic study of droplet nuclei transport and control based on these infectious aerosol characteristics.
3. Methods
This work uses the modified particle-size-resolved version of the Wells-Riley model in Equation (2) to estimate the risk reductions likely achievable by common HVAC filters for a case study of influenza transmission in a hypothetical office building. Estimates of operational costs are also made for both HVAC filtration and an equivalent amount of outdoor air ventilation in a range of climate zones across the U.S. in order to compare the likely costs of both control methods. The next sections describe our methodology for connecting the modified Wells-Riley model to HVAC filtration (i.e., MERV) and estimating operational costs.
3.1. HVAC filtration and the modified Wells-Riley equation
To connect the modified Wells-Riley equation to HVAC filtration, we first linked likely infectious particle removal efficiency with the Minimum Efficiency Reporting Value (MERV) classification from ASHRAE Standard 52.2. A summary of the MERV table from Standard 52.2 is shown in Table 3 along with best estimates of particle filtration efficiency for lower-MERV filters that have no MERV requirement for certain particle size bins (i.e., MERV 4–11). Average values across each of the 0.3–1 μm and 1–3 μm size bins were taken from a previous study that measured the in-situ removal efficiency of lower efficiency filters [56]; these values also align similarly to other previous studies [57], [58].
Table 3.
Minimum Efficiency Reporting Values (MERV) for a range of filters.
| MERVa | 0.3–1 μm | 1–3 μm | 3–10 μm |
|---|---|---|---|
| 4b | 1% | 9% | 15% |
| 7b | 17% | 46% | 50% |
| 11b | 30% | 65% | 85% |
| 13 | 70% | 90% | 90% |
| 14 | 80% | 90% | 90% |
| 15 | 90% | 90% | 90% |
| 16 | 95% | 95% | 95% |
| HEPAc | 99.9% | 99.9% | 99.9% |
Values for MERV are taken directly from ASHRAE Standard 52.2 unless otherwise noted.
Values for 0.3–1 and 1–3 μm for MERV 4–11 are taken from Stephens and Siegel (2012) because MERV does not require efficiency values to be reported for these particle sizes for these filters [56].
HEPA = High efficiency particulate air filter.
Subsequently, the range of infectious particle size distributions for influenza virus from Table 2 were linked to the filter removal efficiencies in Table 3 by an infectious particle size-weighting procedure, as shown in Equation (4).
| (4) |
where η filter = infectious particle size weighted filtration efficiency (−); η i = size-resolved particle filtration efficiency for the geometric mean diameter of particle size bin i (from Table 3); and F i = the fraction of virus content associated with particle size bin i (from Table 2). Because there are multiple references for the distribution of influenza virus content in size-fractioned aerosols, we introduced an estimate of uncertainty by assuming the infectious particle size distributions from each environment in each referenced study were equally likely to be present in the modeled indoor environment. These distributions for each filter are shown in Table 4 , along with the mean infectious particle removal efficiency for each filter averaged across each study in Table 2
Table 4.
Infectious-particle-size-weighted filtration efficiency for a range of HVAC filters.
| Infectious droplet nuclei filtration efficiency (ηfilter) | ||||||||
|---|---|---|---|---|---|---|---|---|
| Filter | Lindsley et al. [51] Personal | Lindsley et al. [51] Lower stationary | Lindsley et al. [51] Upper stationary | Blachere et al. [52] Personal and stationary | Lindsley et al. [53] Cough airstream | Yang et al. [54] Stationary | Noti et al. [55] Stationary Manikin | Mean |
| MERV 4 | 11.2% | 11.7% | 12.7% | 12.5% | 8.2% | 7.7% | 9.3% | 10.5% |
| MERV 7 | 43.0% | 44.8% | 46.3% | 47.4% | 35.5% | 36.6% | 41.6% | 42.2% |
| MERV 11 | 70.7% | 73.1% | 76.6% | 76.3% | 58.8% | 57.7% | 64.2% | 68.2% |
| MERV 13 | 86.2% | 87.4% | 88.2% | 89.2% | 81.6% | 82.8% | 86.1% | 85.9% |
| MERV 14 | 88.1% | 88.7% | 89.1% | 89.6% | 85.8% | 86.4% | 88.1% | 88.0% |
| MERV 15 | 90.0% | 90.0% | 90.0% | 90.0% | 90.0% | 90.0% | 90.0% | 90.0% |
| MERV 16 | 95.0% | 95.0% | 95.0% | 95.0% | 95.0% | 95.0% | 95.0% | 95.0% |
| HEPA | 99.9% | 99.9% | 99.9% | 99.9% | 99.9% | 99.9% | 99.9% | 99.9% |
Mean filtration efficiency values for infectious droplet nuclei are estimated to range from 10.5% for MERV 4 filters to 99.9% for HEPA filters. Assumptions across the wide range of infectious particle size distributions summarized in Table 2 lead to infectious droplet nuclei removal efficiencies that vary by as much as 19% absolutely (although the range narrows for higher MERV filters because of high removal efficiencies for all particle size ranges).
While Table 4 provides estimates for assumed removal efficiencies for various MERV filters across the size ranges of concern for infectious droplet nuclei transmission, other important parameters for determining the impact of filtration on infectious disease risk in indoor environments include the infectious particle deposition rate and the recirculation rate through the HVAC system (which is a function of specific building characteristics).
3.2. Infectious particle deposition and the modified Wells-Riley equation
Particle deposition rates (k deposition) are important for removal of indoor aerosols but are highly variable depending on the nature of the indoor environment [59], [60]. The original Wells-Riley model neglected particle deposition; however, for the particle sizes considered, it is more appropriate to account for deposition [4], [34], [35]. For simplicity, we assume constant values of k deposition based on size-resolved values used in Riley et al. (2002) [33], [61]. Using a geometric mean diameter between 0.3 and 1 μm (0.55 μm), between 1 and 3 μm (1.7 μm), and between 3 and 10 μm (5.5 μm), deposition rates were estimated as ∼0.10 per hour, ∼0.45 per hour, and ∼3.0 per hour, respectively (taken directly from their Fig. 3). When combined with the mean infectious particle size distributions from Table 2, these lead to a mean size-weighted estimate of ∼1.7 per hour for k deposition for particles containing the influenza virus. Values for k deposition ranged from ∼1.0 to ∼2.3 per hour depending on the range of infectious particle size distributions assumed from Table 2. These values for k deposition for influenza were kept constant in each model scenario.
Fig. 3.
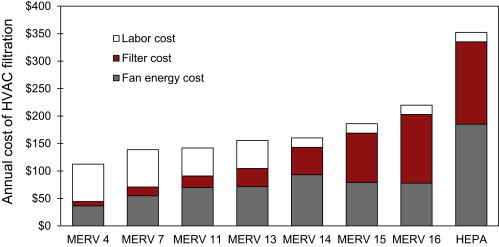
Estimated annual cost of filtration in the hypothetical office environment.
3.3. Application to a case study office environment
This section relies on a case study of a particular indoor environment (an office) to demonstrate the likely impacts that HVAC filtration can have on the risk of spreading a particular airborne infectious disease (influenza). The methods used herein are generalizable and repeatable for other environments although the results are limited to assumptions for the hypothetical environment.
We considered a hypothetical 500 m2 office building with 3 m ceilings (V = 1500 m3). We assume the office space has 25 occupants, one of which is infected with the influenza virus (I = 1; susceptibles = 24). Per ASHRAE Standard 62.1 [62], the minimum outdoor air ventilation rate should be 8.5 m3/hr per person + 1.1 m3/hr per m2 of floor area, which is equivalent to ∼760 m3/hr in the assumed space (yielding an air exchange rate (AER) = 0.51/hr). Assuming the outdoor air supply fraction of total airflow is 25% [63], the total supply airflow rate is ∼3000 m3/hr, with ∼2300 m3/hr provided as recirculated air. The removal rate due to recirculated air filtration is thus ∼1.52 × η filter per hour (where 2300 m3/hr divided by 1500 m3 = 1.52/hour; multiply by particle removal efficiency to get k filtration, assuming that f HVAC = 1). In the office we assumed that adult occupants work 8-h days (t = 8 h) and that all occupants have an average breathing rate (p) of 0.67 m3/hr [64]. We relied on a central estimate of previously published values of quanta generation rate (q) for influenza: q = 100 per hour. However we also explore the sensitivity to our modeling results using both upper bounds (q = 500 per hour) and lower bounds (q = 15 per hour) in the uncertainty analysis.
3.4. Estimating costs of controlling infectious disease with ventilation and filtration
Although outdoor air ventilation rates have been shown to decrease the risk of spreading some infectious airborne diseases, introducing more ventilation air also comes with an energy penalty. Conversely, the introduction of higher efficiency filtration typically increases the pressure drop across the filter, which, in commercial systems with variable air volume fans and airflow controls, will generally increase the amount of energy required to move the same amount of airflow. The next sections describe methods to estimate the annual costs of both outdoor air ventilation and various levels of filtration.
3.4.1. Cost of outdoor air delivery
The amount of energy required to condition excess ventilation air varies according to the magnitude of outdoor airflow rates, climate conditions, and system and equipment efficiency. However, approximate estimates of the amount of energy required to condition the sensible load from outdoor air ventilation can be made using metrics of heating-degree-days (HDD) and cooling-degree-days (CDD) and by making assumptions about equipment efficiency and system operational times [65], [66]. An approximation of the amount of energy required for heating on an annual basis was made using Equation (5). This equation assumes that outdoor air ventilation rates do not vary during operational times.
| (5) |
where E heating = energy required for heating (MJ); ρ air = density of air (1.2 kg/m3); C p,air = specific heat capacity of air (1000 J/(kg-K)); HDD = heating degree days during times of building operation (K-days); η heating = conversion efficiency of heating equipment (−); and α = units conversion factor (24 h/day × 10−6 MJ/J). Similarly, the amount of energy required for cooling on an annual basis was approximated using Equation (6) (and utilizing the same assumptions as Equation (5)):
| (6) |
where E cooling = electricity required for cooling (kWh); η cooling = electric efficiency of cooling equipment (−); CDD = cooling degree days during times of building operation (K-days); and β = units conversion factor (24 h/day × 0.277 kWh/MJ × 10−6 MJ/J). Finally, annual energy costs were estimated by multiplying average utility rates (assuming these are constant for simplicity) by the amount of delivered energy required. We assumed that electricity was used for cooling and natural gas was used for heating.
We estimated the cost of outdoor air delivery in the case study office environment for four different locations across the United States: Chicago, IL, Charlotte, NC, Houston, TX, and Phoenix, AZ. We assumed that a 90% efficient natural gas boiler or furnace was used for heating and the air-conditioning equipment had a constant electric coefficient of performance (COP) of 3.0 (or approximately SEER 12, which is in line with many relatively new existing commercial buildings [67]). We assumed that the office building did not operate continuously year-round, but that it operated ∼31% of the time (i.e., 11 h per day from 7 am to 6 pm to accommodate staff members, excluding holidays and weekends). We used the defined operational schedule and hourly TMY3 (typical meteorological year) weather data to calculate HDDs and CDDs for each hour of assumed operation [68]. HDDs and CDDs were calculated using a base temperature of 18.3 °C. Estimates of HDDs and CDDs utilized in the model are shown in Table 5 , along with estimated annual costs of supplying one unit of outdoor ventilation air in each climate. We assumed electricity rates were constant at $0.12/kWh and that natural gas rates were $8/MMBTU (1 MMBTU = 1055 MJ). These are generally in line with national average rates although we do not explore geographic variations for simplicity.
Table 5.
Climate conditions (HDD and CDD) and annual cost of outdoor air delivery used for the office environment under the assumed operational schedule in each location.
| Chicago | Charlotte | Houston | Phoenix | |
|---|---|---|---|---|
| Heating degree days, HDD (K-day) | 893 | 461 | 204 | 159 |
| Cooling degree days, CDD (K-day) | 300 | 415 | 713 | 1011 |
| Annual cost of air delivery per unit removal rate ($ per 1/hr) | $469 | $367 | $416 | $543 |
3.4.2. Cost of HVAC filtration
In commercial environments with variable speed fans, any additional cost of HVAC filtration can be expressed first in terms of additional fan power required to overcome the additional pressure drop associated with a higher efficiency (typically higher pressure drop) filter. This is not necessarily the case in many smaller commercial environments [69], but is a reasonable assumption for this analysis. The additional fan power required to deliver a particular airflow rate through an HVAC system can be estimated in Equation (7).
| (7) |
where W fan = power draw required for filtration (W); Q filter = airflow rate through the HVAC filter (m3/s); ΔP avg = average pressure drop across filter (Pa); η fan = fan efficiency (assumed 70% constant as in Bekö et al., 2008); and η motor = motor efficiency (assumed 65% constant as in Bekö et al., 2008 [70]). The total fan energy cost can be estimated using Equation (8).
| (8) |
where C fan energy = cost required to overcome filter pressure drop ($); t operating = amount of time that the building is occupied (hours); and P electricity = electric price ($/Wh). The fan was assumed to operate 100% of the time that the building was occupied.
To estimate the total cost of filtration, one must also consider the initial cost of the filtration product itself, the number of filters required for each installation, the typical lifespan of filtration products, and the labor for filter installation and subsequent disposal at the end of its useful life [70]. Labor costs were estimated directly from Bekö et al. (2008) as $12 per filter installation and $5 per filter disposal. Assuming each filter is 24″ × 24″ (0.6 × 0.6 m), the number of filters required for the office environment was estimated by (i) dividing the airflow rate through the HVAC filter by an assumed constant 2 m/s face velocity, which yields the approximate area of filtration required, and (ii) determining the number of 24″ × 24″ (61 × 61 cm) filters to achieve that approximate area, rounding to the nearest whole number. This yielded one filter required in the hypothetical office environment. Annual labor costs were estimated by multiplying the labor cost of changing one filter ($12 + $5 = $17 per filter) by the estimated number of filter replacements during one year of operation. The initial costs of filtration products and the typical expected filter life spans were taken from an anonymous contact in the commercial filtration industry, as shown in Table 6 . The AHU fan in the office environment was assumed to operate 2717 h per year (or 31%) as described in Section 3.4.1.
Table 6.
Assumptions used in estimating the annual costs of HVAC filtration.
| Filter | Depth (cm) | Purchase cost | Initial pressure drop (Pa) | Final pressure drop (Pa) | Average pressure drop (Pa) | Expected filter life |
|---|---|---|---|---|---|---|
| MERV 4 | 5.1 | $2 | 22 | 125 | 73 | 3 months |
| MERV 7 | 5.1 | $4 | 72 | 149 | 111 | 3 months |
| MERV 11 | 5.1 | $7 | 95 | 187 | 141 | 4 months |
| MERV 13 | 5.1 | $11 | 102 | 187 | 144 | 4 months |
| MERV 14 | 30.5 | $50 | 127 | 249 | 188 | 12 months |
| MERV 15 | 30.5 | $90 | 70 | 249 | 159 | 12 months |
| MERV 16 | 30.5 | $125 | 65 | 249 | 157 | 12 months |
| HEPA | 30.5 | $150 | 249 | 498 | 374 | 12 months |
4. Results
This section first describes results from the infection risk modeling effort, followed by results from cost estimates and cost comparisons between filtration and outdoor air ventilation.
4.1. Estimates of absolute risk in the case study office environment
Fig. 1 shows the predicted risk of infection by the influenza virus during an 8-h workday in the hypothetical office building with 25 occupants using a range of HVAC filters installed in the constant operation HVAC system. The central estimates represent risks predicted using Equation (2) with a quanta generation rate of 100 per hour and the mean assumption of viral particle size distributions from Table 2. The error bars represent minimum and maximum risks predicted according to the range of assumptions for viral particle size distributions in Table 2 and infectious aerosol removal efficiencies in Table 4 (assuming the same quanta generation rate).
Fig. 1.
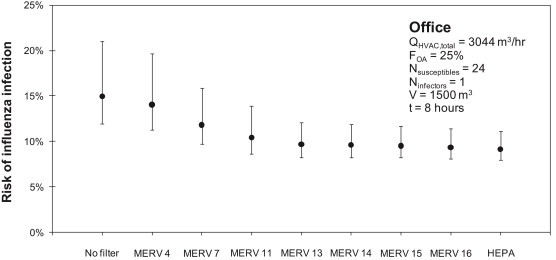
Predicted risk of infection by influenza virus in the hypothetical office environment with various levels of HVAC filtration installed.
Using the central estimate for infectious particle size distributions (i.e., the mean from Table 2) and q = 100 per hour, 15% of the susceptible occupants (4 out of 24) are estimated to acquire the flu virus from the sole infectious individual if the building is operated without a filter installed. The various assumptions for infectious aerosol size distributions from Table 2 impact estimates of absolute risk in each scenario, although trends across filter scenarios are unaffected. For example, the range of assumptions for size-resolved distributions of virus content in indoor aerosols results in an estimate of the absolute risk of acquiring influenza of between 12% and 21% without a filter installed.
Continuing with the central estimate of infectious particle size distributions, even a relatively low efficiency filter (MERV 7) is predicted to reduce the number of infected individuals by 1 (to 12% risk). Increasing to MERV 13 or higher likely prevents another individual from airborne influenza infection (to 10% or lower risk). Finally, increasing to MERV 16 or HEPA filtration has the same effect of lowering the likely number of infected individuals to 2 (with a ∼35–40% reduction relative to no or low filtration efficiency). For MERV 13 and greater, risk reductions are limited not by filtration efficiency but by the amount of airflow recirculating through the HVAC system and filter. Increasing recirculation rates may show stronger impacts of higher efficiency filters; however, these results suggest that MERV 13 can reduce the risk of influenza infection by as many as two individuals in this environment. For reference, one avoided influenza case has been estimated to provide approximately $375 in economic benefits in the United States [1].
4.2. Estimates of relative risks in the case study office environment
While the infection risk reductions shown in the previous section are absolute, we can also explore trends in risk reductions for each filtration case using a measure of relative risk (RR), as shown in Fig. 2. RR values use the “no filter” condition as a baseline; thus, each RR is calculated as the probability of infection with a particular filter installed divided by the probability of infection without a filter installed. The black line shows the RR in the office assuming the mean assumption for infectious aerosol size distributions and a quanta generation rate of 100 per hour. The gray area shows how RR responds to the different assumptions for viral particle size distributions in Table 2.
Fig. 2.
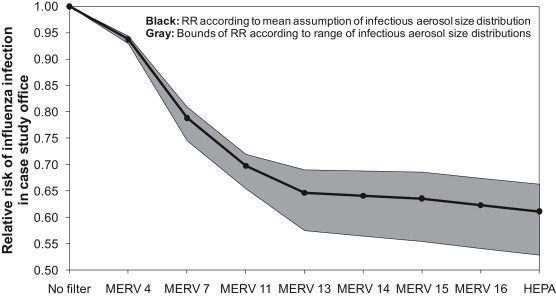
Relative risk (RR) of influenza infection with each level of HVAC filtration in the hypothetical office environment, assuming q = 100 per hour.
In Fig. 2, MERV 4 filters are shown to provide only a 6–7% reduction in risk relative to no filtration. MERV 7 filters are likely to provide a 19–25% reduction in risk (RR = 0.75–0.81) and MERV 11 filters are expected to provide 28–35% risk reductions (RR = 0.65–0.72). MERV 13 and greater levels of filtration are expected to provide between 31% and 47% risk reductions compared to an environment without filtration installed (RR = 0.53–0.69). Although not shown here, we also explored the effects of assuming different values of quanta generation rates for the influenza virus (ranging from 15 to 500 per hour). Ranges in assumptions for q greatly impact absolute risks as Equation (2) demonstrates (and more so than assumptions for particle size distributions of viral content), but relative risks remain largely unchanged (although the bounds on uncertainty are higher).
4.3. Cost comparison
The following sections summarize results from the operational cost analysis for both HVAC filtration and outdoor air ventilation.
4.3.1. Costs of filtration
Using the costs and physical properties for filters described in Table 5 in conjunction with the procedure outlined in Section 3.4.2, estimates of the annual costs of filtration were made for each filtration scenario. Results are shown graphically in Fig. 3 and in tabular form in Table 7 . Total annual costs of filtration are divided into annual fan energy costs, filter purchase costs, and labor costs (which includes the cost of disposal).
Table 7.
Estimated annual cost of filtration in the office environment.
| Filter | Annual filter product costs | Annual fan energy costs | Annual labor costs | Total annual cost |
|---|---|---|---|---|
| MERV 4 | $8 | $36 | $68 | $112 |
| MERV 7 | $16 | $55 | $68 | $139 |
| MERV 11 | $21 | $70 | $51 | $142 |
| MERV 13 | $33 | $72 | $51 | $156 |
| MERV 14 | $50 | $93 | $17 | $160 |
| MERV 15 | $90 | $79 | $17 | $186 |
| MERV 16 | $125 | $78 | $17 | $220 |
| HEPA | $150 | $185 | $17 | $352 |
Annual HVAC filtration costs are predicted to range from $112 for the MERV 4 filter to $352 for the HEPA filter installed in the office environment. MERV 7 and 11 filters are estimated to cost approximately $140 annually; MERV 13–14 filters are estimated to cost approximately $155–160 annually. MERV 15 and 16 filters are estimated to range from $186 to $220 in total annual costs, respectively. Moving from low to high efficiency filters is predicted to increase the importance of fan energy costs and filter costs and decrease the importance of labor costs (primarily because of less frequent replacement schedules).
4.3.2. Costs of filtration versus outdoor air ventilation
In order to compare estimates of annual HVAC filtration costs to the annual costs for delivering outdoor air ventilation, Fig. 4 shows annual costs of both filtration and outdoor air (OA) ventilation normalized by unit removal rate of each scenario. This normalized filtration cost is the total cost of filtration (i.e., the sum of annual labor, filter, and fan energy costs) divided by the average estimate of the infectious aerosol removal rate (i.e., the mean infectious removal efficiency from Table 4 multiplied by the HVAC recirculation rate in the space). This provides a measure of the cost of each control mechanism relative to its ability to remove infectious droplet nuclei from indoor air in units of $ per 1/hr. Fig. 4 contains data for both outdoor air ventilation in each of the four U.S. cities described previously and each level of HVAC filtration operating in the hypothetical office environment (assuming the central estimate of viral content distributions in indoor aerosols).
Fig. 4.
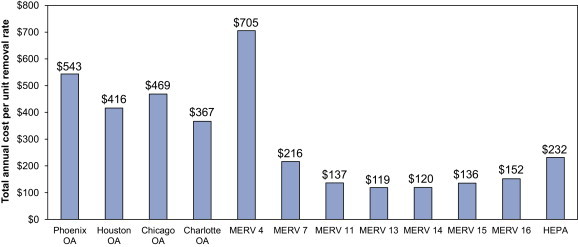
Estimates of the total annual cost per unit removal rate (in units of $ per 1/hour) for outdoor air ventilation rates in each climate and for each level of filtration efficiency in the hypothetical office environment. Filtration costs per removal rate assume the mean infectious aerosol size distribution.
According to Fig. 4, MERV 13 and 14 filtration products are estimated to provide the least expensive removal mechanism in this office environment (in terms of $USD per 1/hour of infectious droplet nuclei removal rate). This is attributed to both relatively high effectiveness (as described in Sections 4.1, 4.2) and relatively low costs of operation (as shown in Fig. 3). Even HEPA filtration is expected to cost less on an annual basis than outdoor air ventilation in all climates. MERV 4 is the only filtration product that is more expensive than outdoor air ventilation according to this metric, primarily because of its very low effectiveness. Although this approach allows for direct comparison between OA ventilation and HVAC filtration, it does not provide information about achievable risk reductions in particular environments.
4.3.3. Costs of filtration and outdoor air ventilation versus risk reductions
In order to compare costs of operation directly to estimates of risk reductions for both HVAC filtration and OA ventilation, Fig. 5 plots the mean predicted relative risk (RR) values from the Wells-Riley modeling (from Fig. 2) versus the total cost of providing that same risk reduction with both outdoor air ventilation in each climate and with each level of HVAC filtration. To compare OA ventilation in each location directly to HVAC filtration, OA ventilation rates have been adjusted to achieve the same removal rate as that of each level of HVAC filtration. For example, a MERV 15 filter is expected to achieve 1.37 per hour in infectious droplet nuclei removal in the office environment with the mean assumption for infectious particle size distributions; for outdoor air ventilation to achieve the same risk reduction as filtration, the office HVAC system would need to provide 1.37 additional air changes per hour of outdoor air ventilation. Therefore, OA ventilation and HVAC filtration can be thought of as equivalent in terms of risk reduction (on the y-axis), but will differ in their cost estimates (on the x-axis). For each of the four geographic locations, the cost per unit ($ per 1/hr) ventilation energy costs from Table 5 was used to estimate the cost of providing this equivalent reduction.
Fig. 5.
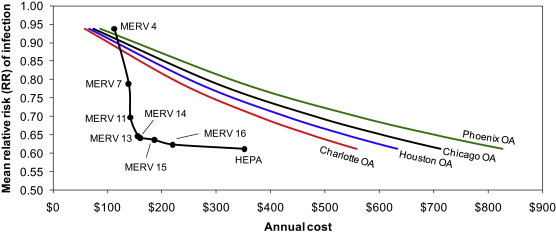
Relative risk (RR) of influenza transmission in the hypothetical office environment with both HVAC filtration and equivalent outdoor air ventilation rates.
As Fig. 5 shows, for each level of risk reduction achievable by the use of every level of HVAC filtration except MERV 4, filtration is estimated to be less expensive on an annual basis than equivalent outdoor air ventilation in each of the four climate zones. MERV 13 and MERV 14 filters appear to achieve an optimal combination of lowest risk reductions at least costs. MERV 4 is actually more expensive to operate than providing equivalent outdoor air ventilation in each climate, primarily because of the very low effectiveness in controlling infectious aerosols. HEPA filtration appears to offer only a small incremental advantage over MERV 13–16 filters (i.e., 1–4% lower RR) for as much as 1.6–2.3 times the cost of operation, which suggests that MERV 13–16 filters may be most appropriate for cost-effectively reducing risks of influenza transmission in this particular indoor environment. In fact, switching from MERV 7 to MERV 13 could likely reduce the number of infected individuals in this office environment by one person at an additional annual cost of only $17. Compared to the estimated economic losses of a single influenza case of $375, MERV 13 filtration could provide a benefit-to-cost ratio of 20 or more. These basic relationships were not sensitive to the various assumptions for infectious particle size distributions.
5. Discussion
According to the results herein, filtration of recirculated air may be able to reduce the transmission of airborne infectious diseases in this particular indoor environment. Although there is a tremendous amount of uncertainty involved in each step of this modeling effort, the sensitivity of the model to input parameters for both infectious aerosol size distributions and for quanta generation rates was shown to be relatively small for relative risks. The sensitivity to each parameter was larger for absolute risks, with much greater uncertainty associated with assumptions for quanta generation rates.
While this case study on a single office environment has been presented for demonstration, more robust statistical techniques could also be used to simulate a wide range of buildings, occupants, and infectious aerosol properties to provide a more generalizable estimate of the likely impacts of filtration across the building stock. Additionally, risk models should be used in conjunction with more detailed hourly building energy balances to more accurately explore the energy impacts of infectious disease filtration relative to control by outdoor air ventilation, which will necessarily vary by climate, human occupancy and activity, and building operational characteristics. Additionally, it is clear that particle size distributions of expelled droplet nuclei should be measured in more standardized ways with much greater numbers of individuals than only those studies identified in the literature review and summarized in Table 2. Last, future epidemiological work should also validate the predictions herein.
It should be noted that there are also more physically and biologically grounded models for assessing risks of infectious respiratory diseases, such as dose–response (D–R) models that incorporate mass balances and/or Markov chains that predict infectious particle concentrations, exposures, and doses, the “infectivity” of the particles, and the organism's susceptibility to disease [29], [71], [72]. D–R models have been used in recent studies to model infectious disease transmission using more mechanistic properties of both tuberculosis [73] and influenza [39], [71]; however, D–R models also have their own inherent limitations, including often requiring interspecies extrapolation to estimate susceptibility of a human subject. Regardless, results from the modeling effort herein demonstrate that HVAC filtration can very likely play a role in preventing the transmission of airborne infectious diseases at lower costs than providing an equivalent amount of outdoor air ventilation, as previous studies have typically explored [3], [4], [6], [7].
6. Conclusion
In this work, an existing airborne infectious disease risk model (the Wells-Riley equation) was modified to include removal by recirculating HVAC filters and linked directly to the primary rating metric of ASHRAE Standard 52.2 for filtration products: MERV. Based on a series of assumptions about infectious particle size distributions resulting from human activities in indoor environments, the risk of acquiring the influenza virus from a single infector was modeled in a hypothetical office environment with a particular focus on what levels of risk reductions could be achieved by different levels of HVAC filtration and equivalent outdoor air ventilation, and at what costs of operation. Overall, recirculating HVAC filtration was predicted to achieve the greatest risk reductions at lower costs of operation than equivalent outdoor air ventilation, particularly for MERV 13–16 filters. Medium efficiency filtration products (MERV 7–11) are also inexpensive to operate but appear less effective in reducing infectious disease risks.
Acknowledgments
This work was funded in part by the National Air Filtration Association (NAFA) Foundation. We would like to acknowledge the help and support of the members of NAFA for their support of the NAFA Foundation, particularly the NAFA Foundation Board, including Tom Ryan, Joe Fly, Jr., Paula Levasseur, Harry Elinsky, Jr., Leslye Sandberg, and Harry Allen. Last, we would also like to thank an anonymous member of the filtration industry for providing cost and lifespan estimates for filtration products.
References
- 1.Fisk W.J. Health and productivity gains from better indoor environments and their relationship with building energy efficiency. Ann Rev Energy Environ. 2000;25:537–566. [Google Scholar]
- 2.ASHRAE . American Society of Heating, Refrigerating and Air-Conditioning Engineers; 2009. ASHRAE position document on airborne infectious diseases. [Google Scholar]
- 3.Fennelly K.P., Nardell E.A. The relative efficacy of respirators and room ventilation in preventing occupational tuberculosis. Infect Control Hosp Epidemiol. 1998;19(10):754–759. doi: 10.1086/647719. [DOI] [PubMed] [Google Scholar]
- 4.Fisk W.J., Seppanen O., Faulkner D., Huang J. Economic benefits of an economizer system: energy savings and reduced sick leave. ASHRAE Trans. 2005;111:673–679. [Google Scholar]
- 5.Langmuir A.D., Jarrett E.T., Hollaender A. Studies of the control of acute respiratory diseases among naval recruits; the epidemiological pattern and the effect of ultraviolet irradiation during the winter of 1946–1947. Am J Hyg. 1948;48(2):240–251. doi: 10.1093/oxfordjournals.aje.a119239. [DOI] [PubMed] [Google Scholar]
- 6.Milton D.K., Glencross P.M., Walters M.D. Risk of sick leave associated with outdoor air supply rate, humidification, and occupant complaints. Indoor Air. 2000;10(4):212–221. doi: 10.1034/j.1600-0668.2000.010004212.x. [DOI] [PubMed] [Google Scholar]
- 7.Sun Y., Wang Z., Zhang Y., Sundell J. In China, Students in Crowded Dormitories with a Low Ventilation Rate Have More Common Colds: Evidence for Airborne Transmission. PLoS One. 2011;6(11):e27140. doi: 10.1371/journal.pone.0027140. [DOI] [PMC free article] [PubMed] [Google Scholar]
- 8.Brosseau L.M., Vesley D., Chen S.-K., Gabel C., Kuehn T.H., Goyal S.M. American Society of Heating, Refrigerating, and Air-Conditioning Engineers; 1994. Investigate and identify means of controlling virus in indoor air by ventilation, filtration or source removal. 776-RP. [Google Scholar]
- 9.Miller-Leiden S., Lohascio C., Nazaroff W.W., Macher J.M. Effectiveness of in-room air filtration and dilution ventilation for tuberculosis infection control. J Air Waste Manage Assoc. 1996;46(9):869–882. doi: 10.1080/10473289.1996.10467523. [DOI] [PubMed] [Google Scholar]
- 10.Nazaroff W.W., Nicas M., Miller S.L. Framework for evaluating measures to control nosocomial tuberculosis transmission. Indoor Air. 1998;8(4):205–218. [Google Scholar]
- 11.RTI . Research Triangle Institute; 2004. Test report of filtration efficiency of bioaerosols in HVAC systems. RTI project no. 08787.001. [Google Scholar]
- 12.Emmerich S.J., Heinzerling D., Choi J., Persily A.K. Multizone modeling of strategies to reduce the spread of airborne infectious agents in healthcare facilities. Build Environ. 2013;60:105–115. [Google Scholar]
- 13.Dick E.C., Jennings L.C., Mink K.A., Wartgow C.D., Inborn S.L. Aerosol transmission of rhinovirus colds. J Infectious Dis. 1987;156(3):442–448. doi: 10.1093/infdis/156.3.442. [DOI] [PubMed] [Google Scholar]
- 14.Tellier R. Aerosol transmission of influenza A virus: a review of new studies. J R Soc Interface. 2009;6(Suppl_6):S783–S790. doi: 10.1098/rsif.2009.0302.focus. [DOI] [PMC free article] [PubMed] [Google Scholar]
- 15.Wong B.C.K., Lee N., Li Y., Chan P.K.S., Qiu H., Luo Z. Possible role of aerosol transmission in a hospital outbreak of influenza. Clin Infect Dis. 2010;51(10):1176–1183. doi: 10.1086/656743. [DOI] [PMC free article] [PubMed] [Google Scholar]
- 16.Cowling B.J., Ip D.K.M., Fang V.J., Suntarattiwong P., Olsen S.J., Levy J. Aerosol transmission is an important mode of influenza A virus spread. Nature Comm. 2013;4:1935. doi: 10.1038/ncomms2922. [DOI] [PMC free article] [PubMed] [Google Scholar]
- 17.Escombe A.R., Oeser C.C., Gilman R.H., Navincopa M., Ticona E., Pan W. Natural ventilation for the prevention of airborne contagion. PLoS Med. 2007;4(2):e68. doi: 10.1371/journal.pmed.0040068. [DOI] [PMC free article] [PubMed] [Google Scholar]
- 18.Wong T., Lee C., Tam W., Lau J.T., Yu T., Lui S. Cluster of SARS among medical students exposed to single patient, Hong Kong. Emerg Infect Diseases. 2004;10(2):269–276. doi: 10.3201/eid1002.030452. [DOI] [PMC free article] [PubMed] [Google Scholar]
- 19.Li Y., Leung G.M., Tang J.W., Yang X., Chao C.Y.H., Lin J.Z. Role of ventilation in airborne transmission of infectious agents in the built environment - a multidisciplinary systematic review. Indoor Air. 2007;17(1):2–18. doi: 10.1111/j.1600-0668.2006.00445.x. [DOI] [PubMed] [Google Scholar]
- 20.Riley E.C., Murphy G., Riley R.L. Airborne spread of measles in a suburban elementary school. Am J Epidemiol. 1978;107(5):421–432. doi: 10.1093/oxfordjournals.aje.a112560. [DOI] [PubMed] [Google Scholar]
- 21.Gammaitoni L., Nucci M.C. Using a mathematical model to evaluate the efficacy of TB control measures. Emerg Infect Dis. 1997;3(3):335–342. doi: 10.3201/eid0303.970310. [DOI] [PMC free article] [PubMed] [Google Scholar]
- 22.Noakes C.J., Sleigh P.A. the proceedings of indoor air. 2008. Applying the Wells-Riley equation to the risk of airborne infection in hospital environments: the importance of stochastic and proximity effects. [Copenhagen, Denmark] [Google Scholar]
- 23.Rudnick S.N., Milton D.K. Risk of indoor airborne infection transmission estimated from carbon dioxide concentration. Indoor Air. 2003;13(3):237–245. doi: 10.1034/j.1600-0668.2003.00189.x. [DOI] [PubMed] [Google Scholar]
- 24.Beggs C.B., Shepherd S.J., Kerr K.G. Potential for airborne transmission of infection in the waiting areas of healthcare premises: stochastic analysis using a Monte Carlo model. BMC Infect Dis. 2010;10(1):247. doi: 10.1186/1471-2334-10-247. [DOI] [PMC free article] [PubMed] [Google Scholar]
- 25.Chen S.-C., Liao C.-M., Li S.-S., You S.-H. A probabilistic transmission model to assess infection risk from mycobacterium tuberculosis in commercial passenger trains. Risk Anal. 2011;31(6):930–939. doi: 10.1111/j.1539-6924.2010.01552.x. [DOI] [PubMed] [Google Scholar]
- 26.Nardell E.A., Keegan J., Cheney S.A., Etkind S.C. Airborne infection. Theoretical limits of protection achievable by building ventilation. Am Rev Respir Dis. 1991;144(2):302–306. doi: 10.1164/ajrccm/144.2.302. [DOI] [PubMed] [Google Scholar]
- 27.Qian H., Li Y., Nielsen P.V., Huang X. Spatial distribution of infection risk of SARS transmission in a hospital ward. Build Environ. 2009;44(8):1651–1658. [Google Scholar]
- 28.Liao C.-M., Chang C.-F., Liang H.-M. A probabilistic transmission dynamic model to assess indoor airborne infection risks. Risk Anal. 2005;25(5):1097–1107. doi: 10.1111/j.1539-6924.2005.00663.x. [DOI] [PubMed] [Google Scholar]
- 29.Sze To G.N., Chao C.Y.H. Review and comparison between the Wells-Riley and dose-response approaches to risk assessment of infectious respiratory diseases. Indoor Air. 2010;20(1):2–16. doi: 10.1111/j.1600-0668.2009.00621.x. [DOI] [PMC free article] [PubMed] [Google Scholar]
- 30.Chen S.-C., Chang C.-F., Liao C.-M. Predictive models of control strategies involved in containing indoor airborne infections. Indoor Air. 2006;16(6):469–481. doi: 10.1111/j.1600-0668.2006.00443.x. [DOI] [PubMed] [Google Scholar]
- 31.Liao C.-M., Lin Y.-J., Cheng Y.-H. Modeling the impact of control measures on tuberculosis infection in senior care facilities. Build Environ. 2013;59:66–75. [Google Scholar]
- 32.Hinds W.C. Wiley-Interscience; 1999. Aerosol technology: properties, behavior, and measurement of airborne particles. [Google Scholar]
- 33.Nazaroff W.W. Indoor particle dynamics. Indoor Air. 2004;14(s7):175–183. doi: 10.1111/j.1600-0668.2004.00286.x. [DOI] [PubMed] [Google Scholar]
- 34.Fisk W. Commentary on predictive models of control strategies involved in containing indoor airborne infections. Indoor Air. 2007;16:469–481. doi: 10.1111/j.1600-0668.2006.00443.x. [DOI] [PubMed] [Google Scholar]
- 35.Nicas M., Nazaroff W.W., Hubbard A. Toward understanding the risk of secondary airborne infection: emission of respirable pathogens. J Occup Environ Hyg. 2005;2(3):143–154. doi: 10.1080/15459620590918466. [DOI] [PMC free article] [PubMed] [Google Scholar]
- 36.ASHRAE. Standard 52.2 . American Society of Heating, Refrigerating and Air-Conditioning Engineers; 2007. Method of testing general ventilation air-cleaning devices for removal efficiency by particle size. [Google Scholar]
- 37.Lai A.C.K., Nazaroff W.W. Modeling indoor particle deposition from turbulent flow onto smooth surfaces. J Aerosol Sci. 2000;31(4):463–476. [Google Scholar]
- 38.Benbough J.E. Some factors affecting the survival of airborne viruses. J Gen Virol. 1971;10(3):209–220. doi: 10.1099/0022-1317-10-3-209. [DOI] [PubMed] [Google Scholar]
- 39.Yang W., Marr L.C. Dynamics of airborne influenza a viruses indoors and dependence on humidity. PLoS ONE. 2011;6(6):e21481. doi: 10.1371/journal.pone.0021481. [DOI] [PMC free article] [PubMed] [Google Scholar]
- 40.Kowalski W.J., Bahnfleth W.P. Airborne respiratory diseases and mechanical systems for control of microbes. HPAC Eng. 1998:34–48. [Google Scholar]
- 41.Kowalski W.J., Bahnfleth W.P. Airborne-microbe filtration in indoor environments. HPAC Eng. 2002:57–69. [Google Scholar]
- 42.Nardell E.A. McGraw-Hill; New York, NY: 2001. Chapter 11: disinfecting air. (Indoor air quality handbook). [Google Scholar]
- 43.Verreault D., Moineau S., Duchaine C. Methods for sampling of airborne viruses. Microbiol Molr Biol Rev. 2008;72(3):413–444. doi: 10.1128/MMBR.00002-08. [DOI] [PMC free article] [PubMed] [Google Scholar]
- 44.Chen C., Zhao B. Some questions on dispersion of human exhaled droplets in ventilation room: answers from numerical investigation. Indoor Air. 2010;20(2):95–111. doi: 10.1111/j.1600-0668.2009.00626.x. [DOI] [PubMed] [Google Scholar]
- 45.Fabian P., Brain J., Houseman E.A., Gern J., Milton D.K. Origin of exhaled breath particles from healthy and human rhinovirus-infected subjects. J Aerosol Med Pulmon Drug Del. 2011;24(3):137–147. doi: 10.1089/jamp.2010.0815. [DOI] [PMC free article] [PubMed] [Google Scholar]
- 46.Fabian P., McDevitt J.J., DeHaan W.H., Fung R.O.P., Cowling B.J., Chan K.H. Influenza virus in human exhaled breath: an observational study. PLoS ONE. 2008;3(7):e2691. doi: 10.1371/journal.pone.0002691. [DOI] [PMC free article] [PubMed] [Google Scholar]
- 47.Lindsley W.G., Pearce T.A., Hudnall J.B., Davis K.A., Davis S.M., Fisher M.A. Quantity and size distribution of cough-generated aerosol particles produced by influenza patients during and after Illness. J Occ Environ Hygiene. 2012;9(7):443–449. doi: 10.1080/15459624.2012.684582. [DOI] [PMC free article] [PubMed] [Google Scholar]
- 48.Morawska L., Johnson G.R., Ristovski Z.D., Hargreaves M., Mengersen K., Corbett S. Size distribution and sites of origin of droplets expelled from the human respiratory tract during expiratory activities. J Aerosol Sci. 2009;40(3):256–269. doi: 10.1016/j.jaerosci.2008.10.003. [DOI] [PMC free article] [PubMed] [Google Scholar]
- 49.Papineni R.S., Rosenthal F.S. The size distribution of droplets in the exhaled breath of healthy human subjects. J Aerosol Med. 1997;10(2):105–116. doi: 10.1089/jam.1997.10.105. [DOI] [PubMed] [Google Scholar]
- 50.Yang S., Lee G.W.M., Chen C.-M., Wu C.-C., Yu K.-P. The size and concentration of droplets generated by coughing in human subjects. J Aerosol Med. 2007;20(4):484–494. doi: 10.1089/jam.2007.0610. [DOI] [PubMed] [Google Scholar]
- 51.Lindsley W.G., Blachere F.M., Davis K.A., Pearce T.A., Fisher M.A., Khakoo R. Distribution of airborne influenza virus and respiratory syncytial virus in an urgent care medical clinic. Clin Infect Dis. 2010;50(5):693–698. doi: 10.1086/650457. [DOI] [PubMed] [Google Scholar]
- 52.Blachere F.M., Lindsley W.G., Pearce T.A., Anderson S.E., Fisher M., Khakoo R. Measurement of airborne influenza virus in a hospital emergency department. Clin Infect Dis. 2009;48(4):438–440. doi: 10.1086/596478. [DOI] [PubMed] [Google Scholar]
- 53.Lindsley W.G., Blachere F.M., Thewlis R.E., Vishnu A., Davis K.A., Cao G. Measurements of airborne influenza virus in aerosol particles from human coughs. PLoS One. 2010;5(11):e15100. doi: 10.1371/journal.pone.0015100. [DOI] [PMC free article] [PubMed] [Google Scholar]
- 54.Yang W., Elankumaran S., Marr L.C. Concentrations and size distributions of airborne influenza A viruses measured indoors at a health centre, a day-care centre and on aeroplanes. J R Soc Interface. 2011;8(61):1176–1184. doi: 10.1098/rsif.2010.0686. [DOI] [PMC free article] [PubMed] [Google Scholar]
- 55.Noti J.D., Lindsley W.G., Blachere F.M., Cao G., Kashon M.L., Thewlis R.E. Detection of infectious influenza virus in cough aerosols generated in a simulated patient examination room. Clin Infect Dis. 2012;54(11):1569–1577. doi: 10.1093/cid/cis237. [DOI] [PMC free article] [PubMed] [Google Scholar]
- 56.Stephens B., Siegel J.A. Comparison of test methods for determining the particle removal efficiency of filters in residential and light-commercial central HVAC systems. Aerosol Sci Technol. 2012;46(5):504–513. [Google Scholar]
- 57.Waring M.S., Siegel J.A. Particle loading rates for HVAC filters, heat exchangers, and ducts. Indoor Air. 2008;18(3):209–224. doi: 10.1111/j.1600-0668.2008.00518.x. [DOI] [PubMed] [Google Scholar]
- 58.Hecker R., Hofacre K.C. Office of Research and Development/National Homeland Security Research Center Research Triangle Park, NC: U.S. Environmental Protection Agency; 2008. Development of performance data for common building air cleaning devices. Report No. EPA/600/R-08/013. [Google Scholar]
- 59.Lai A.C.K. Particle deposition indoors: a review. Indoor Air. 2002;12(4):211–214. doi: 10.1034/j.1600-0668.2002.01159.x. [DOI] [PubMed] [Google Scholar]
- 60.He C., Morawska L., Gilbert D. Particle deposition rates in residential houses. Atmos Environ. 2005;39(21):3891–3899. [Google Scholar]
- 61.Riley W.J., McKone T.E., Lai A.C.K., Nazaroff W.W. Indoor particulate matter of outdoor origin: importance of size-dependent removal mechanisms. Environ Sci Technol. 2002;36(2):200–207. doi: 10.1021/es010723y. [DOI] [PubMed] [Google Scholar]
- 62.ASHRAE. Standard 62.1 . American Society of Heating, Refrigerating and Air-Conditioning Engineers; 2010. Ventilation for acceptable indoor air quality. [Google Scholar]
- 63.Persily A., Gorfain J. National Institute of Standards and Technology (NIST); 2004. Analysis of ventilation data from the U.S. Environmental protection agency building assessment survey and evaluation (BASE) study. Report No. NISTIR 7145. [Google Scholar]
- 64.U.S. EPA, editor. Exposure factors handbook. U.S. Environmental Protection Agency; Washington, DC: 2011. http://www.epa.gov/ncea/efh National Center for Environmental Assessment; 2011 Report No. EPA/600/R-09/052F. Available from: [Google Scholar]
- 65.Orme M. Estimates of the energy impact of ventilation and associated financial expenditures. Energy Build. 2001;33(3):199–205. [Google Scholar]
- 66.Sherman M., Matson N. Airtightness of U.S. dwellings. ASHRAE Trans. 1997;103(1):717–730. [Google Scholar]
- 67.Deru M., Field K., Studer D., Benne K., Griffith B., Torcellini P. National Renewable Energy Lab (NREL); Golden, CO: 2011. U.S. Department of energy commercial reference building models of the national building stock. Report No. NREL/TP-5500–46861. [Google Scholar]
- 68.NREL . 2013. National solar radiation data base [Internet]http://rredc.nrel.gov/solar/old_data/nsrdb/1991-2005/tmy3/ (1991–2005 Update: typical meteorological year 3). Available from: [Cited 2013] [Google Scholar]
- 69.Stephens B., Siegel J.A., Novoselac A. Energy implications of filtration in residential and light-commercial buildings (RP-1299) ASHRAE Trans. 2010;116(1):346–357. [Google Scholar]
- 70.Bekö G., Clausen G., Weschler C. Is the use of particle air filtration justified? Costs and benefits of filtration with regard to health effects, building cleaning and occupant productivity. Build Environ. 2008;43(10):1647–1657. [Google Scholar]
- 71.Jones R.M., Adida E. Influenza infection risk and predominate exposure route: uncertainty analysis. Risk Anal. 2011;31(10):1622–1631. doi: 10.1111/j.1539-6924.2011.01600.x. [DOI] [PubMed] [Google Scholar]
- 72.Nicas M., Sun G. An integrated model of infection risk in a health-care environment. Risk Anal. 2006;26(4):1085–1096. doi: 10.1111/j.1539-6924.2006.00802.x. [DOI] [PubMed] [Google Scholar]
- 73.Jones R.M., Masago Y., Bartrand T., Haas C.N., Nicas M., Rose J.B. Characterizing the risk of infection from mycobacterium tuberculosis in commercial passenger aircraft using quantitative microbial risk assessment. Risk Anal. 2009;29(3):355–365. doi: 10.1111/j.1539-6924.2008.01161.x. [DOI] [PubMed] [Google Scholar]