

Abstract
This study reports a new immunomagnetic bead-based microfluidic system for the rapid detection of influenza A virus infection by performing a simple two-step diagnostic process that includes a magnetic bead-based fluorescent immunoassay (FIA) and an end-point optical analysis. With the incorporation of monoclonal antibody (mAb)-conjugated immunomagnetic beads, target influenza A viral particles such as A/H1N1 and A/H3N2 can be specifically recognized and are bound onto the surface of the immunomagnetic beads from the specimen sample. This is followed by labeling the fluorescent signal onto the virus-bound magnetic complexes by specific developing mAb with R-phycoerythrin (PE). Finally, the optical intensity of the magnetic complexes can be analyzed immediately by the optical detection module. Significantly, the limit of detection (LOD) of this immunomagnetic bead-based microfluidic system for the detection of influenza A virus in a specimen sample is approximately 5 × 10⁻⁴ hemagglutin units (HAU), which is 1024 times better than compared to conventional bench-top systems using flow cytometry. More importantly, the entire diagnostic protocol, from the purification of target viral particles to optical detection of the magnetic complexes, can be automatically completed within 15 min in this immunomagnetic bead-based microfluidic system, which is only 8.5% of the time required when compared to a manual protocol. As a whole, this microfluidic system may provide a powerful platform for the rapid diagnosis of influenza A virus infection and may be extended for diagnosis of other types of infectious diseases with a high specificity and sensitivity.
Abbreviations: 2D, two-dimensional; 3D, three-dimensional; a.u., arbitrary unit; AIDS, acquired immunodeficiency syndrome; AIV, avian influenza virus; BP, band-pass; BSA, bovine serum albumin; CDC, Center for Disease Control; CFT, complement fixation test; DI, deionized; DV, dengue virus; DC, direct current; DMEM, Dulbecco's modified eagle's medium; ELISA, enzyme-linked immunosorbent assay; EV, enterovirus; F/P, fluorochrome per mole of protein; FIA, fluorescent immunoassay; HA, hemagglutinin; HAU, hemagglutin unit; HI, hemagglutination inhibition; IF, immunofluorescence; IU, international unit; LOD, limit of detection; LP, long-pass; mAb, monoclonal antibody; MEMS, micro-electro-mechanical-systems; NA, neuraminidase; NP, nucleoprotein; PBS, phosphate-buffered saline; PCR, polymerase chain reaction; PDMS, polydimethylsiloxane; PE, R-phycoerythrin; PFU, plaque-forming unit; PMT, photo-multiplier tube; RT-PCR, reverse-transcription polymerase chain reaction; S, streptavidin; SARS, severe acute respiratory syndrome
Keywords: Influenza virus, Magnetic bead, Fluorescent immunoassay, Microfluidics, MEMS
1. Introduction
Emerging, extremely contagious, infectious diseases caused by viruses such as severe acute respiratory syndrome (SARS), acquired immunodeficiency syndrome (AIDS), dengue fever and influenza have concerned public health organizations in recent years. Among them, influenza infection, which is induced by the influenza virus presented in the aerosols generated by sneezing and coughing, has been reported as a contagious disease of mainly the upper respiratory tract. It may cause acute respiratory tract infection in humans and severe morbidity, especially in the elderly and children (Stockton et al., 1998). Human influenza virus is either type A or B; the influenza A virus is further classified into several subtypes such as A/H1N1, A/H1N3 based on the hemagglutinin (HA) and neuraminidase (NA) glycoproteins present in the viral envelope (Uyeki, 2003). Particularly, influenza A viruses are among the most virulent pathogens that could cause devastating outbreaks and give rise to human influenza pandemics (Hay et al., 2001). For example, a novel influenza strain combined with the genes from humans and pigs, which was dubbed the “swine flu” and is also known as influenza A/H1N1, has emerged in Mexico, the United States and several other nations, causing fears of a severe worldwide pandemic (Chowell et al., 2009). In addition to effective vaccines, tools that enable fast, accurate, and sensitive diagnosis of influenza viruses are greatly needed during the early stage of infections, such that the epidemic spread of influenza infections can be quarantined and controlled.
As a consequence, the ability to rapidly diagnosis for the presence of the influenza virus during the acute phase of the infection is essential in order to provide immediate and appropriate clinical treatment and to enact quarantine procedures. Recently, a number of diagnostic methods for the detection of the influenza virus, such as a culture, an immunofluorescence (IF) assay (Shibata et al., 2009), an enzyme-linked immunosorbent assay (ELISA) (Sala et al., 2003), a real-time polymerase chain reaction (PCR) assay (Boivin et al., 2004), a serological hemagglutination inhibition (HI) assay (Swayne et al., 2007) and a complement fixation test (CFT) (de Ory et al., 2004) have been developed. Among them, the molecular diagnostic assays such as PCR and polymerase chain reaction reverse transcription (RT-PCR) for the detection of influenza infection provides a highly sensitive and selective diagnosis protocol. However, these protocols are usually complicated and relatively costly. They also require a lengthy process and expensive apparatus to perform the entire process. Also, ELISA is an alternative, well-recognized, serological diagnostic method for the detection of influenza infection (Chomel et al., 1989, Zhang et al., 2006). The principle behind the immunological diagnosis is based on the detection of color change in or fluorescence of secondary antibodies, which are specific to the target pathogens. However, a conventional ELISA is usually performed on two-dimensional (2D) 96-well plates, which involves a series of tedious processes such as incubation and washing steps. This makes it a time-consuming (over 4 h) and labor-intensive process that requires well-trained personnel to precisely perform the protocol. The sensitivity of the conventional ELISA is not satisfactory since the antibody is coated onto the 2D plate, which is the limiting factor for the binding capacity to the target antigens. A more sensitive immunological detection technique is urgently needed.
Three-dimensional (3D) microsphere surfaces modified with functional groups for immunological diagnosis resulting in a high sensitivity has attracted considerable interest in recent years (Hendry and Herrmann, 1983, Leikina et al., 2004, Yan et al., 2005). The binding capacity of a specific antibody can be increased using a 3D solid-phase immunoassay and, therefore, increase the detection sensitivity. For example, a microsphere-based, flow-cytometric immunoassay for the detection of influenza viruses was found to have a 10-fold lower detection limit than traditional ELISA (Yan et al., 2005). Another fluorophore-DNA-barcode-based immunoassay with the target avian influenza virus sandwiched between magnetic immunoprobes and barcode-carrying immunoprobes has also been demonstrated recently (Cao et al., 2010). Its detection sensitivity was comparable to that of conventional RT-PCR. More importantly, it is less time-consuming (<2 h for the entire detection protocol). Nevertheless, it still presents a challenge for the rapid identification and accurate diagnosis of influenza infection using these state-of-the-art diagnostic techniques since several tedious purification processes and manual operation are always required, especially to prevent the spread of infection in resource-limited regions without the support of reference laboratories (Koh et al., 2008). Therefore, there is a great need to develop an easy-to-use, sample-to-answer platform for rapid and automatic detection of influenza infection with a high sensitivity and selectivity.
Recently, several bead-based assays incorporated with microfluidic systems have been demonstrated for biomedical applications (Szurdoki et al., 2001, Huang et al., 2002, Fuentes et al., 2004, Kartalov et al., 2006, Lien et al., 2007). Consequently, various bead-based immunoassays implemented on microfluidic systems have been reported recently (Vignali, 2000, Fernández-Lafuente and Guisán, 2006, Yang et al., 2008). Generally speaking, bead-based immunoassays have several advantages over substrate-based assays. In addition to their sample purification and concentration capabilities enabled by applying external magnetic fields, micro-beads have a 3D structure which increases the surface-to-volume ratio, thus providing more binding sites for target molecules or pathogens. Furthermore, surface modification of a microfluidic device has been reported to enhance the sensitivity and selectivity of an immunoassay (Vignali, 2000, Bai et al., 2006). Still, several lengthy off-chip sample pre-treatment processes are necessary to purify the samples prior to use and bulky equipment is normally required, thus hindering the practical applications of the proposed assays for clinical diagnosis. In this study, a microfluidic diagnostic assay incorporated with a 3D magnetic-bead-based FIA and an optical detection module for influenza A virus purification, concentration, collection and detection is proposed. The entire diagnostic process can be completed within approximately 15 min with little human intervention.
2. Materials and methods
The diagnostic assay is carried out utilizing simple two-step operating processes, namely (1) a magnetic bead-based FIA for capturing the target virus from samples and (2) an end-point, optical analysis process for detecting fluorescent-anti-virus Ab-virus-anti-virus Ab-conjugated magnetic complexes. The entire diagnostic assay for influenza infection can be automatically performed rapidly in the suction-type microfluidic system. Efficient FIA via the on-chip incubation process can be realized by utilizing a swirling flow within a mixing chamber generated by a suction-type, pneumatically driven, vortex-type micro-mixer. Furthermore, this is also the first work that demonstrates the rapid identification of influenza A infection from samples with a high sensitivity and specificity within 15 min. Hence, the proposed microfluidic diagnostic assay incorporated with specific mAbs-conjugated magnetic beads and FIA may provide a multi-functional platform for the rapid diagnosis of influenza infection and further infectious diseases with little required human intervention.
2.1. Working principle
Fig. 1 is a schematic illustration of the working principle behind the immunomagnetic bead-based assay for the rapid detection of influenza A virus infection. By utilizing the specific mouse anti-influenza nucleoprotein (NP) mAbs-conjugated magnetic beads, target influenza A viral particles in the specimen sample are recognized and then adhere onto the surface of the magnetic beads during the incubation process prior to the on-chip diagnostic process. The surfaces of the magnetic beads are covered with an epoxy layer which is utilized to conjugate the primary capture mAb. Next, another developing mouse anti-influenza NP mAb labeled with PE is incubated with the virus-holding magnetic complexes in a second incubation process, followed by analyzing the fluorescent signals from the magnetic bead-based FIA via the integrated optical detection module. The sandwich-like structure of the immunomagnetic bead-based assay is schematically illustrated in Fig. 1(h).
Fig. 1.
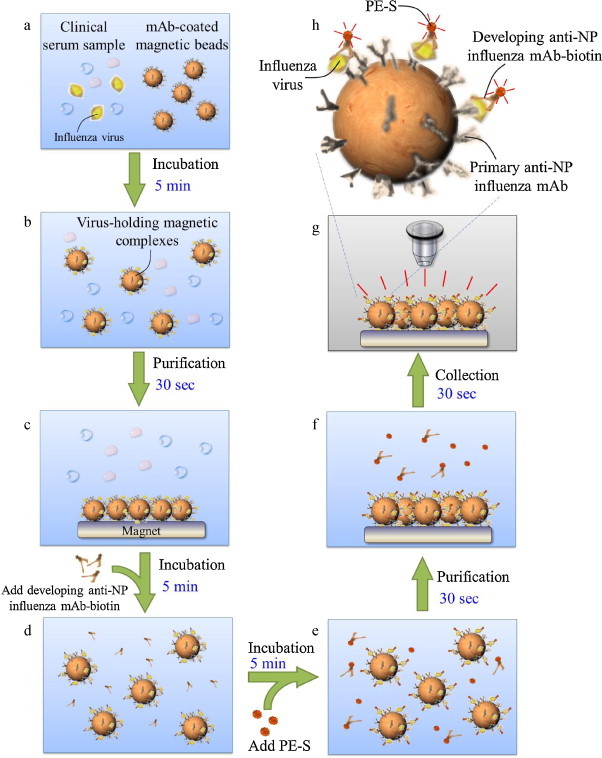
Schematic illustration of the protocol for sample pretreatment and optical detection of influenza viral particles by using the mAb-coated magnetic beads in the microfluidic system. (a) Load the clinical sample and the mAb-coated magnetic beads; (b) target viruses adhere onto the surface of the magnetic beads; (c) concentrate the magnetic complexes using a permanent magnet; (d) developing mAb adheres onto the magnetic complexes; (e) fluorescent dye (PE) is labeled onto the magnetic complexes; (f) concentrate the magnetic complexes using the permanent magnet; (g) optical analysis of the purified magnetic complexes; (h) schematic illustration of the sandwich-like magnetic bead-based FIA for rapid detection of the influenza virus.
In general, by utilizing the high affinity between the antibodies and the antigens (Harmon et al., 1986, Wrammert et al., 2008), viruses in the clinical samples (i.e., whole blood, serum or saliva) can be captured by the anti-virus mAb-bound magnetic beads with a high selectivity. The primary anti-virus mAb is conjugated to the magnetic beads and is refrigerated at 4 °C prior to the on-chip FIA processes. The clinical serum sample, the washing buffer, the developing anti-virus mAb-biotin reagent and the PE-streptavidin (S) conjugates are loaded into the sample loading chamber, the washing buffer chamber, the developing mAb chamber and the PE chamber, respectively, followed by loading the mAb-conjugated magnetic beads into the sample loading chamber (Fig. 1(a)). An initial incubation process is employed to mix the clinical serum with the mAbs-bound magnetic beads so that target influenza viral particles can be recognized and become attached onto the mAbs-bound magnetic beads to form the virus-bound magnetic complexes (Fig. 1(b)). This is followed by purifying and isolating the virus-conjugated magnetic complexes using a magnetic field generated by an external permanent magnet located underneath the mixing chamber and a microfluidic control module driven by a vacuum source. After that, a washing process is performed using both the permanent magnet and the microfluidic control module to wash away all the un-bound materials in the clinical samples, so that the virus-bound magnetic complexes are successfully isolated from the specimen sample (Fig. 1(c)). Then, the purified virus-bound magnetic complexes are re-suspended into a volume of 20 μL and the developing mAb fluorescent conjugates are then injected into the mixing chamber. This is followed by a second incubation process which binds the developing mouse anti-influenza NP mAb-biotin with the virus-conjugated magnetic complexes (Fig. 1(d)), and then followed by repeatedly washing 3 times to rinse any un-bound developing mAb away. Next, the PE-S conjugates are pumped into the mixing chamber to perform a third incubation process for the labeling of a fluorescent dye onto the magnetic complexes (Fig. 1(e)). Then, a final washing step is performed to flush away other interferent materials and any un-bound PE-S molecules (Fig. 1(f)). Finally, the sandwich-like magnetic bead complexes are then re-suspended into a smaller volume (10 μL) within the “optical detection chamber” where the fluorescent signal can be excited and analyzed by an external optical detection module (Fig. 1(g)). Detailed information about the on-chip experimental procedures of the immunomagnetic bead-based microfluidic assay including the reaction volume of the samples, the reaction time and the operating conditions for the microfluidic systems can be found in Table 1 .
Table 1.
Details of the operation conditions of the microfluidic diagnostic assay.
| Step | Operation process | Sample volume | On-chip operation condition | Reaction time |
|---|---|---|---|---|
| I | Load the mAb-conjugated magnetic beads (8 × 10⁵ beads) in the sample loading chamber | 20 μL | ||
| Load specimen sample in the sample loading chamber | 25 μL | |||
| Load the washing buffer in the washing buffer chamber | 100 μL | |||
| Load developing mouse anti-influenza NP mAb-biotin in the developing mAb chamber. | 20 μL | |||
| Load PE-S conjugates in the PE chamber | 20 μL | |||
| II | Mix the sample with the mAb-magnetic beads by using the suction-type micro-mixer | −80 kPa and 4.0 Hz for the micro-mixer | 5 min | |
| III | Attach the permanent magnet onto the bottom surface of the mixing chamber to attract the well-mixed magnetic complexes. | 5 s | ||
| Suck all the other substances in the biological solution away into the waste chamber by the vacuum pump | −80 kPa for the vacuum pump | 5 s | ||
| Pump the washing buffer into the mixing chamber and re-suspend the magnetic complexes in 20 μL | 20 μL | −80 kPa for sample transport unit | ||
| IV | Attach the permanent magnet onto the bottom surface of the mixing chamber to attract the re-suspended magnetic complexes | 5 s | ||
| Suck all the other substances in the sample away into the waste chamber by the vacuum pump | −80 kPa for the vacuum pump | 5 s | ||
| V | Pump the developing mouse anti-influenza NP mAb-biotin into the mixing chamber | 20 μL | −80 kPa for sample transport unit | |
| Mix the magnetic complexes with developing mouse anti-influenza NP mAb-biotin by using the suction-type micro-mixer | −80 kPa and 4.0 Hz for the micro-mixer | 5 min | ||
| VI | Attach the permanent magnet onto the bottom surface of the mixing chamber to attract the well-mixed magnetic complexes | 5 s | ||
| Suck all the other substances in the biological solution away into the waste chamber by the vacuum pump | −80 kPa for the vacuum pump | 5 s | ||
| Pump the washing buffer into the mixing chamber and re-suspend the magnetic complexes in 20 μL | 20 μL | −80 kPa for sample transport unit | ||
| VII | Attach the permanent magnet onto the bottom surface of the mixing chamber to attract the re-suspended magnetic complexes | 5 s | ||
| Suck all the other substances in the bio-sample away into the waste chamber by the vacuum pump | −80 kPa for the vacuum pump | 5 s | ||
| VIII | Pump the PE-SA conjugates into the mixing chamber | 20 μL | −80 kPa for sample transport unit | |
| Mix the magnetic complexes with PE-SA conjugates by using the suction-type micro-mixer | −80 kPa and 4.0 Hz for the micro-mixer | 5 min | ||
| IX | Attach the permanent magnet onto the bottom surface of the mixing chamber to attract the well-mixed magnetic complexes | 5 s | ||
| Suck all the other substances in the biological solution away into the waste chamber by the vacuum pump | −80 kPa for the vacuum pump | 5 s | ||
| Pump the washing buffer into the mixing chamber and re-suspend the magnetic complexes in 20 μL | 20 μL | −80 kPa for sample transport unit | ||
| X | Attach the permanent magnet onto the bottom surface of the mixing chamber to attract the re-suspended magnetic complexes | 5 s | ||
| Suck all the other substances in the bio-sample away into the waste chamber by the vacuum pump | −80 kPa for the vacuum pump | 5 s | ||
| XI | Pump the PBS buffer into the mixing chamber to complete the FIA process | 10 μL | −80 kPa for sample transport unit | |
| Analyze the optical signals of the magnetic complexes by utilizing the optical detection module | 5 s | |||
2.2. Virus strains and the specimen sample
Four influenza A virus types including two strains of influenza A/H1 (subtype of H1N1, 89N364H1 and 97N510H1) and two strains of influenza A/H3 (subtype of H3N2, 97N50H3 and 90N225H3) are used to verify the performance of the developed microfluidic system. The initial titers of the virus stock are 128HAU/25 μL. In addition, four other different types of viruses including influenza B (90N2335IB), dengue virus (DV, 1.25 × 10⁶ plaque-forming unit (PFU)/mL), enterovirus-71 (EV-71, 1.25 × 10⁶ PFU/mL) and hepatitis B virus (HBV, 1.5 × 10⁶ international unit (IU)/mL) are employed for the verification of the selectivity of the immunomagnetic bead-based microfluidic assay. All the tested influenza viral strains are cultured in Dulbecco's Modified Eagle's Medium (DMEM, Invitrogen, USA) with 2 μg/mL of Trypsin (TPCK treated from bovine pancreas, Sigma–Aldrich, USA) at 37 °C for 2–3 days, followed by harvesting the supernatant from the cultured medium for quantitative determination of viral concentration by HA testing (Schild et al., 1972). Details of the HA testing can be found in the SI. The viral sample solutions with an initial concentration of 1:128 (128HAU/25 μL) are stored at −80 °C. Finally, viral samples can be re-suspended and are mixed with the clinical specimens such as whole blood, serum or saliva as to mimic samples with a total volume of 20 μL prior to the on-chip diagnostic assay. Note that all the clinical specimen samples have been obtained from the Virus Laboratory, National Cheng Kung University Hospital, Tainan, Taiwan.
2.3. Preparation of immunomagnetic beads and immunoassay reagents
Magnetic beads (Dynabeads®M-450 Epoxy, Invitrogen, USA) with surfaces covered with epoxy groups are treated with the primary mouse anti-influenza NP mAb. The epoxide of the magnetic microsphere can be used to immobilize specific mAb onto the surface of the magnetic beads (Ø = 4.5 μm, concentration = 4 × 10⁸ beads/mL). The mAb-conjugated magnetic beads are prepared as follows: 1 μg of primary mouse anti-influenza NP mAb (HB-65, American Type Culture Collection (ATCC), USA) is conjugated with 2 μL of magnetic beads in a phosphate-buffered saline (1× PBS, Invitrogen, USA) solution with a total volume of 500 μL for 18 h at 4 °C, followed by purifying and re-suspending the mAb-coated magnetic beads in 20 μL of PBS. Next, a blocking process is then performed at 4 °C for 2 h by incubating the mAb-coated magnetic beads with the blocking solution (1× PBS with 1%(w/v) bovine serum albumin (BSA, Sigma, USA)) to prevent non-specific binding in later immunological processing. Finally, the mAb-coated magnetic beads are stored at 4 °C prior to the FIA processes.
25 μL of influenza virus and 20 μL of mAb-coated magnetic beads (8 × 10⁵ beads) are first loaded into the sample loading chamber. This is then followed by incubating them for 5 min utilizing the suction-type microfluidic system to form the virus-bound magnetic complexes. After the washing process, 20 μL of the developing mouse anti-influenza NP mAb-biotin (0.05 μg/μL, ATCC, USA) and 20 μL of the PE-S conjugates (2.5 ng/μL, eBioscience, USA) are utilized for the immunological detection of the influenza viral samples. Details of the operating conditions for the microfluidic assay can be found in the following sections.
2.4. Microfluidic assay
A suction-type, pneumatically driven microfluidic system integrated with a sample transportation unit and normally closed micro-valves has been designed and fabricated to automatically perform the entire process (Fig. 2 ). Optimal design parameters and the working principle of each module can be found in the supplemental information. The entire diagnostic process can be completed in approximately 15 min, in an automatic manner.
Fig. 2.
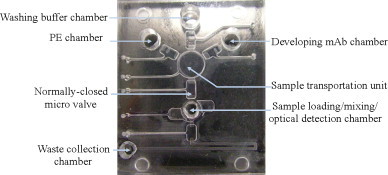
A photograph of the prototype suction-type microfluidic system. The dimensions of the microfluidic system are measured to be 33 mm × 38 mm.
Accordingly, immunomagnetic bead-based FIA can be carried out automatically in the suction-type microfluidic system with a high sensitivity. 25 μL of a specimen sample with 20 μL of mAbs-conjugated magnetic beads (8 × 10⁵ beads), a washing buffer (1× PBS with 0.1%(w/v) BSA, pH = 7.4) with 50 μL, 20 μL of developing mouse anti-influenza NP mAb-biotin reagent and 20 μL of PE-S conjugates are first loaded into the sample loading chamber, washing buffer chamber, developing mAb chamber and PE chamber, respectively (as is shown in Fig. 2). This is followed by activating the vortex-type micro-mixer for 5 min (with an applied air pressure (P) of −80 kPa (gauge pressure) and at a driving frequency (f d) of 4.0 Hz), such that the virus-bound magnetic complexes are formed within the mixing chamber. Afterwards, any interferent substances remaining in the biological solution are evacuated to the waste chamber by an external vacuum pump along with the use of a permanent magnet. A washing process is then carried out by pumping the washing buffer into the sample loading/mixing/optical detection chamber at a flow rate of 200 μL/min by utilizing the sample transportation unit, followed by transporting 20 μL of developing mAb-biotin reagent to the mixing chamber at a flow rate of 400 μL/min. Next, a second incubation process is performed for another 5 min (P = −80 kPa, f d = 4.0 Hz) to let the developing mAb-biotin attach onto the surface of the virus-bound magnetic complexes, followed by repeating the washing process described above. 20 μL of PE-S is then transported into the mixing chamber for a third incubation process. The fluorochrome conjugates are then labeled onto the magnetic complexes via the affinity between the biotin and SA. Finally, the magnetic complexes are washed and are re-suspended into a volume of 10 μL for the end-point optical analysis utilizing the optical detection module.
2.5. Optical analysis
An external optical detection module comprised of a photo-multiplier tube (PMT, R928, Hamamatsu, Japan), a mercury lamp (MODEL C-SHG1, Nikon, Japan), a set of optical components including three fluorescence filters (Nikon G-2A, Nikon, Japan), one collimation lens and one objective lens (Nikon LU Plan 10×/0.30 A, Nikon, Japan) is employed in this proposed microfluidic FIA (as shown in Supplemental Fig. 5 in the SI). The light source from the mercury lamp is first directed through an excitation band-pass (BP) filter (535/25BP, Nikon, Japan) and is used to excite the fluorescent PE dye labeled on the magnetic complexes. The emitted fluorescent signals from the PE dye are then directed through a dichromatic mirror with a cut-off wavelength of 565 nm (Nikon, Japan), followed by filtering out any other fluorescent signals that are excited from the magnetic complexes utilizing another barrier filter (590 long-pass (LP), Nikon, Japan). Only signals with wavelengths greater than 590 nm can pass through and be detected by the PMT. With this approach, high-sensitivity detection of the influenza viruses can be achieved. Moreover, a standard curve for semi-quantitative analysis of viral particles has been explored by optically analyzing the isolated viral samples with concentrations ranging from 1:128 with a 4−2 dilution (8 HAU) to 1:128 with 4−10 dilution (1.25 × 10⁻⁴ HAU). Consequently, the optical signal from the microfluidic diagnostic assay can be immediately detected and be referenced to a standard curve for the semi-quantitative detection of influenza infection.
3. Results and discussion
3.1. Optimization of the microfluidic diagnostic assay
In this developed microfluidic diagnostic assay, an optimization of the diagnostic protocol is first performed. The optimum design parameters have been applied in the construction of this microfluidic system according to our previous work (Weng et al., 2010). Detailed information about the characteristics of each microfluidic component and the respective optimal operating conditions of each module can be found in the SI. Therefore, the entire diagnostic protocol for the detection of influenza can be then carried out automatically by this optimized microfluidic assay within a short period of time.
In order to optimize the microfluidic diagnostic assay, three major processes including the first incubation process between the specimen samples with influenza viruses and the mAb-conjugated magnetic beads, the second incubation process between the developing mAb and the virus-bound magnetic complexes and the final incubation process for the PE-S labeling onto the magnetic complexes is verified by incubating the magnetic complexes for different incubation periods. Well-mixed incubation can be generated using the suction-type micro-mixer by deforming and releasing the polydimethylsiloxane (PDMS) membranes of the micro-mixer at P = −80 kPa and f d = 4.0 Hz. The isolated influenza virus A/H3 (97N50H3) with a concentration of 1:128 with 4−4 dilution (8 HAU) is used for the optimization of the three incubation processes. The experimental verification of these optimum conditions during the diagnostic process (as shown in Supplemental Fig. 8 in SI) is also compared with the results from conventional bench-top systems (a large-scale shaker (INTELLI-MIXER, ELMI Ltd., Latvia) and a permanent magnetic concentrator (DynaMag™-2, Invitrogen, USA)) using a manual preparation protocol (as shown in Supplemental Fig. 9 in the SI). The mixing between the mAb-conjugated magnetic beads and the specimen samples is one of the most critical processes for the diagnosis of the influenza infections. It can be clearly seen from the results that it only takes 5 min to reach a saturated fluorescent intensity (631.1 ± 65.1 mV, n = 3) by utilizing this microfluidic assay under optimum operating conditions (P = −80 kPa, f d = 4.0 Hz) during the first incubation process. In comparison, the conventional bench-top systems may need more than 60 min to reach a fluorescent intensity of 695.6 ± 75.7 mV (n = 3). Furthermore, the other two major incubation steps are also verified using the suction-type micro-mixer and it only takes 5 min for the second and third incubation step to achieve maximum fluorescent intensities of 603.5 ± 78.9 mV and 662.3 ± 62.1 mV (n = 3), respectively, while the traditional method using a large-scale shaker requires more than 60 min for each incubation process. As a result, this proposed microfluidic diagnostic assay for the rapid detection of influenza virus can perform each incubation process in 5 min within the suction-type microfluidic system. Consequently, the entire automated diagnostic assay can be completed in approximately 15 min in this microfluidic FIA. The total reaction time required for this microfluidic assay is only 8.5% of the time as compared to a manually operated bench-top system (more than 3 h).
3.2. Specificity
The high specificity of the proposed microfluidic diagnostic assay has been verified since only target influenza A viral particles are recognized and adhere onto the surface of the mAb-conjugated magnetic beads. The specificity of the developed microfluidic diagnostic assay is verified by utilizing different viral samples including influenza A/H1, influenza A/H3, influenza B, DV, EV-71, and HBV. PBS is used as the negative control (NC) for the microfluidic diagnostic assay and its optical signal can be regarded as the noise level. The entire diagnostic processes including the target virus purification and the conjugation of fluorescent dye onto the developing mAb is performed automatically, followed by analyzing the optical signals from the purified magnetic complexes via the optical detection module. Fig. 3 shows the high specificity for the detection of influenza A virus from the different types of viral samples. The data show that the optical intensities of influenza A/H1 and A/H3 are 1906.5 mV and 2139.1 mV, respectively, while the fluorescent intensities of the HB, DV, EV-71, HBV or NC are approximately 176.2 mV, 189.5 mV, 204.3 mV, 117.2 mV, and 142.1 mV, respectively, indicating that the identification of the influenza virus can be completed in the microfluidic diagnostic assay with a high specificity.
Fig. 3.
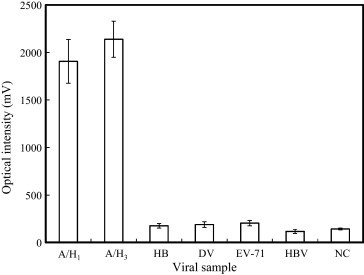
Selectivity of the immunomagnetic bead-based FIA for the detection of influenza A viruses. Six experiments including two positive samples (A/H1 and A/H3) and four negative cases (influenza HB, DV, EV-71, and HBV) are tested.
3.3. Detection of specimen samples in a clinical setting
Three different types of simulated clinical specimens including whole blood, serum and saliva are mixed with influenza A virus in a concentration of 1:128 with 4−4 dilution (0.5 HAU) (which can be regarded as the positive controls (PC)) and is employed to validate the performance of the proposed microfluidic assay. In addition, the NC, which are only the simulated clinical specimens without influenza viruses, are also used to verify the binding effect of the FIA. All the simulated clinical specimens are loaded into the proposed microfluidic assay to perform the entire diagnostic procedure automatically. Fig. 4 is a comparison between the PC and NC for each clinical sample type. The results indicate that only the clinical samples containing the influenza viral particles (PC) are specifically captured by the mAb-coated magnetic beads and are optically detected using the proposed microfluidic diagnostic assay without cross-reactions with other biological substances in the clinical specimen.
Fig. 4.
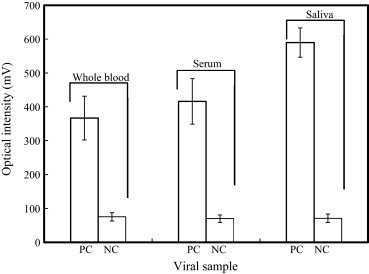
Detection of influenza viral particles in three different types of simulated clinical samples, namely whole blood, serum and saliva (n = 3). PC: clinical specimen sample is mixed with influenza virus and NC: clinical specimen samples only (without influenza virus).
3.4. Sensitivity
In addition to the selectivity of the proposed microfluidic assay, the sensitivity of the microfluidic FIA for detecting target influenza viral particles is also systematically explored. Influenza A/H3 at a stock titer of 128 HAU is diluted and tested samples with concentrations ranging from 4−2 dilution (8 HAU) to 4−10 dilution (1.25 × 10⁻⁴ HAU) are used to verify the detection limit of the FIA in the developed microfluidic system. They are incubated with a fixed amount of mAb-coated magnetic beads (8 × 10⁵ beads/20 μL), followed by washing and mixing them with 20 μL of developing mAb (0.05 μg/μL) and then labeling them with PE (2.5 ng/μL). The final samples are then collected and analyzed using the optical detection module. The optical intensities from each sample with different concentrations are shown in Fig. 5 . Note the raw data of the optical intensities of the microfluidic assay can be found in Supplemental Table 2 in the SI. From these experimental results, it is found that the detectable fluorescent intensity is measured to be 219.7 ± 37.7 mV (n = 3) in a sample with a viral concentration of 5 × 10⁻⁴ HAU (as shown in Fig. 5(a)). Note that the fluorescent intensity of the negative control is around 149.7 ± 17.24 mV. Fig. 5(b) shows a series of optical images of the magnetic complexes purified from the specimen samples with different viral concentrations utilizing the optical detection module in the microfluidic assay. More importantly, a comparison of the sensitivity between the microfluidic assay and the manual protocol is shown in Fig. 5(c-1) and (c-2), respectively, where D represents the logarithm of the dilution folds to base 4 for the influenza viral sample with an initial concentration of 128 HAU. It is found that 5 × 10⁻⁴ HAU of influenza viruses can be detected by the proposed immunomagnetic bead-based FIA in the microfluidic system within 15 min, while only 1.25 × 10⁻¹ to 5 × 10⁻¹ HAU of influenza virus can be detected by the manual protocol with an immunomagnetic bead-based FIA in approximately 3 h. In other words, the specimen samples with an influenza virus concentration higher than 5 × 10⁻⁴ HAU would be classified as a “positive” result in the proposed microfluidic assay. Accordingly, compared to a conventional flow cytometry technique (FACSCalibur™, BD Biosciences, USA) which is integrated with an immunomagnetic bead-based FIA for influenza virus detection, the sensitivity is found to be 0.5 HAU (Supplemental Fig. 10 in the SI). The LOD of the proposed microfluidic assay is still 10-fold higher than the fluorescent DNA barcode-based immunoassay (Cao et al., 2010), which can detect the influenza virus with a HA titer of ∼1.28 × 10⁻³ HA in approximately 2 h. This high sensitivity makes it possible to detect the influenza virus at the early phase of infection even before the clinical symptom. Hence, the diagnostic time required for the entire FIA in the microfluidic assay can be significantly reduced due to the fact that an efficient mixing effect can be generated to conjugate the samples with the 3D structure of the mAb-coated magnetic particles, thus enhancing the interaction between the antibody and the antigen. However, it can be clearly seen from the results that the output voltage of the PMT module does not increase by the factor of 4 on each sample with an increasing viral concentration. It may be explained by two reasons. First, the optical signal is emitted from the optical detection chamber where 8 × 10⁴ magnetic complexes are gathered and focused in a relatively small region by a permanent magnet, such that the optical signal of the magnetic complexes might be affected by the uneven distribution of the stacked beads. Accordingly, reducing the used amount of the magnetic beads might be an alternative approach to solve this problem such that the optical response of the PMT module would be varied more linearly. Nonetheless, the detection limit of the proposed assay might be significantly impaired and the mixing time for incubation process would be increased due to the less used amount of the magnetic beads. Another reason is that the fluorescent signal generated by a fluorochrome-labeled protein is in proportion to the moles of fluorochrome per mole of protein (F/P ratio) over a limited range. Over-coupling (i.e., coupling more fluorescein per mole of protein than the optimal F/P ratio) may not yield a proportional increase in fluorescence since there may be greatly quenched. Furthermore, excessive modification of the protein may change the native antibody structure and thereby decrease the affinity of the antibody for an antigen.
Fig. 5.
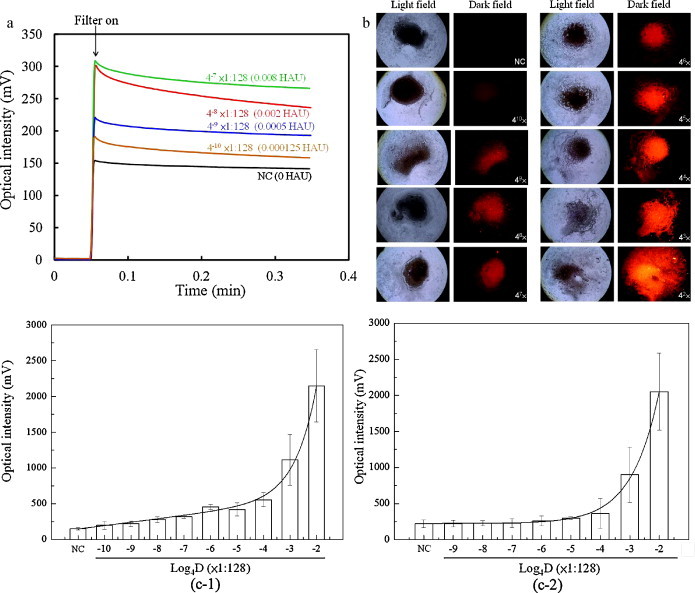
(a) Optical signals from the detection of influenza virus A/H3 at different concentrations in the microfluidic assay. (b) A series of optical images of the magnetic complexes with different viral concentrations utilizing the optical detection module in the microfluidic assay. (c) Comparison of the sensitivity of the microfluidic assay (c-1) with the manual protocol (c-2). D: dilution folds up to base 4 for the influenza viral sample with an initial concentration of 1:128 HAU.
As a consequence, a standard curve of the microfluidic assay between the optical intensity of the magnetic complexes and the influenza viral sample with an initial concentration of 1:128 HAU is calculated as follows:
where y represents the optical intensity of the magnetic complexes and x represents the logarithm of the dilution folds to base 4 for the influenza viral sample with an initial concentration of 128 HAU. Therefore, the optical signal from the microfluidic diagnostic assay can be immediately detected and be referenced to a standard curve for the semi-quantitative detection of influenza infection.
4. Conclusion
A new immunomagnetic bead-based, suction-type microfluidic assay has been demonstrated for the rapid immunological diagnosis of influenza A infection by utilizing mAb-coated magnetic beads. A suction-type microfluidic control module, an incubation module and an optical detection module were integrated into a single chip to carry out sample incubation, purification and optical analysis automatically. Experimental results indicated that the microfluidic system can reduce the total required detection time to 15 min and the influenza virus at a concentration of 5 × 10⁻⁴ HAU can be detected successfully by using this system, which is 1000-fold higher than the sensitivity of the conventional bench-top systems. As a whole, this proposed microfluidic system may provide a powerful platform for the rapid diagnosis of any type of influenza infection. Furthermore, modification of the protocol can be also used for the rapid, automatic diagnosis of other acute infectious diseases.
Acknowledgement
The authors would like to thank the National Science Council in Taiwan for financial support of this project (NSC 99-2120-M-006-008).
Footnotes
Preliminary results have been presented in the 14th International Conference on Miniaturized Systems for Chemistry and Life Sciences (μ-TAS 2010), Groningen, The Netherlands, October 3–7, 2010.
Supplementary data associated with this article can be found, in the online version, at doi:10.1016/j.bios.2011.03.006.
Contributor Information
Huan-Yao Lei, Email: ylei@mail.ncku.edu.tw.
Gwo-Bin Lee, Email: gwobin@pme.nthu.edu.tw, gwobin@mail.ncku.edu.tw.
Appendix A. Supplementary data
References
- Bai Y., Koh C.G., Boreman M., Juang Y.J., Tang I.C., Lee L.J., Yang S.T. Langmuir. 2006;22:9458–9467. doi: 10.1021/la061123l. [DOI] [PubMed] [Google Scholar]
- Boivin G., Côté S., Déry P., De Serres G., Bergeron M.G. J. Clin. Microbiol. 2004;42:45–51. doi: 10.1128/JCM.42.1.45-51.2004. [DOI] [PMC free article] [PubMed] [Google Scholar]
- Cao C., Dhumpa R., Bang D.D., Ghavifekr Z., Høgberg J., Wolff A. Analyst. 2010;135:337–342. doi: 10.1039/b916821b. [DOI] [PubMed] [Google Scholar]
- Chomel J.J., Thouvenot D., Onno M., Kaiser C., Gourreau J.M., Aymard M. J. Virol. Meth. 1989;25:81–91. doi: 10.1016/0166-0934(89)90102-x. [DOI] [PubMed] [Google Scholar]
- Chowell G., Bertozzi S.M., Colchero M.A., Lopez-Gatell H., Alpuche-Aranda C., Hernandez M., Miller M.A. New Engl. J. Med. 2009;361:674–679. doi: 10.1056/NEJMoa0904023. [DOI] [PubMed] [Google Scholar]
- de Ory F., Guisasola M.E., Coccola F., Téllez A., Echevarría J.M. Clin. Microbiol. Infect. 2004;10:220–223. doi: 10.1111/j.1198-743x.2004.00756.x. [DOI] [PubMed] [Google Scholar]
- Fernández-Lafuente R., Guisán J.M. Biosen. Bioelectron. 2006;21:1574–1580. doi: 10.1016/j.bios.2005.07.017. [DOI] [PubMed] [Google Scholar]
- Fuentes M., Mateo C., Rodriguez A., Casqueiro M., Tercero J.C., Riese H.H., Gijs M.A.M. Microfluid. Nanofluid. 2004;1:22–40. [Google Scholar]
- Harmon M.W., Phillips D.J., Reimer C.B., Kendal A.P. J. Clin. Microbiol. 1986;24:913–916. doi: 10.1128/jcm.24.6.913-916.1986. [DOI] [PMC free article] [PubMed] [Google Scholar]
- Hay A., Gregory V., Douglas A., Lin Y. Philos. Phil. Trans. R. Soc. B. 2001;356:1861–1870. doi: 10.1098/rstb.2001.0999. [DOI] [PMC free article] [PubMed] [Google Scholar]
- Hendry R.M., Herrmann J.E. J. Virol. Meth. 1983;6:9–17. doi: 10.1016/0166-0934(83)90063-0. [DOI] [PubMed] [Google Scholar]
- Huang Y., Mather E.L., Bell J.L., Madou M. Anal. Bioanal. Chem. 2002;372:49–65. doi: 10.1007/s00216-001-1191-9. [DOI] [PubMed] [Google Scholar]
- Kartalov E.P., Zhong J.F., Scherer A., Quake S.R., Taylor C.R., Anderson W.F. BioTechniques. 2006;40:85–90. doi: 10.2144/000112071. [DOI] [PubMed] [Google Scholar]
- Koh G.C.H., Wong T.Y., Cheong S.K., Koh D.S.Q. Asia Pac. Fam. Med. 2008;7:5. doi: 10.1186/1447-056X-7-5. [DOI] [PMC free article] [PubMed] [Google Scholar]
- Leikina E., Mittal A., Cho M.-S., Melikov K., Kozlov M.M., Chernomordik L.V. J. Biol. Chem. 2004;279:26526–26532. doi: 10.1074/jbc.M401883200. [DOI] [PubMed] [Google Scholar]
- Lien K.-Y., Lee W.-C., Lei H.-Y., Lee G.-B. Biosen. Bioelectron. 2007;22:1739–1748. doi: 10.1016/j.bios.2006.08.010. [DOI] [PubMed] [Google Scholar]
- Sala G., Cordioli P., Moreno-Martin A., Tollis M., Brocchi E., Piccirillo A., Lavazza A. Avian Dis. 2003;47:1057–1059. doi: 10.1637/0005-2086-47.s3.1057. [DOI] [PubMed] [Google Scholar]
- Schild G.C., Henry-Aymard M., Pereira H.G. J. Gen. Virol. 1972;16:231–236. doi: 10.1099/0022-1317-16-2-231. [DOI] [PubMed] [Google Scholar]
- Shibata T., Tanaka T., Shimizu K., Hayakawa S., Kuroda K. J. Virol. Meth. 2009;156:162–165. doi: 10.1016/j.jviromet.2008.10.020. [DOI] [PubMed] [Google Scholar]
- Stockton J., Ellis J.S., Saville M., Clewley J.P., Zambon M.C. J. Clin. Microbiol. 1998;36:2990–2995. doi: 10.1128/jcm.36.10.2990-2995.1998. [DOI] [PMC free article] [PubMed] [Google Scholar]
- Swayne D.E., Avellaneda G., Mickle T.R., Pritchard N., Cruz J., Bublot M. Avian Dis. 2007;51:697–704. doi: 10.1637/0005-2086(2007)51[697:ITTHIT]2.0.CO;2. [DOI] [PubMed] [Google Scholar]
- Szurdoki F., Michael K.L., Walt D.R. Anal. Biochem. 2001;291:219–228. doi: 10.1006/abio.2001.5041. [DOI] [PubMed] [Google Scholar]
- Uyeki T.M. Pediatr. Infect. Dis. 2003;22:164–177. doi: 10.1097/01.inf.0000050458.35010.b6. [DOI] [PubMed] [Google Scholar]
- Vignali D.A.A. J. Immunol. Meth. 2000;243:243–255. doi: 10.1016/s0022-1759(00)00238-6. [DOI] [PubMed] [Google Scholar]
- Weng C.-H., Lien K.-Y., Yang S.-Y., Lee G.-B. Microfluid. Nanofluid. 2010;10:301–310. [Google Scholar]
- Wrammert J., Smith K., Miller J., Langley T., Kokko K., Larsen C., Zheng N.-Y, Mays I., Garman L., Helms C., James J., Air G.M., Capra J.D., Ahmed R., Wilson P.C. Nature. 2008;453:667–671. doi: 10.1038/nature06890. [DOI] [PMC free article] [PubMed] [Google Scholar]
- Yan X., Zhong W., Tang A., Schielke E.G., Hang W., Nolan J.P. Anal. Chem. 2005;77:7673–7678. doi: 10.1021/ac0508797. [DOI] [PubMed] [Google Scholar]
- Yang S.-Y., Lien K.-Y., Huang K.-J., Lei H.-Y., Lee G.B. Biosen. Bioelectron. 2008;24:855–862. doi: 10.1016/j.bios.2008.07.019. [DOI] [PubMed] [Google Scholar]
- Zhang A., Jin M., Liu F., Guo X., Hu Q., Han L., Tan Y., Chen H. Avian Dis. 2006;50:325–330. doi: 10.1637/7473-111605R.1. [DOI] [PubMed] [Google Scholar]
Associated Data
This section collects any data citations, data availability statements, or supplementary materials included in this article.