

Abstract
Metastasis causes most cancer-related deaths, and one poorly understood aspect of metastatic cancer is the adaptability of cells from a primary tumor to create new niches and survive in multiple, different secondary sites. We used quantitative mass spectrometry to analyze the extracellular matrix (ECM), a critical component of metastatic niches, in metastases to the brain, lungs, liver and bone marrow, all derived from parental MDA-MB-231 triple-negative breast cancer cells. Tumor and stromal cells cooperated in forming niches; stromal cells produced predominantly core, structural ECM proteins and tumor cells produced a diverse array of ECM-associated proteins, including secreted factors and modulators of the matrix. Additionally, tumor and stromal cells together created distinct niches in each tissue. Downregulation of SERPINB1, a protein elevated in brain metastases, led to a reduction in brain metastasis, suggesting that some niche-specific ECM proteins may be involved in metastatic tropism.
Keywords: Metastasis, quantitative proteomics, matrisome, tumor microenvironment, organotropism
Introduction
Metastasis is responsible for the majority of cancer deaths (1), yet our understanding of its fundamental processes, as well as how to detect and treat it, remains inadequate relative to the threat it poses. This is particularly relevant in the case of triple-negative breast cancer (TNBC), a breast cancer subtype defined by the lack of expression of estrogen receptor, progesterone receptor and epidermal growth factor receptor (EGFR). TNBC, which accounts for 15% of all breast carcinomas, is especially aggressive, capable of metastasizing to the brain, lungs, liver and bone marrow (2). However, the lack of the above three genes makes targeted treatment of TNBC difficult, so chemotherapy remains the standard of care (3). Nevertheless, even with chemotherapeutic treatment, the median overall survival rate for women with metastatic breast cancer is only two years (4). Thus, there is a clear need for additional ways to target and treat this disease, especially its metastasis.
The extracellular matrix (ECM) represents one promising avenue of research in cancer therapy. The ECM is a critical part of the tumor microenvironment, which is the complete collection of tumor cells, stromal cells, vasculature and non-cellular components that make up a tumor (5,6). ECM proteins provide structural support, migration control, and growth and survival signals to tumor cells, fibroblasts and blood vessels. Tumor cells both produce ECM proteins themselves as well as induce surrounding stromal cells to alter their own ECM production, which can suit the growth of the tumor (7,8). Moreover, the extracellular localization of the ECM makes it well-suited for use in imaging and targeting, since it is accessible to probes without the need to cross through cell membranes (9,10). Indeed, we have successfully used ECM-targeting nanobodies for PET/CT imaging of both primary tumors and metastases in several cancer models (11).
The ECM is also essential for the construction of the metastatic niche, the microenvironment that tumor cells create in collaboration with stromal cells when colonizing different sites, which is conducive to the survival and proliferation of disseminated tumor cells into overt metastases (12). A few specific ECM proteins have previously been identified as crucial parts of certain metastatic niches in both human and mouse breast cancers, including Tenascin C (TNC), osteopontin (OPN or SPP1) and periostin (POSTN) (13–15). Moreover, amplified fibronectin (FN1) production can promote metastasis of a wide variety of cancers (16–19). However, overall understanding of which ECM proteins are present in metastatic niches is lacking, particularly in secondary sites aside from the lung. Therefore, a more complete survey of the ECM in different metastatic sites would markedly increase our knowledge of both the role of the ECM in breast cancer metastasis, as well as how the ECM is differentially altered in various metastatic sites.
We have previously developed methods for enriching tissue samples for their ECM protein content by taking advantage of the relative insolubility of the ECM, and we have used these techniques in conjunction with mass spectrometry-based proteomics to profile the “matrisome,” the complete collection of both core ECM and ECM-associated proteins, in several different cancers (8,20). Such analyses have identified several ECM proteins associated with primary tumors more likely to metastasize, including SNED1, LTBP3, TNC, S100A10 and S100A11, in both mouse xenograft models and human patient samples (21–23). ECM profiling has thus been useful in discovering ECM proteins in the primary tumor microenvironment relevant to disease progression. Nevertheless, there are no reports to date that have examined the ECM in metastases to multiple organs in the context of the same cancer, which could explore how cells from a single primary tumor cell type can adapt to different tissues.
Here we define and compare the ECM components of metastatic niches and how they differ among the specific secondary sites common in TNBC. For this purpose, we use as a model the MDA-MB-231 human TNBC cell line, originally derived from a patient pleural effusion (24), which is capable of metastasizing to the brain, lungs, liver and bone marrow in mouse xenografts. We identify which ECM proteins are commonly elevated at multiple different metastatic sites, and which are preferentially elevated in particular sites. We investigate how these specific ECM proteins, as well as the tumor matrix overall, are differentially produced by the tumor and stromal cells; in this paper, we use “stromal” to include all cells in the tumor that are not tumor cells. Finally, as an example of the utility of this system for finding novel ECM mediators of metastasis, we show that knockdown in tumor cells of a protein highly expressed in brain metastases, SERPINB1, can significantly reduce their brain-tropic metastasis. This survey of the ECM in metastases thus presents insight into the fundamental biology of metastatic niche formation, as well as how tumor cells can adapt to survive in different tissue environments.
Methods
Cells and vectors
The human MDA-MB-231 (ATCC Cat# CRL-12532, RRID:CVCL_0062) mammary carcinoma cell line (24) expressing firefly luciferase was a kind gift of Joan Massagué (Memorial Sloan Kettering Cancer Center, New York, NY). These cells were further retrovirally infected to express ZsGreen using MSCV-ZsGreen-2A-Puro (25). Cells were cultured in HyClone high-glucose DMEM (ThermoFisher, San Jose, CA) supplemented with 2 mM glutamine and 10% fetal bovine serum (FBS, Invitrogen, Carlsbad, CA) in a 37°C incubator with 5% CO2. Production of retrovirus and lentivirus, as well as transduction of cells, was performed as previously described (26). Cells were tested monthly for mycoplasma using a PCR-based Universal Mycoplasma Detection Kit (ATCC, Manassas, VA). All cell lines were used for experiments 1–2 passages after thawing.
Experimental metastasis assays
Metastatic tumor samples for this study were generated by injecting MDA-MB-231 cells in 100 μL of Hanks’ Balanced Salt Solution (HBSS, Thermo Fisher Scientific, San Jose, CA) into female NOD-SCID (RRID:IMSR_JAX:001303) or NOD/SCID/IL2Rγ-null (RRID:IMSR_JAX:005557) mice (Jackson Laboratory, Bar Harbor, ME) and allowing tumors to grow for 4–12 weeks. Injections were via the lateral tail vein (for lung tumors) or intracardiac injection into the left ventricle (for brain, liver and bone tumors). 250,000 cells were injected to generate bone and lung tumors, while 50,000 cells were injected to generate brain and liver tumors. Intracardiac injections were guided using a Vevo 770 ultrasound imaging system (VisualSonics, Toronto, Canada). Metastases were isolated through their ZsGreen fluorescence, and bone-tumor samples were collected by flushing the bone marrow from femurs and tibias with phosphate-buffered saline (PBS) after confirming the presence of ZsGreen-positive tumors. At least 25 mg of tumor tissue were used for each sample for analysis, which required pooling several tumors for each sample from either the same (liver, lung) or multiple (bone marrow) mice, except for brain tumors, which were sizeable enough (30–50 mg) to be used singly. For brain, lung and liver, three metastatic samples and one healthy tissue sample (an entire brain, full set of lungs, and liver left lobe) were collected per organ. For bone marrow, two metastatic samples and one healthy tissue sample were collected from each of NOD-SCID and NOD/SCID/IL2Rγ-null mice (Supplementary Table S1). The primary focus of this study was comparisons among metastases rather than comparisons between normal tissue and metastases, so relatively more metastatic samples were included in the experimental design.
For assays of metastatic tropism, 500,000 or 250,000 MDA-MB-231 cells were injected via intracardiac injection into NOD-SCID mice (as above) and allowed to grow for 3 or 4 weeks, respectively, at which point brains, lungs and bones (femurs and tibias) were dissected and imaged with a Leica M165 FC dissecting microscope (Leica, Wetzlar, Germany). Tumor burden was quantified by dividing ZsGreen-positive tumor area by total tissue area using ImageJ. Data for all assays were expressed as mean ± standard deviation. Since liver metastases were not observed in NOD-SCID mice (see Results), liver tropism could not be evaluated in these experiments. Statistical analysis was conducted with GraphPad Prism 6 (GraphPad Software). All comparisons were made using two-tailed Student’s t-tests, controlled for a false discovery rate (FDR) below 0.1 (according to the Benjamini-Hochberg procedure), with P≤ 0.05 considered significant (*). All procedures were performed according to an animal protocol approved by MIT’s Committee on Animal Care.
ECM protein enrichment, immunoblotting and in-solution digestion
Tissue samples were homogenized with a Bullet Blender (Next Advance, Averill Park, NY) according to the manufacturer’s instructions. Enrichment of tissue samples for their ECM protein content was performed by sequential extractions using the CNMCS compartmental extraction kit (Millipore, Billerica, MA) as previously described (8,20), except that brain samples were incubated a second time in the CS buffer to remove additional non-ECM proteins. Quality control of each step of the enrichment process was monitored by immunoblotting as previously described (8) with the following antibodies: rabbit anti-Collagen I (Millipore, Billerica, MA), rabbit anti-Vimentin produced in our laboratory (27), rabbit anti-pan-histone (Millipore) and mouse anti-GAPDH (Millipore). ECM protein resuspension, alkylation, deglycosylation and proteolytic digestion with trypsin and LysC were performed as previously described (8,20).
Sample preparation
Proteolytic digests of the ECM preparations were desalted using C18 stage-tip columns (Empore, 3M, St. Paul, MN) (28), and 5% was used for label-free analysis. After vacuum centrifugation and resuspension in 0.1% formic acid, half of the 5% was analyzed by LC-MS/MS to determine the amount of total peptide approximated by the total ion current (TIC) and the intensity of ECM proteins. This was performed to estimate the abundance of ECM peptides in the digest. Approximately five micrograms of peptides from each sample were labeled with TMT according to the on-column protocol (29,30). Roughly 0.9 ug of each sample was combined (15 ug total) and labeled with TMT-131 to create a common reference sample. The pooled reference sample was split in two, on-column labeled in parallel and re-mixed after confirmation of individual labeling efficiency. Aliquots of this reference sample were used in each of the two 10-plex sample sets (Supplementary Table S2). Ammonium formate (20 mM) was added to each on-column labeling prior to mixing and drying. After vacuum centrifugation, samples were step-fractionated using a Stage tip packed with four punches of SDB-RPS (Empore) extraction disks. Step fractions were eluted in 20 mM ammonium formate with increasing percentages of acetonitrile (ACN), 5, 7.5, 10, 12.5, 15, 17.5, 25, and 55%. Samples were dried by vacuum centrifugation, resuspended in 0.1% formic acid and stored at −80°C until data acquisition.
Data acquisition and analysis
LC-MS/MS was performed on a Q Exactive Plus mass spectrometer as previously described (29,31). Data were searched and interpreted using Spectrum Mill version 6.0 (Agilent Technologies, Santa Clara, CA) using parameters similar to those previously described (8,21). MS/MS spectra were searched against a combined dataset including both human and mouse Uniprot entries downloaded on 17 Oct 2014, containing 100,236 entries, including 150 common laboratory contaminants. Matrisome proteins were identified bioinformatically as described previously (8). TMT log2-fold change ratios (sample over common reference) were median- and median absolute deviation-normalized to the total set of ECM proteins quantified in each sample, such that the overall distribution of log2-fold change ratios for each sample was centered at zero and had a standardized variability. Fractional intensities of proteins from particular TMT channels were calculated as described previously (30).
Hierarchical clustering, correlation and marker selection analysis were performed using Morpheus (https://software.broadinstitute.org/morpheus/). Clustering was performed using one minus the Pearson correlation. Correlation analysis was conducted by calculating Spearman’s rank correlation coefficient (rho) for the total protein set of each sample. Marker selection was performed as described previously (30) to identify proteins significantly different between two sample sets, with signal to noise used as the metric and 10,000 test permutations, and with significance determined as P≤0.05 and FDR<0.1 (Benjamini-Hochberg procedure for multiple comparisons correction).
Ingenuity Pathway Analysis (IPA; Qiagen, Germantown, MD) to detect potential upstream regulator proteins was performed with the 20 most significantly elevated human and mouse proteins from each metastatic site as identified by marker selection (see above). The 12 most significant predicted regulators (all P≤0.05) for each tissue were compared, with separate analyses for human and mouse proteins. Kaplan-Meier estimates of disease/progression-free survival were conducted with cBioPortal (www.cbioportal.org) (32,33) using data from PanCancer Atlas Studies from The Cancer Genome Atlas (TCGA, www.cancer.gov/tcga).
Gene Set Enrichment Analysis (GSEA) was performed using GSEA v4.0.2 (http://software.broadinstitute.org/gsea/index.jsp). We employed a gene expression dataset of human patient primary breast tumors (GSE12276), with defined phenotypic classes according to whether those primary tumors were associated with relapse to the brain or elsewhere (34). Probe sets were collapsed to unique gene symbols. We generated gene sets corresponding to the tumor-cell-derived (human) or stroma-derived (mouse) ECM proteins that were elevated at least one log2 value in brain metastases compared to normal brain tissue, along with gene sets for the 12 most significant upstream regulators predicted by IPA. Distributions of each of these gene sets were compared to rank-ordered brain relapse vs. no brain relapse primary tumor expression data using GSEA with the default settings. Note that this analysis includes only those genes in the gene set that are also in the expression dataset. Significance was determined by GSEA as FDR q-value<.25.
Gene knockdown and quantitative PCR
miR30-based shRNAs (Supplementary Table S3) were designed using a tool developed by the laboratory of Michael Hemann (shrna.mit.edu) and cloned into MSCV-Blast-miR30, as previously described (26). An shRNA against Firefly luciferase (shFF) was used as a control. sgRNAs for CRISPRi (Supplementary Table S4) were designed using a tool developed by the lab of Feng Zhang (crispr.mit.edu) and cloned into U6-sgRNA-CMV-tdTomato, a kind gift of Michael Hemann (35). This vector was used in tandem with Lenti-dCas9-KRAB-Blast, a gift from Gary Hon (Addgene plasmid # 89567 ; http://n2t.net/addgene:89567 ; RRID:Addgene_89567) (36). Retroviral and lentiviral production and transduction of cells were performed as previously described (26).
For quantitative PCR (qPCR), cells were lysed in TRIzol (Invitrogen, Carlsbad, CA), RNA was isolated according to the manufacturer’s instructions, and cDNA was synthesized by reverse transcription using the First-Strand cDNA Synthesis Kit (Promega, Madison, WI). qPCR reactions were performed using SYBR Green Supermix (Bio-Rad, Hercules, CA) according to the manufacturer’s instructions, and data analysis was performed using Bio-Rad CFX Manager Software. PCR conditions were 95°C for 10 min, followed by 40 cycles of 95°C for 20 s, 60°C for 30 s, and 72°C for 30 s. Data for all assays were expressed as mean ± standard deviation. Primers used are listed in Supplementary Table S5.
Results
Quantitative proteomics highlights differences in metastases among tissues
To evaluate the composition of the ECM of metastases formed when triple-negative breast cancer cells grow in different tissues, we used as a model the metastatic MDA-MB-231 human triple-negative mammary carcinoma cell line (24). These cells were introduced into circulation in order to colonize tumors in the brain, lung, liver and bone marrow. Brain, lung and bone metastases were harvested from NOD-SCID mice. However, as these cells do not form liver tumors in NOD-SCID mice, perhaps because of high NK cell levels (37,38), we also injected cells into NOD-SCID-IL2Rγ-null mice to collect liver metastases. Bone tumors from both mouse strains were collected for purposes of comparison.
Following collection of metastatic and normal tissue samples from all four tissues and pooling as described in Methods, the samples were enriched for their ECM protein content as previously described (20). After performing western blots to track the enrichment of ECM proteins and depletion of intracellular proteins (Supplementary Fig. S1A and B, bone marrow; Supplementary Fig. S1C and D, liver), the samples were digested and labeled with tandem mass tags (TMT) for quantitative mass spectrometry (Fig. 1A). Samples were named according to their tissue of origin, mouse strain, and normal or metastatic sample type (Fig. 1B, Supplementary Table S1). Preliminary, label-free analysis of the different tissues showed a clear difference in ECM protein profiles (Supplementary Fig. S2 and S3). The brain had a considerably lower quantity of ECM proteins overall compared to the other, relatively more matrix-rich tissues, while liver metastases had a notably higher proportion of glycoproteins relative to other metastases.
Figure 1. Overview of sample collection, preparation and mass spectrometry.
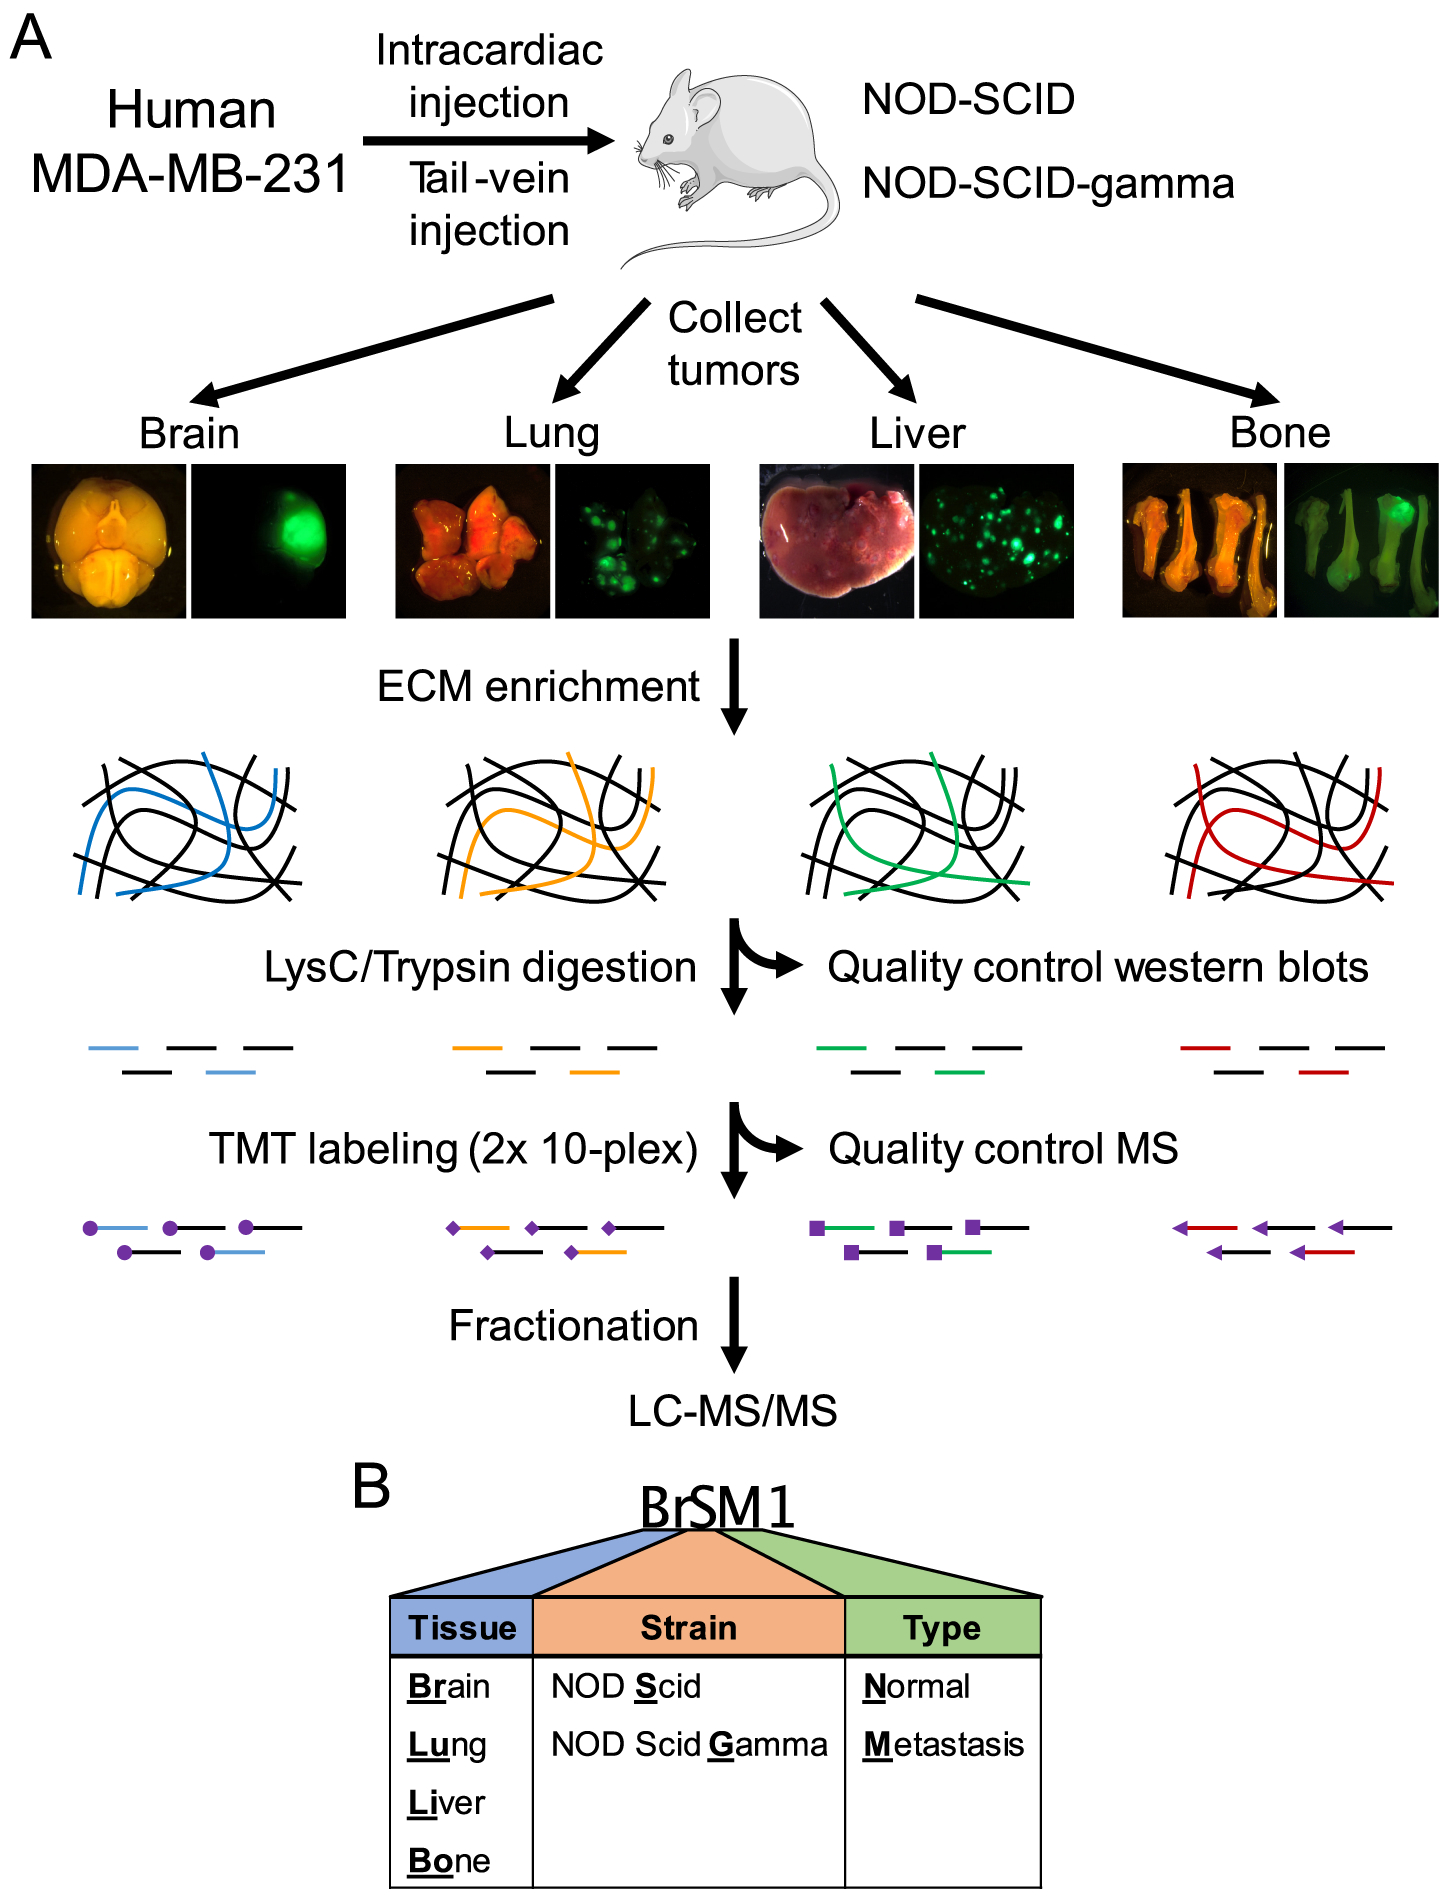
(A) Experimental workflow. MDA-MB-231 cells expressing luciferase and ZsGreen were injected into the tail vein or heart of NOD/SCID or NOD/SCID/IL2Rγ-null mice. Tumor growth was monitored by IVIS bioluminescence imaging, and tumors were collected 4–12 weeks following injection. Normal control tissues were also collected from uninjected mice. Following ECM enrichment, quality-control western blots (see Supplementary Fig. S1) and proteolytic digestion, samples were divided into two 10-plex TMT series (see Supplementary Table S2). A common reference control comprising equal parts of all samples combined was used to allow comparisons between the two series. Following stage-tip fractionation, samples were run on a Q Exactive Plus mass spectrometer. (B) Sample nomenclature (see Supplementary Table S1).
The matrisome is divided into core matrisome proteins (collagens, ECM glycoproteins and proteoglycans) and matrisome-associated proteins ([1] ECM regulators such as proteases and crosslinking enzymes, [2] ECM-affiliated proteins that are often found in association with the core matrisome proteins, and [3] secreted factors such as growth factors) (8,39,40). Among all samples, we quantified 307 human and mouse matrisome proteins, including nearly 100 glycoproteins and over 70 ECM regulators (Fig. 2A). The samples were divided into two 10-plex TMT series (Supplementary Table S2), though we observed 80–90% overlap between the two TMT plexes (Fig. 2B), with the majority of non-overlapping proteins coming from Plex A, which contained all of the normal tissue samples. Accordingly, 30/42 of the non-overlapping proteins from Plex A (Supplementary Fig. S4A) came from the stroma (mouse proteins), compared to only 8/18 non-overlapping proteins in Plex B (Supplementary Fig. S4B), suggesting that many of these Plex A-only stromal proteins are likely present only in normal tissue. Moreover, despite matrisome proteins being only around 5% of the total number of proteins quantified in our data (Fig. 2C), they represented a third of the total protein abundance due to our ECM enrichment (Fig. 2D), despite the extremely low matrix content of tissues like the brain (Supplementary Fig. S3). Finally, calculation of the Spearman correlation between each pair of samples revealed that metastatic samples tended to cluster by tissue, but that individual tissues, particularly the brain, were markedly different from one another (Fig. 2E). Some metastases were so different compared to their corresponding normal tissue, as was the case for liver, that they did not form a tissue-specific clade. Thus, even on a global level, the same population of tumor cells can create clearly distinct metastatic niches in different organs.
Figure 2. Overview of quantitative mass spectrometry data.
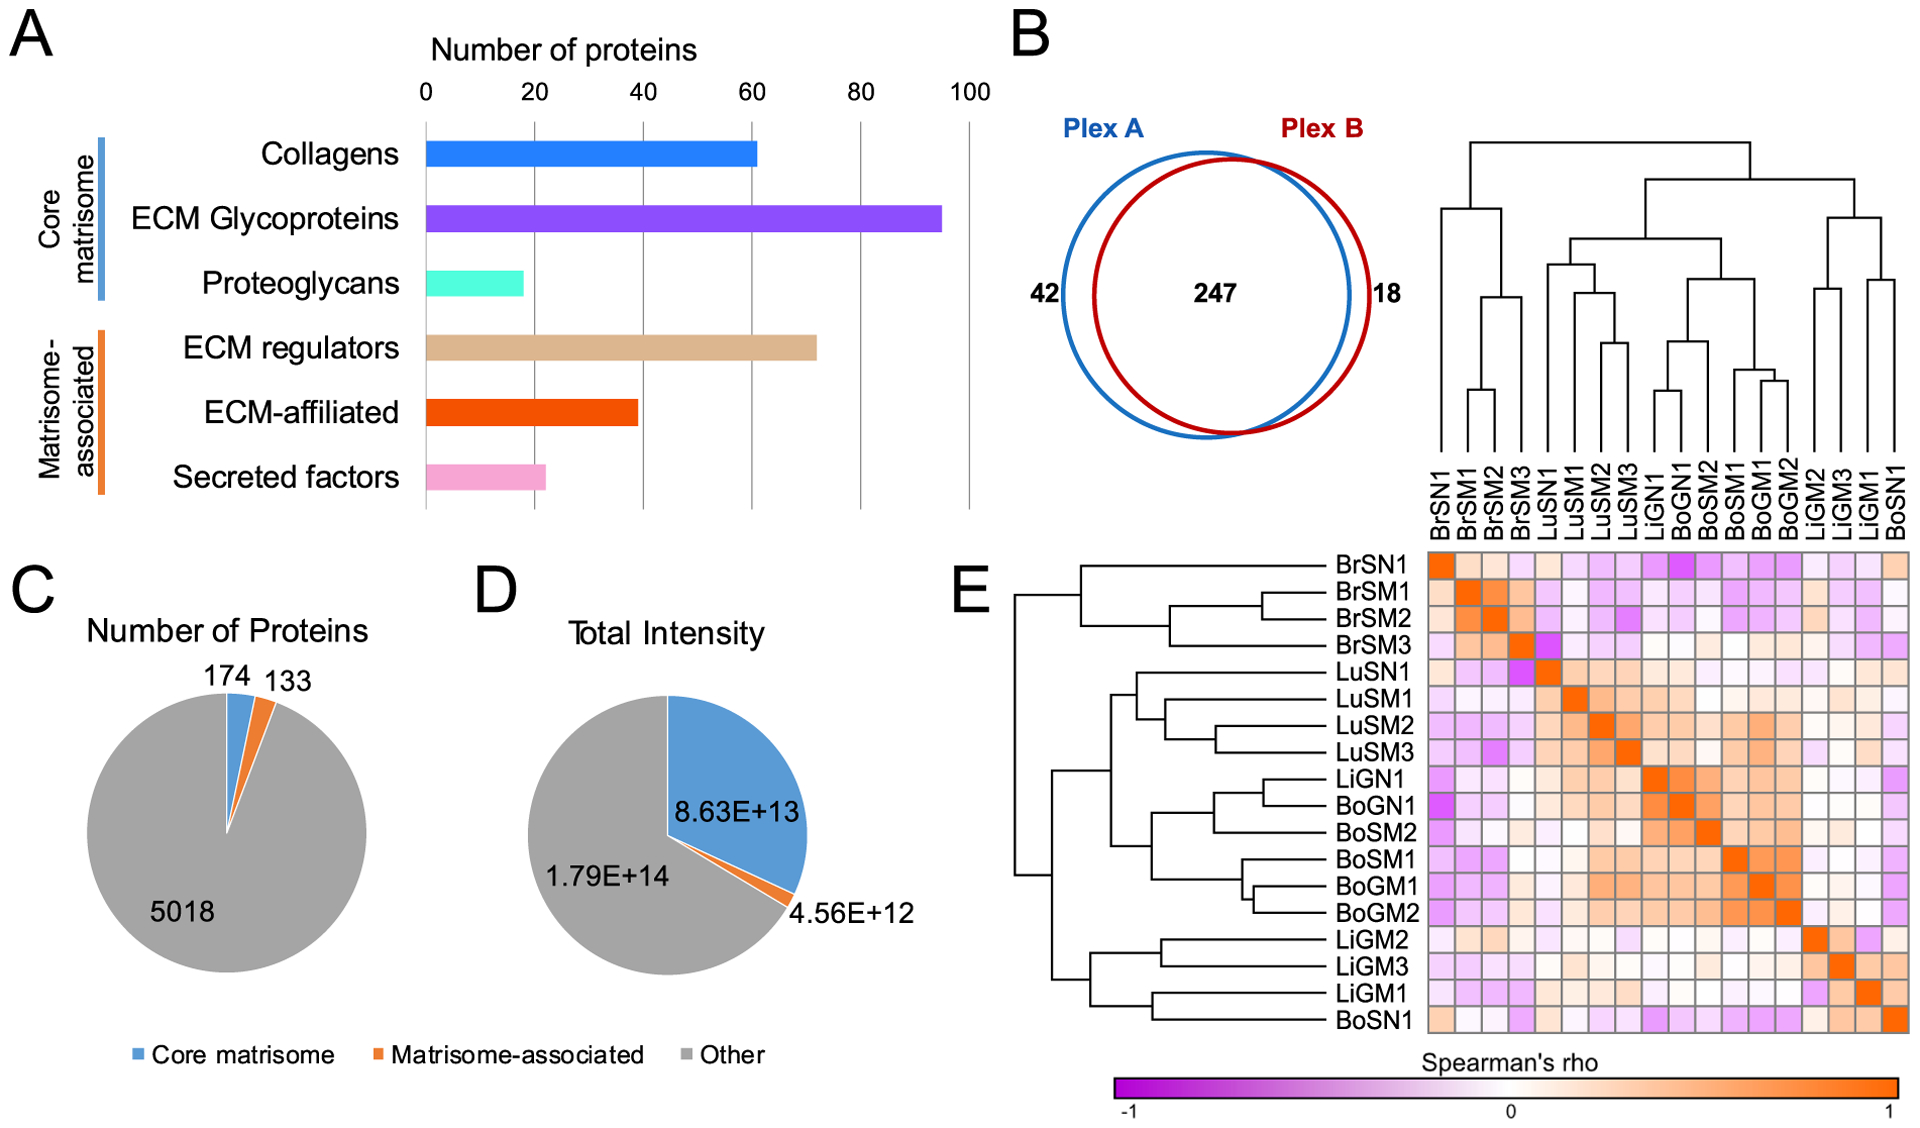
(A) Numbers of proteins quantified among all samples belonging to each matrisome category. (B) Numbers of proteins quantified in each of the two TMT plexes. (C) Numbers of matrisome and non-matrisome proteins quantified among all samples. (D) Total intensity of matrisome and non-matrisome proteins quantified among all samples. (E) Spearman’s rank correlation coefficient (rho) matrix of samples, calculated using all proteins quantified.
Tumor and stromal cells produce different components of the metastatic niche ECM
In a xenograft model system, human tumor cells grow embedded in mouse stromal tissue. We took advantage of this species difference to distinguish whether a given protein originated from tumor or stromal cells based on peptide sequence differences between human and mouse versions of the same protein (8). In this study, we use the term “tumor cell” to mean all human cancer cells, and we use the term “stromal cell” to include all non-cancerous mouse cells within the tumors. The distinction between tumor-cell-derived and stromal-cell-derived proteins is particularly useful in the context of metastatic niches across multiple tissues, where tumor cells are growing in notably dissimilar stromal environments. The bulk of the matrisome protein content of metastases was produced by the stroma (Fig. 3A). Moreover, the tumor and stroma made remarkably different types of matrisome proteins, with the tumor largely producing matrisome-associated proteins like ECM regulators and secreted factors, and the stroma mostly creating core matrisome proteins, particularly collagens (Fig. 3B).
Figure 3. Tumor-cell- and stroma-derived production of matrisome proteins.
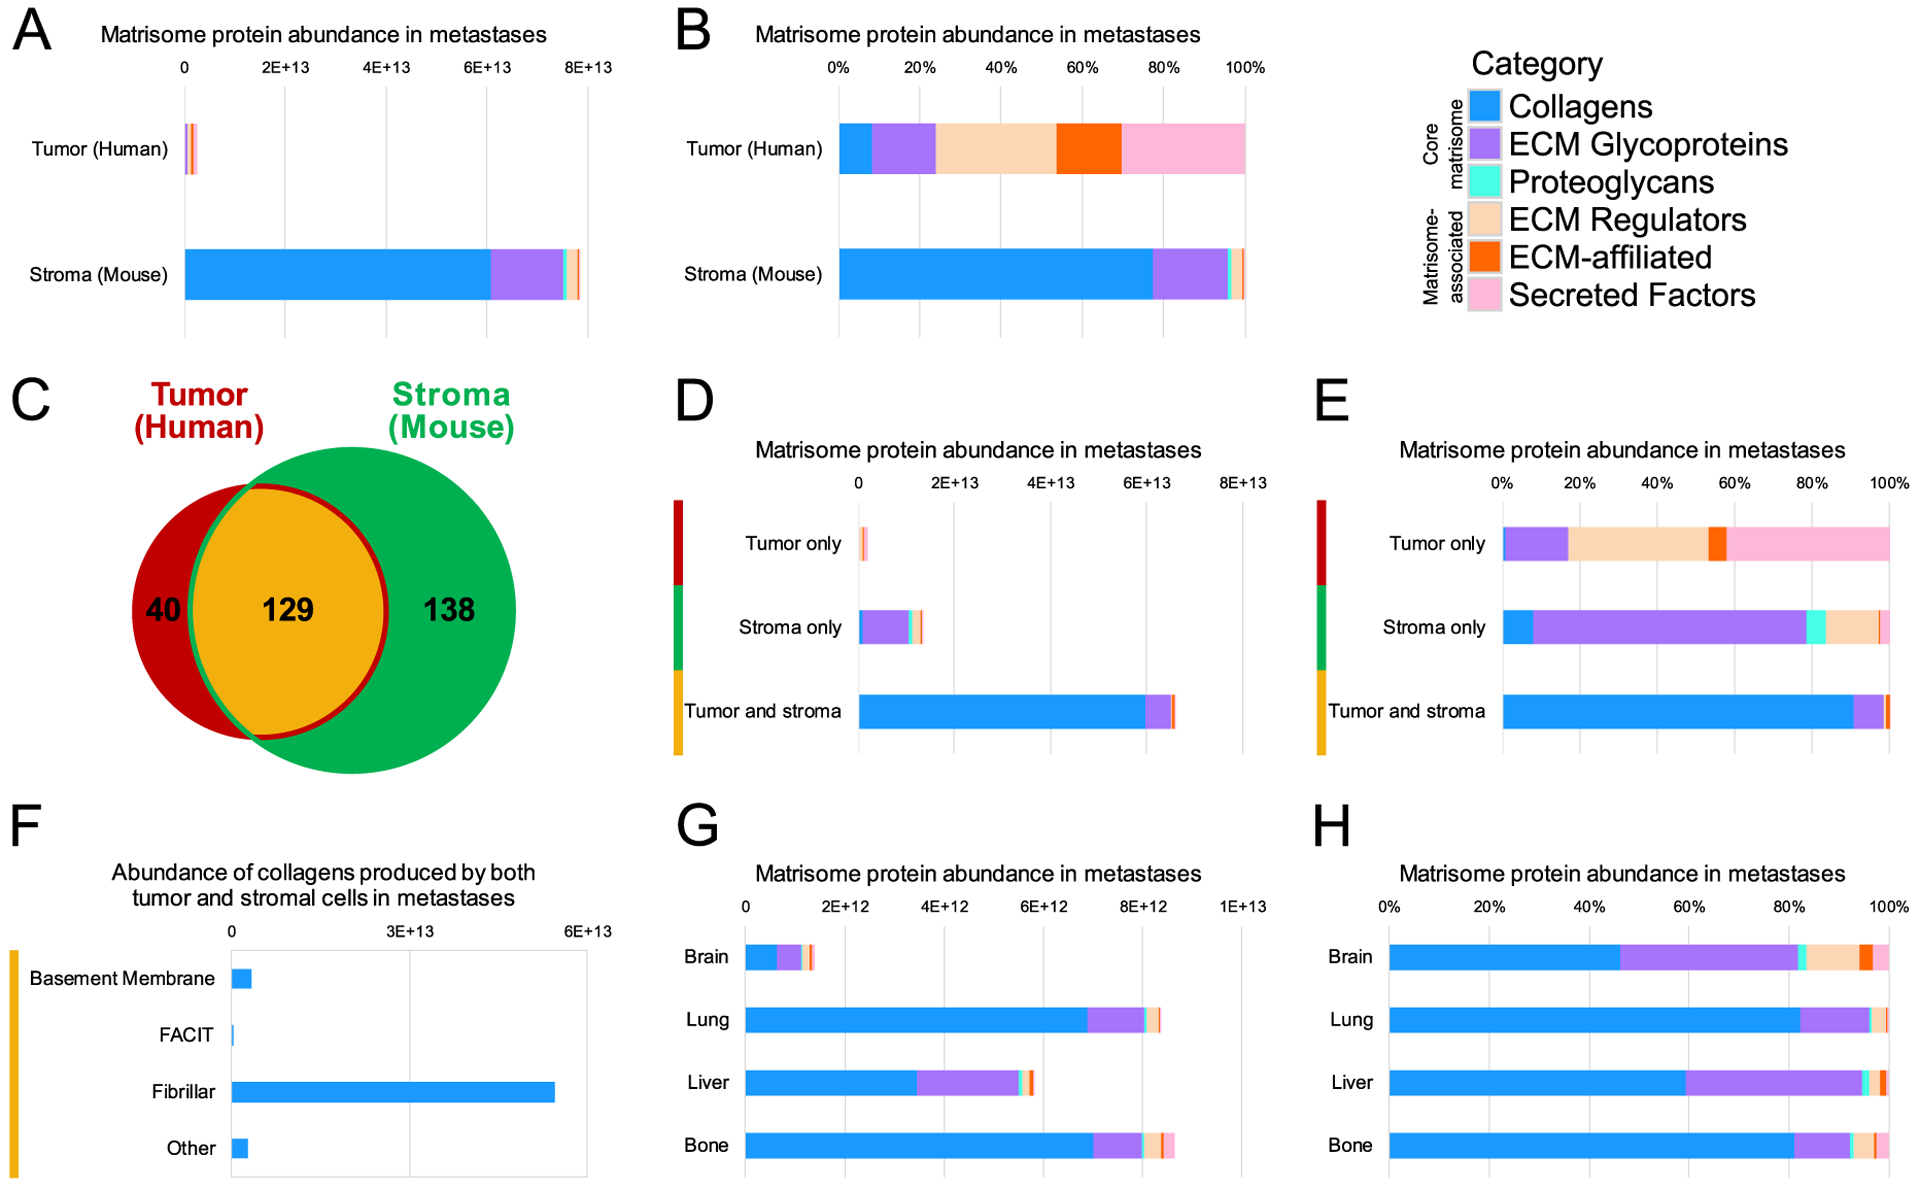
All abundances shown were calculated by adding the fractional intensities for proteins in metastatic samples, broken down by matrisome category. (A) Total and (B) relative abundance of tumor-cell-derived (human) and stroma-derived (mouse) matrisome proteins quantified. (C) Numbers of proteins quantified in metastases that were produced only by tumor cells (human, red, left), only by stromal cells (mouse, green, right) or by both cell compartments (center, yellow). (D) Total and (E) relative abundance of matrisome proteins produced only by tumor cells, only by stromal cells, or by both cell compartments. (F) Total intensity of collagen types produced by both tumor and stromal cells in metastases: basement membrane, fibril-associated collagens with interrupted triple helices (FACIT), and other. (G) Total abundance of matrisome proteins per metastatic sample from each tissue. (H) Relative abundance of matrisome protein categories in all metastases to each tissue.
The tumor and stromal production of matrisome proteins can be further broken down by examining whether a given protein was made only by the tumor cells, only by the stromal cells, or by both the tumor and stromal compartments (Fig. 3C, D). The largest component of the proteins made exclusively by the tumor cells was secreted factors, followed by ECM regulators (Fig. 3E), suggesting that tumor cells secrete factors that modulate the existing tissue ECM to form a metastatic niche. Indeed, tumor cells produced more than twice as many secreted factors as the stromal cells by total abundance, despite the much greater overall quantity of matrisome proteins made by the stroma (Fig. 3A, D). Furthermore, a closer look at the 40 quantified human proteins that were produced only by the tumor cells reveals a mix of mostly matrisome-associated proteins, notably several members of the S100 family, LOX family, and SERPINB1 (Supplementary Fig. S5). Meanwhile, the uniquely stroma-derived proteins consist largely of ECM glycoproteins, and both the tumor and stroma were responsible for producing collagens (Fig. 3E), which were mostly fibrillar (Fig. 3F). Brain metastases had at least four-fold lower abundance of matrisome proteins overall (Fig. 3G), but also had a notably more diverse niche with a greater proportion of matrisome-associated proteins, particularly compared to the lung and bone, which were comprised of at least 80% collagens (Fig. 3H). This increased overall diversity in the brain was driven largely by the relatively lower stromal contribution to its niche (Supplementary Fig. S6A, B), since the total and relative abundance of matrisome proteins in the brain was fairly similar to other tissues (Supplementary Fig. S6C, D). Notably, bone metastases also had a more than two-fold greater tumor-cell-derived matrisome protein contribution compared to other tissues (Supplementary Fig. S6C). The tumor and stromal cells therefore appear to take distinct roles in creating the matrix of the metastatic tumor microenvironment, with stromal cells producing more core structural proteins and tumor cells making modulators of the matrix environment.
The tumor and stroma create distinct metastatic niches in each tissue
In addition to broad differences in the types of matrix proteins made by the tumor and stroma, quantitative mass spectrometry also allows the identification of particular proteins that characterize the metastatic niche of each tissue. We performed a marker selection analysis, comparing the metastatic samples from each particular tissue to all other metastatic samples, looking for proteins that are significantly elevated only in that tissue (see Methods and Ref. (30)). These comparisons did not simply identify the most elevated proteins in each tissue, but rather the proteins most significantly different in abundance in one tissue relative to all others. Separate analyses were conducted for tumor-cell-derived (human) and stroma-derived (mouse) proteins.
Beginning with tumor-cell-derived proteins (Fig. 4A), the brain had a particularly large and diverse set of characteristic proteins, including several that were produced only by the tumor cells: CD109, SERPINB1, HCFC1 and cerebellin-1 (CBLN1) (Supplementary Fig. S5). The lung metastases were characterized by several basement membrane proteins, including collagen COL4A4 and laminin-121 (α1β2γ1, formerly known as laminin-3). The liver was not particularly set apart by its tumor-cell-derived protein production, aside from COL6A5, but the bone marrow metastatic niche had significantly increased levels of both S100A6 and S100A11, both of which were produced only by the tumor cells (Supplementary Fig. S5). We also compared the total set of metastatic samples to all normal tissues to identify proteins that were broadly over-represented in metastases of MDA-MB-231 cells in all tissues (Fig. 4B). The most broadly abundant protein overall was S100A4. Also notable were a couple of annexin family members (ANXA1 and ANXA2), the proteoglycan perlecan (HSPG2, found both in basement membranes and in other matrices), and the protease cathepsin D (CTSD). As there would be no human proteins present in these mouse tissues without the introduction of the human MDA-MB-231 cells, all of these tumor-cell-derived proteins characteristic of each metastatic niche represent particular adaptations of the tumor cells to each tissue.
Figure 4. Tumor-cell-derived proteins specifically elevated at distinct metastatic sites.
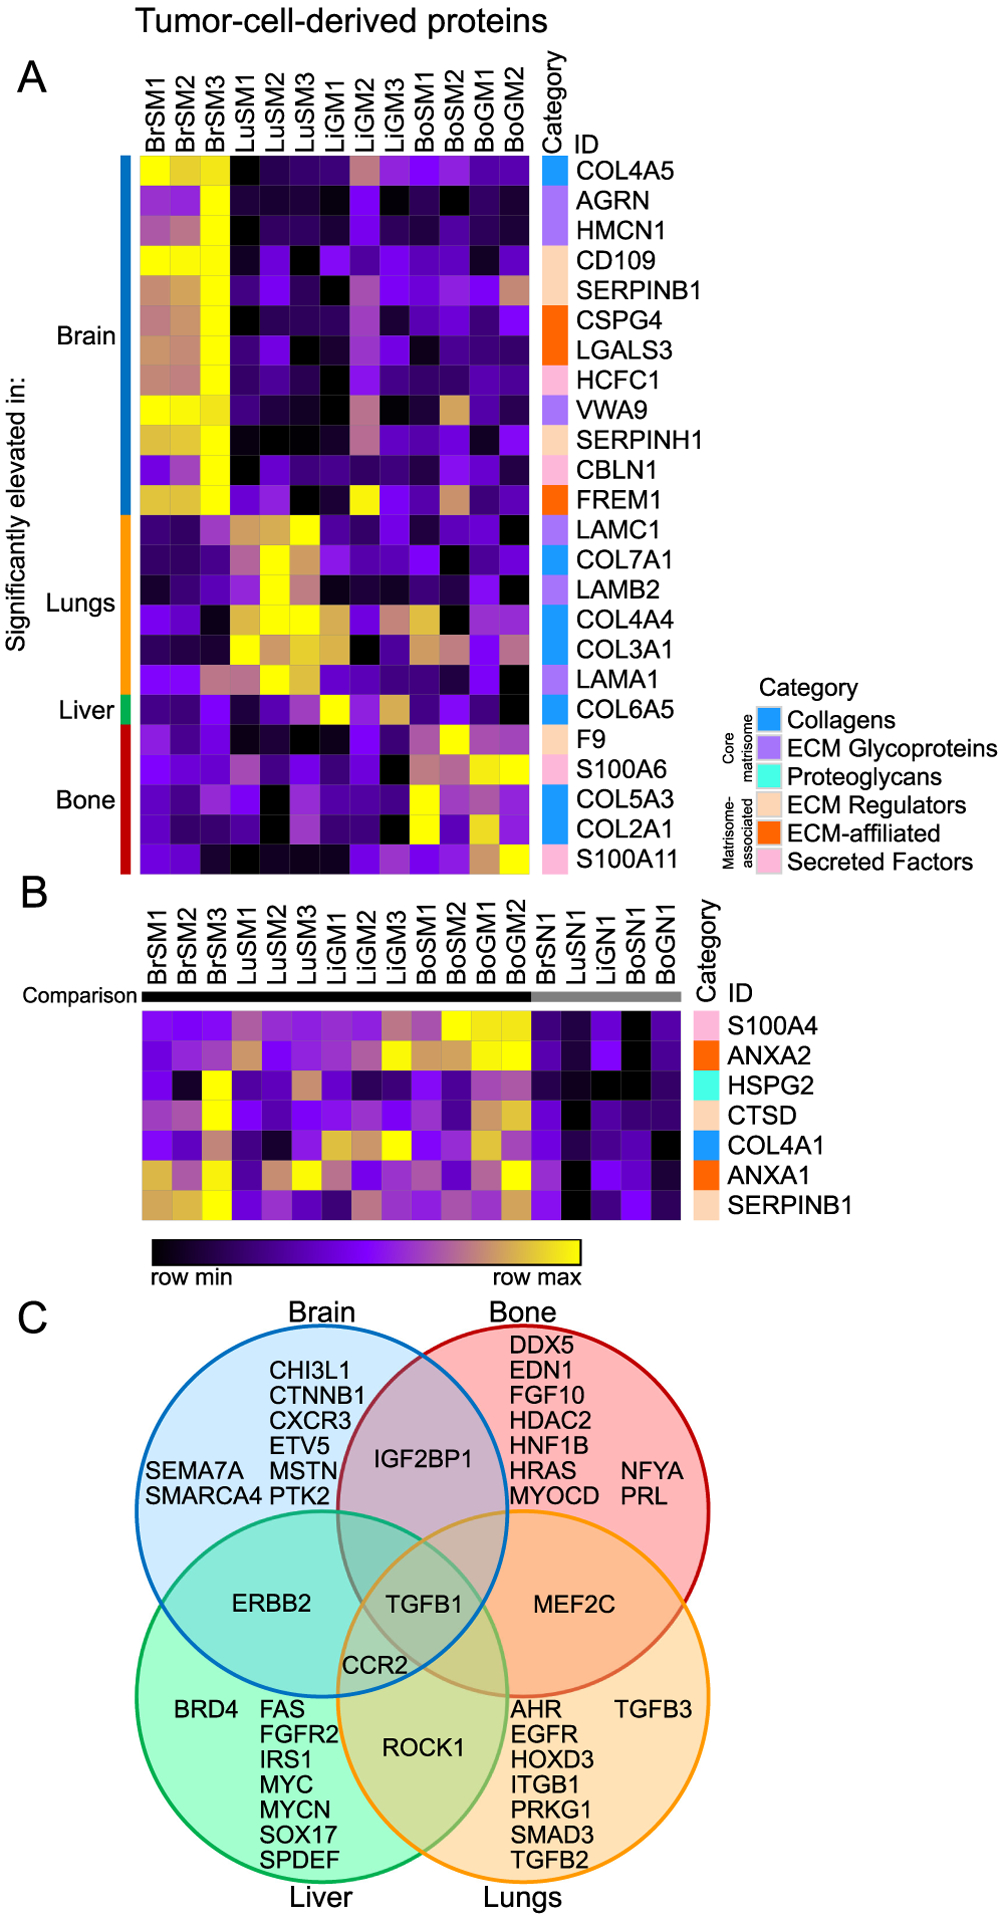
(A) Comparison of tumor-cell-derived proteins among different metastatic sites (marker selection, see Methods). Shown are all proteins significantly elevated in each particular metastatic tissue (identified on the left) relative to all other metastatic tissues. (B) Comparison of tumor-cell-derived proteins significantly elevated across all metastatic samples in each case relative to normal tissue (on right). All proteins shown in both heatmaps are significantly different between the compared groups (signal to noise ratio, P < 0.05 and FDR < 0.1). (C) Diagram of potential upstream regulators of tumor-cell-derived proteins predicted by Ingenuity Pathway Analysis (IPA) for each tissue, with regulators predicted for multiple tissues indicated in overlapping areas.
Next, we used Ingenuity Pathway Analysis (IPA) on the tumor-cell-derived ECM proteins most significantly elevated in each tissue to predict possible common upstream regulators (Fig. 4C). TGFβ1 was predicted as a regulator in all tissues, while C-C chemokine receptor type 2 (CCR2) was predicted in three out of the four organs (brain, lungs and liver). However, most of the predicted upstream regulators were unique to each tissue, consistent with the distinct ECM niches observed. That is, the varying ECM environments appear to be the result of differing regulatory programs. MDA-MB-231 tumor cells thus have both a common set of matrisome proteins they secrete in different tissue environments, as well as unique adaptations to each site, both in terms of specific proteins and predicted regulatory programs.
A parallel comparison uncovered stroma-derived proteins particular to each metastatic niche (Fig. 5A). The brain, once again, displayed a wide variety of niche proteins, many of which are known to be expressed specifically in the brain, such as the secreted neuronal glycoprotein Lgi1 and its receptor Adam22 (41,42), as well as brevican (Bcan). The lung stroma, much like the tumor-cell-derived lung matrix, was distinguished by a great many basement membrane proteins, including six different laminin chains and five type IV collagens, though it also contained lung-specific proteins like pulmonary surfactant-associated protein A1 (Sftpa1). The liver stroma contained the known metastasis promoters Tnc and Fn1, as well as a number of proteins typically associated with the coagulation response: fibrinogens (Fga, Fgb and Fgg), thrombin (F2) and von Willebrand factor (Vwf). Additionally, the bone niche had significantly elevated levels of thrombospondin-1 (Thbs1), another S100 protein (S100a13), the protease cathespin-G (Ctsg), and the protease inhibitors cystatin C (Cst3) and stefin-2 (Stfa2).
Figure 5. Stroma-derived proteins specifically altered in metastases.
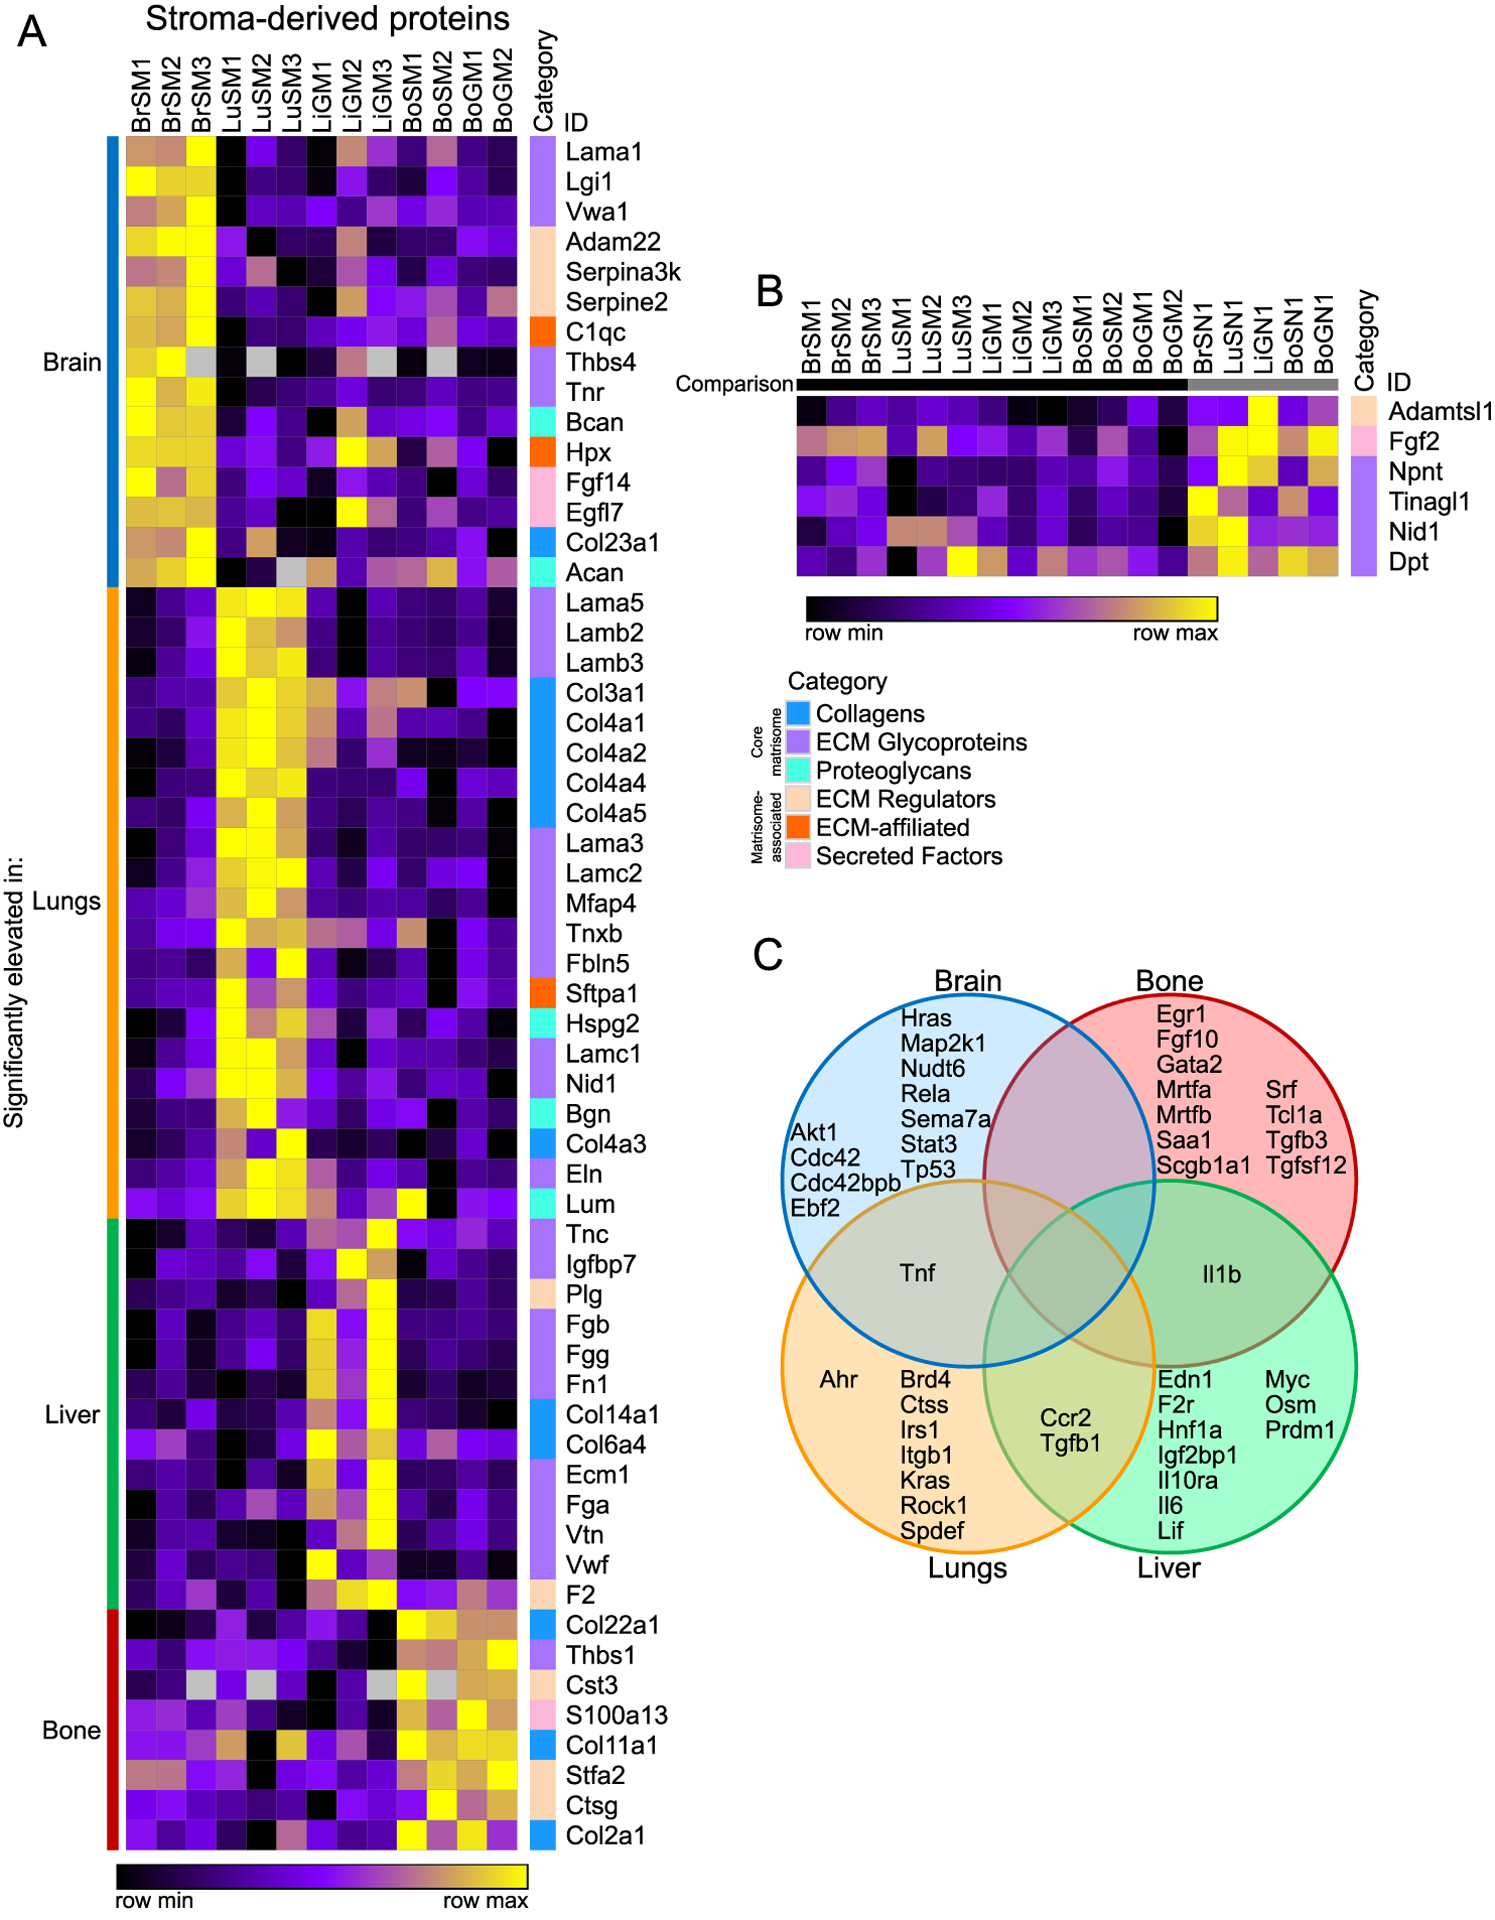
(A) Comparison of stroma-derived proteins among different metastatic sites (marker selection, see Methods). Shown are all proteins significantly elevated in each particular metastatic tissue (identified on the left) relative to all other metastatic tissues. (B) Comparison of stroma-derived proteins significantly decreased across all metastatic samples relative to all normal samples. All proteins shown in both heatmaps are significantly different between the compared groups (signal to noise ratio, P < 0.05 and FDR < 0.1). (C) Diagram of potential upstream regulators of stroma-derived proteins predicted by IPA for each tissue, with regulators predicted for multiple tissues indicated in overlapping areas.
Given that these stromal proteins were simply the most specifically abundant in each metastatic tissue, a number of them may simply represent variation among normal tissue ECMs. Accordingly, a similar marker selection can be performed by subtracting the normal abundance of each protein from the value in each metastatic sample (Supplementary Fig. S7A–D). This method identified fewer stromal proteins significantly elevated in each tissue, but many of the top proteins found by each analysis were similar.
Next, we performed a marker selection for stroma-derived proteins broadly elevated in normal tissue compared to metastases (Fig. 5B), which could, in principle, represent potential suppressors of metastasis. Indeed, among this list was tubulointerstitial nephritis antigen-like 1 (Tinagl1), which was recently shown to inhibit the progression and metastasis of TNBC in several mouse models and to correlate with survival in human patient samples (43). Finally, we used IPA to predict upstream regulators of the stroma-derived ECM proteins characteristic of metastases to each tissue (Fig. 5C). While this analysis identified some common regulators between tissues, such as Tgfb1 and Ccr2, the predicted regulators for each tissue were much more distinct for the stroma-derived ECM proteins than for the tumor-cell-derived proteins (Fig. 4C). These data are consistent with the fact that metastases in each tissue are derived from the same population of tumor cells but presumably contain distinct stromal cell types. Metastatic niches demonstrate considerable diversity from tissue to tissue in their matrisome composition, both in tumor and stromal production, suggesting that tumor cells do not simply recapitulate the same ECM environment in every tissue, but rather induce characteristic adaptations to each.
SERPINB1 knockdown demonstrates tissue-specific dependency
Given the proteins identified above that are characteristic of various metastatic niches, we wanted to test whether any could affect metastatic tropism, the differential tendency of tumor cells to colonize and grow in particular organs. For example, could knocking down a protein produced selectively in brain metastases specifically inhibit development of metastases in the brain? This is most readily achieved for tumor-cell-derived proteins. We focused on the brain due to its relative abundance of unique markers and the less well studied nature of the brain niche itself. SERPINB1 is elevated in both brain and lung metastases compared to normal tissue, though its overall level is highest in the brain (Fig. 6A). We knocked down SERPINB1 expression in MDA-MB-231 cells using CRISPRi (Fig. 6B) and introduced those cells into circulation in NOD-SCID mice via intracardiac injection. SERPINB1 knockdown significantly reduced brain metastasis by more than two-fold, slightly (but not statistically significantly) reduced lung metastasis, and did not change the average burden of bone metastasis (Fig. 6C, D). Liver metastases were not observed in NOD-SCID mice. These in-vivo results are consistent with the observed protein levels in different metastatic tissues from our mass spectrometric analysis (Fig. 6A). Moreover, alterations in SERPINB1 are significantly associated with lower progression-free survival in patients with a variety of cancers, indicating that this protein might be involved in metastasis in other contexts (Supplementary Fig. S8).We also tested knockdown of a number of additional brain metastasis and overall metastasis markers, but, while a few showed some effect on metastatic tropism, none was statistically significant for the sample sizes studied (Supplementary Fig. S9A–D). This may imply that these matrisome proteins are insufficiently consequential to tropism on their own, while altering several of them simultaneously might have a greater effect. Regardless, our results demonstrate that our data on metastatic niches can be used to find matrisome proteins with tissue-specific effects on metastasis.
Figure 6. Effects of SERPINB1 knockdown on metastatic tropism and growth.
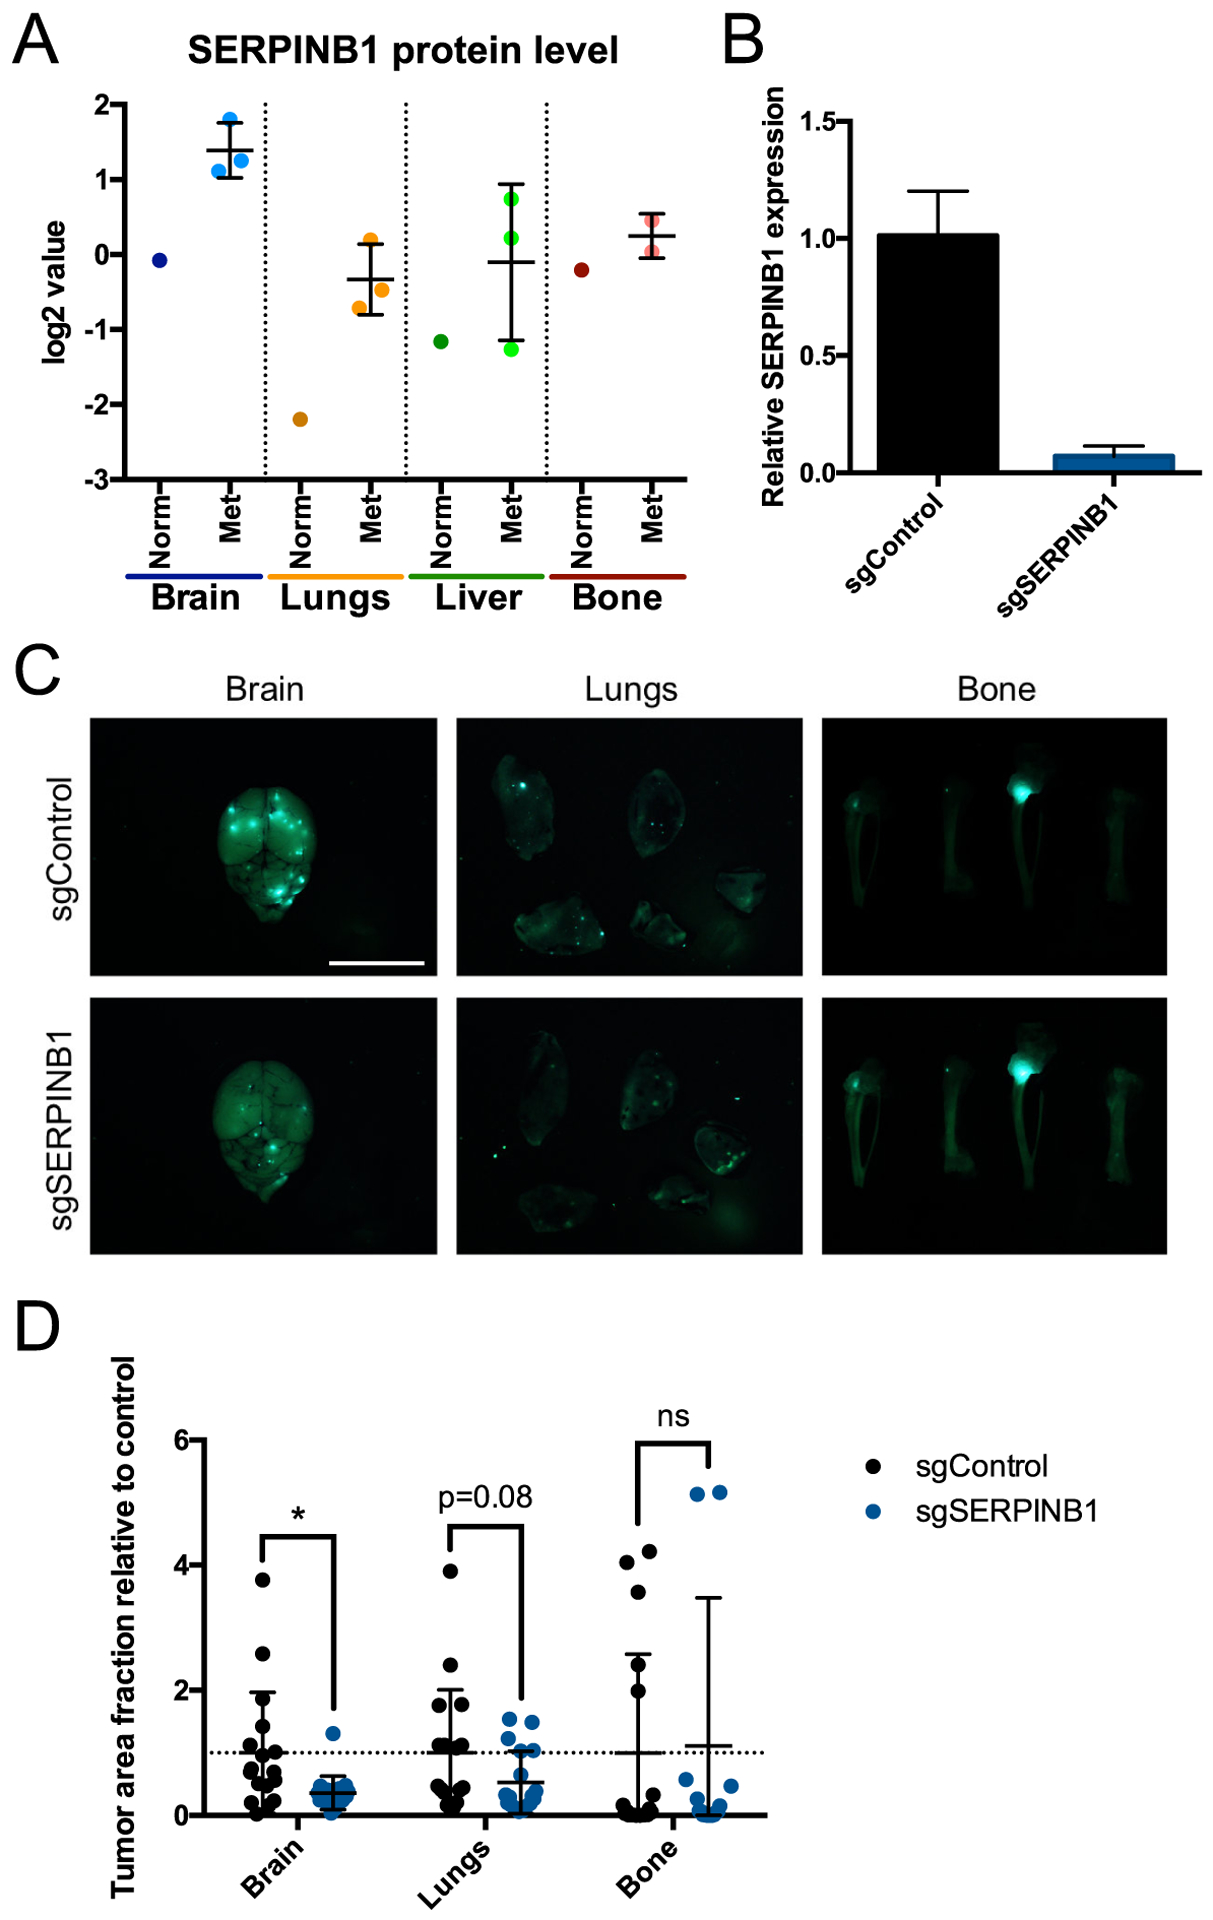
(A) Quantitative mass spectrometry of SERPINB1 protein levels (log2-fold change values relative to pooled control sample) in each normal (Norm) and metastatic (Met) tissue. All bone samples shown are from NOD-SCID mice. (B) qPCR of SERPINB1 expression in MDA-MB-231 cells expressing sgRNA against mouse Timp1 (sgControl) or SERPINB1. (C) Representative images of brains, lungs, and bones 3 weeks after intracardiac injection of sgControl or sgSERPINB1 cells. Scale bar, 10 mm. (D) Fraction of tissue surface area occupied by tumors. n=18 mice per group. ns, not significant; *, P ≤ 0.05; two-tailed Student’s t-test.
Finally, to examine potential clinical associations for the ECM proteins we identified in brain metastases, we performed Gene Set Enrichment Analysis (GSEA) on expression data from patient primary breast tumors, comparing tumors that relapsed to the brain with tumors that relapsed elsewhere. We found that sets of both the tumor-cell-derived and stroma-derived ECM proteins elevated in the brain (including SERPINB1), as well as their predicted upstream regulators, were significantly enriched in primary tumors that relapsed to the brain (Supplementary Fig. S10A–E). These data suggest that some of the ECM changes we observe in established brain metastases could already be present in primary tumors and might be predictive of their later metastasis. Indeed, data from patient circulating tumor cells (CTCs) have shown that such cells can reproducibly exhibit organotropic behavior in both patients and mouse models, further indicating that some organotropic adaptations may occur prior to metastasis (44).
Discussion
In this study, we performed an unbiased, quantitative mass spectrometric survey of ECM proteins present in MDA-MB-231 breast cancer xenograft metastases to the brain, lungs, liver and bone marrow. This analysis quantified 307 total human and mouse matrisome proteins produced by either or both the human tumor cells and mouse stromal cells, and it identified both tumor- and stroma-derived proteins characteristic of particular metastatic niches or of overall metastasis. Finally, as one example of an ECM protein affecting metastatic tropism, we showed that knockdown of SERPINB1 in tumor cells significantly reduced the growth of tumors in the brain.
We used MDA-MB-231 cells as the model for this study because of their broad metastatic capability, wide experimental use, and extensive prior research into their tropism (21,34,45). Previous studies have largely relied on several rounds of in-vivo selection of these cells to enhance their metastatic tropism to particular organs, followed by microarray analysis to compare gene expression differences among the different in-vivo-selected variants. Our work, in contrast, uses the parental cell line, which permits comparisons among a variety of responses to the challenge of growing in different tissues. Furthermore, the use of parental cells as opposed to previously derived organotropic lines allows a direct comparison among the various metastases, since they were all grown from the same cell line. Moreover, in addition to focusing on the matrisome, itself an understudied part of the tumor microenvironment, our analysis made use of quantitative proteomics to provide a more detailed picture of the actual protein composition of these metastases relative to RNA-based methods, given the known differences between mRNA and protein levels, especially for long-lived ECM proteins (31,46–48). Of course, MDA-MB-231 cells represent one particular model of TNBC, and the results described in this study should not be expected to correlate perfectly with other mouse models or patient cases. Nevertheless, it is worth noting that the sets of ECM-associated proteins identified in brain tumors in this study, including SERPINB1, do correlate with higher tendency of primary human breast tumors to relapse with brain metastases. Thus, the data generated with this approach represent a potentially valuable addition to the growing body of knowledge about metastasis to different organs.
The ability to discern the origin of each matrisome protein using a xenograft model system provided valuable insight into how both cell types contribute to the construction of each metastatic niche. For instance, the bulk of the ECM in metastases was produced by the stroma (Fig. 3A). This suggests that the tumor cells primarily co-opt and direct the more specialized ECM-producing stromal cells (such as fibroblasts) in the construction of the ECM niche, which also correlates with the observation that tumor cells primarily produced matrisome-associated proteins, especially secreted factors (Fig. 3B, E). The relative production of ECM proteins by the tumor and stroma may also change over time. Tenascin C, for example, has been shown to be produced by tumor cells in early metastases, while production is shifted to the stroma as those metastases grow in size (13). We focused on relatively early metastases (4–12 weeks) compared to the potential duration of metastatic growth in patients. It would be interesting to compare the overall ECM composition of metastases over time to study how they mature. Of course, the use of an intracardiac xenograft model comes with limitations in addition to its benefits. While intracardiac injections allow the formation of sizeable metastatic tumors in tissues like the brain that are otherwise difficult to generate from spontaneous metastasis, they do not recapitulate the early stages of the metastatic process. Moreover, while the xenograft model has the advantage of being able to discern the origin of each protein, by necessity it requires the absence of an adaptive immune system, so the effects of immune cell populations on the ECM microenvironment cannot be measured. In addition, there may be some cases where signaling factors and their receptors cannot properly interact if they are from different species. Nonetheless, the controlled nature of this system can offer significant information that would be difficult or impossible to acquire in a more natural setting.
By comparing metastases from different tissues to each other, we identified both tumor-cell-derived and stroma-derived ECM proteins characteristic of each metastatic niche. These analyses identified a large number of tumor-cell-derived proteins in the brain, which may reflect a comparably great difference between the ECM of the brain relative to the other tissues, as well as a much lower abundance of normal ECM relative to other tissues. The much larger set of stroma-derived ECM proteins characteristic of each metastatic niche (Fig. 5A) could partly represent normal tissue-to-tissue variation: regardless of the presence of tumors, these tissues have varied ECM compositions even in a healthy context. However, many of these same site-specific stroma-derived proteins remained characteristically different even when normalized to healthy tissue protein levels (Supplementary Fig. S7), indicating that such proteins are actually elevated in metastases in these tissues. Accordingly, many of the stromal proteins elevated in metastases may be the result of a general amplification of stromal ECM production. The production of so many ECM-affiliated proteins and secreted factors by the tumor cells (Fig. 3B) certainly suggests that the tumor cells are, at least, modifying the ECM environment in metastatic tissues, even if they are not creating entirely new niches from scratch. Moreover, the presence of proteins like S100A4 and ANXA2 across all tissues (Fig. 4B), as well as the prediction of TGFB1 and CCR2 as upstream regulators at multiple sites (Fig. 4C), implies that tumor cells share some common response programs in metastasis, regardless of the tissue. The existence of such common programs also raises the possibility of using these ECM proteins produced by the tumor cells in all tissues as markers for imaging or targeted therapy of metastatic cancers, which we and others have demonstrated previously with fibronectin (9–11,49). We have not yet tested the functional importance of the site-specific stroma-derived proteins, as they are considerably more difficult to perturb compared to tumor-cell-derived proteins. Nevertheless, these stroma-derived proteins are equally interesting potential targets, and the continued development of CRISPR-Cas9-based methods of genome modification may make the creation of such mouse models more practical in the near future.
Finally, we tested whether we could alter the metastatic tropism of the parental MDA-MB-231 cells by inhibiting their ability to produce an ECM protein that was characteristic of a certain niche, and we found that knockdown of SERPINB1 significantly reduced brain metastasis and somewhat reduced lung metastasis (Fig. 6D), consistent with elevated protein levels in metastases to those organs (Fig. 6A). As its name implies, SERPINB1 is a member of the serine protease suicide inhibitor family, which has been known mostly to protect neutrophils from their own proteases, as SERPINB1 inhibits neutrophil elastase, cathepsin G, proteinase 3, chymotrypsin, and granzyme H (50). The few studies of its functions in cancers have mainly shown that its overexpression suppresses migration and invasion of tumor cells, contrary to the more traditional role of metastasis promoters in supporting those processes (51,52). Aside from potential differences between SERPINB1 function in vitro and in vivo, particularly given the possibility for in vivo interactions with other matrisome proteins, SERPINB1 may also have a role in promoting the survival and growth of tumor cells after they have extravasated. Further study into SERPINB1 specifically will be needed to elucidate more precisely its newly identified role in promoting brain metastasis. Our analysis of metastatic niches in different tissues is thus capable of identifying novel, tissue-specific roles for matrisome proteins, which represent interesting opportunities for future study of the biology of metastasis formation, as well as potential prospects for imaging and targeting.
Supplementary Material
Significance.
Tumor and stromal cells together create distinct ECM niches in breast cancer metastases to various tissues, providing new insight into how tumor cells adapt to survive in different tissue environments.
Acknowledgments
This work was supported by the Howard Hughes Medical Institute (of which R.O.H. is an investigator), the National Institutes of Health (NIH), a Breast Cancer Research Program (BCRP) Innovator Award from the Department of Defense office of the Congressionally Directed Medical Research Programs (CDMRP), and by the Ludwig Center for Molecular Oncology at the Massachusetts Institute of Technology. J.D.H. was supported by NIH Pre-Doctoral Training grant T32GM007287 and by a fellowship from the Ludwig Center for Molecular Oncology at the Massachusetts Institute of Technology. This work was also supported in part by grants from the National Cancer Institute (NCI) Clinical Proteomic Tumor Analysis Consortium grants NIH/NCI U24-CA210986 and NIH/NCI U01 CA214125 (to SAC). Some of the results included here are based upon data generated by the TCGA Research Network: https://www.cancer.gov/tcga.
Footnotes
Data availability
The original mass spectra, and the sequence database used for searches may be downloaded from MassIVE (http://massive.ucsd.edu) using the identifier MSV000084023. The dataset is directly accessible via ftp://massive.ucsd.edu/MSV000084023.
Competing interests: The authors declare no potential conflicts of interest.
References
- 1.Lambert AW, Pattabiraman DR, Weinberg RA. Emerging Biological Principles of Metastasis. Cell. 2017;168:670–91. [DOI] [PMC free article] [PubMed] [Google Scholar]
- 2.Denkert C, Liedtke C, Tutt A, von Minckwitz G. Molecular alterations in triple-negative breast cancer—the road to new treatment strategies. The Lancet. 2017;389:2430–42. [DOI] [PubMed] [Google Scholar]
- 3.Bianchini G, Balko JM, Mayer IA, Sanders ME, Gianni L. Triple-negative breast cancer: challenges and opportunities of a heterogeneous disease. Nature Reviews Clinical Oncology. 2016;13:674–90. [DOI] [PMC free article] [PubMed] [Google Scholar]
- 4.Bonotto M, Gerratana L, Poletto E, Driol P, Giangreco M, Russo S, et al. Measures of Outcome in Metastatic Breast Cancer: Insights From a Real-World Scenario. The Oncologist. 2014;19:608–15. [DOI] [PMC free article] [PubMed] [Google Scholar]
- 5.Place AE, Jin Huh S, Polyak K. The microenvironment in breast cancer progression: biology and implications for treatment. Breast Cancer Research. 2011;13:227. [DOI] [PMC free article] [PubMed] [Google Scholar]
- 6.Pearce OMT, Delaine-Smith RM, Maniati E, Nichols S, Wang J, Böhm S, et al. Deconstruction of a Metastatic Tumor Microenvironment Reveals a Common Matrix Response in Human Cancers. Cancer Discov. 2018;8:304–19. [DOI] [PMC free article] [PubMed] [Google Scholar]
- 7.Lu P, Weaver VM, Werb Z. The extracellular matrix: A dynamic niche in cancer progression. J Cell Biol. 2012;196:395–406. [DOI] [PMC free article] [PubMed] [Google Scholar]
- 8.Naba A, Clauser KR, Hoersch S, Liu H, Carr SA, Hynes RO. The Matrisome: In Silico Definition and In Vivo Characterization by Proteomics of Normal and Tumor Extracellular Matrices. Molecular & Cellular Proteomics. 2012;11:M111.014647.-M111.014647. [DOI] [PMC free article] [PubMed] [Google Scholar]
- 9.Kaspar M, Zardi L, Neri D. Fibronectin as target for tumor therapy. International Journal of Cancer. 2006;118:1331–9. [DOI] [PubMed] [Google Scholar]
- 10.Kumra H, Reinhardt DP. Fibronectin-targeted drug delivery in cancer. Advanced Drug Delivery Reviews. 2016;97:101–10. [DOI] [PubMed] [Google Scholar]
- 11.Jailkhani N, Ingram JR, Rashidian M, Rickelt S, Tian C, Mak H, et al. Noninvasive imaging of tumor progression, metastasis, and fibrosis using a nanobody targeting the extracellular matrix. Proc Natl Acad Sci USA. 2019;116:14181–90. [DOI] [PMC free article] [PubMed] [Google Scholar]
- 12.Joyce JA, Pollard JW. Microenvironmental regulation of metastasis. Nature Reviews Cancer. 2009;9:239–52. [DOI] [PMC free article] [PubMed] [Google Scholar]
- 13.Oskarsson T, Acharyya S, Zhang XH-F, Vanharanta S, Tavazoie SF, Morris PG, et al. Breast cancer cells produce tenascin C as a metastatic niche component to colonize the lungs. Nat Med. 2011;17:867–74. [DOI] [PMC free article] [PubMed] [Google Scholar]
- 14.Allan AL, George R, Vantyghem SA, Lee MW, Hodgson NC, Engel CJ, et al. Role of the Integrin-Binding Protein Osteopontin in Lymphatic Metastasis of Breast Cancer. The American Journal of Pathology. 2006;169:233–46. [DOI] [PMC free article] [PubMed] [Google Scholar]
- 15.Malanchi I, Santamaria-Martínez A, Susanto E, Peng H, Lehr H-A, Delaloye J-F, et al. Interactions between cancer stem cells and their niche govern metastatic colonization. Nature. 2011;481:85–9. [DOI] [PubMed] [Google Scholar]
- 16.Barbazán J, Alonso-Alconada L, Elkhatib N, Geraldo S, Gurchenkov V, Glentis A, et al. Liver Metastasis Is Facilitated by the Adherence of Circulating Tumor Cells to Vascular Fibronectin Deposits. Cancer Res. 2017;77:3431–41. [DOI] [PubMed] [Google Scholar]
- 17.Hsu J-Y, Chang J-Y, Chang K-Y, Chang W-C, Chen B-K. Epidermal growth factor-induced pyruvate dehydrogenase kinase 1 expression enhances head and neck squamous cell carcinoma metastasis via up-regulation of fibronectin. FASEB J. 2017;31:4265–76. [DOI] [PubMed] [Google Scholar]
- 18.Kenny HA, Chiang C-Y, White EA, Schryver EM, Habis M, Romero IL, et al. Mesothelial cells promote early ovarian cancer metastasis through fibronectin secretion. J Clin Invest. 2014;124:4614–28. [DOI] [PMC free article] [PubMed] [Google Scholar]
- 19.Malik G, Knowles LM, Dhir R, Xu S, Yang S, Ruoslahti E, et al. Plasma Fibronectin Promotes Lung Metastasis by Contributions to Fibrin Clots and Tumor Cell Invasion. Cancer Res. 2010;70:4327–34. [DOI] [PMC free article] [PubMed] [Google Scholar]
- 20.Naba A, Clauser KR, Hynes RO. Enrichment of Extracellular Matrix Proteins from Tissues and Digestion into Peptides for Mass Spectrometry Analysis. J Vis Exp. 2015;e53057. [DOI] [PMC free article] [PubMed] [Google Scholar]
- 21.Naba A, Clauser KR, Lamar JM, Carr SA, Hynes RO. Extracellular matrix signatures of human mammary carcinoma identify novel metastasis promoters. eLife. 2014;3:e01308. [DOI] [PMC free article] [PubMed] [Google Scholar]
- 22.Naba A, Clauser KR, Whittaker CA, Carr SA, Tanabe KK, Hynes RO. Extracellular matrix signatures of human primary metastatic colon cancers and their metastases to liver. BMC cancer. 2014;14:518. [DOI] [PMC free article] [PubMed] [Google Scholar]
- 23.Gocheva V, Naba A, Bhutkar A, Guardia T, Miller KM, Li CM-C, et al. Quantitative proteomics identify Tenascin-C as a promoter of lung cancer progression and contributor to a signature prognostic of patient survival. Proc Natl Acad Sci USA. 2017;114:E5625–34. [DOI] [PMC free article] [PubMed] [Google Scholar]
- 24.Cailleau R, Olivé M, Cruciger QVJ. Long-term human breast carcinoma cell lines of metastatic origin: Preliminary characterization. In Vitro. 1978;14:911–5. [DOI] [PubMed] [Google Scholar]
- 25.Lamar JM, Stern P, Liu H, Schindler JW, Jiang Z- G, Hynes RO. The Hippo pathway target, YAP, promotes metastasis through its TEAD-interaction domain. PNAS. 2012;109:E2441–50. [DOI] [PMC free article] [PubMed] [Google Scholar]
- 26.Stern P, Astrof S, Erkeland SJ, Schustak J, Sharp PA, Hynes RO. A system for Cre-regulated RNA interference in vivo. PNAS. 2008;105:13895–900. [DOI] [PMC free article] [PubMed] [Google Scholar]
- 27.Hynes RO, Destree AT. 10 nm filaments in normal and transformed cells. Cell. 1978;13:151–63. [DOI] [PubMed] [Google Scholar]
- 28.Rappsilber J, Mann M, Ishihama Y. Protocol for micro-purification, enrichment, pre-fractionation and storage of peptides for proteomics using StageTips. Nat Protoc. 2007;2:1896–906. [DOI] [PubMed] [Google Scholar]
- 29.Myers SA, Wright J, Peckner R, Kalish BT, Zhang F, Carr SA. Discovery of proteins associated with a predefined genomic locus via dCas9-APEX-mediated proximity labeling. Nat Methods. 2018;15:437–9. [DOI] [PMC free article] [PubMed] [Google Scholar]
- 30.Myers SA, Rhoads A, Cocco AR, Peckner R, Haber A, Schweitzer LD, et al. Streamlined protocol for deep proteomic profiling of FAC-sorted cells and its application to freshly isolated murine immune cells. Molecular & Cellular Proteomics. 2019;mcp.RA118.001259. [DOI] [PMC free article] [PubMed] [Google Scholar]
- 31.Mertins P, Mani DR, Ruggles KV, Gillette MA, Clauser KR, Wang P, et al. Proteogenomics connects somatic mutations to signalling in breast cancer. Nature. 2016;534:55–62. [DOI] [PMC free article] [PubMed] [Google Scholar]
- 32.Cerami E, Gao J, Dogrusoz U, Gross BE, Sumer SO, Aksoy BA, et al. The cBio cancer genomics portal: an open platform for exploring multidimensional cancer genomics data. Cancer Discov. 2012;2:401–4. [DOI] [PMC free article] [PubMed] [Google Scholar]
- 33.Gao J, Aksoy BA, Dogrusoz U, Dresdner G, Gross B, Sumer SO, et al. Integrative analysis of complex cancer genomics and clinical profiles using the cBioPortal. Sci Signal. 2013;6:pl1. [DOI] [PMC free article] [PubMed] [Google Scholar]
- 34.Bos PD, Zhang XH-F, Nadal C, Shu W, Gomis RR, Nguyen DX, et al. Genes that mediate breast cancer metastasis to the brain. Nature. 2009;459:1005–9. [DOI] [PMC free article] [PubMed] [Google Scholar]
- 35.Braun CJ, Bruno PM, Horlbeck MA, Gilbert LA, Weissman JS, Hemann MT. Versatile in vivo regulation of tumor phenotypes by dCas9-mediated transcriptional perturbation. PNAS. 2016;113:E3892–900. [DOI] [PMC free article] [PubMed] [Google Scholar]
- 36.Xie S, Duan J, Li B, Zhou P, Hon GC. Multiplexed Engineering and Analysis of Combinatorial Enhancer Activity in Single Cells. Mol Cell. 2017;66:285–299.e5. [DOI] [PubMed] [Google Scholar]
- 37.Obenauf AC, Massagué J. Surviving at a Distance: Organ-Specific Metastasis. Trends in Cancer. 2015;1:76–91. [DOI] [PMC free article] [PubMed] [Google Scholar]
- 38.Gao B, Radaeva S, Park O. Liver natural killer and natural killer T cells: immunobiology and emerging roles in liver diseases. Journal of Leukocyte Biology. 2009;86:513–28. [DOI] [PMC free article] [PubMed] [Google Scholar]
- 39.Naba A, Clauser KR, Ding H, Whittaker CA, Carr SA, Hynes RO. The extracellular matrix: Tools and insights for the “omics” era. Matrix Biology. 2016;49:10–24. [DOI] [PMC free article] [PubMed] [Google Scholar]
- 40.Hynes RO, Naba A. Overview of the Matrisome—An Inventory of Extracellular Matrix Constituents and Functions. Cold Spring Harb Perspect Biol. 2012;4:a004903. [DOI] [PMC free article] [PubMed] [Google Scholar]
- 41.Fukata Y, Adesnik H, Iwanaga T, Bredt DS, Nicoll RA, Fukata M. Epilepsy-related ligand/receptor complex LGI1 and ADAM22 regulate synaptic transmission. Science. 2006;313:1792–5. [DOI] [PubMed] [Google Scholar]
- 42.Lovero KL, Fukata Y, Granger AJ, Fukata M, Nicoll RA. The LGI1-ADAM22 protein complex directs synapse maturation through regulation of PSD-95 function. Proc Natl Acad Sci USA. 2015;112:E4129–4137. [DOI] [PMC free article] [PubMed] [Google Scholar]
- 43.Shen M, Jiang Y-Z, Wei Y, Ell B, Sheng X, Esposito M, et al. Tinagl1 Suppresses Triple-Negative Breast Cancer Progression and Metastasis by Simultaneously Inhibiting Integrin/FAK and EGFR Signaling. Cancer Cell. 2019;35:64–80.e7. [DOI] [PubMed] [Google Scholar]
- 44.Klotz R, Thomas A, Teng T, Han SM, Iriondo O, Li L, et al. Circulating tumor cells exhibit metastatic tropism and reveal brain metastasis drivers. Cancer Discov. 2019;CD-19–0384. [DOI] [PMC free article] [PubMed] [Google Scholar]
- 45.Minn AJ, Gupta GP, Siegel PM, Bos PD, Shu W, Giri DD, et al. Genes that mediate breast cancer metastasis to lung. Nature. 2005;436:518–24. [DOI] [PMC free article] [PubMed] [Google Scholar]
- 46.Edfors F, Danielsson F, Hallström BM, Käll L, Lundberg E, Pontén F, et al. Gene‐specific correlation of RNA and protein levels in human cells and tissues. Molecular Systems Biology. 2016;12:883. [DOI] [PMC free article] [PubMed] [Google Scholar]
- 47.Vogel C, Marcotte EM. Insights into the regulation of protein abundance from proteomic and transcriptomic analyses. Nat Rev Genet. 2012;13:227–32. [DOI] [PMC free article] [PubMed] [Google Scholar]
- 48.Toyama BH, Hetzer MW. Protein homeostasis: live long, won’t prosper. Nature Reviews Molecular Cell Biology. 2013;14:55–61. [DOI] [PMC free article] [PubMed] [Google Scholar]
- 49.Xie YJ, Dougan M, Jailkhani N, Ingram J, Fang T, Kummer L, et al. Nanobody-based CAR T cells that target the tumor microenvironment inhibit the growth of solid tumors in immunocompetent mice. PNAS. 2019;201817147. [DOI] [PMC free article] [PubMed] [Google Scholar]
- 50.Torriglia A, Martin E, Jaadane I. The hidden side of SERPINB1/Leukocyte Elastase Inhibitor. Seminars in Cell & Developmental Biology. 2017;62:178–86. [DOI] [PMC free article] [PubMed] [Google Scholar]
- 51.Chou R-H, Wen H-C, Liang W-G, Lin S-C, Yuan H-W, Wu C-W, et al. Suppression of the invasion and migration of cancer cells by SERPINB family genes and their derived peptides. Oncol Rep. 2012;27:238–45. [DOI] [PubMed] [Google Scholar]
- 52.Huasong G, Zongmei D, Jianfeng H, Xiaojun Q, Jun G, Sun G, et al. Serine protease inhibitor (SERPIN) B1 suppresses cell migration and invasion in glioma cells. Brain Res. 2015;1600:59–69. [DOI] [PubMed] [Google Scholar]
Associated Data
This section collects any data citations, data availability statements, or supplementary materials included in this article.