

Abstract
Clin Microbiol Infect 2012; 18: 366–373
Abstract
To characterize respiratory virus infections during the first autumn–winter season of pandemic A (H1N1) 2009 influenza virus (A/H1N1/2009) circulation, a prospective study in children attending a paediatric emergency department at the Sapienza University hospital, Rome, was conducted from November 2009 to March 2010. By means of both nasal washings and pharyngeal swabs, enrolled children were checked for 14 respiratory viruses. The majority of acute respiratory infections resulted from viral pathogens (135/231, 58%). Overall, the most common was respiratory syncytial virus (RSV), in 64% of positive samples; A/H1N1/2009 was the only influenza virus found in 16% and rhinovirus (RV) in 15%. Virus‐positive children did not differ significantly from virus‐negative children in signs and symptoms at presentation; of the virus groups, RSV‐infected children were younger and more frequently admitted to intensive‐care units than those infected with A/H1N1/2009 and RV. Of the hospitalized children, stratified by age, both infants and children aged >1 year with RSV were most severely affected, whereas A/H1N1/2009 infections were the mildest overall, although with related pulmonary involvement in older children. Children with RV infections, detected in two flares partially overlapping with the A/H1N1/2009 and RSV peaks, presented with bronchiolitis, wheezing and pneumonia. Leukocytosis occurred more frequently in RV‐infected and A/H1N1/2009‐infected children, and numbers of blood eosinophils were significantly elevated in RV‐infected infants. Given the fact that clinical and epidemiological criteria are not sufficient to identify viral respiratory infections, a timely virological diagnosis could allow different infections to be managed separately.
Keywords: Influenza A (H1N1) 2009 virus, influenza‐like illness, molecular diagnosis, respiratory syncytial virus, respiratory viruses, rhinovirus
Introduction
Hospital emergency departments (EDs) experience pressure on admissions during the winter months, because of respiratory infections; in winter, various respiratory pathogens that present with similar symptoms circulate widely in children [1]. Diagnosis of influenza virus infections, as with other respiratory pathogens, is usually based on clinical and epidemiological criteria, and is only rarely confirmed virologically [2]. However, lack of an aetiological diagnosis could hamper efforts to reduce the risk of pathogen transmission and the efficient use of the proper antiviral drugs. In order to evaluate the relative impact of a novel virus, laboratory‐confirmed data are needed on hospitalization rates for and clinical courses of respiratory viral infections.
In Italy, as in other northern hemisphere countries, pandemic A (H1N1) 2009 influenza virus (A/H1N1/2009) caused a first peak of infection in the spring and early summer months of 2009, and there was a second flare during the autumn, the normal epidemic period for various respiratory viruses. Recent papers have focused on the clinical course of A/H1N1/2009 infection [3, 4, 5], comparing patient data from the paediatric population with those available for seasonal influenza infections, but not with other respiratory virus clinical presentations and courses. In only one prospective study [3], conducted in the southern hemisphere, were the clinical features of A/H1N1/2009 compared with those of several other respiratory viruses (although not rhinovirus (RV) and other recently identified viruses).
The fact that A/H1N1/2009 circulates concurrently with other respiratory agents points to a need for better data on the epidemiology, clinical presentation and course of infections caused by the different respiratory viruses.
Accordingly, with the aim of characterizing respiratory viral infections during the first autumn–winter season characterized by A/H1N1/2009 circulation, children attending a paediatric ED in Rome for acute respiratory infections, whether subsequently hospitalized or not, were prospectively enrolled between November 2009 and March 2010. The signs and symptoms, laboratory data and clinical outcomes were then compared in order to characterize A/H1N1/2009 from other respiratory virus infections.
Materials and Methods
Patients
Between November 2009 and March 2010, consecutive children (age 0–16 years) attending the paediatric ED of a teaching hospital (Policlinico Umberto I, ‘Sapienza’ University of Rome, one of the largest EDs in Rome, with approximately 30 000 consultations per year) were eligible for enrolment in the study, if they presented with fever at admission (temperature ≥38°C) or in the preceding days and/or with at least one acute respiratory symptom (rhinorrhoea, cough, wheezing, or respiratory distress). Exclusion criteria were underlying chronic diseases (including cystic fibrosis, chronic pulmonary disease, congenital heart disease, and immunodeficiency). Informed consent was sought from the children’s parents for them to participate in the study, which had been approved by the hospital’s Ethics Committee. To ensure accurate virological diagnosis, two respiratory specimens—a pharyngeal swab (PS) (Virocult; Medical Wire and Equipment, Corsham, UK) and a nasal washing (NW) (3 mL of sterile saline solution injected into each nostril and collected with a syringe)—were taken during ED consultation from enrolled children, whether subsequently hospitalized or not. Detailed demographic, clinical and laboratory data were obtained from the patients’ medical files. A severity score ranging from 0 to 8 was assigned according to respiratory rate (age‐adjusted), arterial oxygen saturation in room air (0, >95%; 1, 95–90%; 2, <90%), the presence of retractions (0, none; 1, present;; 2, present + nasal flare), and ability to feed (0, normal; 1, reduced; 2, intravenous) [6].
PCR‐based test for respiratory virus detection
Within 24 h of arrival at the virology laboratory, aliquots of the PS medium (140 μL) that had been collected were used for RNA extraction with a QIAamp Viral RNA Mini Kit (Qiagen, Santa Clara, CA, USA), and subjected to reverse transcription driven by random hexamers, with the High‐Capacity cDNA Archive Kit (Applied Biosystems, Monza, Italy). NW samples were vortexed to shear mucus, and divided into three aliquots, one of which was used for RNA extraction as described above. Detection of the influenza A virus was performed with a PCR assay targeting the influenza M gene, according to WHO protocols (http://www.who.int/csr/resources/publications/swineflu/diagnostic_recommendations/en/index.html). Positive samples were subjected to a further PCR reaction, in nested format, targeting the M genomic sequence specific for A/H1N1/2009, with primer pairs designed for this study (first round—MEXF5, 5′‐TGCATGGGCCTCATATATACAA‐3′, and MEXR5, 5′‐ATGACCATCGTCAACATCCA‐3′; second round—SM670, 5′‐AGCTCCAGTGCTGGTCTGAAAG‐3′, and SMR900, 5′‐GACTCAGGCACTCCTTCCGTAGAA‐3′), and confirmed by sequencing. Thirteen respiratory viruses other than influenza A virus (influenza B virus, respiratory syncytial virus (RSV), adenovirus, RV, parainfluenza viruses (PIVs)1–3, human metapneumovirus (hMPV), coronaviruses OC43, 229E, NL63 and HKU1, and human bocavirus (hBoV)) were tested for with PCR assays, as previously described [7, 8]. A case was defined as positive when at least one of each type of sample (NW and PS) gave a positive result.
Quantitative real‐time PCR technique for A/H1N1/2009
Viral genome quantification was performed on cDNA from the most A/H1N1/2009‐positive PS sample. Primers and probes targeting the influenza M gene were derived from CDC protocols (http://www.who.int/csr/resources/publications/swineflu/CDCrealtimeRTPCRprotocol_20090428) and adapted for use in a 5′‐exonuclease TaqMan‐based real‐time PCR technique. The standards were obtained by cloning 105 bp of the viral M gene into the pCR2.1 plasmid with a TOPO TA cloning kit (Invitrogen, San Diego, CA, USA), according to the manufacturer’s instructions. A linear distribution (r = 0.99) was obtained between 101 and 109 copies of standard plasmid. Data were expressed as number of copies/mL of PS; limits of detection were 10 viral copies/mL.
Statistical analysis
Patient age, number of days of hospitalization and severity score were reported as median (range), and data were compared by means of the Kruskal–Wallis test. The Fisher exact test was used to analyse categorical independent variables. For continuous variables, Student’s t‐test and the Mann–Whitney U‐test were used to compare parametric and non‐parametric data, respectively. Data analysis was carried out with SPSS v. 1.3 for Windows; p‐values <0.05 were considered to be significant.
Results
PCR results for respiratory viruses and quantitative real‐time PCR for A/H1N1/2009
Both PS and NW samples from 231 enrolled children were tested for 14 respiratory viruses: a majority of acute respiratory infections presented with a viral pathogen (58%), with a low percentage of double infections (4%). Overall, RSV was the most common virus (87/135 positive samples; 64%), followed by influenza A virus (22/135; 16%), and RV (20/135; 15%). All influenza A virus samples were identified as A/H1N1/2009 by sequencing; no influenza B viruses were found. hMPV was found in 5/135 positive samples (3.7%), hBoV in 4/135 (3.0%), and coronavirus OC43 in 3/135 (2.2%); adenovirus, PIV1 and PIV3 were each detected in only one sample (0.7%).
Determination of the number of copies of A/H1N1/2009 was retrospectively performed in the PS samples of 18 A/H1N1/2009‐positive children, with a TaqMan‐based real‐time PCR technique (Table 1). In addition, PS samples taken either at hospital discharge or at follow‐up visits after a variable number of days (median 4.5 days; range 3–27 days) were tested for respiratory viruses; only two PS samples were positive for A/H1N1/2009 (Table 1). No significant correlation was found between number of copies of A/H1N1/2009 in the PS samples and patient data (i.e. age, length of hospitalization, duration of symptoms before hospitalization, clinical diagnosis, oseltamivir treatment, or positivity to PCR test performed at hospital discharge).
Table 1.
Patient data and viral loads referring to pandemic A (H1N1) 2009 influenza virus (A/H1N1/2009)‐positive pharyngeal swabs
| Patient no. | Age (months) | Days of hospital stay | Duration of symptoms before hospitalization (days) | Oseltamivir treatment (days) | Diagnosis | A/H1N1/2009 loada | Elapsed daysb | PCR resultc (A/H1N1/2009 loada) |
|---|---|---|---|---|---|---|---|---|
| 3 | 110 | 0 | NA | No | ILI | 5.26 | NA | NA |
| 7 | 18 | 0 | NA | No | ILI | 5.82 | NA | NA |
| 11 | 83 | 23 | 21 | Yes (5) | Pneumonia | 0.83 | 27 | Negative |
| 15 | 85 | 5 | 4 | Yes (5) | ILI | 2.72 | 4 | Negative |
| 16 | 146 | 8 | 3 | Yes (5) | Pneumonia | 3.25 | 7 | Negative |
| 23 | 1.3 | 5 | 1 | No | ILI | 3.18 | 4 | A/H1N1/2009 (2.96) |
| 34 | 8.2 | 4 | 4 | Yes (5) | Wheezing | 3.30 | 3 | A/H1N1/2009 (3.05) |
| 38 | 26 | 6 | 4 | Yes (5) | Pneumonia | 4.28 | 5 | Negative |
| 40 | 34 | 0 | NA | No | ILI | 4.43 | 11 | Negative |
| 41 | 33 | 0 | NA | No | Pneumonia | 3.91 | 5 | Negative |
| 45 | 221 | 6 | 7 | Yes (5) | ILI | 3.77 | 5 | Negative |
| 46 | 55 | 0 | NA | No | ILI | 4.30 | NA | NA |
| 50 | 8.3 | 5 | 5 | Yes (5) | ILI | 3.74 | 4 | Negative |
| 52 | 13 | 0 | NA | No | Pneumonia | 3.81 | NA | NA |
| 53 | 4.1 | 5 | 3 | No | Wheezing | 3.65 | 3 | Negative |
| 82 | 2 | 8 | 8 | Yes (5) | Bronchiolitis | 2.77 | 6 | Negative |
| 121 | 1.1 | 5 | 1 | No | Bronchiolitis | 3.07 | 4 | Negative |
| 124 | 10 | 5 | 8 | No | Pneumonia | 2.51 | 4 | Negative |
ILI, influenza‐like‐illness, definition provided by Italian Ministry of Health, i.e. fever (temperature ≥38°C), with at least one of headache, asthenia, or myalgia, and at least one of the respiratory symptoms of cough, rhinitis, or acute pharyngitis; NA, not applicable.
aA/H1N1/2009 load: log copies/mL of pharyngeal swab (PS).
bDays elapsed between the first and the second PS, taken at enrolment and at hospital discharge or at follow‐up visit.
cResult of RT‐PCR tests performed on the second PS taken at hospital discharge or at follow‐up visit.
Respiratory virus infection rates and distribution
A/H1N1/2009 infections were found mainly in the first weeks of November, the last few cases being found in December (Fig. 1). During November, 19/47 (40%) enrolled patients, representing 73% (19/26) of the viral respiratory infections, were infected with A/H1N1/2009. Although three RSV infections were found in November, full seasonal activity for RSV started in December, appeared to peak in February, and decreased in March. Throughout January and February, RSV affected 49% (51/104) of the total number of patients and 88% (51/58) of those who were virus‐positive. RV was found throughout the study period (Fig. 1), with two peaks, the first being in November/December, corresponding to the second half of the H1N1 2009 peak and the beginning of RSV seasonal activity. After all but disappearing during January and February, RV peaked again in March, at the end of the RSV season. For the two peak periods, RV infections affected 21% (11/52) and 33% (8/24), respectively, of the total number of patients presenting for acute respiratory infections; 4/20 (20%) RV‐infected children were co‐infected with other respiratory viruses (two RSV, one hMPV, and one hBoV), with a significant difference in co‐infection rates vs. A/H1N1/2009 and RSV (p <0.05; chi‐squared test).
Figure 1.
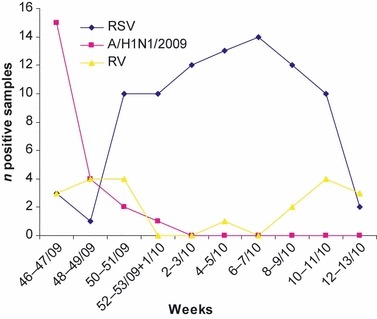
Virus distribution in children attending an emergency department (November 2009–March 2010). RSV, respiratory syncytial virus; A/H1N1/2009, pandemic A (H1N1) 2009 influenza virus; RV, rhinovirus.
Patient data and clinical diagnosis
Analysis of patient signs and symptoms at ED presentation, and of any requirement for hospitalization or admittance to the paediatric intensive‐care unit (PICU), was performed initially between virus‐negative and virus‐positive patients and then for four different virus groups (Table 2). Overall, virus‐infected patients presented with similar frequencies of fever, cough and respiratory parameters (thoracic auscultation, oxygen saturation (S a o 2)) as virus‐negative children and were hospitalized at similar rates, but were significantly more frequently admitted to the PICU (Table 2). Among the virus‐positive groups, RSV‐infected children were, as expected, significantly younger than those who tested positive for A/H1N1/2009 and RV, presented with significantly lower saturation rates, and were more frequently admitted to the PICU than other virus groups (Table 2). Children infected with A/H1N1/2009 presented as frequently with fever, cough and gastrointestinal symptoms as other children with acute respiratory infections, whether virus‐positive or not, and did not suffer from severe respiratory distress, as also documented by a significantly higher rate of negative thoracic auscultation than in the other groups. The ED presentations of RV‐infected children appeared to be indistinguishable in terms of signs and symptoms from those of other groups (Table 2).
Table 2.
Patient presentation at emergency department triage
| Patient data | Virus‐negative | Virus‐positive | RSV | A/H1N1/2009 | RV | Other viruses/co‐infectionsa |
|---|---|---|---|---|---|---|
| N = 96 | N = 135 | N = 81 | N = 22 | N = 16 | N = 16 | |
| Age (months), median (range) | 11 (0–132) | 5 (0–593) | 2 (0–51)b | 26 (1–221) | 13 (0–593) | 6 (1–153) |
| Gender (male), no. (%) | 49/96 (51) | 70/135 (52) | 44/81 (54) | 12/22 (55) | 7/16 (44) | 7/16 (44) |
| Feverc, no. (%) | 67/96 (70) | 95/135 (70) | 54/81 (67) | 19/22 (86) | 9/16 (56) | 13/16 (81) |
| Cough, no. (%) | 83/96 (86) | 126/135 (93) | 77/81 (95) | 18/22 (82) | 16/16 (100) | 14/16 (87) |
| Gastrointestinal symptoms, no. (%) | 40/96 (42)d | 33/135 (24)d | 16/81 (20) | 5/22 (23) | 6/16 (37) | 5/16 (31) |
| Negative TA, no. (%) | 21/96 (22) | 25/135 (19) | 7/81 (9) | 13/22 (59)e | 1/16 (6) | 4/16 (25) |
| Crackles, no. (%) | 44/96 (46) | 64/135 (47) | 43/81 (53) | 7/22 (32) | 8/16 (50) | 5/16 (31) |
| Wheezing, no. (%) | 28/96 (29) | 46/135 (34) | 30/81 (37) | 2/22 (9) | 7/16 (44) | 4/16 (25) |
| S a o 2 < 95%, no. (%) | 18/96 (19) | 38/135 (28) | 30/81 (37)f | 2/22 (9) | 2/16 (12) | 4/16 (25) |
| Hospitalized, no. (%) | 83/96 (86) | 125/135 (93) | 78/81 (96) | 16/22 (73) | 16/16 (100) | 15/16 (94) |
| PICU, no. (%) | 2/83 (2)g | 22/125 (18)g | 17/78 (22)h | 2/16 (12)h | 2/16 (12)h | 1/15 (7)h |
A/H1N1/2009, pandemic A (H1N1) 2009 influenza virus; PICU, paediatric intensive‐care unit; RSV, respiratory syncytial virus; RV, rhinovirus; single infections only; S a o 2, oxygen saturation; TA, thoracic auscultation.
aThree single infection for coronavirus OC43, one single infection each for human metapneumovirus (hMPV), parainfluenza virus (PIV)3, adenovirus, and human bocavirus (hBoV), and nine co‐infections (three RSV–hMPV, two RSV–RV, one RSV–hBoV, one RV–hMPV, one RV–hBoV, and one hBoV–PIV1).
bAge in months: p <0.05 for RSV vs. A/H1N1/2009, RV, and other virus/co‐infections, calculated with the Kruskal–Wallis test.
cFever (temperature ≥38.0°C).
dGastrointestinal symptoms: p <0.05 for virus‐negative vs. virus‐positive, calculated with the chi‐squared test.
eNegative TA: p <0.05 for A/H1N1/2009 vs. all other groups, calculated with the chi‐squared test.
f S a o 2 < 95%: p <0.05 for RSV vs. A/H1N1/2009, RV, and other virus/co‐infections, calculated with the chi‐squared test.
gPICU admission among hospitalized patients: p <0.05 for virus‐positive vs. virus‐negative, calculated with the chi‐squared test.
hPICU admission among hospitalized patients: p <0.05 for RSV vs. all other groups, calculated with the chi‐squared test.
To better evaluate the clinical course in hospitalized patients infected with RSV, A/H1N1/2009 and RV as single infections, patient data were analysed with stratification by age (Table 3). Whether in infants or in children aged >1 year, RSV cases presented a higher severity score with respect to A/H1N1/2009 but not to RV, whereas no significant difference was found in number of days of hospitalization between virus groups. For blood cell counts, several statistically significant differences between virus groups were found. Among children aged ≤1 year, those infected with RV presented with leukocytosis (defined as white blood cell (WBC) counts >15 000/mm3) and elevated lymphocyte and eosinophil counts as compared with those infected with RSV; as compared with the RSV group, the A/H1N1/2009 group presented only with significantly higher lymphocyte counts. In children aged >1 year, the total WBC and neutrophil counts were elevated in RV cases, at a statistically significant level, as compared with patients infected with RSV only, but three RV patients probably had a concomitant bacterial infection, having WBC counts >15 000/mm3 and C‐reactive protein levels of approximately 9 mg/mL.
Table 3.
Patient clinical data, stratified by age, and distributed by respiratory virus results
| Patient data: age ≤1 year | RSV | A/H1N1/2009 | RV | p‐value |
|---|---|---|---|---|
| N = 55 | N = 8 | N = 9 | ||
| Hospitalization (days): median (range) | 5 (3–27) | 5 (3–8) | 5 (4–15) | NS |
| Severity scorea: median (range) | 5 (0–8)b | 1 (1–3)b | 3 (0–5) | <0.05b |
| WBC >15 000/mm3, n (%) | 4/55 (7)c | 1/8 (12) | 4/9 (44)c | <0.05c |
| Lymphocytes (n/mm3), median (range) | 3850d (368–8418) | 4447d (2368–13 007) | 7901d (2772–35 552) | <0.05d |
| Neutrophils (n/mm3), median (range) | 3500 (507–20 600) | 2574 (608–8536) | 6105 (2298–18 564) | NS |
| Eosinophils (n/mm3), median (range) | 63e (4–638) | 28e (10–405) | 119e (55–1081) | <0.05e |
| CRP >0.8 mg/mL, n (%) | 16/55 (29) | 3/8 (37) | 5/9 (55) | NS |
| Patient data: age >1 year | RSV | A/H1N1/2009 | RV | p‐value |
|---|---|---|---|---|
| N = 23 | N = 8 | N = 7 | ||
| Hospitalization (days), median (range) | 5 (2–18) | 5 (4–23) | 4 (4–9) | NS |
| Severity scorea, median (range) | 3 (0–8)b | 0.5 (0–6)b | 3 (1–6) | 0.05b |
| WBC >15 000/mm3, n (%) | 5/23 (22)c | 2/8 (25) | 5/7 (71)c | <0.05c |
| Lymphocytes (n/mm3), median (range) | 2752 (803–7595) | 1058 (398–3819) | 2643 (681–5632) | NS |
| Neutrophils (n/mm3), median (range) | 5932c (1062–22 480) | 6186c (914–16 839) | 15 935c (8480–29 352) | <0.05c |
| Eosinophils (n/mm3), median (range) | 28 (0.1–291) | 26 (0.2–217) | 113 (8–224) | NS |
| CRP >0.8 mg/mL, n (%) | 9/23 (39) | 5/8 (62) | 4/7 (57) | NS |
A/H1N1/2009, pandemic A (H1N1) 2009 influenza virus; CRP, blood C‐reactive protein; NS, not significant; RSV, respiratory syncytial virus; RV, rhinovirus; WBC, white blood cell; only hospitalized patients with single infections were considered.
aAge‐adjusted severity score [6].
bRSV vs. A/H1N1/2009: p <0.05, calculated with Fisher’s exact test.
cRV vs. RSV: p <0.05, calculated with the Mann–Whitney U‐test.
dRSV vs. A/H1N1/2009 and RSV vs. RV: p <0.05, calculated with the Mann–Whitney U‐test.
eRV vs. RSV and RV vs. A/H1N1/2009: p <0.05, calculated with the Mann–Whitney U‐test.
The main discharge clinical diagnoses are presented in Table 4, distributed by respiratory virus results. Bronchiolitis (defined as a history of upper respiratory tract infection followed by acute onset of respiratory distress with cough, tachypnoea, retraction and diffuse crackles on auscultation in infants within 1 year) was the most frequent clinical diagnosis, and 49% of these cases were RSV single infections; the second most frequent single agent was RV (7%), whereas 16% of bronchiolitis cases were infected with other viruses or co‐infected; no viruses were found in the remaining cases. Pneumonia was the second most frequent clinical diagnosis, and RSV was the most frequent viral pathogen found (47% of virus‐positive cases). It is noteworthy that 7/8 children aged >1 year affected with A/H1N1/2009 were diagnosed with pneumonia.
Table 4.
Clinical diagnosis distributed by respiratory virus results
| Clinical diagnosisa | RSVb | A/H1N1/2009b | RVb | Other viruses/co‐infectionsb,c | No virusb |
|---|---|---|---|---|---|
| Bronchiolitis: | 51 (2) (49%) | 3 (0) (3%) | 7 (0) (7%) | 7 (1) (7%) | 36 (0) (35%) |
| n = 104 (3) | |||||
| Pneumonia | 16 (0) (25%) | 8 (2) (12%) | 3 (0) (5%) | 7 (0) (11%) | 30 (6) (47%) |
| n = 64 (8) | |||||
| Wheezy bronchitis: | 13 (0) (32%) | 3 (0) (7%) | 6 (0) (15%) | 2 (0) (5%) | 16 (0) (40%) |
| n = 40 (0) | |||||
| ILId | 0 | 7 (4) (33%) | 0 | 1 (5%) | 13 (7) (62%) |
| n = 21 (12) |
A/H1N1/2009, pandemic A (H1N1) 2009 influenza virus; ILI, influenza‐like illness; RSV, respiratory syncytial virus; RV, rhinovirus.
a n, total number of cases per diagnosis; numbers in parentheses are cases not hospitalized per diagnosis.
b n, number of cases per virus group per diagnosis, numbers in parentheses are cases not hospitalized; (%) are on the total cases per diagnosis.
cThree single infection for coronavirus OC43, one single infection each for human metapneumovirus (hMPV), parainfluenza virus (PIV)3, adenovirus, and human bocavirus (hBoV), and nine co‐infections (three RSV–hMPV, two RSV–RV, one RSV–hBoV, one RV–hMPV, one RV–hBoV, and one hBoV–PIV1).
dILI definition provided by the Italian Ministry of Health, i.e. fever (temperature ≥38°C), with at least one of headache, asthenia, or myalgia, and at least one of the respiratory symptoms of cough, rhinitis, or acute pharyngitis.
RSV was also the most prevalent virus (32%) in patients with a wheezy bronchitis diagnosis, followed by RV (15%) and A/H1N1/2009 (7%); in 40% of wheezing patients, no virus was detected. Children with a diagnosis of influenza‐like illness (definition provided by the Italian Ministry of Health, i.e. fever (temperature ≥38°C), with at least one of headache, asthenia, or myalgia, and at least one of the respiratory symptoms of cough, rhinitis, or acute pharyngitis) had the lowest rate of hospitalization (57%) as compared with the other clinical diagnoses; A/H1N1/2009 infected 33% of influenza‐like illness cases, but in most of these (62%) no respiratory virus was found.
Discussion
In the framework of a study aimed at characterizing respiratory virus infections, we compared signs and symptoms, laboratory results and clinical outcomes in prospectively enrolled paediatric patients seeking medical care in EDs during the first autumn–winter season characterized by A/H1N1/2009 circulation. The rate of A/H1N1/2009 infection in the study period was <10%, whereas, during November, 41% (19/46) of the enrolled children were infected with A/H1N1/2009, representing 73% (19/26) of the viral respiratory infections.
The national sentinel surveillance systems for influenza (Influnet) of the Italian Ministry of Health reported the peak in influenza A incidence in week 45 of 2009, just when the study period started, with 25.7 cases/1000 served population in the 0–4‐year age group and 43.1 cases/1000 in the 5–14‐year age group [9]. The reported incidence of influenza A fell at the end of November, and in December the rates were very low [9], according to the distribution of A/H1N1/2009 cases in our study. In addition, the national surveillance system reported approximately 1100 laboratory‐confirmed hospitalized cases, 40% of which had underlying risk factors [9]. In this study, we restricted enrolment to children with no underlying chronic diseases; Italian papers [10, 11, 12] on hospitalized children have reported other inclusion criteria or focused on specific aspects, so it is difficult to compare data.
At ED presentation, no respiratory signs/symptoms could differentiate virus infection from other causes of acute respiratory syndrome, but virus‐infected children were more often admitted to the PICU than those with negative results for respiratory viruses. Presentations of children infected with A/H1N1/2009 were quite similar to those for other acute respiratory infections; only RSV infections could be associated with younger age, significantly lower oxygen saturation rates, and more frequent admissions to the PICU. Thus, as indicated in previous studies in adult patients [13, 14, 15], ED triage assessment would not be able to separate virus‐infected patients from non‐infected patients, or to identify a specific agent.
Over the study period, unlike in previous seasons, the A/H1N1/2009 prevalence peak preceded the period in which RSV circulated (December–March); RV circulated in November–December, when the A/H1N1/2009 prevalence was declining and the RSV prevalence was rising, and in March, when RSV circulation was diminishing. Thus, although RV showed a tendency to circulate at the end of either the A/H1N1/2009 or RSV peaks, RV infections also occurred at the same time as infections with the two major respiratory viruses, A/H1N1/2009 and RSV, and presented a rate of co‐infections (20% of positive samples) consistent with previous reports [16, 17]. Interestingly, in this study, A/H1N1/2009 occurred as a single infection, whereas RSV presented with a low frequency of co‐infection (7%). The relatively low rate of mixed respiratory virus infections (only about 4% of the total number of samples) and the low percentages of detection of PIV1, PIV3 and hMPV found in this study as compared with our previous studies [7, 8], in which the same RT‐PCR reactions were used, could be explained by the unusual prevalence of an influenza A virus, A/H1N1/2009, in October–November. In fact, several papers [18, 19, 20] have reported changes in respiratory virus circulation in the past season, and suggested, as a possible explanation, that the activation of innate immunity resulting from a respiratory infection would prevent superinfection with other respiratory pathogens [21]; further studies are needed to investigate this possibility.
Evaluation of the clinical characteristics of enrolled patients confirmed that RSV is the pathogen with the highest severity of infection in children, with the highest number of PICU admissions, even though the total days of hospitalization were not significantly different from those for other groups. In our patients, leukocytosis occurred less frequently in RSV infections than in RV and A/H1N1/2009 infections, and lymphocyte, neutrophil and eosinophil counts were not elevated as compared with other virus‐positive groups (Table 3) and the virus‐negative group (data not shown). These findings are consistent with previous reports, and might imply either that leukocytes are not alerted by RSV infection or that they are being recruited at specific sites away from the circulating blood, as has been suggested by others [22, 23, 24]. Lymphocyte and eosinophil counts were significantly increased in RV‐infected infants as compared with other groups; as blood eosinophil counts are predictors of reactive airway disease, our finding is consistent with studies reporting early RV infections as an important risk factor for recurrent wheezing [25, 26].
Patients infected with A/H1N1/2009 experienced a mild clinical course overall, as documented by severity scores that were significantly lower than those for RSV cases; nevertheless, in our series, 7/8 (87%) A/H1N1/2009‐infected children aged >1 year had a final clinical diagnosis of pneumonia. The rate of A/H1N1/2009 pneumonia diagnosis found in this study is consistent with previous reports of A/H1N1/2009 pulmonary replication greater than that expected from a seasonal influenza virus [5, 27]. It has been suggested that the greater rate of pneumonia might perhaps differentiate A/H1N1/2009 from seasonal influenza [4]; however, this criterion will not help to discriminate it from other respiratory virus infections, as pneumonia, being a clinical diagnosis, is not suggestive of a specific viral infection.
If diagnostic tests are not performed, epidemiological and clinical criteria could lead to the misdiagnosis of viral infections for which specific treatments might be available. Even though specific antiviral drugs are currently used only in cases of influenza virus infection, the usefulness of proper treatment against RSV and RV infections in infants would be improved by the use of virological molecular diagnosis. As an example, even though treatment with systemic corticosteroids is not recommended in cases of RSV infection, it has been reported that administration of prednisolone to hospitalized children with first episodes of wheezing associated with RV infection reduces the frequency of relapse [28].
In conclusion, in the season characterized by the first autumn–winter circulation of a new pandemic influenza virus, RSV was the most frequent and relevant respiratory virus determining ED consultations for children of any age, A/H1N1/2009 was confirmed as a mild pathogen but with a relevant rate of pulmonary replication, and RV was established as the third most relevant agent for children’s hospitalization for respiratory infections. Considering the fact that clinical presentation is not useful in discriminating between viral pathogens, a timely virological diagnosis is essential in order to separate infected patients during pandemic alerts or at‐risk children, and in order to prescribe specific treatments for influenza A virus, RSV and RV infections.
Transparency Declaration
This study was supported by grants to G. Antonelli and A. Pierangeli from ‘Sapienza’ Università di Roma (fondi ricerche Universitarie), the Italian Ministry of Health (Ricerca Finalizzata Conv. No. 88) and the Pasteur Institute, Cenci Bolognetti Foundation. The authors declare no conflicts of interest.
References
- 1. Bourgeois FT, Valim C, Wei JC, McAdam AJ, Mandl KD. Influenza and other respiratory virus‐related emergency department visits among young children. Pediatrics 2006; 118: e1–e8. [DOI] [PubMed] [Google Scholar]
- 2. Harper SA, Bradley JS, Englund JA et al. Seasonal influenza in adults and children—diagnosis, treatment, chemoprophylaxis, and institutional outbreak management: clinical practice guidelines of the Infectious Diseases Society of America. Clin Infect Dis 2009; 48: 1003–1032. [DOI] [PMC free article] [PubMed] [Google Scholar]
- 3. Libster R, Bugna J, Coviello S et al. Pediatric hospitalizations associated with 2009 pandemic influenza A (H1N1) in Argentina. N Engl J Med 2010; 362: 45–55. [DOI] [PubMed] [Google Scholar]
- 4. Shiley KT, Nadolski G, Mickus T, Fishman NO, Lautenbach E. Differences in the epidemiological characteristics and clinical outcomes of pandemic (H1N1) 2009 influenza, compared with seasonal influenza. Infect Control Hosp Epidemiol 2010; 31: 676–682. [DOI] [PMC free article] [PubMed] [Google Scholar]
- 5. Writing Committee of the WHO Consultation on Clinical Aspects of Pandemic (H1N1) 2009 Influenza . Clinical aspects of pandemic 2009 influenza A (H1N1) virus infection. N Engl J Med 2010; 362: 1708–1719. [DOI] [PubMed] [Google Scholar]
- 6. Wainwright C, Altamirano L, Cheney M et al. A multicenter, randomized, double‐blind controlled trial of nebulized epinephrine in infants with acute bronchiolitis. N Engl J Med 2003; 349: 27–35. [DOI] [PubMed] [Google Scholar]
- 7. Pierangeli A, Gentile M, Di Marco P et al. Detection and typing by molecular techniques of respiratory viruses in children hospitalized for acute respiratory infection in Rome, Italy. J Med Virol 2007; 79: 463–468. [DOI] [PMC free article] [PubMed] [Google Scholar]
- 8. Pierangeli A, Scagnolari C, Trombetti S et al. Human bocavirus infection in hospitalized children in Italy. Influenza Other Resp Viruses 2008; 2: 175–179. [DOI] [PMC free article] [PubMed] [Google Scholar]
- 9. Rizzo C, Rota MC, Bella A et al. Response to the 2009 influenza A(H1N1) pandemic in Italy. Euro Surveill 2010; 15: pii:19744. [DOI] [PubMed] [Google Scholar]
- 10. Baldanti F, Campanini G, Piralla A et al. Severe outcome of influenza A/H1N1/09v infection associated with 222G/N polymorphisms in the haemagglutinin: a multicentre study. Clin Microbiol Infect 2010. doi: 10.1111/j.1469-0691.2010.03403.x. [Epub ahead of print] [DOI] [PubMed] [Google Scholar]
- 11. Calitri C, Gabiano C, Garazzino S et al. Clinical features of hospitalised children with 2009 H1N1 influenza virus infection. Eur J Pediatr 2010; 169: 1511–1515. [DOI] [PubMed] [Google Scholar]
- 12. Chiappini E, Galli L, Azzi A, Resti M, Bonsignori F, de Martino M. Lymphocytopenia as a marker for pandemic influenza A/H1N1 2009 virus infection in children. J Med Virol 2011; 83: 1–4. [DOI] [PubMed] [Google Scholar]
- 13. Ison MG. Influenza in hospitalized adults: gaining insight into a significant problem. J Infect Dis 2009; 200: 485–488. [DOI] [PubMed] [Google Scholar]
- 14. Goodacre S, Challen K, Wilson R, Campbell M. Evaluation of triage methods used to select patients with suspected pandemic influenza for hospital admission: cohort study. Health Technol Assess 2010; 14: 173–236. [DOI] [PubMed] [Google Scholar]
- 15. Pierangeli A, Scagnolari C, Gentile M et al. Virological diagnosis of respiratory virus infection in patients attending an emergency department during the influenza season. Clin Microbiol Infect 2010; 16: 391–393. [DOI] [PubMed] [Google Scholar]
- 16. Lambert SB, Allen KM, Druce JD, Birch CJ, Mackay IM, Carlin JB. Community epidemiology of human metapneumovirus, human coronavirus NL63, and other respiratory viruses in healthy preschool‐aged children using parent‐collected specimens. Pediatrics 2007; 120: e929–e937. [DOI] [PubMed] [Google Scholar]
- 17. Greer RM, McErlean P, Arden KE et al. Do rhinoviruses reduce the probability of viral co‐detection during acute respiratory tract infections? J Clin Virol 2009; 45: 10–15. [DOI] [PMC free article] [PubMed] [Google Scholar]
- 18. Casalegno JS, Ottmann M, Bouscambert‐Duchamp M, Valette M, Morfin F, Lina B. Impact of the 2009 influenza A(H1N1) pandemic wave on the pattern of hibernal respiratory virus epidemics, France, 2009. Euro Surveill 2010; 15: pii: 19485. [PubMed] [Google Scholar]
- 19. Linde A, Rotzén‐Ostlund M, Zweygberg‐Wirgart B, Rubinova S, Brytting M. Does viral interference affect spread of influenza? Euro Surveill 2009; 14: pii: 19354. [PubMed] [Google Scholar]
- 20. Casalegno JS, Ottmann M, Duchamp MB et al. Rhinoviruses delayed the circulation of H1N1(2009) viruses in France. Clin Microbiol Infect 2010; 16: 326–329. [DOI] [PubMed] [Google Scholar]
- 21. Haller O, Kochs G, Weber F. The interferon response circuit: induction and suppression by pathogenic viruses. Virology 2006; 344: 119–130. [DOI] [PMC free article] [PubMed] [Google Scholar]
- 22. Everard ML, Swarbrick A, Wrightham M et al. Analysis of cells obtained by bronchial lavage of infants with respiratory syncytial virus infection. Arch Dis Child 1994; 71: 428–432. [DOI] [PMC free article] [PubMed] [Google Scholar]
- 23. O’Donnell DR, Carrington D. Peripheral blood lymphopenia and neutrophilia in children with severe respiratory syncytial virus disease. Pediatr Pulmonol 2002; 34: 128–130. [DOI] [PubMed] [Google Scholar]
- 24. Franz A, Adams O, Willems R et al. Correlation of viral load of respiratory pathogens and co‐infections with disease severity in children hospitalized for lower respiratory tract infection. J Clin Virol 2010; 48: 239–245. [DOI] [PMC free article] [PubMed] [Google Scholar]
- 25. Jackson DJ, Gangnon RE, Evans MD et al. Wheezing rhinovirus illnesses in early life predict asthma development in high‐risk children. Am J Respir Crit Care Med 2008; 178: 667–672. [DOI] [PMC free article] [PubMed] [Google Scholar]
- 26. Jartti T, Lehtinen P, Vuorinen T, Ruuskanen O. Bronchiolitis: age and previous wheezing episodes are linked to viral etiology and atopic characteristics. Pediatr Infect Dis J 2009; 28: 311–317. [DOI] [PubMed] [Google Scholar]
- 27. Itoh Y, Shinya K, Kiso M et al. In vitro and in vivo characterization of new swine origin H1N1 influenza viruses. Nature 2009; 460: 1021–1025. [DOI] [PMC free article] [PubMed] [Google Scholar]
- 28. Jartti T, Lehtinen P, Vanto T et al. Evaluation of the efficacy of prednisolone in early wheezing induced by rhinovirus or respiratory syncytial virus. Pediatr Infect Dis J 2006; 25: 482–488. [DOI] [PubMed] [Google Scholar]