

Abstract
Bioaerosols consist of aerosols originated biologically such as metabolites, toxins, or fragments of microorganisms that are present ubiquitously in the environment. International interests in bioaerosols have increased rapidly to broaden the pool of knowledge on their identification, quantification, distribution, and health impacts (e.g., infectious and respiratory diseases, allergies, and cancer). However, risk assessment of bioaerosols based on conventional culture methods has been hampered further by several factors such as: (1) the complexity of microorganisms or derivatives to be investigated; (2) the purpose, techniques, and locations of sampling; and (3) the lack of valid quantitative criteria (e.g., exposure standards and dose/effect relationships). Although exposure to some microbes is considered to be beneficial for health, more research is needed to properly assess their potential health hazards including inter-individual susceptibility, interactions with non-biological agents, and many proven/unproven health effects (e.g., atopy and atopic diseases).
Keywords: Health effect, Exposure, Infectious diseases, Respiratory diseases, Cancer, Guideline
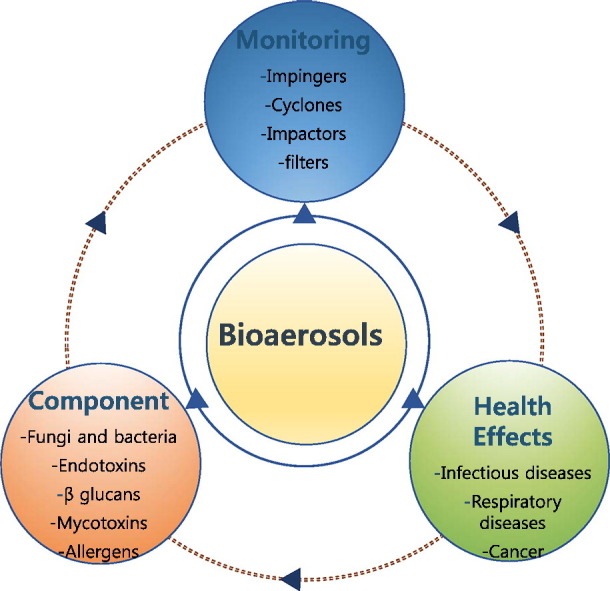
Graphical abstract
Introduction
Bioaerosols are very small airborne particles (ranging from 0.001 to 100 μm) that originate biologically from plants/animals and can contain living organisms (Georgakopoulos et al., 2009). Therefore, pathogenic and/or non-pathogenic dead or alive microorganisms (e.g., viruses, bacteria, and fungi) may exist in bioaerosols (Mandal and Brandl, 2011). Bioaerosols are easily shifted from one environment to another because of their small size and light weight (Van Leuken et al., 2016). In recent years, exposure to bioaerosols in both occupational and residential environments has drawn much attention in light of their probable impacts on human health.
Sources of bioaerosol exposure in occupational activities are diverse enough to include waste sorting and composting, agricultural and food processing activities, the livestock industry, etc. (Pearson et al., 2015). Indeed, the prevalence of diverse respiratory diseases or symptoms (allergic asthma, rhinitis, airway inflammation, etc.) has been reported from workers susceptible to such exposure (Beck et al., 2012, Rohr et al., 2015). Bioaerosols were estimated to be responsible for approximately 5 to 34% of indoor particulate matter air pollution (Mandal and Brandl, 2011). The sources of indoor bioaerosol pollution include outdoor sources (passing through windows, doors, and ventilation); building materials; furnishings; occupants; pets; house plants; and organic wastes (Nazaroff, 2016). Regular or ordinary human activities (e.g., coughing, washing, toilet flushing, talking, walking, sneezing, and sweeping floors) are also capable of generating bioaerosols (Chen and Hildemann, 2009). However, basic environmental conditions, such as temperature and moisture content, can considerably influence the extent of their formation and dispersion due to their controlling effect on the formation of microorganisms (Dedesko et al., 2015). Consequently, the prevalence of bioaerosols can be associated with certain human diseases, such as pneumonia, influenza, measles, asthma, allergies, and gastrointestinal illness (Srikanth et al., 2008). However, under certain circumstances, exposure to some microbes is beneficial for health in terms of developing a healthy immune system and protect children from developing allergies and asthma (Severson et al., 2010). Although the importance of bioaerosols and their impact on human health has been recognized, it is yet difficult to accurately describe their role in the initiation or worsening of diverse symptoms and diseases. Table 1 presents the types of microorganisms and their resulting diseases. In this review, we give a comprehensive overview on bioaerosols based on the most recent publications covering this subject, with major emphasis on their compositions, and health effects. As a result, we hope that this review work will help researchers extend and establish better knowledge in relevant fields.
Table 1.
Microorganisms and some of the major resulting diseases.
| Order | Species | Approximate size | Resulting disease | Infection/transmission |
|---|---|---|---|---|
| 1 | Legionella pneumophila | Length: 2 μm Width: 0.3–0.9 μm | Legionnaires' disease | Inhalation of a water aerosol containing the bacteria |
| 2 | Mycobacterium tuberculosis | Length: 2–4 μm Width: 0.2–0.5 um | Tuberculosis | Person to person through the air |
| 3 | Bordetella pertussis | Length:40–100 nm Diameter: 2 nm |
Whooping cough | Direct contact or inhalation of airborne droplets |
| 4 | Yersinia pestis | Length: 1–3 μm Width:0.5–0.8 μm |
Pneumonic plague | Being bitten by infected rodent flea or by handling infected animals |
| 5 | Bacillus anthracis spore | Length: 3–5 μm Width: 1.0–1.2 μm |
Anthrax | Contact with infected animals, flies, and the breathing of air containing anthrax spores |
| 6 | Variola vera | Length: 220–450 nm Width:140–260 nm |
Smallpox | Inhalation of airborne variola virus, prolonged face-to-face contact with an infected person, direct contact with infected bodily fluids or contaminated objects |
| 7 | Herpesvirida, HHV-3 | Diameter: 150–200 nm | Chickenpox and shingles | Direct contact with fluid from the rash blisters caused by shingles |
| 8 | Morbillivirus measles | Length: 125–250 nm Diameter: 21 nm) |
Measles, mumps, and rubella | Bodily fluids: drops of saliva, mucus from the nose, coughing or sneezing, tears from the eyes, etc. |
| 9 | Varibrio Cholerae | Length: 1.4–2.6 μm Width: 0.5–0.8 μm |
Cholera | Bite of contaminated food or a sip of contaminated water |
| 10 | Salmonella Typhi | Length: 0.7–1.5 μm Thickness: 28 μm |
Typhoid | Through contaminated food or water and occasionally through direct contact with someone who is infected |
| 11 | Microsporum Trichophyton | Length:5–100 mm Width: 3–8 mm | Ringworm | Direct or indirect contact with skin or scalp lesions of infected people, animals or fomites |
1. Sampling of bioaerosols
It is reasonable to expect that the presence of each type of bioaerosol should reflect unique environmental conditions facilitating its formation and the mechanical stresses. The selection of sampling tool for airborne bioaerosol should thus be more delicate than those commonly employed for the general analysis of particle composition. However, as the sampling methods are not yet well defined for such specific purposes, the methods developed for general purposes can be applied for the sampling of bioaerosol with or without modifications: (i) impingers, (ii) cyclones, (iii) impactors, (iv) filters, (v) spore traps, (vi) electrostatic precipitation, (vii) thermal precipitators, (viii) condensation traps, (ix) gravitational samplers (e.g. settle plates), etc. (Haig et al., 2016). Instrumental setups of some of these samplers are shown in Fig. 1 . Usually these sampling devices separate particles from the air stream for their stable collection in or on a preselected medium (Jensen and Schafer, 1998). Gravitational sampling is passive (non-volumetric) to facilitate the collection of particles by gravitional force on coated microscope slide, agar plates, etc. (Wang et al., 2001). For inertial bioaerosol samplers, a number of options are available to include impactors, sieves, and stacked sieves. These setups allow the collection of particles by size selective sampling as they rely on the properties of particle to deviate from airflow streamlines due to inertia (Haig et al., 2016). Non-inertial samplers (e.g., filtration, electrostatic precipitation, thermal precipitators, and condensation traps) do not rely on inertia of particles for operation; thus, they are less reliant on particle size (Ghosh et al., 2015).
Fig. 1.

Instrumental setups for bioaerosol sampling.
Bioaerosol samples are usually collected into liquid media or on solid filters. As they do not dry out and keep their viability, the use of liquid media may cause less stress on the bioaerosol components (Lehtinen et al., 2013). Nonetheless, as such an application is still limited for analysis of the effects of size segregation, it is less preferable to conduct in-depth assessment of bioaerosols.
Airborne particles are collected into a liquid collection medium in impingers and/or cyclones method. Impingers are operated by channeling air flow through nozzles to the collection chamber containing liquid. Hence, a number of factors (e.g., the air flow rate and distance between nozzle outlet and the surface of the liquid) influence the size diameter of the particles to be collected (Han and Mainelis, 2012). In a cyclone sampler, air is forced into the collection chamber through a spiraling, swirling flow. To escalate the sampling efficiency, a film of liquid can be added through the inlet of the cyclone as a cyclone wall under wet conditions. The liquid can then be collected for analysis at the bottom of the cyclone (McFarland et al., 2010. The air flow reverses its direction upon reaching the base of the cyclone. Then, the uncollected particles are carried out of the cyclone via a vortex finder placed in the top of the cyclone (McFarland et al., 2010). The bioefficiency can also be reduced through evaporation or as particles adhere internally on the walls of the collection chamber (Hoisington et al., 2014). In a new cyclone sampling technique, the samples are collected in standard centrifuge tubes from the top of the sample chamber unlike a conventional cyclone (e.g., collection from side) (Macher et al., 2008). Such bioaerosol samples can be processed immediately in these tubes. Hence, there is no need to transfer samples from the collection vessel to a new tube, making the processing much easier and simpler (Macher et al., 2008). Cyclone samplers with the multiple tubes are also efficient enough for collecting size-fractionated samples: large bioaerosol (initial (centrifuge) tube), medium-sized particles (second tube), and the smallest ones (filter)) (Macher et al., 2008).
The use of impactors depends on the inertia of particles for the collection. Therefore, the air sample containing bioaerosols is forced to pass through a set of curve streamlines. In this technique, low inertia particles are transported by the streamlines to avoid capture, while those with high inertia cannot follow the 90° curve of the streamlines. They can impact the agar plate while being influenced by the centrifugal force (Xu et al., 2013). This feature makes an impactor sampler highly suitable to classify all different particles into diverse size fractions. Because particles with comparatively bigger size fall out of the air flow, while those of smaller particle size remain airborne (Xu et al., 2013).
The bioaerosol samples are eventually collected onto certain media, most commonly filters through which they can be transferred onto plates or dissolved into a liquid solution for further microscopic examination or culturing experiments (Wu et al., 2010). Fibrous filters are made of a mat of fine fibers arranged in such a way that particles are captured on the fibers when they pass through the filter. Furthermore, such filters have complex pore-like structure where the particles are deposited (Uhrbrand et al., 2011). However, the efficiency of the filter sampling should be affected by the combined effects of several variables like microbial species, type of membrane filter, relative humidity, and sampling time (Wang et al., 2001). For detecting airborne bioaerosols, one should rely on many forms of cultivation media such as malt extract agar (MEA) (Lehtinen et al., 2013), Sabouraud dextrose agar (SDA) (Park et al., 2011), dichloran rose-bengal chloramphenicol (DRBC) (Tolvanen and Hänninen, 2006), and yeast extract glucose chloramphenicol (YGC) (Borrego et al., 2012). In one of the previous studies, Thorne et al. (1992) concluded that the all-glass impinger method was the best method for collecting total bacteria and fungi while the microbial sampler method was used preferably for sampling enteric organisms. In another study, it was also found that impingers for sampling airborne bacterial bioaerosols could be used with a better performance than filtration methods (Li, 1999).
2. Components of bioaerosols
Bioaerosols contain microorganisms and their components such as fungi, bacteria, endotoxin, mycotoxins, and allergens. Such organisms are well known normal components of both indoor/outdoor air. The concentration levels of different bioaerosols in air samples in different locations are summarized in Table 2 . Detailed descriptions of a list of key bioaerosol components are given below.
Table 2.
Comparison of the concentration levels of bioaerosols in air samples.
| Site | Location | Bacteria (CFU/m3) | Fungi (CFU/m3) |
Endotoxin (ng/m3) |
1,3)-β-d-glucan (ng/m3) |
Reference |
|---|---|---|---|---|---|---|
| Wastewater treatment plant | Middle East | 1016 to 1973 | Not done (ND) | ND | ND | Niazi et al. (2015) |
| Contemporary airtight dwellings | USA | 19 to 607 | 3 to 59 | ND | ND | McGill et al. (2015) |
| Large office buildings | California, USA | 67 to 206 | ND | ND | ND | Tsai and Macher (2005) |
| Plant canopies | USA | 46 to 663 | ND | ND | ND | Lindemann et al. (1982) |
| six hospital lobbies | South Korea | 270 to 1800 | 11 to 220 | ND | ND | Park et al. (2013) |
| Amphitheater | China | 209 to 838 | ND | ND | ND | Guan et al. (2015) |
| Inside residential houses | Ohio, USA | ND | ND | ND | 0.81–1.2 | Crawford et al. (2009) |
| Outside residential houses | ND | ND | ND | 6.1–8.9 | ||
| Commercial concentrated animal feeding operations | Illinois, USA | ND | ND | 98 to 23,157 | 2.4 to 538 | Yang et al. (2013) |
2.1. Fungi and bacteria
Many species of common fungi grow on various foods or other organic materials (e.g., paper, textiles, wood, and damp). Hence, allergens, enzymatic proteins, toxins, and volatile organic compounds (VOCs) could be produced from fungi to cause diverse human health problems (e.g., toxic effects, irritations, infections, and allergies). Significant relationships have been found between meteorological parameters (especially, relative humidity) and bacterial and fungal growth (Niazi et al., 2015). The outdoor concentrations of fungal and bacterial bio-aerosols were found to increase during monsoons (Kang et al., 2015). The prime sites for growth of bacteria and fungi were determined to include dehumidifier drip pans, humidifier reservoirs, air conditioning equipment, toilets, shower heads, water damaged carpets, damp ceiling panels, and walls (McGill et al., 2015). For example, relationship between the concentrations of bacterial bioaerosols and the number of users in public restrooms is shown in Fig. 2 .
Fig. 2.

Concentration of bacterial bioaerosols in public restrooms and the number of users (Lee et al., 2012).
The results of previous studies confirm the considerable effects of seasonal factors on the observed levels of bioaerosols. In a wastewater treatment unit in Tehran, Iran, the average concentrations of bacterial bioaerosols in winter and summer were measured as 1016 and 1973 colony-forming unit (CFU)FND/m3, respectively (Thorne et al., 1992). The concentrations of fungi and bacteria measured from the bedroom of six contemporary, airtight dwellings in the USA during winter ranged from 3 to 59 (mean 18.4) and 19–607 (mean 212) CFU/m3, respectively (McGill et al., 2015). The findings of relatively low concentration levels from those samples also suggest that the filtration of air through the mechanical ventilation heat recovery (MVHR) system should have limited the migration of outdoor fungi and bacteria. Bacterial bioaerosol concentrations were generally low (from 0 to 118 (mean 11) CFU/m3) in the winter. Such result was found as the bacteria have adapted at the typical body temperatures of 30–40°C (Smirnova et al., 2001). In the Seoul Metropolitan area, S. Korea, the fungal bioaerosols were in the range of 24 to 654 (mean 177) CFU/m3 during winter (Lee et al., 2016). In contrast, their values in summer increased moderately to vary from 60 to 930 (mean 357) CFU/m3 (Heo et al., 2014).
In Malaysia, the average concentrations of bacteria in indoor and outdoor air were found as 1025 ± 612 and 1473 ± 1261 CFU/m3, respectively, while their fungal bioaerosol counterparts were 292 ± 83 and 401 ± 235 CFU/m3 (Hussin et al., 2011). These authors observed that the mean concentrations of bacteria and fungi in laboratories were as high as 320 and 460 CFU/m3, respectively, while their lowest counterparts in office rooms were 61 and 140 CFU/m3. Likewise, the concentrations of bacteria measured in areas without occupants were considerably lower than those with occupants (p < 0.05) (Adams et al., 2015). As such, the number of occupants and their activity were likely to sensitively affect the concentration levels (and compositions) of indoor bacteria. Moreover, insufficient ventilation was also suggested to exert control on the levels of viable bacteria in indoor air (Yoon et al., 2011).
2.2. Endotoxins
Endotoxins are characterized as lipopolysaccharides (LPS) in Gram-negative bacteria with very high pro-inflammatory properties (Armstrong et al., 2013). Endotoxins consist of such components as: (1) a core polysaccharide chain, (2) O-specific polysaccharide side chains (O-antigen), and (3) a lipid component, Lipid A, responsible for the toxic effects (Tirsoaga et al., 2007). Human exposure to endotoxins occurs constantly, as they can easily bind to dust (i.e., easily inhalable) (Wallace et al., 2016). Response to endotoxins varies due to such factors as dose, location, and route. Exposure to endotoxins was suggested to a cause decrease in lung diffusion capacity along with diverse symptoms and diseases, such as fever, shivering, blood leukocytosis, neutrophilic airway inflammation, arthralgia, dyspnea and chest tightness, and bronchial obstruction (Thilsing et al., 2015).
Endotoxins have been considered to be one of the main factors contributing to occupational lung diseases and organic dust toxic syndrome (Park et al., 2015). In fact, changes in pulmonary function due to endotoxin exposure have been reported from several occupational groups: textile workers (geometric mean (GM): 2160 EU/m3 (Paudyal et al., 2011), dairy workers (GM: 329 EU/m3 (Mitchell et al., 2015), animal feed and grain workers (GM: 662 EU/m3), and sewage treatment plant workers (GM: 214 EU/m3) (Cyprowski et al., 2015).
2.3. β glucans
β glucans are glucose polymers that occur naturally in the cell walls of various microorganisms (e.g., bacteria, algae, lichens, fungi, yeasts, and plants (like oats and barley)) (Kurek et al., 2016). In a previous study conducted in Ohio, USA, GM concentrations of β glucans in indoors and outdoors were measured as 1.0 (range: 0.81–1.2) and 7.34 ng/m3 (range 6.1–8.9), respectively (Crawford et al., 2009). Airborne concentrations of (1,3)-β-d-glucan, measured from six sites (office, hospital, student dormitory, subway station, and a commercial street) in Beijing, China, were found to range from 0.02 to 1.2 ng/m3 (Dong and Yao, 2010). In another study conducted in 18 commercial concentrated animal feeding operations in Illinois, USA, the airborne concentration of (1,3)-β-d-glucan ranged from 2.4 to 538 ng/m3 (Yang et al., 2013). β glucans have been used to boost the immune system and also to treat high cholesterol, diabetes, and cancer (Holst et al., 2015). However, many studies have reported that exposure to airborne β glucans might induce inflammatory responses and associated respiratory symptoms (Richter et al., 2015). Hence, the effects of β-glucans inhalation appear to vary in relation to such variable (e.g., the type of glucan and concomitant exposure).
2.4. Mycotoxins
Mycotoxins are toxic secondary biomolecules produced by fungus or molds. However, different types of mycotoxins may be produced by one mold species, while the same mycotoxin may be produced by several species (Andretta et al., 2011). Hence, classification of mycotoxins can be made based on their chemical structures as well as reactive functional groups (e.g., primary/secondary amines, carboxylic acids, hydroxyl (or phenolic) groups, lactams, and amides) (Grenier and Applegate, 2013). The health effects of mycotoxins on humans and animals are diverse enough to include weakened immune systems, allergies or irritations, many identifiable diseases, and even death. The effects of mycotoxicosis should depend on the type of mycotoxins, the duration of exposure, concentration levels, and the conditions of the exposed individual (e.g., age, health, and sex) (Marin et al., 2013). Moreover, the severity of such poisoning, if taking place, can be compounded by many variables (e.g., alcohol abuse, vitamin deficiency, caloric deprivation, and infectious disease status) (Marin et al., 2013). Exposure to mycotoxins occurs most often via ingestion, inhalation of spore-borne toxins, as and dermal contact on mold-infested substrates.
2.5. Allergens
An allergen is any substance (antigen), most often eaten or inhaled, that causes an unusual immune response and triggers an allergic reaction. The most common symptoms of allergens (e.g., runny nose, stuffy nose, scratchy throat, itchy eyes, and sneezing). However, the risk of asthma and other allergic diseases can increase, if exposed to allergen to a certain degree (Baxi and Phipatanakul, 2010). Allergens can be found in a variety of sources, such as fungi (spores and hyphae), arthropods (mites and cockroaches), vascular plants (fern spores, pollen, and soy dust), pet dander, and royal jelly (Jutel et al., 2016). Many factors (e.g., mechanical disturbance, wind, rain, or active discharge mechanisms) exert the control on the release of particles into the air. Indoor humidity and water damaged items (e.g., carpets, ceilings, and walls) are important sources of mite and mold allergens (Peden and Reed, 2010).
3. Potential health effects of bioaerosols
In most situations, the formation of bioaerosols occurs in the form of complex mixtures of allergens, toxins, and other miscellaneous ones. Exposure to bioaerosols tends to be associated with various health effects (e.g., infectious diseases, acute toxic effects, allergies, and cancer). However, as respiratory symptoms and impairment of lung function have been the most widely studied subjects, they probably belong to the most important health problems caused by bioaerosols.
3.1. Infectious diseases
Infectious diseases arise from exposure to biological agents (e.g., bacteria, viruses, fungi, and parasites) through the transmission of infectious agents by direct (i.e., licking, touching, biting) and/or indirect contact (i.e., cough or sneeze), airborne transmission, and vector-borne transmission (Chretien et al., 2015). Zoonotic infections (e.g., Q-fever, brucellosis, anthrax, and avian and swine influenza) are predominantly attributed to livestock farms, veterinary practices, abattoir, and animal store workers (Wu et al., 2015). Among 44 seroepidemiological studies, 37 (84%) were identified to be subject to an enhanced risk of zoonotic pathogen infection (Baker and Gray, 2009). Infected veterinarians may act as biological sentinels to spread zoonotic pathogens to the surroundings (e.g., community members, their families, and the animals they care). For instance, the Chlamydophila psittaci bacteria are highly prevalent in psittacine birds and pigeons (Vanrompay et al., 2007, Ling et al., 2015). People are mostly infected through inhalation and/or being exposed to petting infected birds, C. psittaci-infected aerosols, and handling infected avian tissues (West, 2011). In the Netherlands, a three-year (2007–2009) cumulative epidemic of Q fever took place due to the airway transmission of the causative micro-organism Coxiella burnetii via infected dairy goat farms (Commandeur et al., 2014). Due to this outbreak, more than 4000 patients were reported to visit Municipal Health Services (MHS) over that period (Roest et al., 2011). The epidemic ended through taking the control measures on dairy goat and sheep such as hygiene measures, vaccinations, and the culling of pregnant infected animals (Dijkstra et al., 2012).
In a human dose–response model, Brooke et al. (2013) found that the dose required for 50% of the exposed population to become infected (infd50) was 1.5 bacteria (95% confidence interval (CI): 0.75–38.7), indicating high infectivity of Coxiella burnetii via aerosol exposure. In Italy in 2013, three poultry workers were diagnosed with conjunctivitis during an outbreak of influenza A (H7N7) virus among poultry (Puzelli et al., 2014). Bioaerosols are also associated with Legionnaires' disease as long as many different forms of bacterial pneumonia, influenza, measles, coccidioidomycosis, and gastrointestinal illness. People are exposed to Legionella when they breathe in a mist or vapor containing the associated bacteria (Berrington and Hawn, 2013). The severity of such infection can vary broadly from mild febrile illness (Pontiac fever) to a potentially fatal pneumonia (Berrington and Hawn, 2013).
When a person inhales Mycobacterium tuberculosis (Mtb)-contaminated air, the inhaled bacteria are likely to reach the lungs and cause tuberculosis (TB) (Pedersen et al., 2016). The lungs or larynx of the TB patients then were found to release the bacteria to the surroundings, as they cough, sneeze, talk, and expel air or disperse droplets that contain M. tuberculosis (Pedersen et al., 2016).
The occurrence of TB poses a significant risk of transmission in healthcare and other congregate settings (e.g., prisons, jails, and homeless and social assistance shelters). A meta-analysis study reported that the average annual risk of developing TB for healthcare workers (across all settings) was three times higher (95% CI 2.43–3.51) than that of the general population (Baussano et al., 2011). Bordetella pertussis, known as the agent of whooping cough (pertussis), is transmitted primarily via droplets (Solano et al., 2014). As a result of the infection, colonization and rapid multiplication of the bacteria may occur on the mucous membranes of the respiratory tract. The potential sources of infant (under 6 months old) pertussis infections from nine studies were identified as mothers, fathers, and grandparents in 39% (95% CI 33–45%), 16% (95%CI 12%–21%), and 5% (95% CI 2%–10%) of cases, respectively (Wiley et al., 2013). Furthermore, teachers, health care workers, and children could be easily exposed to or transmitting the disease to others (Rohani and Drake, 2011).
Pneumonic plague is another deadly infectious and transmittable disease when fine infective droplets are inhaled (Hammamieh et al., 2016). A total of 21,725 cases of human plague were reported globally during 2000 to 2009 including 1612 deaths (Butler, 2013). As an infectious disease caused by the bacterium (Bacillus anthracis), Anthrax is spread through the intestines (ingestion), lungs (inhalation), or skin (cutaneous) (Berger et al., 2014, Azarkar and Bidaki, 2016). Exposure to infected animals (or their skin, wool, and meat) is the usual pathway of anthrax to humans (Navdarashvili et al., 2015).
Measles is another acute viral disease which can be accompanied by pneumonia, blindness, brain damage, and even death (Zachariah and Stockwell, 2016). In 2013, more than 20 million infections of measles occurred worldwide causing around 145,000 deaths (CDC, 2015). Measles is caused by rubeola virus, a paramyxovirus of the genus Morbillivirus. It is known to be spread through droplet transmission from the nose, throat, and mouth of the infected persons if they cough or sneeze (Clemmons et al., 2015). The infected droplets that land on the surface may remain active to be contagious for few hours. People may contact the virus by rubbing their eyes or by putting virus-infected fingers in their nose or mouth. Among unimmunized people exposed to the virus, over 90% will have the disease (Phadke et al., 2016).
Over 200 different viral types are responsible for common cold. Among them the most commonly implicated viruses are rhinovirus, human coronavirus, respiratory syncytial virus (RSV), and adenoviruses which have been identified to bring on about 30%–80%, 15%, 10%–15%, and 5% of colds, respectively (Allan and Arroll, 2014). These viruses can spread as airborne droplets (aerosols) or through many other routes (e.g., direct contact with contaminated objects (e.g., utensils, towels, keyboards, toys, and telephones) or with infectious (nasal) secretions (Arroll, 2011).
Streptococcus pneumoniae bacteria can cause several different types of infection through lungs, ears, nose, bacteremia (blood stream), and meningitis (spinal cord and brain) (Daniels et al., 2016). It was reported that Streptococcus pneumoniae should most commonly inflict children, the elderly, and other people with weakened immune systems (Hamborsky et al., 2015). According to the World Health Organization (WHO), Streptococcus pneumoniae killed around half a million children (under 5 years old) worldwide every year (Knoll et al., 2009). Streptococcus pneumoniae bacteria usually spread through the air in the form of aerosol droplets through coughing and sneezing and also through contact with an infected person (Richter et al., 2013).
3.2. Respiratory diseases
The human lung is subjected to airborne pollutants and irritants with each breath. Generally, respiratory symptoms result from the inflammation of airway when exposed specifically to allergens, toxins, or pro-inflammatory agents. According to the community based follow-up of 422 Canadian children, beta-glucan exposure at age 7–10 years was found to develop and persist atopic/non-atopic asthma (Odd Ratio (OR = 1.79, 95% CI: 1.14–2.81) while bronchial hyper-responsiveness (BHR) (OR = 1.74, 95% CI: 1.05–2.89) at ages 11–14 (Maheswaran et al., 2014). Lin et al. (2012) reported that asthma cases had higher odds of being sensitized to Derp dust mites (OR = 1.94, 95% CI: 1.13–3.35), cat (OR = 1.96, 95% CI: 1.13–3.39), or dog allergens (OR = 1.89, 95% CI: 1.10–3.22) than the controls. Nevertheless, mold sensitivity is positively related with asthma intensity (Ma et al., 2015). Associations with asthma were found with mold in children's bedrooms (OR = 4.82, 95% CI: 1.29–18.02) and in living rooms (OR = 7.51 95% CI: 1.49–37.8) (Karvonen et al., 2015).
Asthma and pollen exposure have been found to have decreased lung activity while increasing pulmonary inflammation (Baldacci et al., 2015). The simultaneous presence of sferics and grass pollen escalate the risk of an asthma epidemic by 15% (Canova et al., 2013). Endotoxins and glucans from bacteria and molds, in addition to irritating airways, were also suggested to contribute to airway inflammation (Hoppin et al., 2014). A decrease in lung function was found to occur by inhalation of over 80 mg of endotoxins in healthy subjects and over 20 mg of endotoxins in asthmatics (Kharitonov and Sjöbring, 2007).
3.3. Cancer
The possible associations between exposure to bioaerosols and some specific cancers have been reported (Hayleeyesus et al., 2015). Johnson and Choi (2012) reviewed lung cancer risk of workers in the meat/poultry industry. They concluded that even after controlling for smoking there was about 30% excess risk of lung cancer among them. Furthermore, meat and poultry plant workers were suspected to be exposed to high concentrations of airborne mixture including fecal material, dander (skin material), feather, and micro-organisms (e.g., virus, endotoxins, fungi, and bacteria). The dose–response relation, when assessed by lung cancer among meat workers, indicated the potent role of the exposure to biological materials in the form of animal urine, feces, and blood (possibly oncogenic zoonotic viruses) (McLean et al., 2004). From a pilot case-cohort study (30,411 poultry workers under the high risk of exposure vs. 16,408 control subjects), pancreatic/liver cancers were found to be caused from the slaughtering of poultry (OR = 8.9, 95% CI: 2.7–29.3)/OR = 9.1, 95% CI: 1.9–42.9); the catching of live chickens (OR = 3.6, 95% CI: 1.2–10.9)/OR = 1.0, 95% CI: 0.1–8.5); and the killing of other types of animals for food (OR = 4.8, 95% CI: 1.5–16.6)/OR = 2.0, 95% CI: 0.2–18.2) (Felini et al., 2011). These authors also recorded pancreatic cancer cases among workers who have ever worked on a pig farm as OR = 3.0, 95% CI: 1.0–8.2.
In another study, elevated risk for poultry oncogenic viruses was recorded who (1) killed chickens (OR 4.2, 95% CI 1.2 to 14.7; HR 1.8, 95% CI 1.0 to 3.3) and (2) had direct contact with chicken blood at work (OR 1.9, 95% CI 1.0 to 3.8; HR 1.3, 95% CI 0.9 to 2.0). Elevated risk of lung cancer due to poultry exposure was recorded for subjects who killed chickens at work (OR 4.2, 95% CI: 1.2–14.7) and ever had direct contact with chicken blood at work (OR 1.9, 95% CI: 1.0–3.8) (Felini et al., 2012). Furthermore, studies have found that those who worked as chicken slaughterer have around nine times the odds of both pancreatic/liver cancer compared with those with no such exposure (ACS, 2016). In an exploratory study with a total of 46,819 workers in poultry/non-poultry plants, higher risk of brain cancer was related with killing chickens (OR = 5.8, 95% CI: 1.2–28.3) and working in a shell-fish farm (OR = 13.0, 95% CI: 1.9–84.2) (Gandhi et al., 2014).
4. Guidelines and assessment of exposure risk to bioaerosols
Because of limited data and enormous variability in the potential health effects between different types of bioaerosols, standards for bioaerosols based on health risk assessments are still impractical (Lee et al., 2012). The Environment Protection Agency (EPA) of the US and the World Health Organization (WHO) do not have any specific guidelines for bioaerosol concentration levels (WHO, 2009). In contrast, the Occupational Safety and Health Administration (OSHA) has set a standard guide for nonspecific dusts as total dust (15 mg/m3) and respirable dust (5 mg/m3) (OSHA, 1992). The Health and Welfare Department in Canada also established the following guidelines: (i) 50 CFU/m3 for one species of fungi warrants immediate investigation; (ii) 100 CFU-m− 3 is unacceptable for the presence of certain fungal pathogens; (iii) 150 CFU/m3 of mixed species is normal; and (iv) up to 500 CFU/m3 should be acceptable if dominated by Cladosporium (WHO (World Health Organization), 1988, EC (Environment Canada), 1989). In the case of Korea, the maximum allowable concentration of total bacterial bioaerosol is 800 CFU/m3 (Ministry of Environment, Republic of Korea, 2010).
Table 3 summarizes the standards/guidelines for bioaerosols proposed by different governmental and private organizations. Based on European literature databases on residential indoor air quality, the residential limit values for airborne fungi, bacteria, and bacterial endotoxin were proposed as 5 × 10³ CFU/m3, 5 × 10³ CFU/m− 3, and 5 ng/m3, respectively (Górny and Dutkiewicz, 2002). These guidelines are generally based on baseline bioaerosol concentrations, without taking into account of effects on human health. The proposed threshold bioaerosol concentrations were generally taken from the data associated with culturing assays. Furthermore, various international round robin tests indicated correlations between laboratories results but considerable differences in absolute levels.
Table 3.
Summary of quantitative standards and guidelines for bioaerosols in air by governmental and private organizations.
| Organization | Guideline | Remarks | Reference |
|---|---|---|---|
| American Conference of Governmental Industrial Hygienists (ACGIH) | • < 100 CFU/m3 | Low | Macher et al. (1995) |
| • 100–1000 CFU/m3 | Intermediate | ||
| • > 1000 CFU/m3 | High | ||
| American Industrial Hygiene Association (AIHA) | There is no safe level of an uncontained pathogenic organism | AIHA (1986) | |
| Commission of the European Communities (CEC) | For houses | CEC (1994) | |
| • < 50 CFU/m3 | Very low | ||
| • < 200 CFU/m3 | Low | ||
| • < 103 CFU/m3 | Intermediate | ||
| • < 104 CFU/m3 | High | ||
| • > 104 CFU/m3 | Very high | ||
| Healthy Buildings International | < 750 CFU/m3 | Total airborne bacteria and fungi is OK if species are not infective or allergenic | Rao et al. (1996) |
| Indoor Air Quality Association (IAQ) | • < 300 CFU/m3 | Common fungi is OK | IAQA (1995) |
| • < 150 CFU/m3 | Mixed fungi other than pathogenic orexigenic is OK | ||
| IAQ in office buildings: a technical guide | • > 50 CFU/m3 | One species should be investigated | Malmberg (1991) |
| • < 150 C CFU/m3 | If mixture of species is OK | ||
| The Netherlands/research methods in biological indoor air pollution | • > 104 CFU/m3 | Total fungi is a threat to health | Heida et al. (1995) |
| • > 500 CFU/m3 | One species of potentially pathogenic nature is a threat to health | ||
| Occupational Safety and Health Administration (OSHAA) | • > 1000 CFU/m3 | Indicates contamination | OSHA (1994) |
| • > 106 fungi/g of dust | Indicates contamination | ||
| Environment Canada (EC) | •Pathogenic and toxigenic fungi | Unacceptable in indoor air | EC (1989) |
| • > 50 CFU/m3 | One species should be investigated | ||
| • < 150 CFU/m3 | OK if mixture of species | ||
| • < 500 CFU/m3 | OK if Cladosporium or other common phylloplane | ||
| Ministry of environment (ME), Republic of Korea | < 800 CFU/m3 | OK | Ministry of Environment, Republic of Korea (2010) |
At present, a wide variety of options are available for sampling instrumentation and analytical methods although no standard method has been established for enumerating bioaerosol. However, the apparent concentrations of airborne bioaerosol are greatly dependent on the environmental conditions (e.g., temperature, relative humidity, and airflow) along with the variables associated with analytic approaches employed by the investigator. It is also necessary to accurately analyze all microbial cells suspended in the air and to differentiate those which are metabolically active, culturable, and non-viable.
Existing quantitative standards and guidelines tend to suffer from lack of evidence in human dose/response relationship, reliance on short-term grab samples (culture-based analysis), and the absence of standardized protocols (in all of the procedures of data collection, analysis, and interpretation). Exposure guidelines thus should not be established until a standard methodology is available. Without scientifically proven standards and guidelines, arbitrary criteria may lead to inappropriate testing and test interpretations (WHO, 2009). Moreover, the consequences of misleading sampling data can be significant in terms of litigation, labor grievances, disability claims, inappropriate medical treatment, or recommendation to demolish public buildings. Therefore, further validation and standardization are needed for establishing procedures for quantification of bioaerosol (e.g., sampling, extraction, and analytical procedures) (Ghosh et al., 2015).
Furthermore, there are a few latest technologies (e.g., polymerase chain reaction (PCR), Enzyme-linked immunosorbent assay (ELISA), and Metagenomics) are currently used for microbial analysis. PCR is a technique used in microbial community analysis for synthesizing multiple copies (amplifying) of a specific piece of deoxyribonucleic acid (DNA). This technique is very rapid (results usually available within 12 to 26 hr), high degree of sensitivity (able to detect one colony forming unit in a 25 g sample), precise and accurate, flexible (assays for more than one pathogen can be run simultaneously) (DeAngelis et al., 2011). ELISA is also an analytical technique that uses components of the immune system (such as IgG or IgM antibodies) and chemicals to detect the presence of an antigen or antibody in a given sample (Verma et al., 2013). The variations in ELISA allow us to detect either antigen or antibody, identifying the different strains of microbes at a time, and also in characterization of the epitope distribution on the microbial surface (Verma et al., 2013).It shows wider applications in clinical diagnosis, in pathological studies, and in quality control studies. Metagenomics applies direct genetic analysis tools to access the genetic content of entire communities of organisms (Cha et al., 2017). Metagenomics gives genetic information on potentially novel biocatalysts or enzymes, genomic linkages between function and phylogeny for uncultured organisms, and evolutionary profiles of community function and structure (Thomas et al., 2012). The metagenomics approach can also serve as a powerful tool for elucidating the relationship between host-associated microbial communities and host phenotype (Banerjee et al., 2015).
5. Conclusions
The presence of bioaerosols has been suspected as the cause of various human diseases covering not only infectious/respiratory symptoms but also cancer. Bioaerosols are also found in most enclosed environments owing to their ubiquitous presence in nature. Even higher bioaerosol concentrations may be observed in indoors (compared to outdoors) due to various internal sources that are generally associated with human activities. Hence, increasing the mechanical or natural ventilation rate and regular cleaning and maintenance activities can play a vital role in increasing indoor air quality. However, even under ideal conditions for preventative maintenance, chances of exposure to bioaerosols persist. In light of the fact that many uncertainties still remain in exposure assessment (i.e., poorly developed tools for quantitation of risks), efforts to resolve such issues should be developed in many respects. There are various types and non-ideal microbiological techniques available for sampling and analysis of bioaerosols (and the extent of their exposures) that have left much confusion and many misconceptions. Until new and reliable techniques are introduced, a common protocol for their quantitation based on currently available methods is to be employed to offer a near-uniform basis to allow cross-comparison between different experimental data sets. Therefore, more research is desirable to properly establish better assessment tools for the exposure to bioaerosols and its validation.
Acknowledgments
Acknowledgements
We acknowledge support made in part by grants from the National Research Foundation of Korea (NRF) funded by the Ministry of Science, ICT & Future Planning (No. 2016R1E1A1A01940995).
References
- ACS (American Cancer Society) Pancreatic cancer overview. 2016. www.cancer.org/pancreatic-cancer-overview-pdf Available at:
- Adams R.I., Bhangar S., Pasut W., Arens E.A., Taylor J.W., Lindow S.E. Chamber bioaerosol study: outdoor air and human occupants as sources of indoor airborne microbes. PLoS One. 2015;10(5) doi: 10.1371/journal.pone.0128022. [DOI] [PMC free article] [PubMed] [Google Scholar]
- AIHA (American Industrial Hygiene Association) AIHA; Washington DC, USA: 1986. Biosafety Committee Biohazards Reference Manual. [Google Scholar]
- Allan G.M., Arroll B. Prevention and treatment of the common cold: making sense of the evidence. CMAJ. 2014;186(3):190–199. doi: 10.1503/cmaj.121442. [DOI] [PMC free article] [PubMed] [Google Scholar]
- Andretta I., Kipper M., Lehnen C.R., Hauschild L., Vale M.M., Lovatto P.A. Meta-analytical study on productive and nutritional interactions of mycotoxins in broilers. Poult. Sci. 2011;90:1934–1940. doi: 10.3382/ps.2011-01470. [DOI] [PubMed] [Google Scholar]
- Armstrong M.T., Rickles F.R., Armstrong P.B. Capture of lipopolysaccharide (endotoxin) by the blood clot: a comparative study. PLoS One. 2013;8 doi: 10.1371/journal.pone.0080192. [DOI] [PMC free article] [PubMed] [Google Scholar]
- Arroll B. Vol. 3. 2011. Common Cold; p. 1510. (Clinical evidence). (PMC 3275147. PMID 21406124) [Google Scholar]
- Azarkar Z., Bidaki M.Z. A case report of inhalation anthrax acquired naturally. BMC Res. Notes. 2016;9:141–147. doi: 10.1186/s13104-016-1955-0. [DOI] [PMC free article] [PubMed] [Google Scholar]
- Baker W.S., Gray G.C. A review of published reports regarding zoonotic pathogen infection in veterinarians. J. Am. Vet. Med. Assoc. 2009;234(10):1271–1278. doi: 10.2460/javma.234.10.1271. [DOI] [PubMed] [Google Scholar]
- Baldacci S., Maio S., Cerrai S., Sarno G., Baïz N., Simoni M. Allergy and asthma: effects of the exposure to particulate matter and biological allergens. Respir. Med. 2015;109(9):1089–1104. doi: 10.1016/j.rmed.2015.05.017. [DOI] [PubMed] [Google Scholar]
- Banerjee D., McDaniel P.M., Rymond B.C. Limited portability of G-patch domains in regulators of the Prp43 RNA helicase required for pre-mRNA splicing and ribosomal RNA maturation in Saccharomyces cerevisiae. Genetics. 2015;200(1):135–147. doi: 10.1534/genetics.115.176461. [DOI] [PMC free article] [PubMed] [Google Scholar]
- Baussano I., Nunn P., Williams B., Pivetta E., Bugiani M., Scano F. Tuberculosis among health care workers. Emerg. Infect. Dis. 2011;17(3):488–494. doi: 10.3201/eid1703.100947. [DOI] [PMC free article] [PubMed] [Google Scholar]
- Baxi S.N., Phipatanakul W. The role of allergen exposure and avoidance in asthma. Adolesc. Med. State Art Rev. 2010;21(1):57–63. [PMC free article] [PubMed] [Google Scholar]
- Beck J.M., Young V.B., Huffnagle G.B. The microbiome of the lung. Transl. Res. 2012;160:258–266. doi: 10.1016/j.trsl.2012.02.005. [DOI] [PMC free article] [PubMed] [Google Scholar]
- Berger T., Kassirer M., Aran A.A. Injectional anthrax — new presentation of an old disease. Eurosurveillance. 2014;19(32):20877. doi: 10.2807/1560-7917.es2014.19.32.20877. [DOI] [PubMed] [Google Scholar]
- Berrington W.R., Hawn T.R. Human susceptibility to legionnaires' disease. Methods Mol. Biol. 2013;954:541–551. doi: 10.1007/978-1-62703-161-5_33. [DOI] [PubMed] [Google Scholar]
- Borrego S., Lavin P., Perdomo I., de Saravia S.G., Guiamet P. Determination of indoor quality in archives and biodeterioration of the documentary heritage. ISRN Microbiol. 2012;2012:1–10. doi: 10.5402/2012/680598. [DOI] [PMC free article] [PubMed] [Google Scholar]
- Brooke R.J., Kretzschmar M., Mutters N.T., Teunis P. Human dose response relation for airborne exposure to Coxiella burnetii. BMC Infect. Dis. 2013;13(1):488–495. doi: 10.1186/1471-2334-13-488. [DOI] [PMC free article] [PubMed] [Google Scholar]
- Butler T. Plague gives surprises in the first decade of the 21st century in the United States and worldwide. Am. J. Trop. Med. Hyg. 2013;89(4):788–793. doi: 10.4269/ajtmh.13-0191. [DOI] [PMC free article] [PubMed] [Google Scholar]
- Canova C., Heinrich J., Anto J.M., Leynaert B., Smith M., Kuenzli N., Zock J.P. The influence of sensitisation to pollens and moulds on seasonal variations in asthma attacks. Eur. Respir. J. 2013;42:935–945. doi: 10.1183/09031936.00097412. [DOI] [PMC free article] [PubMed] [Google Scholar]
- CDC . US Department of Health and Human Services, CDC; Atlanta, GA: 2015. CDC Health Advisory: U.S. Multi-State Measles Outbreak, December 2014–January 2015. (Available at http://emergency.cdc.gov/han/han00376.asp) [Google Scholar]
- CEC (Commission of the European Communities) 1994. Report No. 12: Biological Particles in Indoor Environments: Luxembourg. [Google Scholar]
- Cha S., Srinivasan S., Jang J.H., Lee D., Lim S., Kim K.S. Metagenomic analysis of airborne bacterial community and diversity in Seoul, Korea, during December 2014, Asian dust event. PLoS One. 2017;12(1) doi: 10.1371/journal.pone.0170693. [DOI] [PMC free article] [PubMed] [Google Scholar]
- Chen Q., Hildemann L.M. The effects of human activities on exposure to particulate matter and bioaerosols in residential homes. Environ. Sci. Technol. 2009;43(13):4641–4646. doi: 10.1021/es802296j. [DOI] [PubMed] [Google Scholar]
- Chretien J.P., Anyamba A., Small J., Britch S., Sanchez J.L., Halbach A.C. PLOS Currents Outbreaks. edition 1. 2015. Global climate anomalies and potential infectious disease risks: 2014–2015. (Jan 26) [DOI] [PMC free article] [PubMed] [Google Scholar]
- Clemmons N.S., Gastanaduy P.A., Fiebelkorn A.P., Redd S.B., Wallace G.S. Measles—United States. MMWR. 2015;64:373–376. [PMC free article] [PubMed] [Google Scholar]
- Commandeur M., Jeurissen L., van der Hoek W., Roest H.J., Hermans T.C. Spatial relationships in the Q fever outbreaks 2007–2010 in the Netherlands. Int. J. Environ. Health Res. 2014;24(2):137–157. doi: 10.1080/09603123.2013.800963. [DOI] [PubMed] [Google Scholar]
- Crawford C., Reponen T., Lee T., Iossifova Y., Levin L., Adhikari A. Temporal and spatial variation of indoor and outdoor airborne fungal spores, pollen, and (1 → 3)-beta-d-glucan. Aerobiologia. 2009;25(3):147–158. [Google Scholar]
- Cyprowski M., Sobala W., Buczyńska A. Szadkowska-Stańczyk I. Endotoxin exposure and changes in short-term pulmonary function among sewage workers. Int. J. Occup. Med. Environ. Health. 2015;28(5):803–811. doi: 10.13075/ijomeh.1896.00460. [DOI] [PubMed] [Google Scholar]
- Daniels C.C., Rogers P.D., Shelton C.M. A review of pneumococcal vaccines: current polysaccharide vaccine recommendations and future protein antigens. J. Pediatr. Pharmacol. Ther. 2016;21:27–35. doi: 10.5863/1551-6776-21.1.27. [DOI] [PMC free article] [PubMed] [Google Scholar]
- DeAngelis K.M., Wu C.H., Beller H.R., Brodie E.L., Chakraborty R. PCR amplification-independent methods for detection of microbial communities by high-density microarray PhyloChip. Appl. Environ. Microbiol. 2011;77:6313–6322. doi: 10.1128/AEM.05262-11. [DOI] [PMC free article] [PubMed] [Google Scholar]
- Dedesko S., Stephens B., Gilbert J.A., Siegel J.A. Methods to assess human occupancy and occupant activity in hospital patient rooms. Build. Environ. 2015;90:136–145. [Google Scholar]
- Dijkstra F., Hoek W., Wijers N., Schimmer B., Rietveld A., Wijkmans C.J. The 2007–2010 Q fever epidemic in The Netherlands: characteristics of notified acute Q fever patients and the association with dairy goat farming. FEMS Immunol. Med. Microbiol. 2012;64(1):3–12. doi: 10.1111/j.1574-695X.2011.00876.x. [DOI] [PubMed] [Google Scholar]
- Dong S., Yao M. Exposure assessment in Beijing, China: biological agents, ultrafine particles, and lead. Environ. Monit. Assess. 2010;170(1–4):331–343. doi: 10.1007/s10661-009-1236-7. [DOI] [PubMed] [Google Scholar]
- EC (Environment Canada) Federal-Provincial Advisory Committee on Environmental and Occupational Health; Ottawa, Ontario: 1989. Exposure Guidelines for Residential Indoor Air Quality, Environment Canada; p. 23. (Online at: http://www.bvsde.paho.org/bvsacd/cd16/exposure.pdf) [Google Scholar]
- Felini M., Johnson E., Preacely N., Sarda V., Ndetan H., Bangara S. A pilot case-cohort study of liver and pancreatic cancers in poultry workers. Ann. Epidemiol. 2011;21(10):755–766. doi: 10.1016/j.annepidem.2011.07.001. [DOI] [PubMed] [Google Scholar]
- Felini M., Preacely N., Shah N., Christopher A., Sarda V., Elfaramawi M. A case-cohort study of lung cancer in poultry and control workers: occupational findings. Occup. Environ. Med. 2012;69(3):191–197. doi: 10.1136/oemed-2011-100310. [DOI] [PubMed] [Google Scholar]
- Gandhi S., Felini M.J., Ndetan H., Cardarelli K., Jadhav S., Faramawi M. A pilot case-cohort study of brain cancer in poultry and control workers. Nutr. Cancer. 2014;66(3):343–350. doi: 10.1080/01635581.2013.878734. [DOI] [PubMed] [Google Scholar]
- Georgakopoulos D.G., Despres V., Frohlich-Nowoisky J., Psenner R., Ariya P.A., Posfai M., Ahern H.E. Microbiology and atmospheric processes: biological, physical and chemical characterization of aerosol particles. Biogeosciences. 2009;6:721–737. [Google Scholar]
- Ghosh B., Lal H., Srivastava A. Review of bioaerosols in indoor environment with special reference to sampling, analysis and control mechanisms. Environ. Int. 2015;85:254–272. doi: 10.1016/j.envint.2015.09.018. [DOI] [PMC free article] [PubMed] [Google Scholar]
- Górny R.L., Dutkiewicz J. Bacterial and fungal aerosols in indoor environment in Central and Eastern European countries. Ann. Agric. Environ. Med. 2002;9:17–23. [PubMed] [Google Scholar]
- Grenier B., Applegate T.J. Modulation of intestinal functions upon mycotoxin ingestion: meta-analysis of published experiments in animals. Toxins. 2013;5:396–430. doi: 10.3390/toxins5020396. [DOI] [PMC free article] [PubMed] [Google Scholar]
- Guan D., Guo C., Li Y., Lv H., Yu X. Study on the concentration and distribution of the airborne bacteria in indoor air in the lecture theatres at Tianjin Chengjian University, China. Procedia Eng. 2015;121:33–36. [Google Scholar]
- Haig C.W., Mackay W.G., Walker J.T., Williams C. Bioaerosol sampling: sampling mechanisms, bioefficiency and field studies. J. Hosp. Infect. 2016;93(3):242–255. doi: 10.1016/j.jhin.2016.03.017. [DOI] [PMC free article] [PubMed] [Google Scholar]
- Hamborsky J., Kroger A., Wolfe S., editors. Centers for Disease Control and Prevention. Epidemiology and Prevention of Vaccine-Preventable Diseases. 13th ed. Public Health Foundation; Washington DC: 2015. [Google Scholar]
- Hammamieh R., Muhie S., Borschel R., Gautam A., Miller S.A., Chakraborty N. Temporal progression of pneumonic plague in blood of nonhuman primate: a transcriptomic analysis. PLoS One. 2016;11(3) doi: 10.1371/journal.pone.0151788. [DOI] [PMC free article] [PubMed] [Google Scholar]
- Han T., Mainelis G. Investigation of inherent and latent internal losses in liquid-based bioaerosol samplers. J. Aerosol Sci. 2012;45:58–68. [Google Scholar]
- Hayleeyesus S.F., Ejeso A., Derseh F.A. Quantitative assessment of bio-aerosols contamination in indoor air of university dormitory rooms. Int. J. Health Sci. (Qassim) 2015;9(3):249–256. [PMC free article] [PubMed] [Google Scholar]
- Heida H., Bartman E., van der Zee S.C. Occupational exposure and indoor air quality monitoring in a composting facility. AIHAJ. 1995;56(l):39–43. doi: 10.1080/15428119591017295. [DOI] [PubMed] [Google Scholar]
- Heo K.J., Kim H.B., Lee B.U. Concentration of environmental fungal and bacterial bioaerosols during the monsoon season. J. Aerosol Sci. 2014;77:31–37. doi: 10.1016/j.jaerosci.2014.07.001. [DOI] [PMC free article] [PubMed] [Google Scholar]
- Hoisington A., Maestre J.P., King M.D., Siegel J.A., Kinney K.A. The impact of sampler selection on characterizing the indoor microbiome. Build. Environ. 2014;80:274–282. [Google Scholar]
- Holst G., Høst A., Doekes G., Meyer H.W., Madsen A.M., Sigsgaard T. Determinants of house dust, endotoxin, and β-(1 → 3)-D-glucan in homes of Danish children. Indoor Air. 2015;25(3):245–259. doi: 10.1111/ina.12143. [DOI] [PubMed] [Google Scholar]
- Hoppin J.A., Umbach D.M., Long S., Rinsky J.L., Henneberger P.K., Salo P.M. Respiratory disease in United States farmers. Occup. Environ. Med. 2014;71(7):484–491. doi: 10.1136/oemed-2013-101983. [DOI] [PMC free article] [PubMed] [Google Scholar]
- Hussin N.H.M., Sann L.M., Shamsudin M.N., Hashim Z. Characterization of bacteria and fungi bioaerosol in the indoor air of selected primary schools in Malaysia. Indoor Built Environ. 2011;20(6):607–617. [Google Scholar]
- IAQA . Indoor Air Quality Association, Inc.; Longwood, Florida, USA: 1995. (Indoor Air Quality Association). Indoor Air Quality Association Inc. Indoor Air Quality Standard #95-1 Recommended for Florida. [Google Scholar]
- Jensen P.A., Schafer M.P. Sampling and characterization of bioaerosols. NIOSH manual of analytical methods. 1998. https://www.cdc.gov/niosh/docs/2003-154/pdfs/chapter-j.pdf Available at:
- Johnson E.S., Choi K.M. Lung cancer risk in workers in the meat and poultry industries—a review. Zoonoses Public Health. 2012;59(5):303–313. doi: 10.1111/j.1863-2378.2012.01459.x. [DOI] [PubMed] [Google Scholar]
- Jutel M., Agache I., Bonini S., Burks A.W., Calderon M., Canonica W. International consensus on allergen immunotherapy II: mechanisms, standardization, and pharmacoeconomics. J. Allergy Clin. Immunol. 2016;137:358–368. doi: 10.1016/j.jaci.2015.12.1300. [DOI] [PubMed] [Google Scholar]
- Kang S.M., Heo K.J., Lee B.U. Why does rain increase the concentrations of environmental bioaerosols during monsoon? Aerosol Air Qual. Res. 2015;15:2320–2324. [Google Scholar]
- Karvonen A.M., Hyvärinen A., Korppi M., Haverinen-Shaughnessy U., Renz H., Pfefferle P.I., Reme S., Genuneit J., Pekkanen J. Moisture damage and asthma: a birth cohort study. Pediatrics. 2015;135(3):598–606. doi: 10.1542/peds.2014-1239. [DOI] [PubMed] [Google Scholar]
- Kharitonov S.A., Sjöbring U. Lipopolysaccharide challenge of humans as a model for chronic obstructive lung disease exacerbations. Contrib. Microbiol. 2007;14:83–100. doi: 10.1159/000107056. [DOI] [PubMed] [Google Scholar]
- Knoll M.D., O'Brien K.L., Henkle E., Lee E., Watt J.P., McCall N., Mangtani P. Global literature review of Haemophilus influenzae type b and Streptococcus pneumoniae invasive disease among children less than five years of age 1980-2005 (WHO/IVB/09.02) 2009. http://whqlibdoc.who.int/hq/2009/WHO_IVB_09.02_eng.pdf Available at:
- Kurek M.A., Wyrwisz J., Wierzbicka A. Effect of β-glucan particle size on the properties of fortified wheat rolls. CyTA – J. Food. 2016;14(1):124–130. [Google Scholar]
- Lee B.U., Hong I.G., Hee Lee D.H., Chong E.S., Jung J.H., Lee J.H. Bioaerosol concentrations in public restroom environments. Aerosol Air Qual. Res. 2012;12:251–255. [Google Scholar]
- Lee B.U., Lee G., Heo K.J. Concentration of culturable bioaerosols during winter. J. Aerosol Sci. 2016;94:1–8. [Google Scholar]
- Lehtinen J., Tolvanen O., Nivukoski U., Veijanen A., Hänninen K. Occupational hygiene in terms of volatile organic compounds (VOCs) and bioaerosol at two solid waste management plants in Finland. Waste Manag. 2013;33(4):964–973. doi: 10.1016/j.wasman.2012.11.010. [DOI] [PubMed] [Google Scholar]
- Li C.S. Evaluation of microbial samplers for bacterial microorganisms. Aerosol Sci. Technol. 1999;30:100–108. [Google Scholar]
- Lin S., Jones R., Munsie J.P., Nayak S.G., Fitzgerald E.F., Hwang S.A. Childhood asthma and indoor allergen exposure and sensitization in Buffalo, New York. Int. J. Hyg. Environ. Health. 2012;215(3):297–305. doi: 10.1016/j.ijheh.2011.08.017. [DOI] [PubMed] [Google Scholar]
- Lindemann J., Constantinidou H.A., Barchet W.R., Upper C.D. Plants as sources of airborne bacteria, including ice nucleation-active bacteria. Appl. Environ. Microbiol. 1982;44:1059–1063. doi: 10.1128/aem.44.5.1059-1063.1982. [DOI] [PMC free article] [PubMed] [Google Scholar]
- Ling Y., Chen H., Chen X., Yang X., Yang J., Bavoil P.M. Epidemiology of Chlamydia psittaci infection in racing pigeons and pigeon fanciers in Beijing, China. Zoonoses Public Health. 2015;62(5):401–406. doi: 10.1111/zph.12161. [DOI] [PubMed] [Google Scholar]
- Ma Y., Tian G., Tang F., Yu B., Chen Y., Cui Y., He Q., Gao Z. The link between mold sensitivity and asthma severity in a cohort of northern Chinese patients. J. Thorac. Dis. 2015;(4):585–590. doi: 10.3978/j.issn.2072-1439.2015.01.04. [DOI] [PMC free article] [PubMed] [Google Scholar]
- Macher J.M., Chatigny M.A., Burge H.A. Sampling airborne microorganisms and aeroallergens. In: Cohen B.S., Hering S.V., editors. Air Sampling Instruments for Evaluation of Atmospheric Contaminants. 8th edition. ACGIH; Cincinnati, Ohio, USA: 1995. pp. 589–617. [Google Scholar]
- Macher J., Chen B., Rao C. Chamber evaluation of a personal, bioaerosol cyclone sampler. J. Occup. Environ. Hyg. 2008;5:702–712. doi: 10.1080/15459620802380351. [DOI] [PubMed] [Google Scholar]
- Maheswaran D., Zeng Y., Chan-Yeung M., Scott J., Osornio-Vargas A., Becker A.B. Exposure to beta-(1,3)-D-glucan in house dust at age 7–10 is associated with airway hyperresponsiveness and atopic asthma by age 11–14. PLoS One. 2014;9(6) doi: 10.1371/journal.pone.0098878. [DOI] [PMC free article] [PubMed] [Google Scholar]
- Malmberg P. Microorganisms. In: Beije B., Lundberg P., editors. Criteria Documents from the Expert Group. Arbets Milio Institutet; Solna, Sweden: 1991. [Google Scholar]
- Mandal J., Brandl H. Bioaerosols in indoor environment-a review with special reference to residential and occupational locations. Open Environ. Biol. Monit. J. 2011;4:83–96. [Google Scholar]
- Marin S., Ramos A.J., Cano-Sancho G., Sanchis V. Mycotoxins: occurrence, toxicology, and exposure assessment. Food Chem. Toxicol. 2013;60:218–237. doi: 10.1016/j.fct.2013.07.047. [DOI] [PubMed] [Google Scholar]
- McFarland A.R., Haglund J.S., King M.D., Hu S., Phull M.S., Moncla B.W. Wetted wall cyclones for bioaerosol sampling. Aerosol Sci. Technol. 2010;44:241–252. [Google Scholar]
- McGill G., Moore J., Sharpe T., Downey D., Oyedele L. Mackintosh School of Architecture > Mackintosh Environmental Architecture Research Unit (MEARU); 2015. Airborne Bacteria and Fungi Concentrations in Airtight Contemporary Dwellings. [Google Scholar]
- McLean D., Cheng S., Woodward A., Pearce N. Mortality and cancer incidence in New Zealand meat workers. Occup. Environ. Med. 2004;61(6):541–547. doi: 10.1136/oem.2003.010587. [DOI] [PMC free article] [PubMed] [Google Scholar]
- Ministry of Environment, Republic of Korea. www.me.go.kr, http://eng.me.go.kr/content.do?method=move. 2010.
- Mitchell D.C., Armitage T.L., Schenker M.B., Bennett D.H., Tancredi D.J., Langer C.E. Particulate matter, endotoxin, and worker respiratory health on large Californian dairies. J. Occup. Environ. Med. 2015;57(1):79–87. doi: 10.1097/JOM.0000000000000304. [DOI] [PMC free article] [PubMed] [Google Scholar]
- Navdarashvili A., Doker T.J., Geleishvili M., Haberling D.L., Kharod G.A., Rush T.H. Human anthrax outbreak associated with livestock exposure Georgia, 2012. Epidemiol. Infect. 2015;19:1–12. doi: 10.1017/S0950268815001442. [DOI] [PMC free article] [PubMed] [Google Scholar]
- Nazaroff W.W. Teaching indoor environmental quality. Indoor Air. 2016;26:515–516. doi: 10.1111/ina.12309. [DOI] [PubMed] [Google Scholar]
- Niazi S., Hassanvand M.S., Mahvi A.H., Nabizadeh R., Alimohammadi M., Nabavi S. Assessment of bioaerosol contamination (bacteria and fungi) in the largest urban wastewater treatment plant in the Middle East. Environ. Sci. Pollut. Res. 2015;22(20):16014–16021. doi: 10.1007/s11356-015-4793-z. [DOI] [PubMed] [Google Scholar]
- OSHA (Occupational Health and Safety Administration) OSHA; Washington DC, USA: 1992. Technical Manual. (Online at: https://www.osha.gov/dts/osta/otm/otm_iii/otm_iii_2.html) [Google Scholar]
- OSHA (Occupational Safety and Health Administration) “Indoor air quality-proposed rule” notice of proposed rulemaking. Fed. Regist. 1994;59(65):15968–16039. [Google Scholar]
- Park D.U., Ryu S.H., Kim S.B., Yoon C.S. An assessment of dust, endotoxin, and microorganism exposure during waste collection and sorting. J. Air Waste Manag. Assoc. 2011;61(4):461–468. doi: 10.3155/1047-3289.61.4.461. [DOI] [PubMed] [Google Scholar]
- Park D.U., Yeom J.K., Lee W.J., Lee K.M. Assessment of the levels of airborne bacteria, gram-negative bacteria, and fungi in hospital lobbies. Int. J. Environ. Res. Public Health. 2013;10(2):541–555. doi: 10.3390/ijerph10020541. [DOI] [PMC free article] [PubMed] [Google Scholar]
- Park S.M., Kwak Y.S., Ji J.G. The effects of combined exercise on health-related fitness, endotoxin, and immune function of postmenopausal women with abdominal obesity. J. Immunol. Res. 2015 doi: 10.1155/2015/830567. [DOI] [PMC free article] [PubMed] [Google Scholar]
- Paudyal P., Semple S., Niven R., Tavernier G., Ayres J.G. Exposure to dust and endotoxin in textile processing workers. Ann. Occup. Hyg. 2011;55:403–409. doi: 10.1093/annhyg/meq084. [DOI] [PubMed] [Google Scholar]
- Pearson C., Littlewood E., Douglas P., Robertson S., Gant T.W., Hansella A.L. Exposures and health outcomes in relation to bioaerosol emissions from composting facilities: a systematic review of occupational and community studies. J. Toxicol. Environ. Health B Crit. Rev. 2015;18(1):43–69. doi: 10.1080/10937404.2015.1009961. [DOI] [PMC free article] [PubMed] [Google Scholar]
- Peden D., Reed C.E. Environmental and occupational allergies. J. Allergy Clin. Immunol. 2010;125:150–160. doi: 10.1016/j.jaci.2009.10.073. [DOI] [PubMed] [Google Scholar]
- Pedersen M.K., Andersen A.B., Andersen P.H., Svensson E., Jensen S.G., Lillebaek T. Occupational tuberculosis in Denmark through 21 years analysed by nationwide genotyping. PLoS One. 2016;11(4) doi: 10.1371/journal.pone.0153668. [DOI] [PMC free article] [PubMed] [Google Scholar]
- Phadke V.K., Bednarczyk R.A., Salmon D.A., Omer S.B. Association between vaccine refusal and vaccine-preventable diseases in the United States: a review of measles and pertussis. JAMA. 2016;315(11):1149–1158. doi: 10.1001/jama.2016.1353. [DOI] [PMC free article] [PubMed] [Google Scholar]
- Puzelli S., Rossini G., Facchini M., Vaccari G., Di Trani L., Di Martino A. Human infection with highly pathogenic A(H7N7) avian influenza virus, Italy, 2013. Emerg. Infect. Dis. 2014;20(10):1745–1749. doi: 10.3201/eid2010.140512. [DOI] [PMC free article] [PubMed] [Google Scholar]
- Rao C.Y., Burge H.A., Chang J.C.S. Review of quantitative standards and guidelines for fungi in indoor air. J. Air Waste Manag. Assoc. 1996;46:899–908. doi: 10.1080/10473289.1996.10467526. [DOI] [PubMed] [Google Scholar]
- Richter S.S., Heilmann K.P., Dohrn C.L. Pneumococcal serotypes before and after introduction of conjugate vaccines, United States, 1999–2011. Emerg. Infect. Dis. 2013;19(7):1074–1083. doi: 10.3201/eid1907.121830. [DOI] [PMC free article] [PubMed] [Google Scholar]
- Richter J., Svozil V., Král V., Dobiášová L.R., Vetvicka V. β-Glucan affects mucosal immunity in children with chronic respiratory problems under physical stress: clinical trials. Ann. Transl. Med. 2015;3(4):52–59. doi: 10.3978/j.issn.2305-5839.2015.03.20. [DOI] [PMC free article] [PubMed] [Google Scholar]
- Roest H.I., Tilburg J.J.H.C., Vellema P., Van Zijderveld F.G., Klaassen C.H.W., Raoult D. The Q fever epidemic in The Netherlands: history, onset, response and reflection. Epidemiol. Infect. 2011;139(1):1–12. doi: 10.1017/S0950268810002268. [DOI] [PubMed] [Google Scholar]
- Rohani P., Drake J.M. The decline and resurgence of pertussis in the US. Epidemics. 2011;3(3–4):183–188. doi: 10.1016/j.epidem.2011.10.001. [DOI] [PubMed] [Google Scholar]
- Rohr A.C., Campleman S.L., Long C.M., Peterson M.K., Weatherstone S., Quick W. Potential occupational exposures and health risks associated with biomass-based power generation. Int. J. Environ. Res. Public Health. 2015;12(7):8542–8605. doi: 10.3390/ijerph120708542. [DOI] [PMC free article] [PubMed] [Google Scholar]
- Severson K.M., Mallozzi M., Driks A., Knight K.L. B cell development in GALT: role of bacterial superantigen-like molecules. J. Immunol. 2010;184(12):6782. doi: 10.4049/jimmunol.1000155. [DOI] [PMC free article] [PubMed] [Google Scholar]
- Smirnova A., Li H., Weingart H., Aufhammer S., Burse A., Finis K. Thermoregulated expression of virulence factors in plant-associated bacteria. Arch. Microbiol. 2001;176:393–399. doi: 10.1007/s002030100344. [DOI] [PubMed] [Google Scholar]
- Solano R., Rius C., Simón P., Manzanares-Laya S., Ros M., Toledo D., Domíngez À., Caylà J.A. Evaluation of reported cases of pertussis: epidemiological study in a large city in Spain. J. Med. Microbiol. 2014;63:1688–1695. doi: 10.1099/jmm.0.079756-0. [DOI] [PubMed] [Google Scholar]
- Srikanth P., Sudharsanam S., Steinberg R. Bio-aerosols in indoor environment: composition, health effects and analysis. Ind. J. Med. Biol. 2008;26:302–312. doi: 10.4103/0255-0857.43555. [DOI] [PubMed] [Google Scholar]
- Thilsing T., Madsen A.M., Basinas I., Schlünssen V., Tendal K., Bælum J. Dust, endotoxin, fungi, and bacteria exposure as determined by work task, season, and type of plant in a flower greenhouse. Ann. Occup. Hyg. 2015;59(2):142–157. doi: 10.1093/annhyg/meu090. [DOI] [PubMed] [Google Scholar]
- Thomas T., Gilbert J., Meyer F. Metagenomics — a guide from sampling to data analysis. Microb. Inform. Exp. 2012;2:3. doi: 10.1186/2042-5783-2-3. [DOI] [PMC free article] [PubMed] [Google Scholar]
- Thorne P.S., Kickhaefer M.S., Whitten P., Doriham K.J. Comparison of bioaerosol sampling methods in barns housing swine. Appl. Environ. Microbiol. 1992;58:2543–2551. doi: 10.1128/aem.58.8.2543-2551.1992. [DOI] [PMC free article] [PubMed] [Google Scholar]
- Tirsoaga A., Novikov A., Adib-Conquy M., Werts C., Fitting C., Cavaillon J.M. Simple method for repurification of endotoxins for biological use. Appl. Environ. Microbiol. 2007;73:1803–1808. doi: 10.1128/AEM.02452-06. [DOI] [PMC free article] [PubMed] [Google Scholar]
- Tolvanen O.K., Hänninen K.I. Mechanical–biological waste treatment and the associated occupational hygiene in Finland. Waste Manag. 2006;26(10):119–1125. doi: 10.1016/j.wasman.2005.07.020. [DOI] [PubMed] [Google Scholar]
- Tsai F.C., Macher J.M. Concentrations of airborne culturable bacteria in 100 large US office buildings from the BASE study. Indoor Air. 2005;15:71–81. doi: 10.1111/j.1600-0668.2005.00346.x. [DOI] [PubMed] [Google Scholar]
- Uhrbrand K., Schultz A.C., Madsen A.M. Exposure to airborne noroviruses and other bioaerosol components at a wastewater treatment plant in Denmark. Food Environ. Virol. 2011;3:130–137. [Google Scholar]
- Van Leuken J.P.G., Swart A.N., Havelaar A.H., Van Pul A., Van der Hoek W., Heederik D. Atmospheric dispersion modelling of bioaerosols that are pathogenic to humans and livestock—a review to inform risk assessment studies. Microb. Risk Anal. 2016;1:19–39. doi: 10.1016/j.mran.2015.07.002. [DOI] [PMC free article] [PubMed] [Google Scholar]
- Vanrompay D., Harkinezhad T., Walle M., Beeckman D. Droogenbroeck C. Chlamydophila psittaci transmission from pet birds to humans. Emerg. Infect. Dis. 2007;13:1108–1110. doi: 10.3201/eid1307.070074. [DOI] [PMC free article] [PubMed] [Google Scholar]
- Verma J., Saxena S., Babu S.G. ELISA-based identification and detection of microbes. In: Arora D., Das S., Sukumar M., editors. Analyzing Microbes. Springer; Berlin, Heidelberg: 2013. (Springer Protocols Handbooks). [Google Scholar]
- Wallace R.J., Gropp J., Dierick N., Costa L.G., Martelli G., Brantom P.G. Risks associated with endotoxins in feed additives produced by fermentation. Environ. Health. 2016;15:5–9. doi: 10.1186/s12940-016-0087-2. [DOI] [PMC free article] [PubMed] [Google Scholar]
- Wang Z., Reponen T., Grinshpun S.A., Górny R.L., Willeke K. Effect of sampling time and air humidity on the bioefficiency of filter samplers for bioaerosol collection. J. Aerosol Sci. 2001;32(5):661–674. [Google Scholar]
- West A. A brief review of Chlamydophila psittaci in birds and humans. J. Exot. Pet. Med. 2011;20:18–20. [Google Scholar]
- WHO (World Health Organization) n. 31. 1988. Indoor Air Quality: Biological Contaminants. (World Health Organization, European Series). (Copenhagen, Denmark. Online at: http://www.euro.who.int/__data/assets/pdf_file/0005/156146/WA754ES.pdf) [Google Scholar]
- WHO (World Health Organization) 2009. WHO Guidelines for Indoor Air Quality: Dampness and Mold. (ISBN: 7989289041683) [PubMed] [Google Scholar]
- Wiley K.E., Zuo Y., Macartney K.K., McIntyre P.B. Sources of pertussis infection in young infants: a review of key evidence informing targeting of the cocoon strategy. Vaccine. 2013;31(4):618–625. doi: 10.1016/j.vaccine.2012.11.052. [DOI] [PubMed] [Google Scholar]
- Wu Y., Shen F., Yao M. Use of gelatin filter and BioSampler in detecting airborne H5N1 nucleotides, bacteria and allergens. J. Aerosol Sci. 2010;41:869–879. [Google Scholar]
- Wu X., Lu Y., Zhou S., Chen L., Xu B. Impact of climate change on human infectious diseases: empirical evidence and human adaptation. Environ. Int. 2015;86:14–23. doi: 10.1016/j.envint.2015.09.007. [DOI] [PubMed] [Google Scholar]
- Xu Z., Wei K., Wu Y., Shen F., Chen Q., Li M. Enhancing bioaerosol sampling by Andersen impactors using mineral-oil-spread agar plate. PLoS One. 2013;8:56896. doi: 10.1371/journal.pone.0056896. [DOI] [PMC free article] [PubMed] [Google Scholar]
- Yang X., Wang X., Zhang Y., Lee J., Su J., Gates R.S. Monitoring total endotoxin and (1 → 3)-beta-D-glucan at the air exhaust of concentrated animal feeding operations. J. Air Waste Manag. Assoc. 2013;63(10):1190–1198. doi: 10.1080/10962247.2013.810556. [DOI] [PubMed] [Google Scholar]
- Yoon C., Lee K., Park D. Indoor air quality differences between urban and rural preschools in Korea. Environ. Sci. Pollut. Res. 2011;18(3):333–345. doi: 10.1007/s11356-010-0377-0. [DOI] [PubMed] [Google Scholar]
- Zachariah P., Stockwell M.S. Measles vaccine: past, present, and future. J. Clin. Pharmacol. 2016;56(2):133–140. doi: 10.1002/jcph.606. [DOI] [PubMed] [Google Scholar]