Abstract
Learning disabilities are hallmarks of congenital conditions caused by prenatal exposure to harmful agents. Those include Fetal Alcohol Spectrum Disorders (FASD) with a wide range of cognitive deficiencies including impaired motor skill development. While these effects have been well characterized, the molecular effects that bring about these behavioral consequences remain to be determined. We have previously found that the acute molecular responses to alcohol in the embryonic brain are stochastic, varying among neural progenitor cells. However, the pathophysiological consequences stemming from these heterogeneous responses remain unknown. Here we show that acute responses to alcohol in progenitor cells alter gene expression in their descendant neurons. Among the altered genes, an increase of the calcium-activated potassium channel Kcnn2 in the motor cortex correlates with motor learning deficits in the mouse model of FASD. Pharmacologic blockade of Kcnn2 improves these learning deficits, suggesting Kcnn2 blockers as a novel intervention for learning disabilities in FASD.
Accession codes: GSE141714
Introduction
Early-onset intellectual disability and cognitive impairment are unresolved health care problems with no efficient therapeutic solution available, contributing to an enormous socio-economic burden for both the affected individuals and their families1,2. Prenatal exposure to alcohol, smoking, medications, heavy metals, and radiation are just some of the environmental factors linked to the increased risk of these problems3,4. The brain areas controlling motor skills and cognition are anatomically and functionally connected, and develop at similar times during early brain development5. Motor skill development also has been shown to serve as an indicator of cognitive and intellectual abilities5. As such, it has been suggested that early intervention of deficits in motor skill learning might be a key for improving cognitive and intellectual problems including those in Fetal Alcohol Spectrum Disorders (FASD)6.
Recently, we identified cell-to-cell variability among neural progenitor cells within the cerebral cortex in their acute molecular response to prenatal alcohol exposure, and that this activity is mediated by heterogeneous activation of heat shock (HS) signaling7–10. This acute activation of HS signaling occurs immediately in response to cellular stress11 to protect progenitor cells7,12,13; however, excessive activation can cause abnormal cell cycling and delay in radial migration of young neurons10,13. Together, with the evidence that HS signaling can mark epigenetic transcriptional memory14, these findings suggest that variable impacts associated with prenatal HS responses on later neural functions can be important therapeutic targets for cognitive and intellectual disabilities in FASD. However, this possibility has yet to be formally examined.
In this study, using an established mouse model of FASD, we report that prenatal exposure to alcohol leads to deficits in gross and fine motor skill learning, without affecting overall locomotor activity or anxiety-like behavior. Using a reporter system that we developed to permanently trace the cell lineage in which HS signaling is activated, we found that cortical neurons derived from progenitors that responded to prenatal alcohol exposure exhibit abnormal and heterogeneous molecular properties in the mature brain. We further found that an increased expression of Kcnn2 (potassium intermediate/small calcium-activated channel, subfamily N, member 2) in these neurons contributes to their altered physiological properties and impairments. Postnatal administration of a Kcnn2 blocker to these mice improved the motor learning impairments. Our results provide the first evidence for the therapeutic potential of Kcnn2 blockers as a novel intervention for learning disabilities in FASD.
Results
Acute alcohol exposure during corticogenesis impairs motor skill learning in mice
To assess the impact of prenatal alcohol exposure (PAE) on motor skill learning in mice, we used the paradigm of ethanol (EtOH) exposure during corticogenesis7–10. Mice were exposed to EtOH in utero at embryonic days (E) 16 and 17, during which upper cortical layer neurons are predominantly generated15–19. This period of exposure falls in the early mid-gestation in humans, and minimizes impacts on other brain regions involved in motor learning such as the cerebellum, in which neurogenesis occurs postnatally in mice20. EtOH (4.0 g/kg weight) or PBS (control) was administered to pregnant mice by an intraperitoneal (i.p.) injection on each day, and behavior tests were performed following the schedule shown in Fig. 1a. Using this model, no differences were observed in body weight (Fig. 1b) or brain size/weight (Extended Data 1) between PAE and control mice at postnatal day (P) 30. Open field test also showed that locomotor activity and anxiety-like behavior were not altered in our acute PAE paradigm (Extended Data 1). Consistently, PAE mice did not show significant changes in motor coordination at the first trial in the accelerated rotarod test (Fig. 1c, d). However, PAE mice exhibited a significantly lower learning index (Fig. 1e), shorter latency to fall during later trials on the accelerated rotarod (Fig. 1f), and smaller increase in the terminal speed between trials 1 and 6 (Fig. 1g) compared to control mice. No differences in learning index were observed between females and males from either treatment group (see Fig. 1e). Similar results were obtained by assessing over a period of 5 days (Extended Data 2), confirming a learning-based, rather than coordination-related impairment in gross motor skill in PAE mice. Learning deficits were found to persist even in mature adult (3 months old) PAE mice (Extended Data 2). These results corroborate with previous reports using a prenatal chronic alcohol exposure paradigm on Swiss-Webster mice and rats21. PAE at a lower dose (1.0 g/kg weight), on the same administration schedule, did not affect motor skill learning at a statistically significant level (Supplementary Figure 1), indicating a dose-dependent impact of PAE.
Figure 1. Impaired motor skill learning in mice prenatally exposed to alcohol.
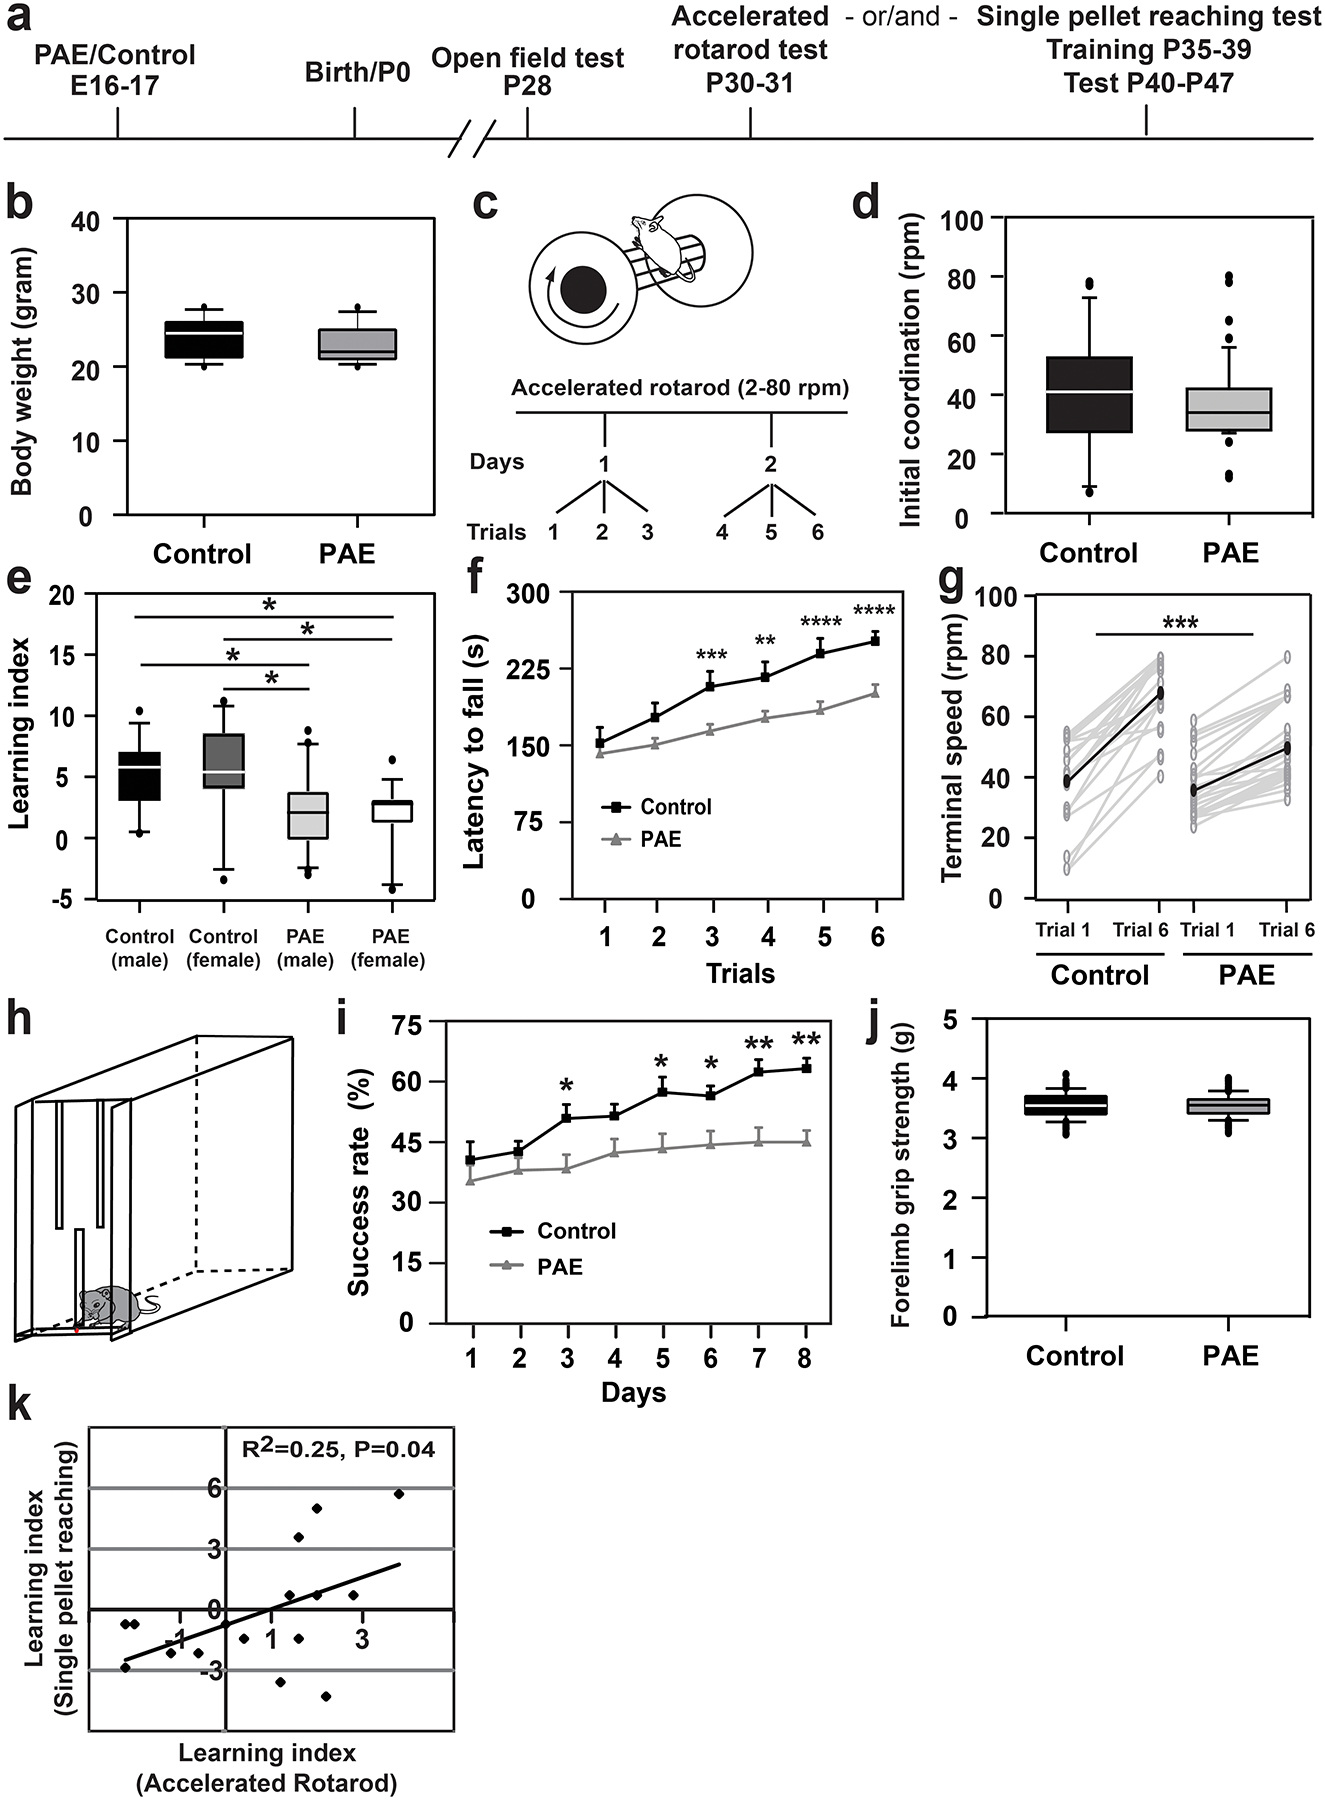
(a) Experimental timeline. (b) Body weight is unaffected by prenatal alcohol exposure (PAE); P = 0.43 by two-tailed Student’s t-test [n = 12 animals (including both sexes) per group]. (c) Experimental paradigm of accelerated rotarod test. (d) Initial motor coordination (terminal speed at trial 1) is not affected by PAE; P = 0.31 by two-tailed Mann-Whitney U test (control: n = 25 animals, PAE: n = 49 animals). (e) The learning indices of PAE mice are significantly lower than those of controls, but not affected by sex; F(1,60) = 15.19, P = 0.0002 and F(1,60) = 0.0003, P = 0.99, respectively by two-way ANOVA. *P < 0.05 by Tukey test [control (male): n = 14 animals, control (female): n = 11 animals, PAE (male): n = 20 animals, PAE (female): n = 19 animals]. (f) Latency to fall at each trial in the rotarod test. A significant interaction between the effects of exposure type (PAE or control) and trial was observed; F(5,72) = 2.73, P = 0.02 by two-way repeated measures ANOVA. PAE mice show significantly shorter latency to fall from the 3rd trial; **P < 0.01, ***P < 0.005, ****P < 0.001 by simple main effect test (control: n = 25 animals, PAE: n = 49 animals). Graph shows mean ± Standard Error of the Mean (SEM). (g) The increases of terminal speeds between trials 1 and 6 were compared between control and PAE mice. Gray and black lines show the data for individual mice and the means, respectively. The increase was significantly smaller in PAE mice; ***P < 0.0001 by two-tailed Student’s t-test (control: n = 20 animals, PAE: n = 26 animals). (h) Schematic of the single-pellet reaching test box. (i) PAE mice show lower success rates; F(1,30) = 43.42, P < 0.0001, by two-way repeated measures ANOVA, *P < 0.05, **P < 0.01 by Tukey test (control: n = 14 animals, PAE: n = 10 animals). Graph shows mean ± SEM. (j) Forelimb grip strength is not affected by PAE. P = 0.92 by two-tailed Student’s t-test (n=10 animals per group). (k) Pearson’s correlation analysis reveals a positive correlation between learning indices of the rotarod and pellet reaching tests on PAE mice; Pearson’s correlation of determination r2 = 0.25, P = 0.04 (n = 16 animals per group). Separate groups of animals were used for rotarod and single pellet reaching tests, except for the correlation study (k), in which the rotarod test was performed before the single pellet reaching test on the same mice. In box plots (b, d, e, j), the line within the box indicates the median, and the upper and lower edges of the box represent the 25th and 75th percentiles, respectively. The upper and lower whisker boundaries indicate the 10th and 90th percentiles, respectively, and dots indicate outliers.
As the delayed acquisition of self-feeding behavior is one characteristic of FASD22, we also examined the impact of PAE on fine motor skill learning by employing the single-pellet reaching test with PAE and control mice that were not previously placed in other behavior tests. This test evaluates the motor learning ability of each mouse to reach a small food pellet with a forelimb through the narrow slit of a box, and transfer the pellet to its mouth (Fig. 1h)21,23–25. The pattern of weight loss due to fasting during the test period was similar between PAE and control mice (Extended Data 3a). As with the rotarod test, PAE mice showed no differences in the rate of success to complete the first trial (Fig. 1i). However, in contrast to an approximately 25% increase in the rate of success during the 8-day test period in control mice, PAE mice showed less than an 8% increase in their success rate (Fig. 1i). Detailed analysis on specific steps during the task revealed that PAE and control mice made similar levels of skill improvement in forelimb reaching to a pellet (data not shown) and forelimb retrieval after successful grabbing of a pellet (Extended Data 3c), however PAE mice showed impaired learning in grasping of a pellet (Extended Data 3b). This impairment was not likely due to muscular problems as we observed no differences in the forelimb grip strength between PAE and control mice (Fig. 1j). Although statistically insignificant, PAE mice showed fewer attempts to reach a pellet in the last 3 days of the test (Extended Data 3d). This might suggest slightly weaker motivation of PAE mice to attempt trials after a few days of failures. By placing animals in multiple behavior tests (Fig. 1a), the Pearson’s correlation analysis revealed that the motor skill learning deficits involving large (accelerated rotarod) and fine (single pellet reaching) motor muscles were correlated (Fig. 1k). This suggests that potential abnormalities in brain regions, cell types, and/or molecular pathways due to PAE may represent a shared mechanism by which deficits arise in both of these distinct motor skills.
Acute activation of HS signaling in progenitor cells upon prenatal alcohol exposure is associated with long-term molecular pathologies in neuronal progeny
Our previous studies have revealed heterogeneous molecular responses through the activation of HS signaling, a canonical stress response pathway11,14, in neural progenitor cells in embryonic cortex immediately after environmental stress exposure7,8,10. However, it remains largely unknown how such heterogeneous responses in progenitor cells affect their progeny and contribute to behavioral abnormalities, such as motor skill learning impairment (Fig. 1). To address these questions, we developed an HSE-RFP reporter system in which Flippase-FRT recombination occurs to drive RFP expression under the control of HS response element (HSE) upon activation of HS signaling (Fig. 2a)8. With this system, RFP reporter expression allows us to trace the lineages of cells, in which HS signaling had once activated during the acute phase, long after the activation has diminished (e.g., 24 hours post EtOH exposure9).
Figure 2. Single-cell RNA-sequencing reveals long-term impacts of PAE in postnatal cortical neurons.
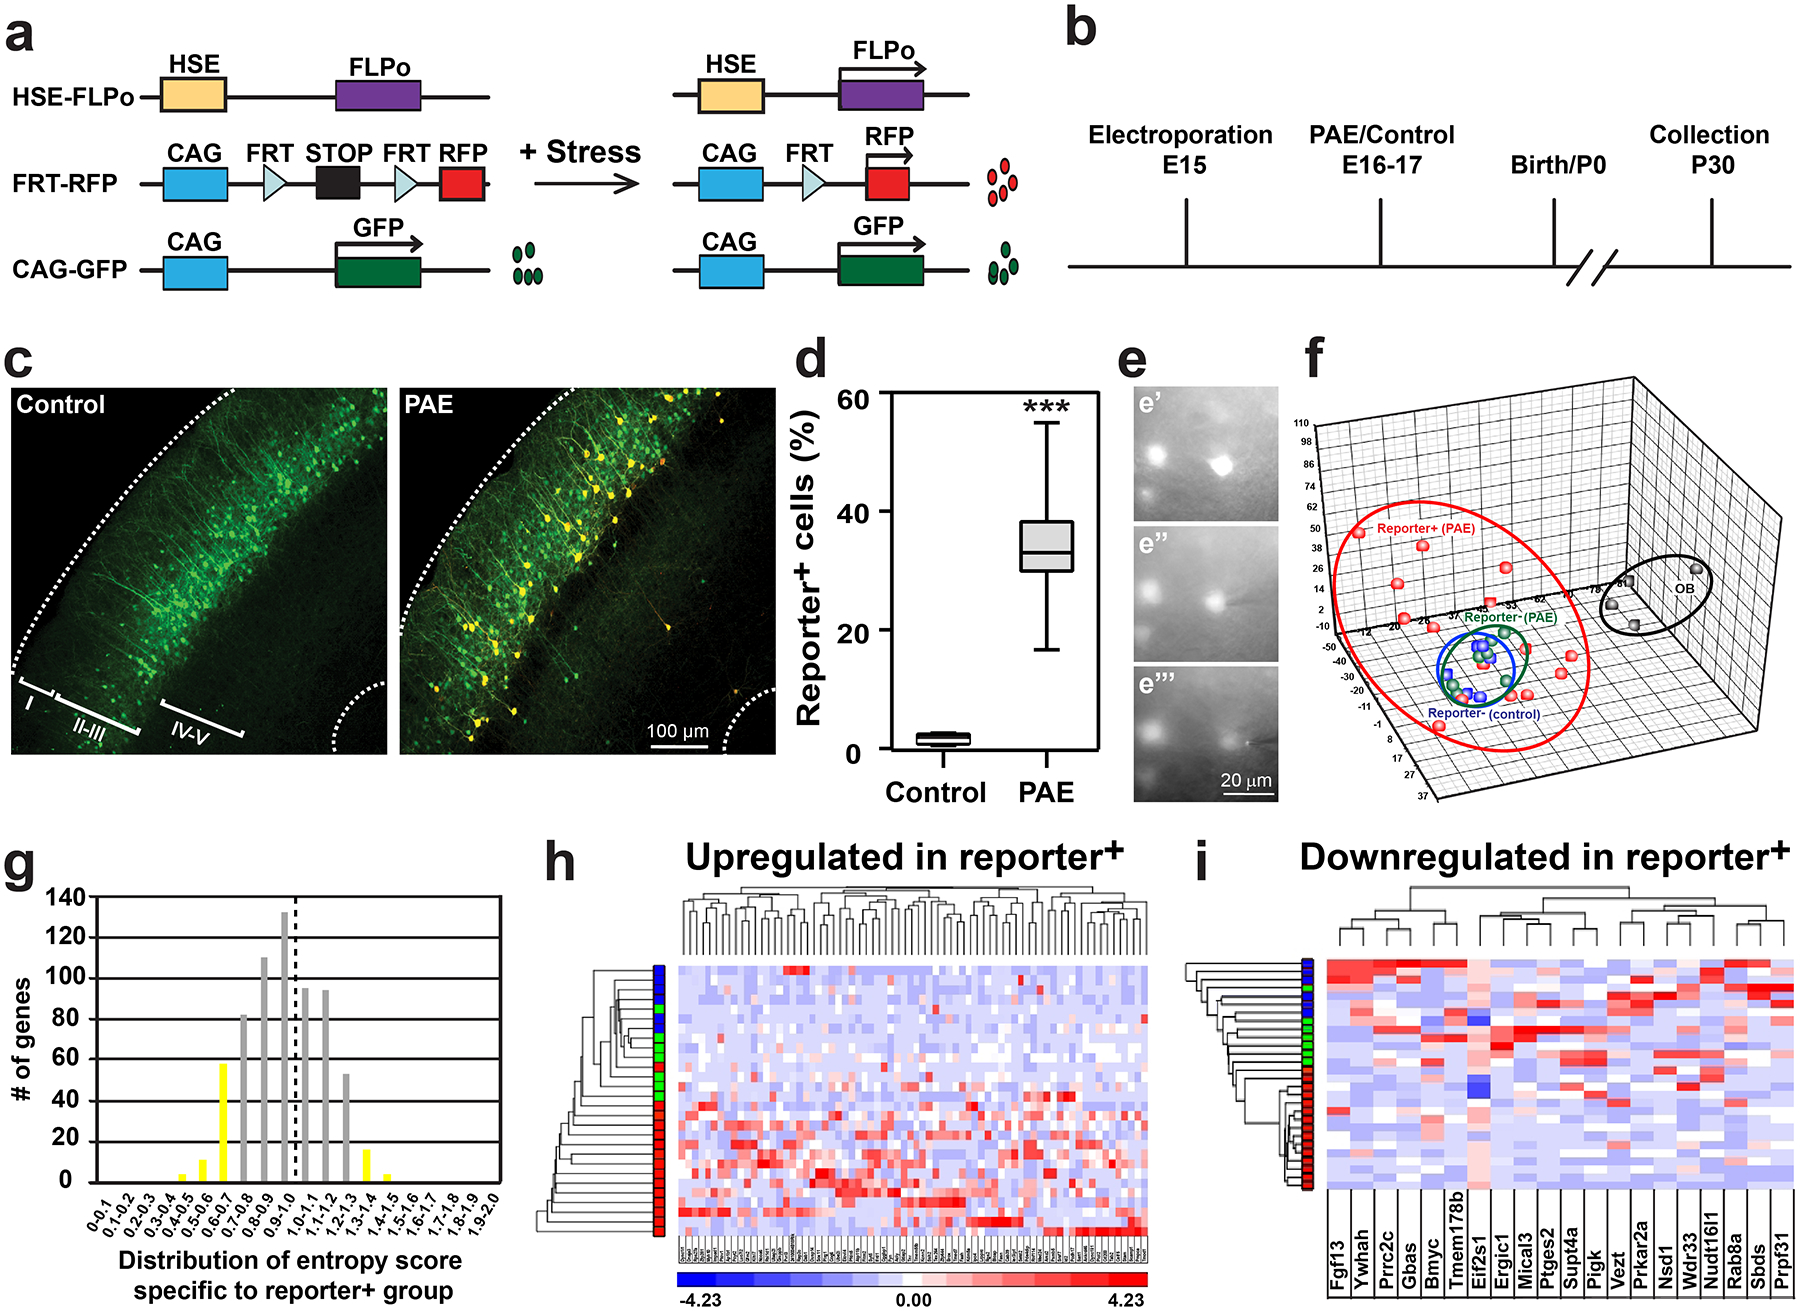
(a) Design of the lineage-tracing HSE-FLPo;FRT-STOP-RFP (HSE-RFP) reporter system. (b) Experimental timeline. (c, d) RFP reporter expression was observed in a subset of GFP+ electroporated neurons in layer III of the M1 in PAE mice, but not in control mice. ***P = 0.0003 by two-tailed Student’s t-test (n = 10 animals per group). In box plots (d), the line within the box indicates the median, and the upper and lower edges of the box represent the 25th and 75th percentiles, respectively. The upper and lower whisker boundaries indicate the 10th and 90th percentiles, respectively, and dots indicate outliers. (e) Representative images of sampling intracellular contents from a single cell (time course, top to bottom). Similar results were obtained with n = 4 animals. (f) Principal Component Analysis shows highly variable molecular properties of reporter+ neurons in PAE mice (red), segregated from the clusters of reporter− neurons in PAE (green) and control (blue) mice, and the cluster of olfactory bulb (OB) neurons (black) [olfactory bulb neurons: n = 4, reporter+ neurons (PAE): n = 15, reporter− neurons (PAE): n= 7, reporter− neurons (control): n = 6]. (g) Gene counts against the entropy score among reporter+ neurons in PAE mice defined by ROKU. Left and right sides of a broken line include the upregulated and downregulated genes in reporter+ neurons, respectively. The genes in yellow bars are considered as specifically changed in reporter+ neurons. (h, i) K-means clustering and heatmaps of 73 upregulated (h) and 20 downregulated (i) genes in the reporter+ neurons defined by ROKU (in the yellow bars in g). Gene names (from left to right in h and i) are re-listed in Supplementary Table 3. Red, green and blue colors in the y-axis correspond to each cell in PCA (see f).
Constructs were introduced using directed in utero electroporation26,27 at E15 into neural progenitor cells that typically generate excitatory projection neurons in layers II/III of the primary motor cortex (M1). EtOH or PBS (control) was administered over the following two days (E16 and 17), and mice that were successfully electroporated in M1 (confirmed with GFP expression) were selected at birth for analysis at P30 (Fig. 2b). In PAE mice, approximately 35% of GFP+ neurons (in layer III in M1) originating from the electroporated progenitor cells were also RFP+, indicating that HS signaling activation had occurred in a subpopulation of progenitor cells to drive reporter expression over the detectable level upon EtOH exposure10. Very few GFP+ neurons (<2%) co-expressed RFP in control mice (Fig. 2c, d). RFP+ and RFP− neurons in PAE mice, as well as RFP− neurons in control mice, showed no significant differences in their radial distribution (Extended Data 4a), gross morphology (Extended Data 4b–e), or spine formation (Supplementary Figure 2). Although we do not exclude the possibility of subtler abnormalities, our results are consistent with previous studies that show no significant changes in either proliferation and differentiation of cortical neural progenitors, or in neuronal migration and morphology, using similar PAE models7,10,28.
We then compared the molecular profiles of these neurons. Our previous study revealed highly variable levels of HS signaling activation among progenitor cells upon exposure to EtOH10, suggesting similar cell-to-cell variability among RFP+ neurons originated from these progenitors. Therefore, to identify differentially expressed genes without masking important genes that may be altered only in subsets of neurons within each group, we used single-cell RNA sequencing rather than conventional population-based analysis. For RNA sampling from single neurons, we used the microcapillary method29, by which intracellular contents were collected from each individual cell (Fig. 2e), to avoid artifacts known to be introduced through the cell dissociation process30.
The average read depth per neuron was 3,279,886. Using the Tophat2-cufflink pipeline, reads were aligned at an average of 78.7% with 20.5% multiple alignment. Removal of samples with less than 70% coverage resulted in 28 samples in total, and these subsequent samples passed multiple quality control tests (Supplementary Figure 3–5). By removing the genes with RPKM lower than 1.0 for all neuronal samples, we obtained 1,024 genes for subsequent analyses (Supplementary Table 1).
With these data, we first performed principal component analysis (PCA) to assess the similarity or variability of gene expression profiles among individual neurons. The single-cell profiles of olfactory bulb neurons that were processed simultaneously were analyzed as reference controls. The results of our PCA showed a clear separation of olfactory bulb neurons from M1 cortical neurons (Fig. 2f), validating the ability of our single-cell profiling approach to capture specific molecular characteristics in cells from distinct groups. Clustering of RFP− neurons from both PAE and control mice (blue and green dots in Fig. 2f) was observed, indicating similar molecular profiles among these neurons. In stark contrast, we found that RFP+ neurons from PAE mice had different profiles that were also widely separated among each other (red dots in Fig. 2f), indicating distinct and highly heterogeneous molecular profiles within this cell group. There was no significant variability in the levels of ERCC spike-in RNAs, confirming that the heterogeneity was not due to technical variability.
To identify the genes whose expression is altered in the RFP+ neuronal group in PAE mice, we employed the ROKU algorithm, which ranks genes according to their overall group specificity using Shannon entropy and detects the groups specific to each gene using an outlier detection method31. The analysis identified 73 upregulated and 20 downregulated genes in RFP+ neurons (Fig. 2g–i, Supplementary Table 2, 3). Similarly, weighted gene correlation network analysis (WGCNA)32 identified 9 gene modules of highly correlated genes including 5 modules that were unique to RFP+ neurons in PAE mice (Fig. 3a, b, Supplementary Table 4). Of the genes specific to RFP+ neurons defined by ROKU, 37 genes were found in either of these 5 modules (Supplementary Table 5). Notably, each of these 5 modules showed enrichment of specific Gene Ontology (GO) linked to learning (Figs. 3c–e, Extended Data 5). One module (Brown module in Fig. 3a, b) showed enrichment of fatty acid synthesis-related genes (Fig. 3c) that are linked to intellectual disability and autism33–35. The GO term “learning and memory” was enriched in a different module (Yellow module in Fig. 3a, b), which included the genes involved in synaptic plasticity, long term potentiation, and other physiological functions of neurons (Fig. 3d). Another module (Magenta module in Fig. 3a, b) included GO terms related to ion transportation which is critical for synaptic plasticity (Fig. 3e). On the other hand, except in the Turquoise module (in Fig. 3a, b), we found no enrichment of GOs that are directly relevant to learning behavior in modules unique to RFP− neurons (Supplementary Figure 6). Similarly, no enrichment of genes directly relevant to learning behavior was found in the gene list specific to RFP− neurons (Supplementary Table 6, 7). Together, these results indicate that the acute responses of a subset of progenitor cells at the prenatal stage provide long-lasting impacts on the molecular properties of their neuronal progeny in the mature cortex, and may therefore contribute to the learning disability phenotype observed in PAE mice.
Figure 3. Genes linked to learning are enriched in the modules of co-expression in reporter+ neurons.
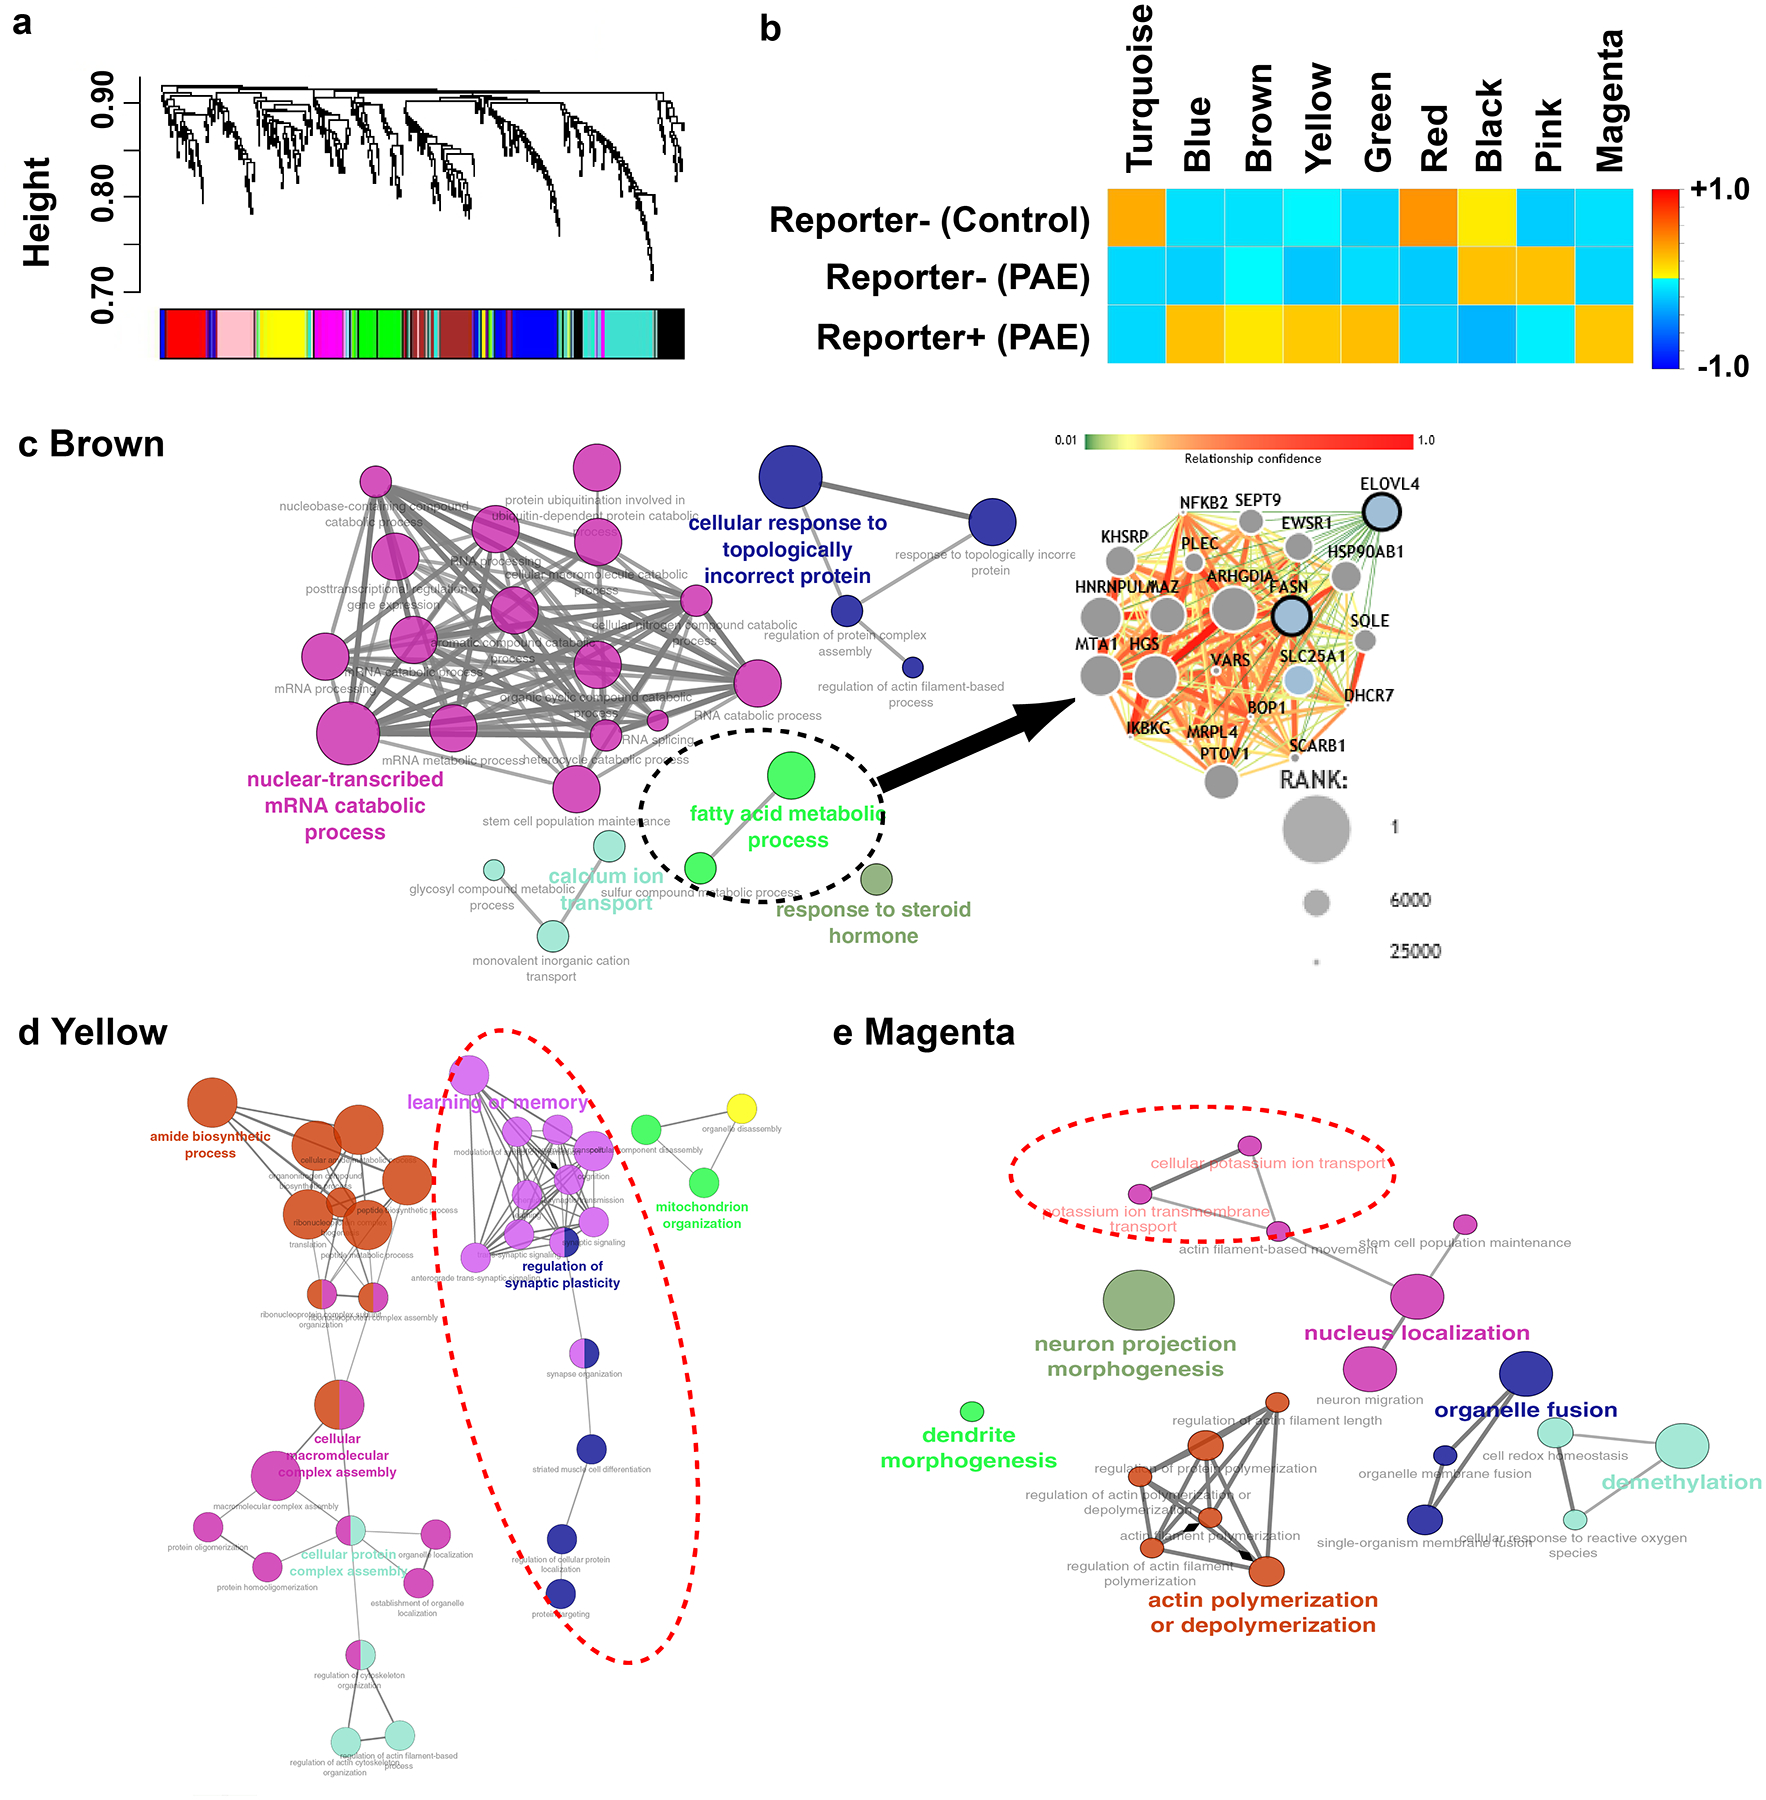
(a, b) WGCNA analysis of the single cell RNA-sequencing dataset. Clustering dendrogram of genes with assigned module colors (a), from which 9 gene modules of highly correlated genes are identified including 5 modules unique to reporter+ neurons in PAE mice (Blue, Brown, Yellow, Green and Magenta modules) (b). (c-e) GO networks enriched in Brown (c), Yellow (d) and Magenta (e) modules. The broken-line ellipse in the Brown module indicates the fatty acid metabolic process that includes top-ranked genes involved in intellectual disability and autism (genes at higher ranking are indicated as larger nodes). Yellow (d) and Magenta (e) modules include GOs related to learning and ion transport, respectively (broken-line ellipses).
Increased expression of Kcnn2 in layer II/III neurons in M1 is correlated with motor skill learning deficits in PAE mice
Among the genes upregulated in RFP+ cells in PAE mice was the potassium intermediate/small calcium-activated channel, subfamily N, member 2 (Kcnn2), which encodes the Kcnn2/SK2 subunit of small-conductance calcium-activated potassium channels. Kcnn2 was ranked 7th by ROKU among the genes specific to RFP+ neurons (Supplementary Table 2), and was the only gene that encodes a channel or receptor among the 37 genes that were also found in the 5 modules unique to RFP+ neurons identified by WGCNA (Fig. 3, Supplementary Table 5). The SK2 channel is known to influence learning and memory36. We, therefore, compared the expression patterns of Kcnn2 protein between the brains of control and PAE mice by immunohistochemistry. The labeling revealed that the number of cells with robust Kcnn2 expression was significantly increased in layers II/III of M1 in PAE mice at both one month (Fig. 4a, b) and 3 months old (Supplementary Figure 7), particularly in neuronal soma and dendrites (Supplementary Figure 8). Although a similar increase was observed in layer V of M1, other major brain regions involved in motor coordination and learning, such as the dorsal striatum, hippocampus, and cerebellum, showed no significant changes in Kcnn2 expression (Extended Data 6). The increase in Kcnn2 expression in M1 was prominent within RFP+ neuronal populations in PAE mice (Fig. 4c, d). Furthermore, we did not see any such increase attributed to RFP expression alone (under a ubiquitous CAG promotor, without PAE) (Supplementary Figure 9), confirming that increased Kcnn2 expression is not an artifact of exogenous RFP expression. PAE did not increase Kcnn2 expression in the cortex of Hsf1 knockout mice (Fig. 4a, b), while overexpression of a constitutively active form of Hsf1 alone (without PAE) increased Kcnn2 expression (Supplementary Figure 10), suggesting an important role of Hsf1-mediated heat shock signaling in PAE-induced Kcnn2 expression. Strikingly, we also found that the number of Kcnn2-expressing cells in layer II/III of M1 negatively correlates with the learning ability of individual PAE animals in the accelerated rotarod test (Fig. 4e), which by itself did not alter Kcnn2 expression (Fig. 4f). These results suggest that the increase in Kcnn2 expression in layer II/III neurons in M1 may underlie learning impairments in PAE mice.
Figure 4. Increase of Kcnn2-expressing neurons in M1 in PAE mice.
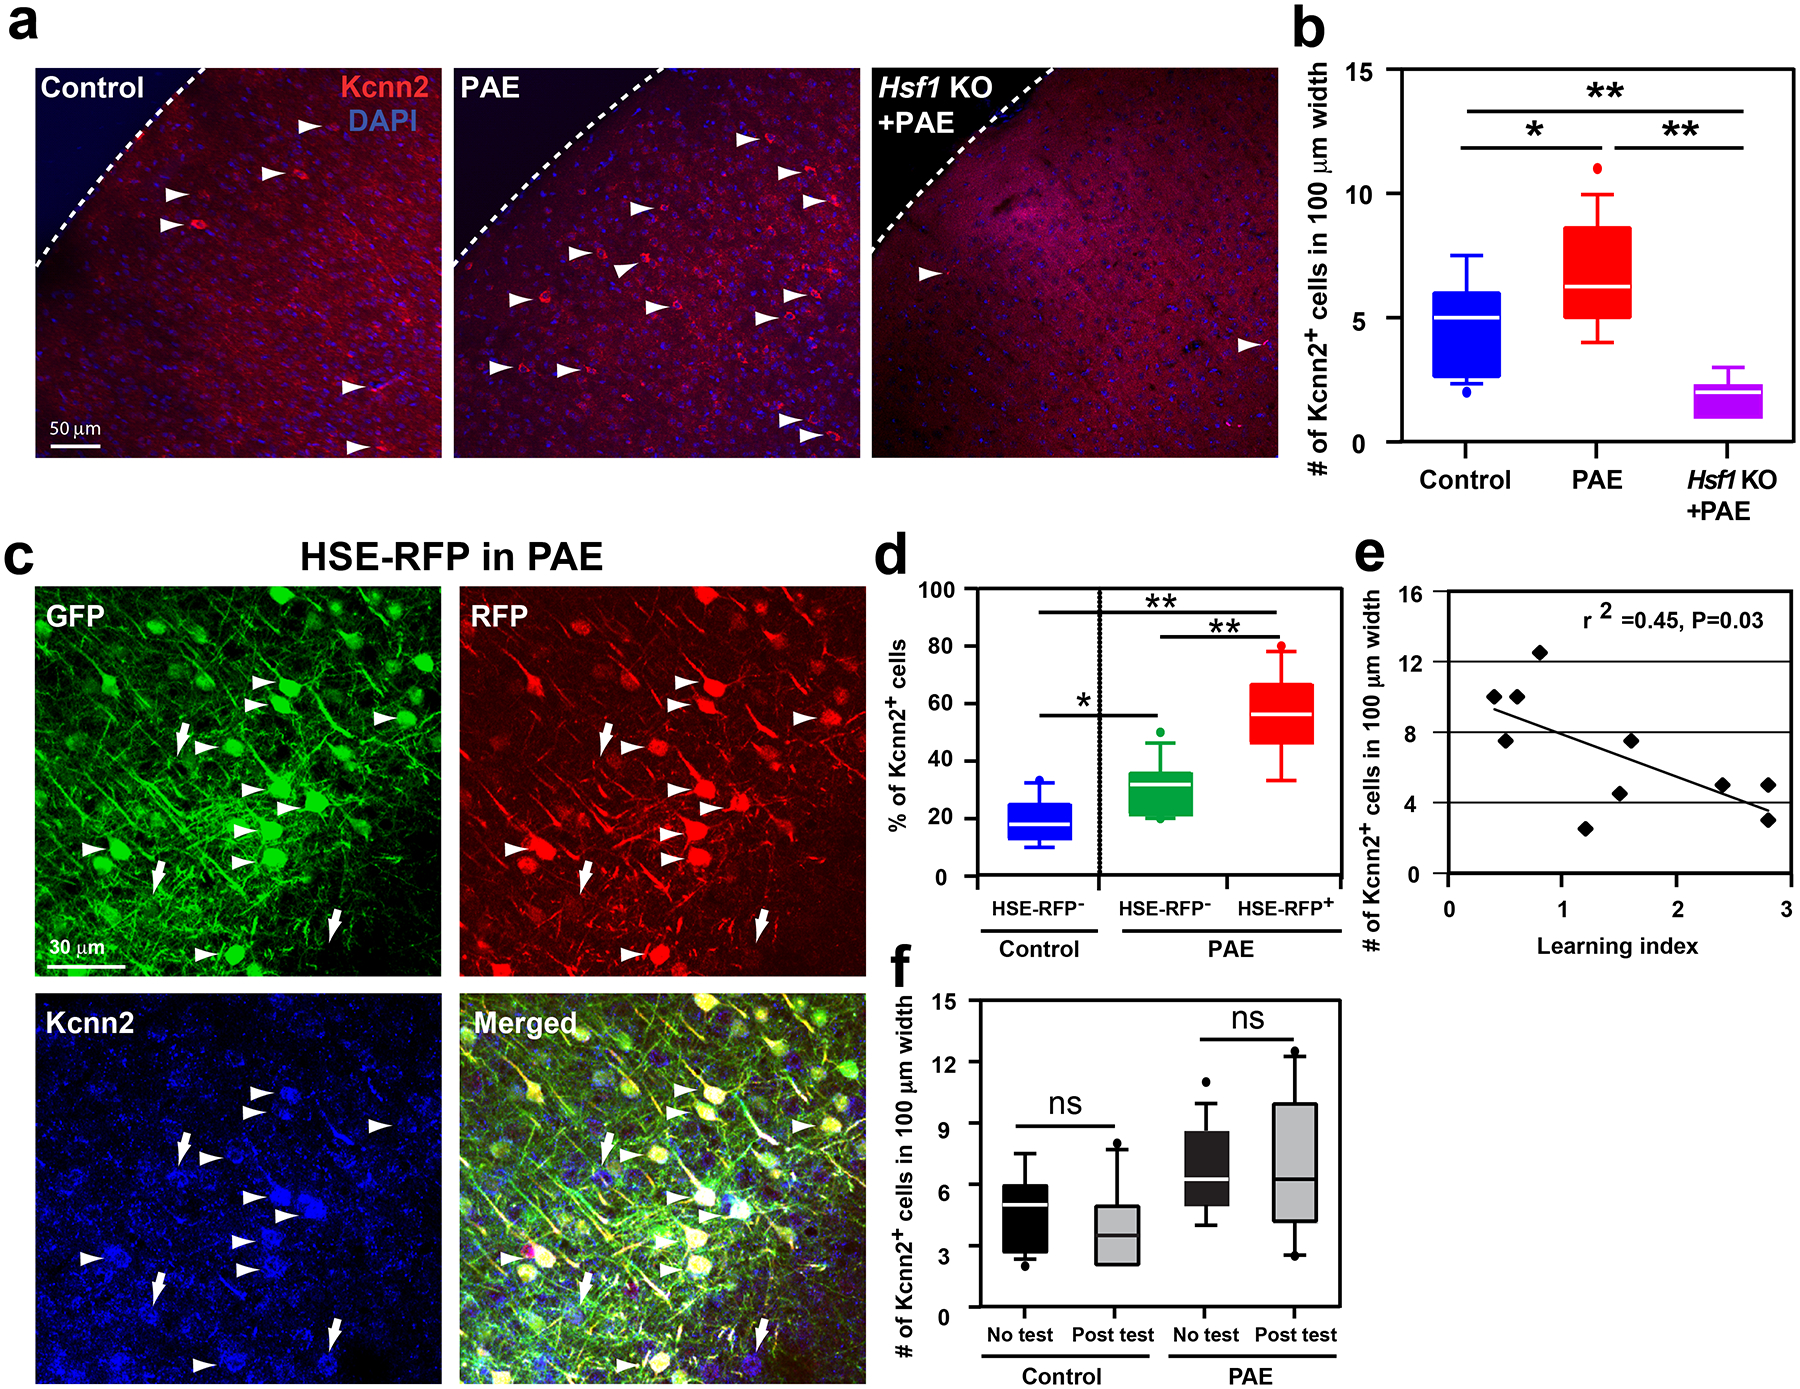
(a, b) Kcnn2 immunohistochemistry at P30 (a) and quantification of labeled neurons in layer III in M1 (b). The number of Kcnn2+ cells (arrowheads in a) is increased in PAE mice compared to that in control (PBS-exposed) mice. The increase of Kcnn2+ cells by PAE is not observed in Hsf1 KO mice; F(2,39) = 23.51, P < 0.0001 by one-way ANOVA, *P < 0.05, **P < 0.01 by Tukey test (control: n = 5 animals, PAE: n = 5 animals, Hsf1 KO+PAE: n = 4 animals). (c) Among GFP+ (green) electroporated neurons, Kcnn2 expression (blue) is enriched in HSE-RFP reporter+ (red) neurons in PAE mice (arrowheads) (arrows indicate Kcnn2+ cells that are also found among non-electroporated cells). Images are representatives of similar results obtained from n = 4 animals. (d) The percentage of neurons positive for Kcnn2 among HSE-RFP reporter+ neurons (in PAE mice) is significantly higher than that of reporter− neurons (in PAE or Control mice) among all GFP+ electroporated layer III neurons in M1; F(2,34) = 38.40, P<0.0001 by one-way ANOVA, *P < 0.05, **P < 0.01 by Tukey test (control: n = 4 animals, PAE: n = 4 animals). (e) Pearson’s correlation analysis demonstrates a negative correlation between learning index (accelerated rotarod test) and the number of Kcnn2+ cells in layer III in M1. Pearson’s correlation of determination r2 = 0.45, P = 0.03 (n = 10 animals per group). (f) Kcnn2 expression is not altered by motor learning itself. P = 0.35 and 0.98 by two-tailed Student’s t-test for control group and PAE group, respectively (no test: n = 16 animals, post test: n=10 animals per group). In box plots (b, d, f), the line within the box indicates the median, and the upper and lower edges of the box represent the 25th and 75th percentiles, respectively. The upper and lower whisker boundaries indicate the 10th and 90th percentiles, respectively, and dots indicate outliers.
Kcnn2 blocker mitigates physiological abnormalities in reporter-positive neurons in PAE mice
To address the physiological basis for learning impairments in PAE mice, and assess the contribution of increased Kcnn2 to it, we next examined the electrophysiological properties of RFP+ (in PAE mice) and RFP− (in control and PAE mice) layer III neurons within M1 in P30 cortical slices. Given the involvement of SK2 channels in the regulation of medium afterhyperpolarizations (mAHP)37, AHPs were measured in current-clamp following a single action potential as previously reported38. RFP− neurons in control (PBS-exposed) mice showed mAHP with a peak amplitude of 5.32 ± 0.50 mV from the membrane holding potential (VHold) of −60.0 ± 0.50 mV (Fig. 5a). RFP− neurons in PAE mice showed similar peak amplitude (Fig. 5b). In contrast, RFP+ neurons in PAE mice exhibited significantly increased mAHP peak amplitude (7.85 ± 0.71 mV) (Fig. 5c). Consistent with single cell RNA profiling, variability in these electrophysiological parameters was also higher in RFP+ neurons (Fig. 5c). Treating slices with Tamapin (100 nM), a selective and potent Kcnn2 channel blocker isolated from Indian red scorpion venom37, did not affect the peak amplitude of mAHPs in RFP− neurons in both control and PAE mice (Fig. 5a, b). On the other hand, Tamapin treatment was able to mitigate the increased peak amplitude of mAHPs in RFP+ neurons in PAE mice and returned their levels to those comparable to RFP− neurons in control or PAE mice (Fig. 5c).
Figure 5. Electrophysiological abnormalities in reporter+ neurons in PAE mice and their improvement by a Kcnn2 blocker.
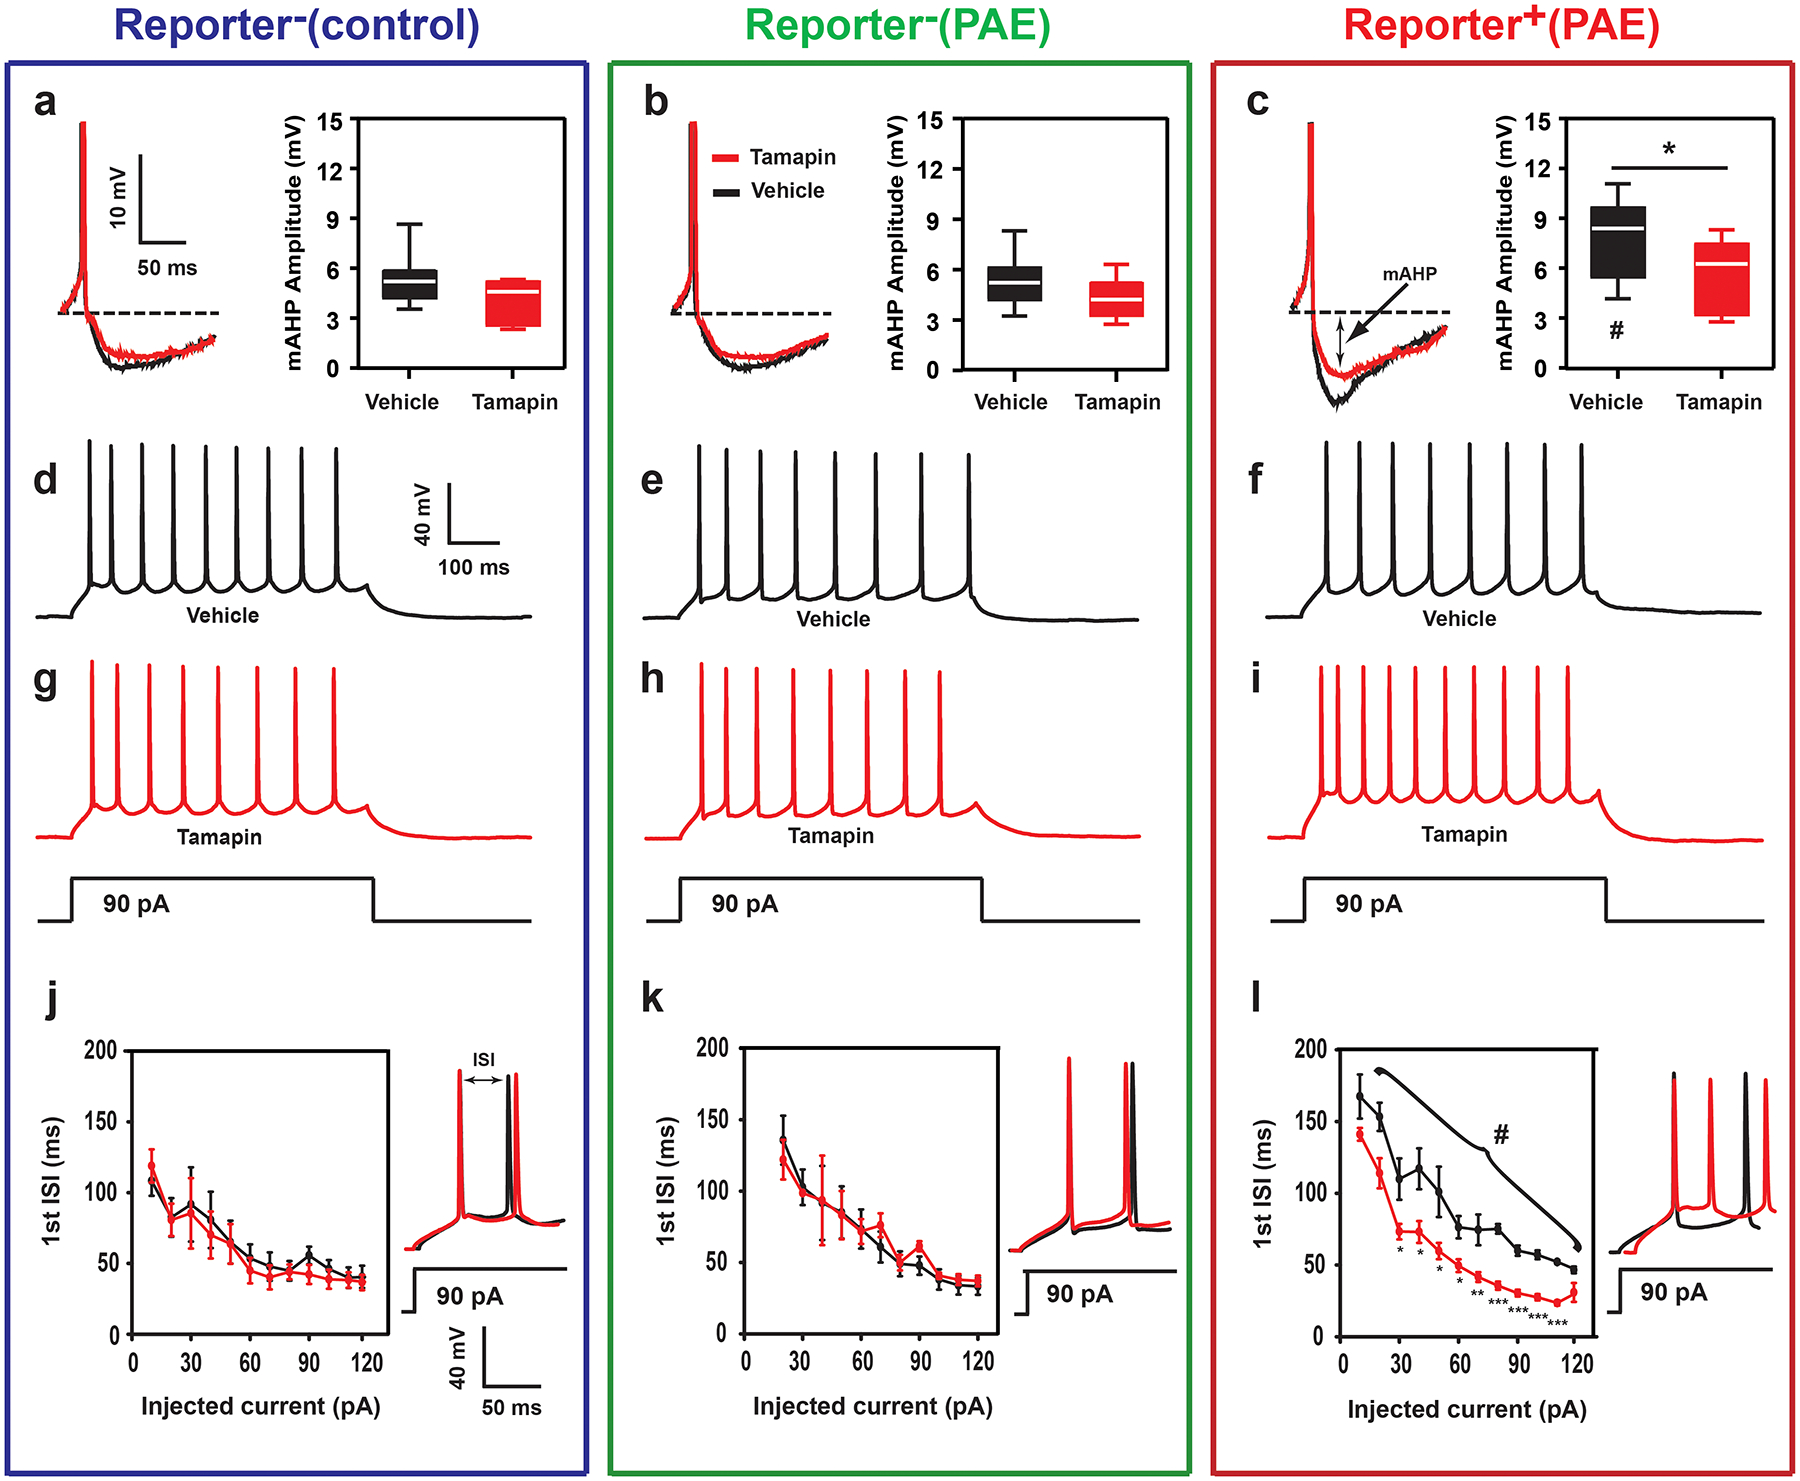
(a-c) The peak amplitude of medium afterhyperpolarization (mAHP) in reporter+ and reporter− neurons in slices from control and PAE mice (conditions indicated at the top). In aCSF alone (graphs in black), the amplitude of the mAHP in reporter+ neurons in PAE mice (c) is higher than that of reporter− neurons in control (a) or PAE (b) mice; F(2,26) = 6.35, P = 0.005 by one-way ANOVA, #P < 0.05 between reporter+ (PAE) and reporter− (control or PAE) neurons by Tukey test (n = 11 cells per group). After Tamapin treatment (graphs in red), the increased mAHP amplitude in reporter+ neurons in PAE mice is mitigated (c); *P = 0.03 by two-tailed Student’s t-test (n = 11 cells per group). In box plots, the line within the box indicates the median, and the upper and lower edges of the box represent the 25th and 75th percentiles, respectively. The upper and lower whisker boundaries indicate the 10th and 90th percentiles, respectively, and dots indicate outliers. (d-l) Typical neuron firing responses to current injection (600 ms, 90 pA, d-i), and the quantification of the first interspike interval (ISI) (j-l, the first two spikes in d-i are shown next the graphs) in reporter+ and reporter− neurons in slices from control and PAE mice. In aCSF alone (traces and graphs in black), reporter+ neurons (PAE) exhibit an increase in the 1st ISI (f, l, in black) as compared to reporter- neurons (control or PAE, d, e, j, k); F(1,10) = 72.88, P < 0.00005 by one-way repeated measures ANOVA, #P < 0.0001 by Tukey test. Tamapin treatment (traces and graphs in red) does not affect the firing pattern of action potentials in reporter− neurons in control or PAE mice (g, h, j, k), but reverses the increased 1st ISI in reporter+ neurons (PAE) (i, l); F(1,11) = 46.27, P < 0.00005 by one-way repeated measures ANOVA, *P < 0.05, **P < 0.005, ***P < 0.0005 by one-tailed paired t-test (aCSF vs Tamapin) (n = 11 cells per group).
As mAHP is a conductance that limits repetitive firing39, we also examined the intrinsic membrane properties of neurons. Action potential discharges were evoked through current pulse injections under current-clamp mode. It was found that increased mAHP amplitude, observed in RFP+ neurons from PAE mice, was associated with an increase in the initial inter-spike interval (ISI) when compared to RFP− neurons from both control and PAE mice (Fig. 5d–f, j–l). The loss of initial burst firing in RFP+ neurons was reversed by bath application of Tamapin (Fig. 5i, l). The initial ISI in RFP− neurons in control and PAE mice was not affected by Tamapin (Fig. 5g, h, j, k). Additionally, the current-voltage (I-V) relationship showed no differences in the mean input resistance between treatment groups (Supplementary Figure 11), indicating that the observed changes in action potential firing were not due to a shift in membrane input resistance.
Together, these results indicate that increased Kcnn2 expression contributes to larger mAHP amplitude and altered firing pattern in RFP+ neurons in PAE mice, and that these physiological abnormalities can be mitigated by a Kcnn2 blocker.
Kcnn2 blocker improves impaired motor skill learning in PAE mice
To test whether blocking Kcnn2 also mitigates motor skill learning deficits in PAE mice, we first examined the ability of Tamapin to cross the Blood Brain Barrier (BBB) to allow its systemic administration to target neurons in the cerebral cortex. Biotinylated Tamapin was administered by i.p. at 15.0 μg/kg body weight at P30. 30 minutes post injection, we detected biotinylated Tamapin in a subset of layer II/III neurons in M1 (Supplementary Figure 12, Extended Data 7), as well as in cells in other brain regions (Extended Data 8) using the streptavidin-biotin detection method. The number of labeled neurons in layer II/III in M1 was higher in PAE mice (Supplementary Figure 12), in which Kcnn2+ neurons are increased. In accordance with previous findings from competition binding assays37, the binding of biotinylated Tamapin was specific to Kcnn2+ cells without obvious binding to Kcnn1+ or Kcnn3+ cells (Extended Data 7, 8). These results show that Tamapin crosses the BBB and effectively binds to Kcnn2 in the cortex.
To test the effect of Tamapin on learning deficits in PAE mice, Tamapin was administered i.p. at 15.0 μg /kg body weight to control and PAE mice at specific time points in the accelerated rotarod (Fig. 6a–d) and single pellet reaching task tests (Fig. 6e, f). We found that learning deficits observed in both tasks in PAE mice were significantly mitigated by Tamapin administration (Fig. 6a–c, e, f). Tamapin did not affect locomotor activity or anxiety-like behavior assessed by the open field test (Extended Data 9). In the single pellet reaching task test, body weight was not affected by Tamapin (Fig. 6g).
Figure 6. Kcnn2 blocker improves deficits in motor skill learning in PAE mice.
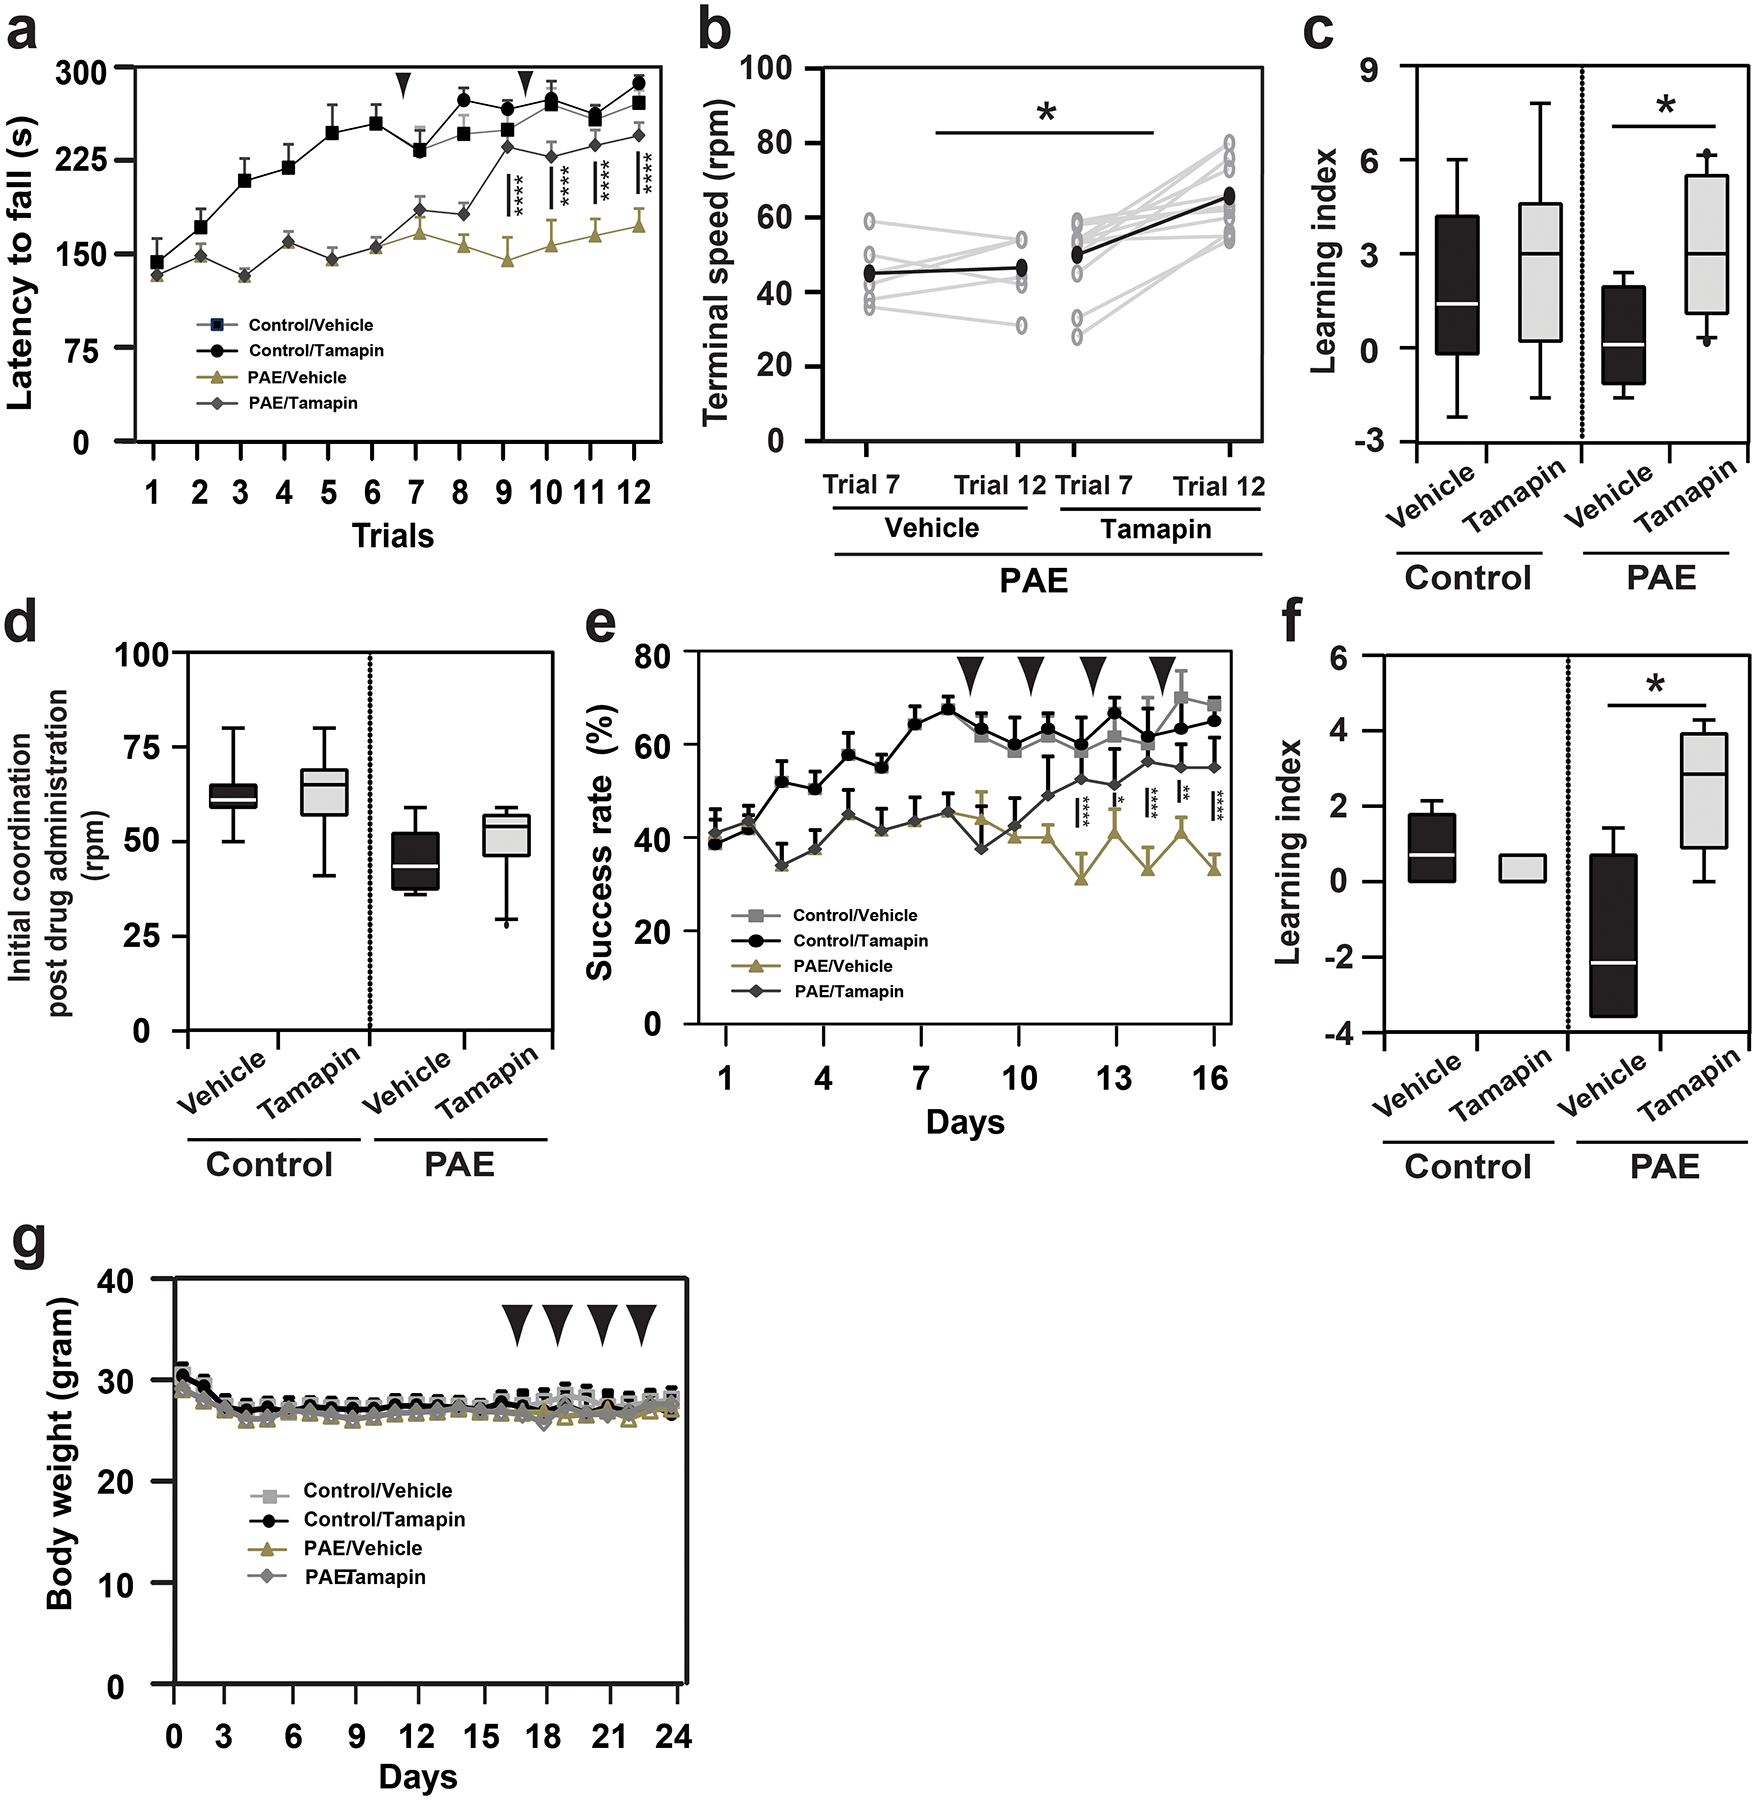
(a) Effect of Tamapin (arrowheads: twice, before trials 7 and 10) after 6 trials on the accelerated rotarod test, by which PAE mice show gross motor skill learning deficits. A significant interaction between the effects of treatment (Tamapin or Vehicle) and trial was observed in PAE mice; F(5,15) = 2.35, P = 0.049 by two-way repeated measures ANOVA. Tamapin-treated PAE mice show significantly longer latency to fall from the 9th trial; ****P < 0.001 by simple main effect test (vehicle: n = 6 animals, Tamapin: n = 11 animals). No significant effects of Tamapin were observed in control mice; F(1,12) = 2.15, P = 0.17 by two-way repeated measures ANOVA (vehicle: n = 7 animals, Tamapin: n = 7 animals). Graph shows mean ± SEM. (b) The increase in terminal speed between trials 7 and 12 was compared between vehicle- and Tamapin-treated PAE mice. Gray and black lines show the data for individual mice and the means. The increase was significantly larger in Tamapin-treated PAE mice; *P = 0.02 by two-tailed Student’s t-test (vehicle: n = 6 animals, Tamapin: n = 12 animals). (c) Tamapin improves learning in trials 7–12 in PAE, but not in control mice; *P = 0.02 (vehicle: n = 6 animals, Tamapin: n = 12 animals) and P = 0.60 (vehicle: n = 7 animals, Tamapin: n = 7 animals), respectively by two-tailed Student’s t-test. (d) Motor coordination is not affected at trial 7 by the first administration of Tamapin; control mice: P = 0.30 by two-tailed Student’s t-test (vehicle: n = 7 animals, Tamapin: n = 7 animals), PAE mice: P = 0.69 (vehicle: n = 6 animals, Tamapin: n = 12 animals). (e) In different sets of mice, Tamapin was administered (arrowheads: 4 times, before trials 9, 11, 13 and 15) after 8 trials in the single pellet reaching test, in which PAE mice show fine motor skill learning deficits. A significant interaction between the effects of treatment (Tamapin or Vehicle) and trial was observed in PAE mice; F(7,12) = 4.11, P = 0.0006 by two-way repeated measures ANOVA. Tamapin-treated PAE mice show significantly higher success rate from the 12th trial; *P < 0.05, **P < 0.01, ****P < 0.001 by simple main effect test (vehicle: n = 7, Tamapin: n = 7). No significant effects of Tamapin were observed in control mice; F(1,8) = 0.08, P = 0.78 by two-way repeated measures ANOVA (vehicle: n = 5 animals, Tamapin: n = 5 animals). Graph shows mean ± SEM. (f) Learning index in trials 9–16 is improved by Tamapin in PAE mice; *P = 0.011 by two-tailed Student’s t-test (vehicle: n = 7 animals, Tamapin: n = 7 animals), but not in control mice; P = 0.44 by two-tailed Mann-Whitney U test (vehicle: n = 5 animals, Tamapin: n = 5 animals). (g) Tamapin does not affect body weight; control mice: F(1,9) = 0.13, P = 0.72 (vehicle: n = 5 animals, Tamapin: n = 5 animals), PAE mice: F(1,8) = 0.004, P = 0.95 (vehicle: n = 7 animals, Tamapin: n = 7 animals) by two-way repeated measures ANOVA, Graph shows mean ± SEM. In box plots (c, d, f), the line within the box indicates the median, and the upper and lower edges of the box represent the 25th and 75th percentiles, respectively. The upper and lower whisker boundaries indicate the 10th and 90th percentiles, respectively, and dots indicate outliers.
To further test the specific contribution of Kcnn2 inhibition in M1 on learning improvement in PAE mice, we took an RNA interference (RNAi) approach (Extended Data 10a); Tamoxifen-inducible Kcnn2 short hairpin RNA (shRNA) or control shRNA construct was transferred into layer II/III excitatory neurons in M1 (Extended Data 10b, c) by targeted in utero electroporation at E1526,27 before PAE (or control PBS exposure) at E16 and 17. After birth, the mice that showed a preference in using their forelimb contralateral to the electroporated hemisphere (assessed at P30) were administered with tamoxifen, and placed to the single pellet reaching test subsequently (Extended Data 10a). Reduced expression of Kcnn2 in Kcnn2 shRNA-introduced mice was confirmed by immunohistochemistry 8 days after the last tamoxifen injection (Extended Data 10c, d). The results of the single pellet reaching test demonstrated that Kcnn2 knockdown in layer II/III excitatory neurons in M1 was sufficient to improve learning deficits in PAE mice (Extended Data 10e, f).
Together, these results indicate the potential of Kcnn2 blockers as a treatment for learning disability in patients with FASD.
Discussion
In this study, we found that prenatal exposure to alcohol causes postnatal deficits in gross and fine motor skill learning. By tracing the neuronal lineages from progenitor cells that exhibited an acute HS response to prenatal alcohol exposure using a new reporter system, and by combining this with single-cell RNA-sequencing analysis, we found that long-term molecular changes represented by an increase in Kcnn2 expression contributes to abnormal neuronal physiology and deficits in motor skill learning. We also found a Kcnn2 blocker to be effective in mitigating these functional deficits in PAE mice, demonstrating the potential of this approach as an intervention for learning deficits in FASD. This is in line with previous studies showing the therapeutic potential of Kcnn2 blockers to facilitate learning and memory in mice and rats of several disease models in which Kcnn2 expression is increased40–43. Since other sources of prenatal environmental stress such as heavy metals and hypoxia also cause stochastic activation of HS signaling7,10,12, neuropsychiatric conditions induced by these stressors2 also have the potential to be treated by Kcnn2 blockers.
Our single-cell approach, combined with the HS reporter system, allowed us to identify the gene expression changes caused by PAE in a subset of affected neurons in the mature brain that were otherwise undetectable by conventional bulk RNA sequencing. One of these changes, upregulation of Kcnn2, was found in sparsely distributing reporter+ neurons in layer III in M1 of PAE mice. These neurons exhibited altered physiological properties, and the number of Kcnn2+ neurons was correlated with learning deficits in these mice. Our previous study has shown that the activation of HS signaling in progenitor cells by PAE is a stochastic process, independent of specific phases in the cell cycle10. These results, therefore, support a model that heterogeneous levels of stress responses in progenitor cells upon prenatal exposure to alcohol (or other environmental insults)10 results in the generation of variable degrees of learning deficits (Supplementary Figure 13) in mice and probably in humans. In addition to directly affecting the physiological properties in individual neurons, higher Kcnn2 expression, even in a small number of neurons, may compromise cortical functional networks to alter behaviors as previously suggested44. Of note, our strategy of focusing on a specific stress response pathway (HS pathway) can be expanded to other pathways such as the ER stress response pathway and unfolded protein response (UPR) pathway. Given the availability of reporter transgenic mouse lines specific to these pathways45,46, investigating cellular defects associated with the activation of distinct stress responses would be of great interest.
It should be noted that Kcnn2 upregulation in PAE mice was not limited to upper cortical layers in M1(Extended Data 6). Therefore, although we found Kcnn2 knockdown in upper layer neurons in M1 to mitigate the learning deficits in PAE animals (Extended Data 10), it remains to be determined whether Kcnn2 knockdown in other cell populations can also be used as a therapeutic strategy for the treatment of PAE-induced learning deficits. The increase of Kcnn2 in cortical neurons in PAE mice was observed in the soma and dendrites. However, our immunohistochemical approach could not provide clear evidence for increased Kcnn2 at pre- or post-synaptic sites. Similarly, our whole-cell patch-clamp experiments cannot discern whether the functional impacts of increased Kcnn2 by PAE, or the mitigating effects of a Kcnn2 blocker, are mediated pre- and/or post-synaptically. With these limitations, we at least assume that the effect of a Kcnn2 blocker on mAHP size in PAE is not produced by a pre-synaptic mechanism, as this component of action potentials is generally thought to be mediated by intrinsic potassium channel activity47. As two isoforms of Kcnn2 are expressed differentially in specific subcellular domains in the neuron48, the relative contributions of each isoform, at specific subcellular compartments, need to be defined as they relate to motor learning deficits. Although we found that a Kcnn2 blocker improves motor skill learning in PAE mice (Fig. 6), the improvement in motor skill appeared to diminish in two weeks after the drug administration (data not shown). Formal tests would be required to determine how long the benefits of Kcnn2 blockers continue.
Postnatal functional deficits by PAE imply that alcohol exposure and HS activation may cause chromatin modifications in neural progenitor cells that are retained until a later period, when transcriptional changes occur in mature neurons. The increased Kcnn2 expression that we observed in PAE mice at P30 (Fig. 4) was not found at P10 (data not shown), suggesting the similar possibility of an epigenetic mechanism that enables Kcnn2 overexpression only after a certain postnatal age. This also suggests that prophylactic use of Kcnn2 blockers during embryonic or earlier postnatal stages may not provide benefit for PAE-induced learning impairments. Elucidating the epigenetic mechanisms49 that underlie negative impacts of PAE may open avenues toward the discovery of novel and effective preventative options for FASD as well as other neuropsychiatric conditions with similar disabilities.
Besides Kcnn2, we identified several other genes that are functionally relevant to learning, and may represent potential therapeutic targets among the genes that showed altered expression in RFP+ neurons in PAE mice (e.g., genes involved in fatty acid synthesis that are known peripheral biomarkers for prenatal alcohol exposure50). Future studies might investigate the role of Kcnn2, and other molecules, in the pathogenesis and/or pathophysiology of human FASD, and ultimately lead to the discovery of effective interventions for cognitive and behavioral disabilities in FASD.
Methods
Animals
CD-1 mice were purchased from Charles River laboratories and maintained on a light–dark cycle (lights on 06:00–18:00 h) at a constant temperature (22 ± 1°C). The production and genotyping of Hsf1 knockout mice were described previously7. All protocols were approved by the Institutional Animal Care and Use Committee (IACUC) of the Children’s National Medical Center. All methods were performed in accordance with the relevant guidelines and regulations.
In utero electroporation and prenatal exposure to ethanol
In utero electroporation was carried out as described previously51,52. To transfer the reporter system, the pHSE-FLPo plasmid encoding FLPo (codon optimized Flippase)53 under the control of HS response element was electroporated with the pFRT-RFP8 (reporter) and the pCAGIG54 (labeling all electroporated cells) constructs (2 μg/μl each) at E15 into primary motor cortex (M1) by directional in utero electroporation26,27. Following electroporation, pregnant mice received intraperitoneal (i.p.) injections of 25% EtOH in PBS at 4.0 or 1.0 g/kg weight daily at E16 and E17. PBS alone was used as the control. This alcohol regimen is similar to that used in our previous studies and induces no gross abnormalities in brain structure7,8.
For Kcnn2 knockdown, we used the shRNA design (targeting the Kcnn2 coding sequence) validated in a previous study55. The following sequence was synthesized and inserted at the 3’ of FRT-stop-FRT in the pCAG plasmid; 5’-ctggaggcttgctgaaggctgtatgctGTTTGGTAAGTTCTAGCTTTGTTTTGGCCACTGACTGACAAAGCTAGCTTACCAAAcaggacacaaggcctgttactagcactcacatggaacaaat-3’ (upper case: sense and antisense sequences against the target separated by a loop sequence, lower case: flanking regions). The control non-targeting shRNA was purchased (SuperArray Bioscience Corporation, MD). The shRNA plasmid (4 μg/μl) was transferred by electroporation with the pCAG-CreERT2 plasmid (2 μg/μl) at E15, followed by EtOH or PBS (control) injection as described above.
For the expression of a constitutively active form of HSF1 (caHSF1), pCAG-caHSF110 (or pCAG as the control) plasmid (2 μg/μl) was transferred by electroporation with the pCAGIG plasmid (2 μg/μl) at E15. In this experiment, pregnant mice did not receive EtOH or PBS injections. For testing the potential effect of RFP alone on Kcnn2 expression, the pCAG-FLPo and pFRT-RFP plasmids were transferred by electroporation at E15 in control (PBS-exposed) mice.
Pups with EGFP or/and RFP expression in M1 were screened at postnatal day (P) 1 using an epifluorescence stereomicroscope (Zeiss, Germany). These mice were used for further experiments.
Single cell sampling
Intracellular contents were obtained from live single neurons in M1 of the mouse cortex at P30 as previously described29, with the following modifications. Prior to submerging the tip of a microcapillary mounted on a micromanipulator (MP-285; Sutter Instrument, CA) into the artificial cerebral spinal fluid (aCSF), positive pressure was applied. After the microcapillary approached the target neuron, a gigaohm seal was obtained and weak negative pressure was applied to rupture the cell membrane. Negative pressure was held constant during the collection. The aspiration was confirmed by checking the reduction of the somal volume of the target neuron in optical sectioning with phase contrast. The collected single-cell contents were expelled into a thin-walled RNA-free PCR tube (Eppendorf, NY), with 1% (final) IGEPAL CA-630 (Sigma-Aldrich, MO), and immediately frozen on dry ice for storage at −80°C until further processing.
Single cell RNA-sequencing
The cDNA libraries were prepared using the SMARTer Ultra Low Input RNA Kit for Sequencing - v3 (TAKARA Bio, CA) and Nextera XT DNA Library Prep Kit (Illumina, CA) as per the manufacturer’s instructions. The unique barcode sequences were incorporated in the adaptors for multiplexed high-throughput sequencing. The final product was assessed for its size distribution and concentration using BioAnalyzer High Sensitivity DNA Kit (Agilent, CA) and Kapa Library Quantification Kit (Kapa Biosystems, MA). The libraries were pooled and diluted to 2 nM in EB buffer (Qiagen, MD) and then denatured using the Illumina protocol. The denatured libraries were diluted to 10 pM by pre-chilled hybridization buffer and loaded onto TruSeq SR v3 flow cells on an Illumina HiSeq 2500 (Illumina) and run for 50 cycles using a single-read recipe (TruSeq SBS Kit v3, Illumina) according to the manufacturer’s instructions. Illumina CASAVA pipeline (released version 1.8, Illumina) was used to obtain de-multiplexed sequencing reads (fastq files) passed the default purify filter. Additional quality filtering used FASTX-Toolkit (http://hannonlab.cshl.edu/fastx_toolkit) to keep only reads that have at least 80% of bases with a quality score of 20 or more (conducted by fastq_quality_filter function) and reads left with > 10 bases after being trimmed with reads with a quality score of < 20 (conducted by fastq_quality_trimmer function).
RNA-sequencing data analysis
A bowtie2 index was built for the GRCm38 genome assembly using bowtie56 version 2.2.3. The RNA-seq reads of each of the 8 samples were mapped using Tophat57 version 2.0.9 supplied by Ensembl annotation file; GRCm38.78.gtf. Each sample’s transcripts were assembled and their expression quantified using Cufflinks version 2.2.158 supplied by GRCm38.78.gtf. Normalization was performed via the median of the geometric means of fragment counts across all libraries, as described in Anders and Huber59.
The density plots of FPKM (Fragments Per Kilobase of transcript per Million mapped reads) values were generated by ggplot2 version 1.0.1 R package. RnaSeqMetrics function under Picard tools (v.1.102; http://picard.sourceforge.net) was used to compute the 5′–3′ coverage bias along gene body as well as the number of bases assigned to various classes of RNA.
The limma version 3.20.9 R package was used to perform quantile normalization of the log2 of the FPKM values of the reliably expressed protein coding genes, where reliably expressed protein coding genes were defined as two or more samples having FPKM ≥ 1 and protein coding genes were extracted by using the Ensembl mm10 (GRCm38.p3) gene annotations. A Principal Component Analysis (PCA) plot and hierarchical clustering (with parameters “average” for clustering method and correlation for distance) was generated using Partek.
ROKU31, which is available in TCC version 1.21.1 R package, was used to rank group-specific gene expressions. The blockwiseModules function of the WGCNA60,61 version 1.42 R package was used for gene co-expression network construction and module detection of the quantile normalized log2 FPKM values. The topological overlap option was set to “signed”, the power adjacency function was set to 6 and the minModuleSize tree cut option was set to 10. A heatmap of the modules vs the samples was generated using “average” as the clustering method and 1-correlation as the distance. Trajectories for each module eigengene were generated from second degree polynomial curve fitting using the nls, coef and curve R functions. Biological network of each eigengene module was depicted using Cytoscape ClueGO App62.
Electrophysiology
Using a vibrating blade microtome (VT 1000S; Leica, IL), coronal brain slices at the level of primary motor cortex were prepared from P30 mice as described previously63,64. The recording chamber was perfused with oxygenated (95% O2/5% CO2) aCSF containing (in mM) 10 glucose, 5 KCl, 2 CaCl2, 2 MgSO4, 124 NaCl, 26 NaHCO3, 1.25 NaH2PO4 (pH 7.3) at 3 ml/min at room temperature. The electrode was filled with internal solution that contains (in mM) 130 K-gluconate, 10 KCl, 10 HEPES, 10 EGTA, 2 MgCl2, 2 Na2-ATP and 0.3 Na-GTP (pH 7.3; electrode resistance: 4–6 MΩ). Fluorescently labeled neurons were recorded in the whole-cell current-clamp mode. Cells were held, by constant current injection, at an average membrane potential of −60±0.50 mV using a patch-clamp amplifier (700B; Molecular Devices, CA). Series resistance was compensated. The output of the amplifier was digitized using an A/D converter board with a sampling rate of 10 kHz, and recorded (Digidata 1322; Molecular Devices). Action potential discharges were evoked through current pulse injections (−100pA to 100pA, 600ms, 20pA steps) under current-clamp mode37. Current-voltage (I-V) relationship was determined by measuring steady state membrane voltage during current pulse injections (−50pA to 30pA, 600ms, 10pA steps) under current-clamp mode. Medium afterhyperpolarization (mAHP), peak amplitude, and inter-spike interval of action potentials with/without 100 nM Tamapin (10 min) (Smartox Biotechnology, France) application were analyzed offline with Clampfit 10.2 software (pCLAMP10; Molecular Devices, CA).
Immunohistochemistry
Mice were deeply anesthetized with isoflurane (Henry Schein, OH) and perfused through the ascending aorta with 10 ml ice-cold PBS followed by 10 ml chilled 4% paraformaldehyde (PFA). The brains were removed and post-fixed in the same fixative (4% PFA) at 4°C overnight, followed by 10% and 30% sucrose in PBS for 24 hours. Coronal sections were prepared (60 μm thickness) on cryostat (CM3050S; Leica).
Free floating sections were subjected to target retrieval solution (Dako,CA) following the manufacturer’s instructions, and incubated for 60 minutes in hydrogen peroxide in methanol (1:4) solution at −20°C to inactivate endogenous peroxidase activity. After rinsing with PBS-T (PBS containing 0.2% Tween 20) three times, slices were incubated with 2% bovine serum albumin (BSA) for 30 minutes at room temperature (RT). Slices were then incubated with a primary antibody [goat anti-Kcnn2 (1:500) (Abacm, MA), chicken anti-GFP (1:700) (Abacm, MA), rabbit anti-Kcnn1 (1:500) (Sigma-Aldrich, MO), rabbit anti-Kcnn3 (1:500) (Sigma-Aldrich, MO) or rabbit anti-RFP (1:500) (Abacm, MA)] overnight at 4°C. Incubation with a secondary antibody [horseradish peroxidase (HRP)-conjugated anti-goat IgG (1:500), HRP-conjugated anti-rabbit IgG (1:500), Cy2-conjugated anti-chicken IgG (donkey) (1:200) or biotinylated anti-rabbit IgG (1:200) (Jackson immunoResearch, PA)] was for 3 hours at room temperature. ABC (Thermo Fisher Scientific, NY) and TSA kits (PerkinElmer, MA) were used for signal amplification. DAPI (4’,6-Diamidino-2-Phenylindole, Dihydrochloride) (1:10,000) (Sigma Aldrich, MO) was used to label the nuclei. Sections were imaged using an Olympus confocal microscope equipped with a digital camera. Brightness of the images was adjusted using Image J and Photoshop (Adobe Systems, CA).
Accelerated rotarod test
Motor learning behavior was assessed by the rotarod test25,65–68. On the day of testing, mice were kept in their home cages and acclimated to the testing room for at least 15 minutes, and a 2 minute acclimation session at 2 rpm was performed on the first day prior to the test phase. The rotarod testing involves placing the mice on a rotating bar and determining the length of time that they can retain their balance during acceleration of rotation (max 80 rpm, 0.266 rpm increase per minute, for 5 minutes). The testing phase consisted of 3 trials per day separated by at least 15 minutes each for 2 or 5 consecutive days. Each trial was terminated when the mouse fell off, made one complete rotation without walking on the rotating rod, or reached maximum speed after the 5 minute session. The latency to fall from the rotating rod was scored by automatic timers and falling sensors on the rotarod. Learning index was calculated by averaging the changes in terminal speed of an individual mouse between two consecutive trials.
Open field test
Locomotor activity and anxiety-like behavior of mice were examined by the open field test25,69. Briefly, mice were transported to the testing room and allowed to acclimate for 15 min before each test. The testing room was illuminated with overhead lighting at ~450 lux. For the testing session, each mouse was gently placed in a corner of an open field Plexiglas clear chamber (21 cm × 21 cm × 30 cm) and allowed to move freely for 40 minutes. The data were collected using the open field activity monitoring system (AccuScan Instruments, Inc. Columbus, OH), which uses photocell emitters and receptors forming an x-y grid of invisible infrared beams.
Single-pellet reaching test
The single-pellet reaching test was performed as previously described24,25,70,71. Mice were food-restricted until they reached 85–90% of their initial body weight. Weight was monitored daily throughout the experiment. Assessment of skilled forelimb use and motor learning were carried out using a custom-made clear Plexiglas chamber (8 cm × 20 cm × 20 cm) with 3 vertical slits (0.5 – 1 cm × 10 cm) made in the front wall. A stage (1 cm height) to present a food pellet was placed in front of the slits. Animals underwent the acclimatization phase in the chamber (for 2 days) before the training/shaping phase (for 3–5 days). Each training/shaping session was terminated once the mouse reached 20 attempts or spent 20 minutes in the chamber. Animals that showed greater than 70% preference for either hand were used for the tests [for the Kcnn2 knockdown experiment only, the mice that showed limb preference in the contralateral side of the (tamoxifen-inducible) shRNA-transferred hemisphere were used (limb preference test was performed before the tamoxifen injection)]. On the day of testing, mice were kept in their home cages and acclimatized to the testing room for at least 15 minutes. The testing phase consisted of one session (20 trials or 20 minutes, whichever occurs first) per day with their preferred limb over 8 consecutive days (8 trials in total). A digital video camera (Toshiba, Japan) was used to capture this activity, and videos were used for qualitative and quantitative assessment for each step of the single pellet reaching behavior (attempt, failure to grasp, drop during retrieval, and total success). Learning index was calculated by averaging the change in success rate of an individual mouse between two consecutive trials.
Forelimb grip strength test
The forelimb grip strength test was performed on mice using a Grip Strength Meter (San Diego Instruments, CA)25. Before testing, mice were trained on the grip strength measurement over three sessions. For the testing phase, mice were gently held by the tail and allowed to grasp a steel grip gauge with their forepaws, and then mice were gently pulled away from the grip gauge in a steady fashion until the grip was released. The forelimb grip strength was calculated as grip strength (g)/body weight (g), where grip strength was the average of measurements (6 consecutive measurements per day for 3 days).
Morphological analysis of dendrites and spines
Coronal sections of the cortical tissue were prepared as mentioned above in the method of immunohistochemistry. After rinsing with PBS-T (PBS containing 0.2% Tween 20) three times, sections were mounted on 25×75×1 mm glass slides using No. 1 microscope cover glass (Globe Scientific Inc, NJ). Reporter− (in control and PAE mice) and reporter+ (in PAE mice) neurons visualized with co-expressed GFP in layer III of M1 were imaged with a 100X objective lens under an Olympus confocal microscope. For the analysis of dendrites, the number of dendrites, number of branches, and length of dendrites were quantified for each neuron on both the apical and basal dendrites. For the analysis of spines, the number of four morphological types of spines (filopodia, stubby, thin/long and mushroom) on apical dendritic branches of approximately 40 μm length/neuron were quantified.
Chemicals
Tamapin was purchased from Smartox Biotechnology (France) and dissolved in aCSF (for electrophysiology) or PBS (for i.p. injections). Tamapin was injected at 15 μg/kg weight to animals. For the analysis of Tamapin crossing the blood-brain barrier, mouse brains were immersion-fixed with 4% PFA as described above for 30 minutes post i.p. administration of synthesized Tamapin conjugated with biotin at its N terminal amino acid residue (Smartox Biotechnology, France). For the detection of biotinylated Tamapin, the ABC (Thermo Fisher Scientific, NY) and TSA (PerkinElmer, MA) kits were used after inactivation of endogenous peroxidase activity by hydrogen peroxide treatment.
Tamoxifen (Sigma-Aldrich, MO) dissolved in corn oil (Sigma-Aldrich, MO) (75 mg/kg) was administrated daily from P30 to P37 to mice that received in utero electroporation with inducible Kcnn2 shRNA or control shRNA.
Data analysis
Unless otherwise stated, an equal number of female and male mice were included in the analyses, and quantitative data were presented as the mean with the standard error. No statistical method has been used to predetermine the sample size, but our sample sizes similar to those reported in previous studies25,65,66. For all experiments including animal behavior tests, mice were excluded when we found health concerns including infection, bleeding or significant changes in body weight. The mice were also excluded when GFP was not detected specifically in motor region of the cortex or in the contralateral hemisphere of the preferred limb post in utero electroporation. For all experiments that did not analyze males and females separately, both male and female mice were assigned randomly without pre-determined criteria into each group. All experiments were replicated multiple times with independent animals, and same experiments were repeated independently by 3 experimenters at different time. Consistent results were found across different experimenters. All experimenters were blinded to the group of animals during data collection and analysis. In the box plot, the line within the box indicates the median, and the upper and lower edges of the box represent the 25th and 75th percentiles, respectively. The upper and lower whisker boundaries indicate the 10th and 90th percentiles, respectively, and dots indicate outliers. All data compared were collected at the same time. We performed the D’Agostino-Pearson normality test. For the data that passed the normality test, we performed two-tailed Student’s t-test, one-way or two-way (repeated measures) analysis of variance (ANOVA) followed by a post hoc Tukey test as described at each analysis, using SigmaPlot version 12.2 (Systat, CA). In the cases we observed a statistically significant interaction between independent variables in two-way ANOVA, we reported simple main effects using ANOVA4 on the Web (https://www.hju.ac.jp/~kiriki/anova4). Two-tailed Mann-Whitney U test was used for two-group comparisons of data that did not follow a normal distribution. Pearson’s Correlation Coefficient calculation and Kolmogorov-Smirnov test were performed using Graphpad Prism version 7 (GraphPad Software, CA). P values of less than 0.05 were considered statistically significant.
Life Science Reporting Summary
Further information on research design is available in the Nature Research Reporting Summary linked to this article.
Data availability
All raw data and processed data of RNA sequencing are available (GSE141714). Other Data are available from the authors upon reasonable request and with permission of the Children’s National Institutional Review Board.
Extended Data
Extended Data Fig. 1. PAE mice show normal gross brain morphology, locomotor activity and anxiety-like behavior.
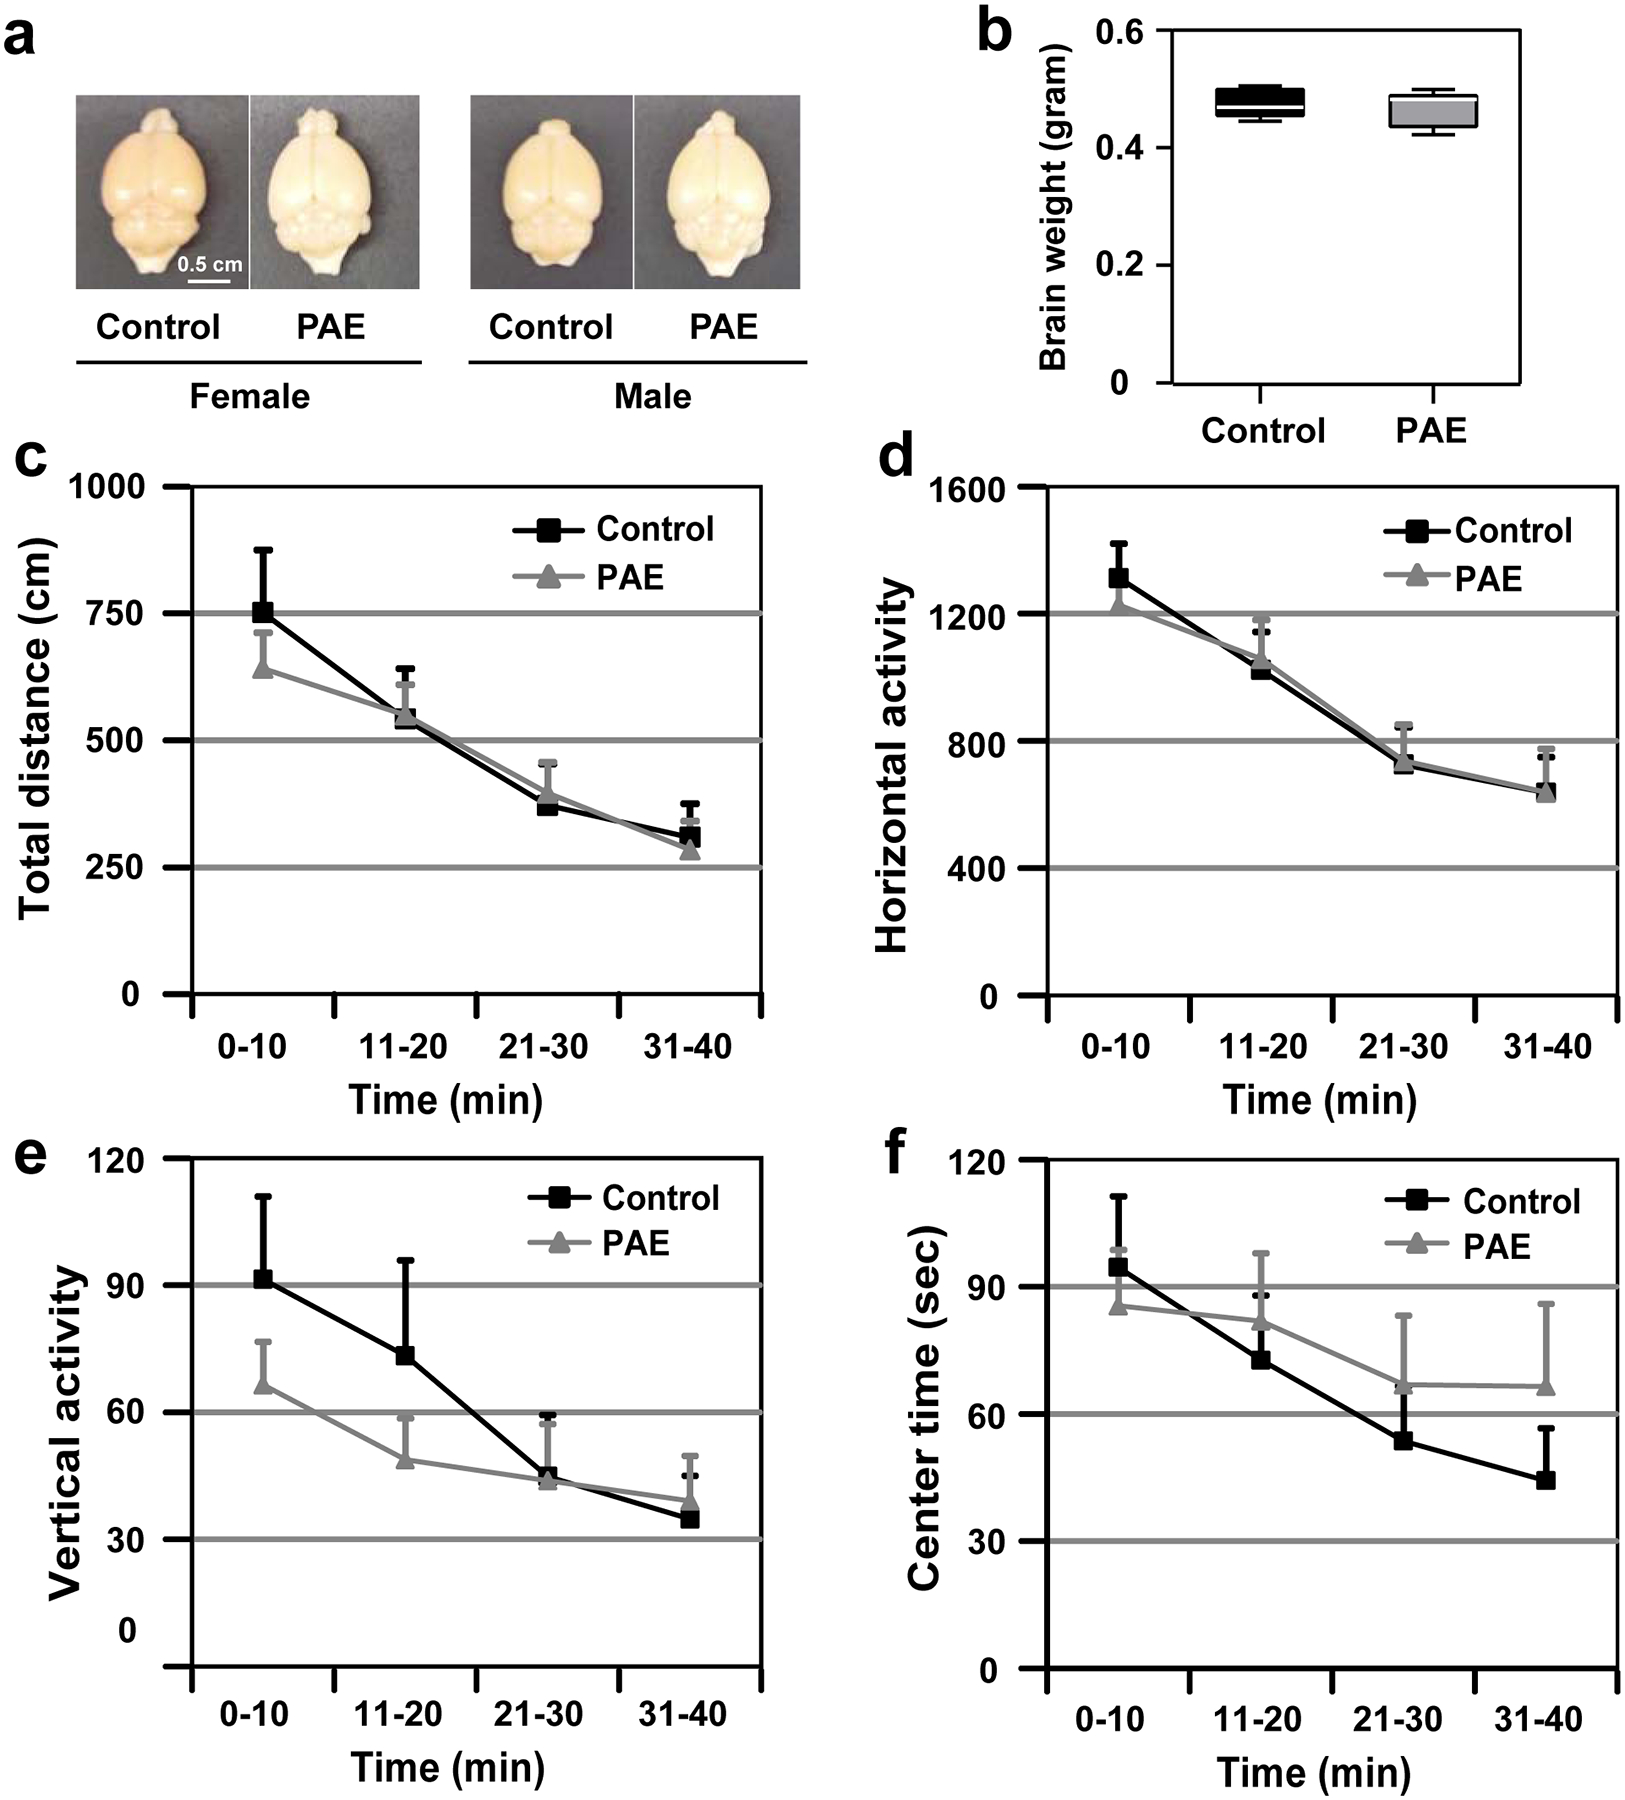
(a,b) There are no differences in the brain size/shape (a) or weight (b) between control and PAE mice. P = 0.75 by two-tailed Student’s t-test [n = 10 (5 males and 5 females) per group]. In the box plot, the line within the box indicates the median, and the upper and lower edges of the box represent the 25th and 75th percentiles, respectively. The upper and lower whisker boundaries indicate the 10th and 90th percentiles, respectively, and dots indicate outliers. (c-f) No abnormalities were observed in total distance (c), horizontal activity (d), vertical activity (e) or center time (f) in PAE mice in the open field test; F(1,38) = 0.07, P = 0.79 (c), F(1,38) = 0.004, P = 0.95 (d), F(1,38) = 0.44, P = 0.51 (e), F(1,38) = 0.21, P = 0.65 (f) by two-way repeated measures ANOVA (n = 20 animals per group). No significant differences in comparisons at each time point by two-tailed Student’s t-test. Graphs show mean ± SEM.
Extended Data Fig. 2. Learning impairment lasts over a period of 5 days in PAE mice.
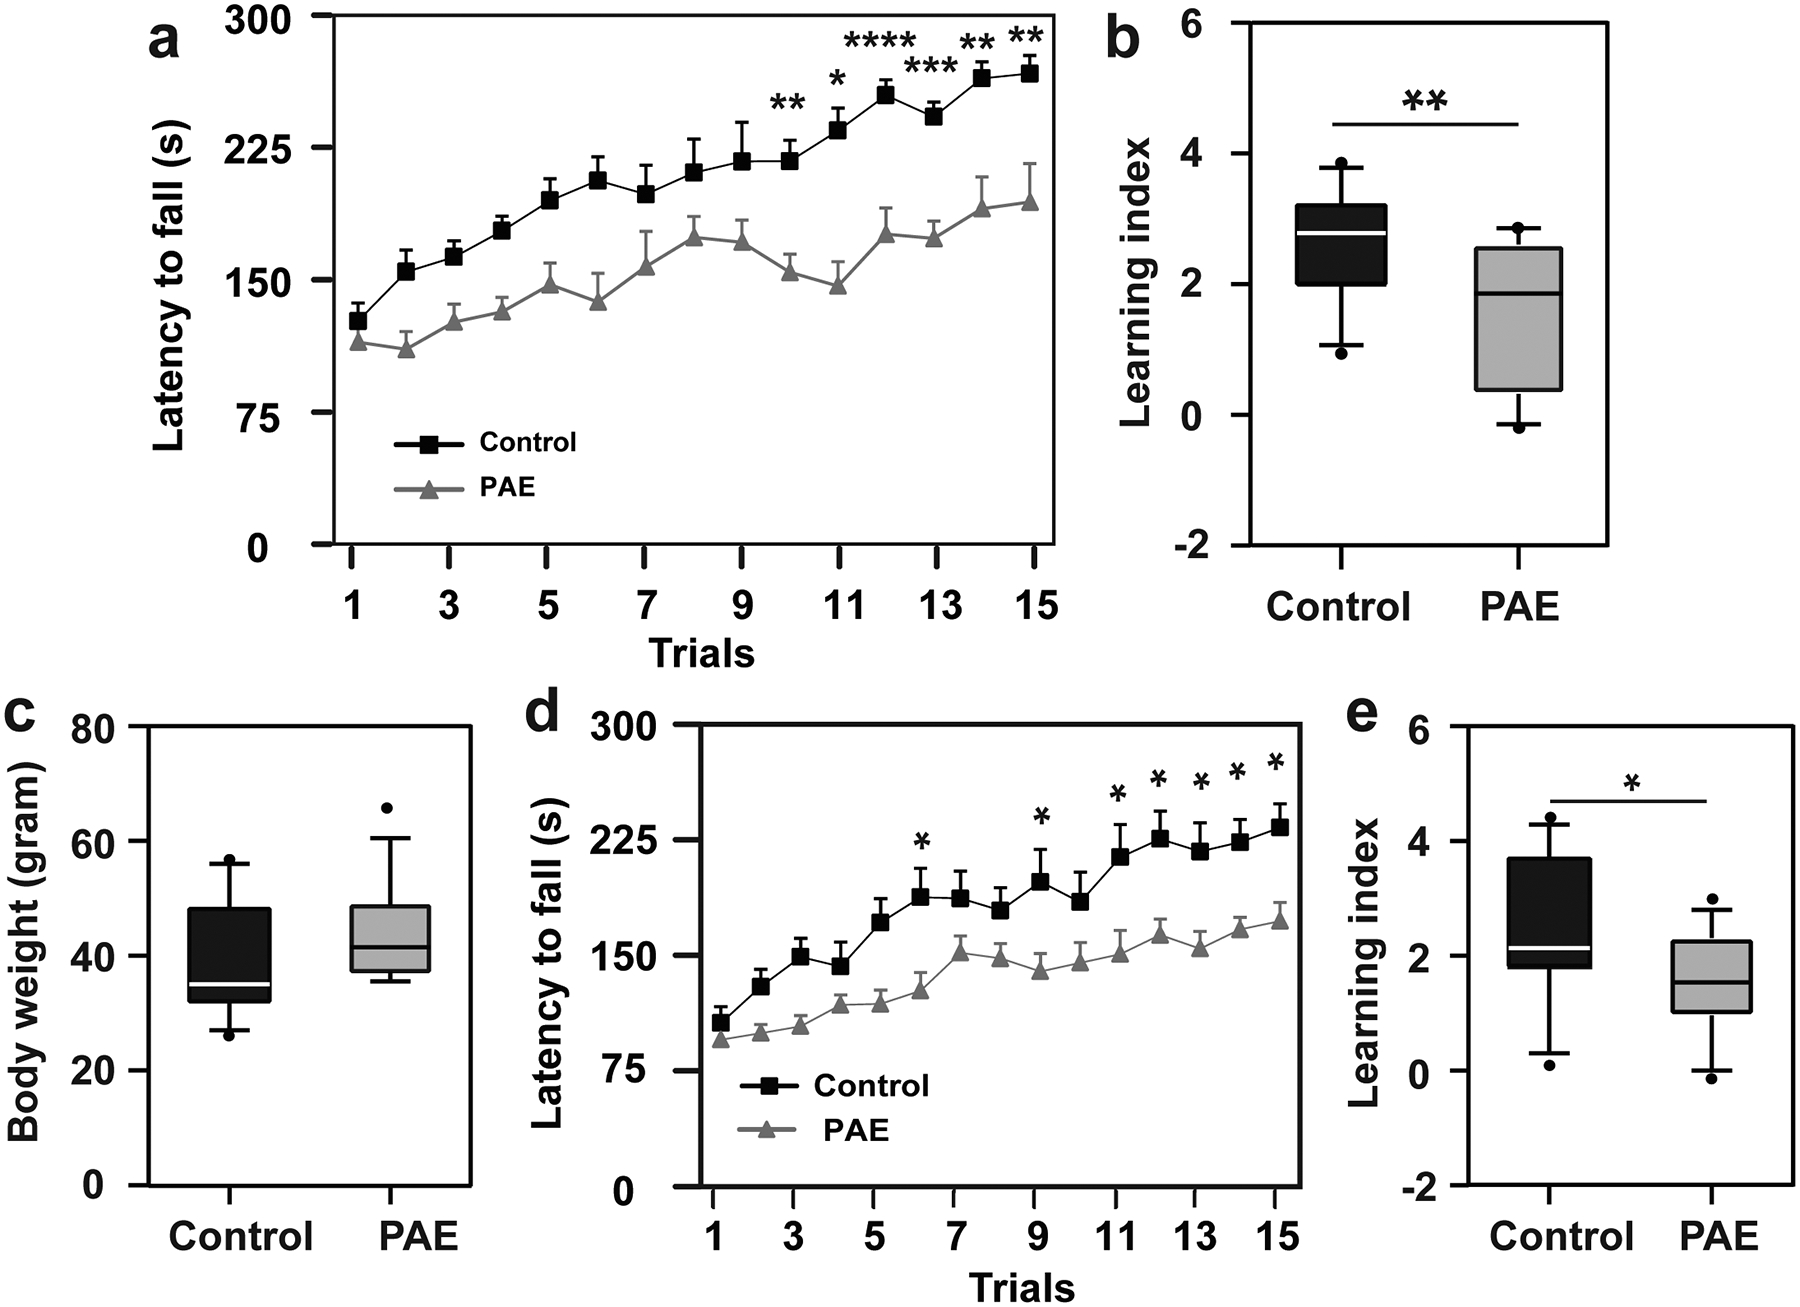
(a) The accelerated rotarod test was performed with the same daily schedule as shown in Fig. 1c for 5 days. PAE mice show significantly shorter latency to fall compared to control. F(1,19) = 28.3, P = 0.0001 by two-way repeated measures ANOVA. *P < 0.05, **P < 0.01, ***P < 0.001, ****P < 0.0001 by Tukey’s test (control: n = 11 animals, PAE: n = 10 animals). Graph shows mean ± SEM. (b) Learning index over the 5-day period is lower in PAE mice. *P = 0.015 by two-tailed Student’s t-test (control: n = 11 animals, PAE: n = 10 animals). (c) The accelerated rotarod test was performed for 5 days with 3-month-old animals. No significant differences were observed in body weight between control and PAE mice; P = 0.243 by two-tailed Student’s t-test (control: n = 12 animals, PAE: n = 14 animals). (d) PAE mice show significantly shorter latency to fall compared to control mice. F(1,24) = 11.57, P = 0.003 by two-way repeated measures ANOVA. *P < 0.05 by Tukey’s test (control: n = 12 animals, PAE: n = 14 animals). Graph shows mean ± SEM. (e) Learning index over the 5-days period is also lower in PAE mice. *P = 0.026 by two-tailed Student’s t-test (control: n = 12 animals, PAE: n = 14 animals). In box plots (b, c, e), the line within the box indicates the median, and the upper and lower edges of the box represent the 25th and 75th percentiles, respectively. The upper and lower whisker boundaries indicate the 10th and 90th percentiles, respectively, and dots indicate outliers.
Extended Data Fig. 3. Pellet grasping is impaired in PAE mice.
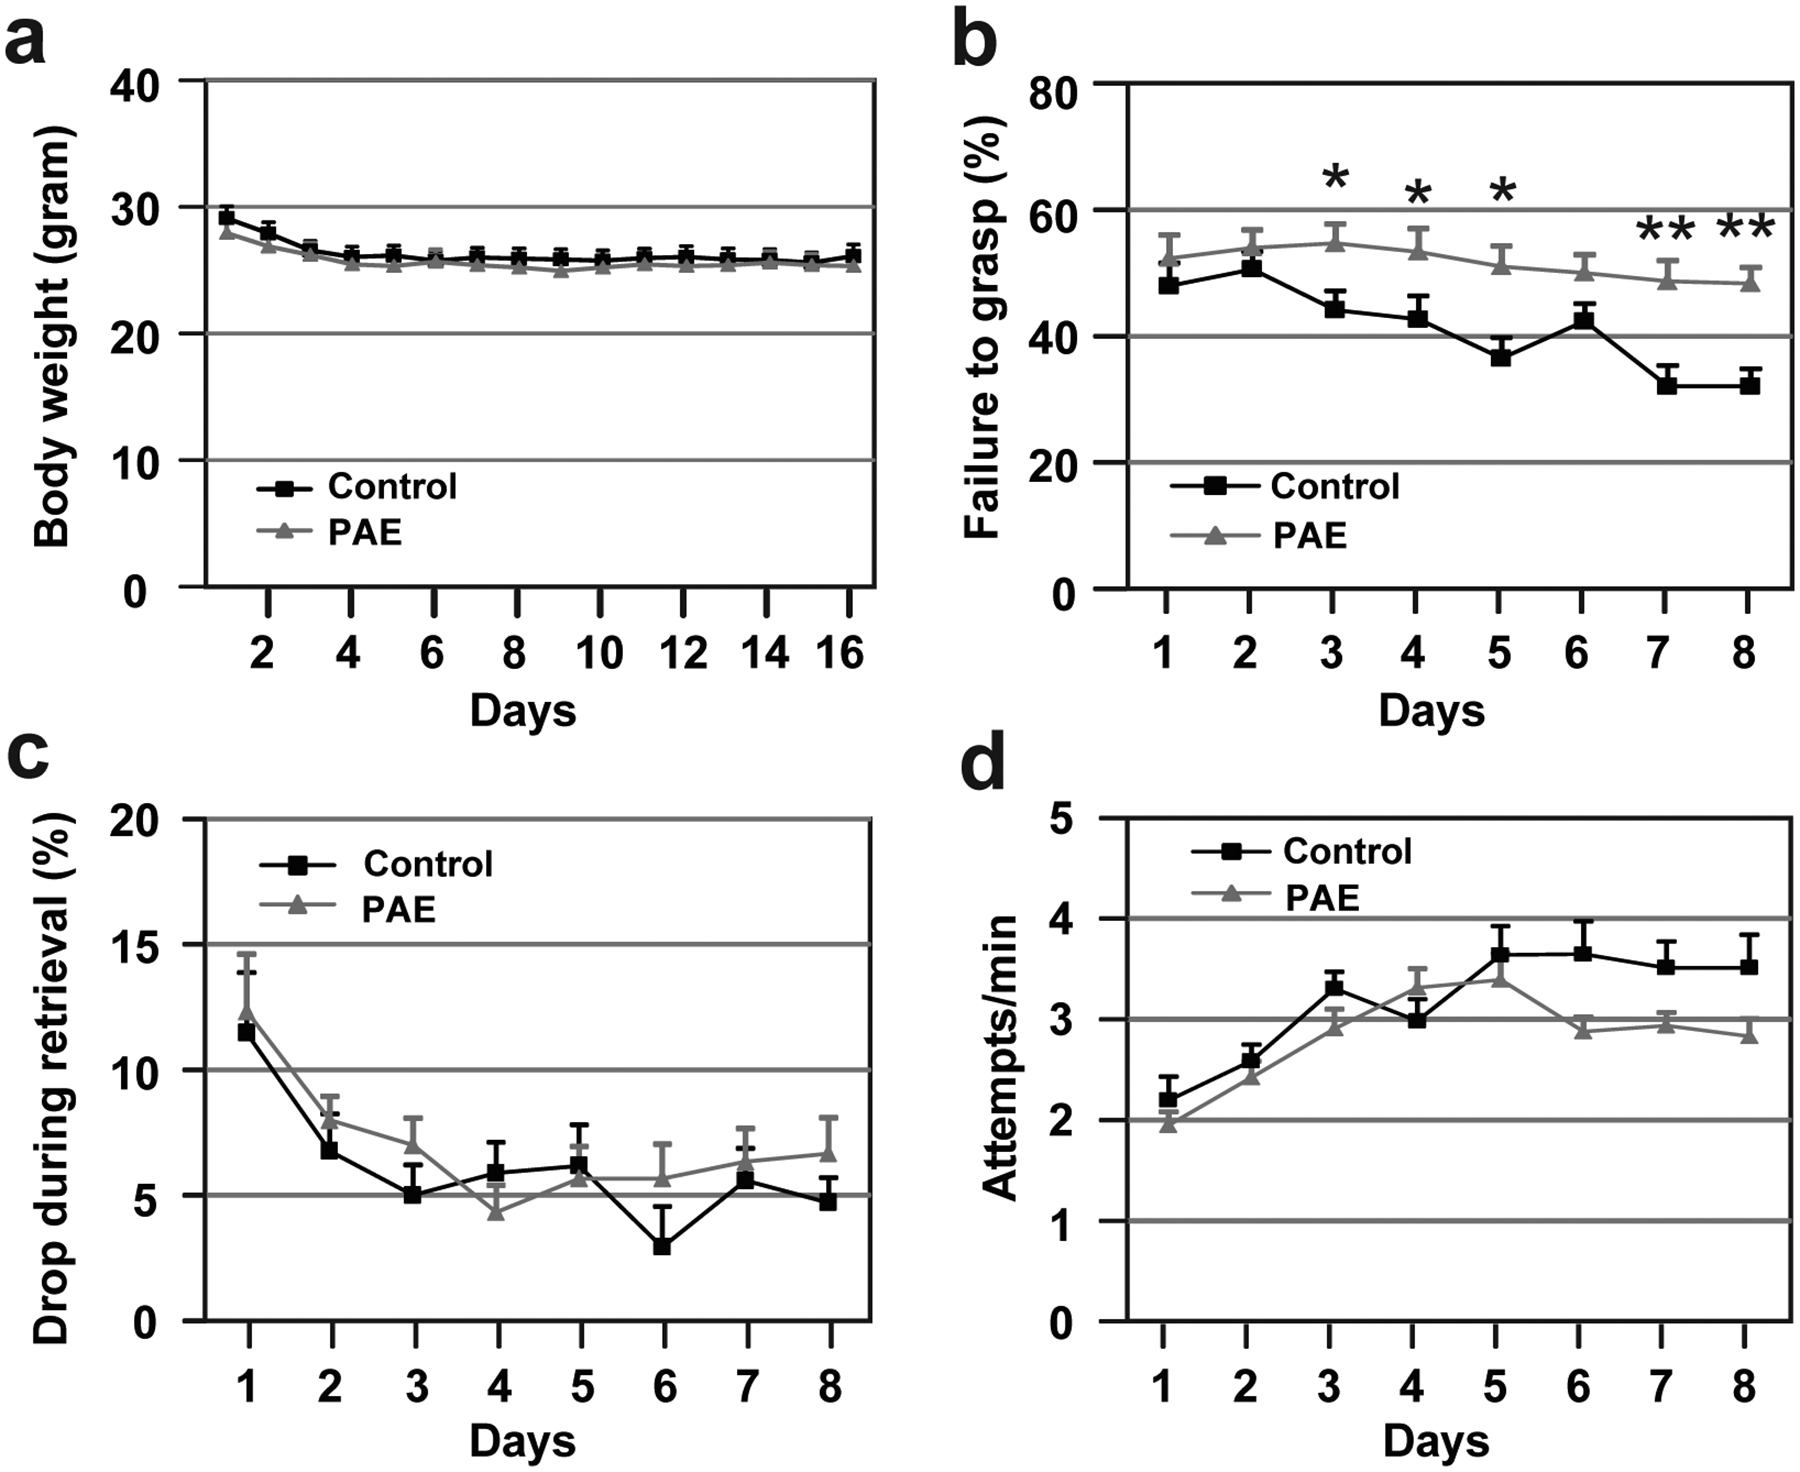
(a) PAE does not affect body weight change through the phases of the single pellet reaching test [food deprivation: day 1–3, acclimatization: day 4–5, training/shaping: day 6–8, and testing: day 9–16 (test day 1–8)]; F(1,33) = 0.89, P = 0.35 by two-way repeated measures ANOVA (vehicle: n = 20 animals, PAE: n = 15 animals). Graph shows mean ± SEM. (b-c) A significant effect of PAE is observed during the testing phase, on the failure to grasp (b); F(1,30) = 40.21, P < 0.0001 by two-way repeated measures ANOVA, *P < 0.05, **P < 0.01 by Tukey’s test, but not on the drop during retrieval (vehicle: n = 17 animals, PAE: n = 15 animals). Graph shows mean ± SEM. (c); F(1,30) = 0.87, P = 0.36 by two-way repeated measures ANOVA (vehicle: n = 17 animals, PAE: n = 15 animals). Graph shows mean ± SEM. (d) PAE does not affect the number of attempts per minute; F(1,30) = 3.08, P = 0.09 by two-way repeated measures ANOVA (vehicle: n = 17 animals, PAE: n = 15 animals). Graph shows mean ± SEM.
Extended Data Fig. 4. Normal radial positioning and morphology of layer III neurons in M1 in PAE mice at P30.
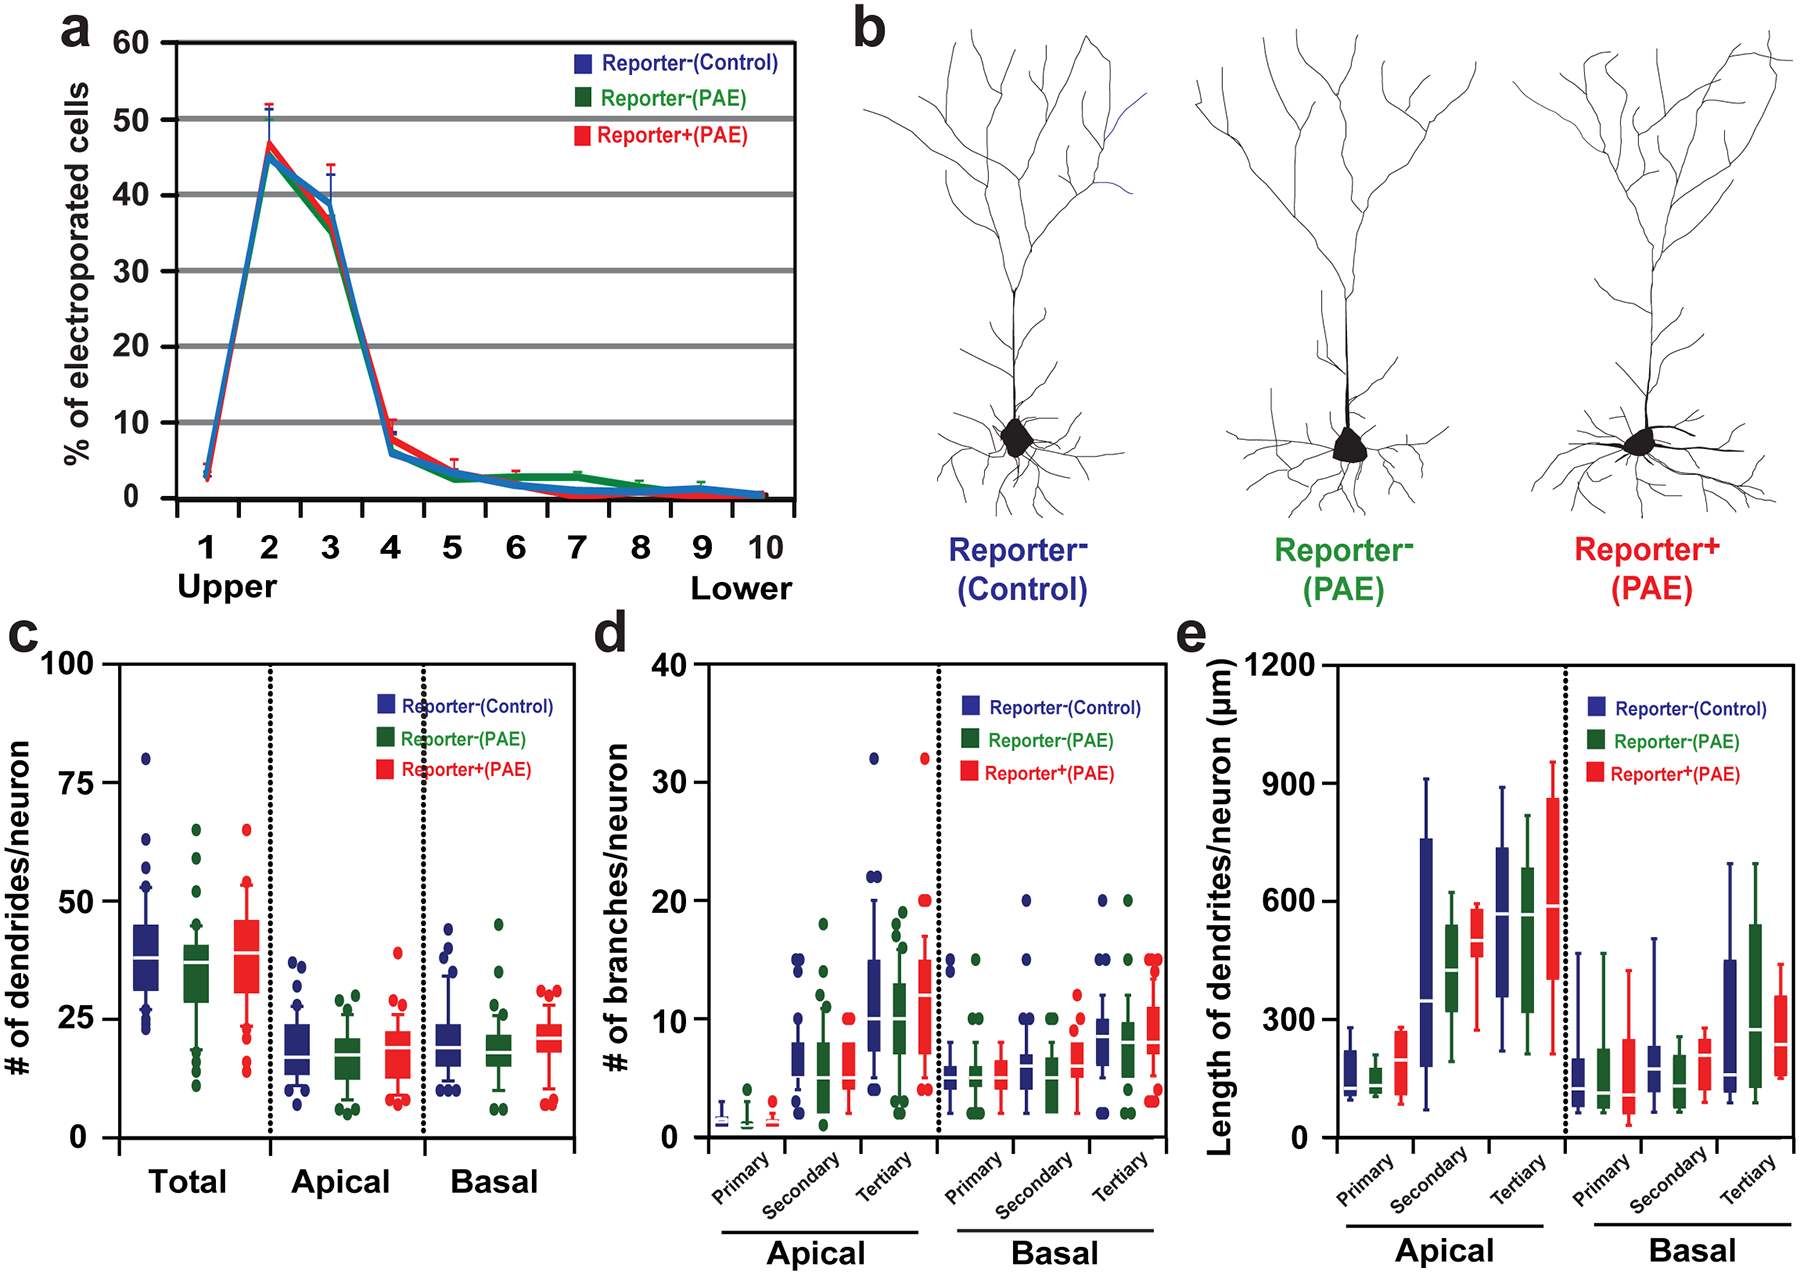
(a) The percentage of reporter− (control and PAE) and reporter+ (PAE) neurons among electroporated neurons in equally divided bins 1 to 10 spanning the upper to lower part of the entire thickness of the cerebral cortex. No significant differences are found between the distribution patterns in each group; P < 0.2 by one-tailed Kolmogorov-Smirnov test (n=3 per group). Graph shows mean ± SEM. (b) Representative tracing of the neuronal morphology in each group. (c-e) There are no significant morphological differences in reporter+ cortical neurons in PAE mice compared with reporter− neurons in both control and PAE mice; Number of dendrites/neuron (c): F(2,122) = 1.46, P = 0.24 (total), F(2,122) = 1.47, P = 0.23 (apical), F(2,122) = 0.84, P = 0.43 (basal); number of branches/neuron [reporter − (control, PAE): n = 40 cells each, reporter+ (PAE): n = 45 cells] (d): F(2,122) = 0.17, P = 0.84 (apical primary), F(2,122) = 0.31, P = 0.73 (apical secondary), F(2,122) = 0.86, P = 0.43 (apical tertiary), F(2,122) = 0.21, P = 0.81 (basal primary), F(2,122) = 2.19, P = 0.12 (basal secondary), F(2,122) = 1.13, P = 0.33 (basal tertiary); length of dendrites/neuron [reporter − (control, PAE): n = 40 cells each, reporter+ (PAE): n = 45 cells] (e): F(2,22) = 1.02, P = 0.38 (apical primary), F(2,22) = 0.26, P = 0.77 (apical secondary), F(2,22) = 0.20, P = 0.820 (apical tertiary), F(2,22) = 0.01, P = 0.99 (basal primary), F(2,22) = 0.79, P = 0.47 (basal secondary), F(2,22) = 0.29, P = 0.08 (basal tertiary), all by one-way ANOVA [reporter − (control): n = 9 cells, reporter − (PAE): n = 8 cells, reporter+ (PAE): n = 8 cells]. In box plots (c-e), the line within the box indicates the median, and the upper and lower edges of the box represent the 25th and 75th percentiles, respectively. The upper and lower whisker boundaries indicate the 10th and 90th percentiles, respectively, and dots indicate outliers.
Extended Data Fig. 5. GO networks of the Blue and Green modules that are specific to reporter + neurons.
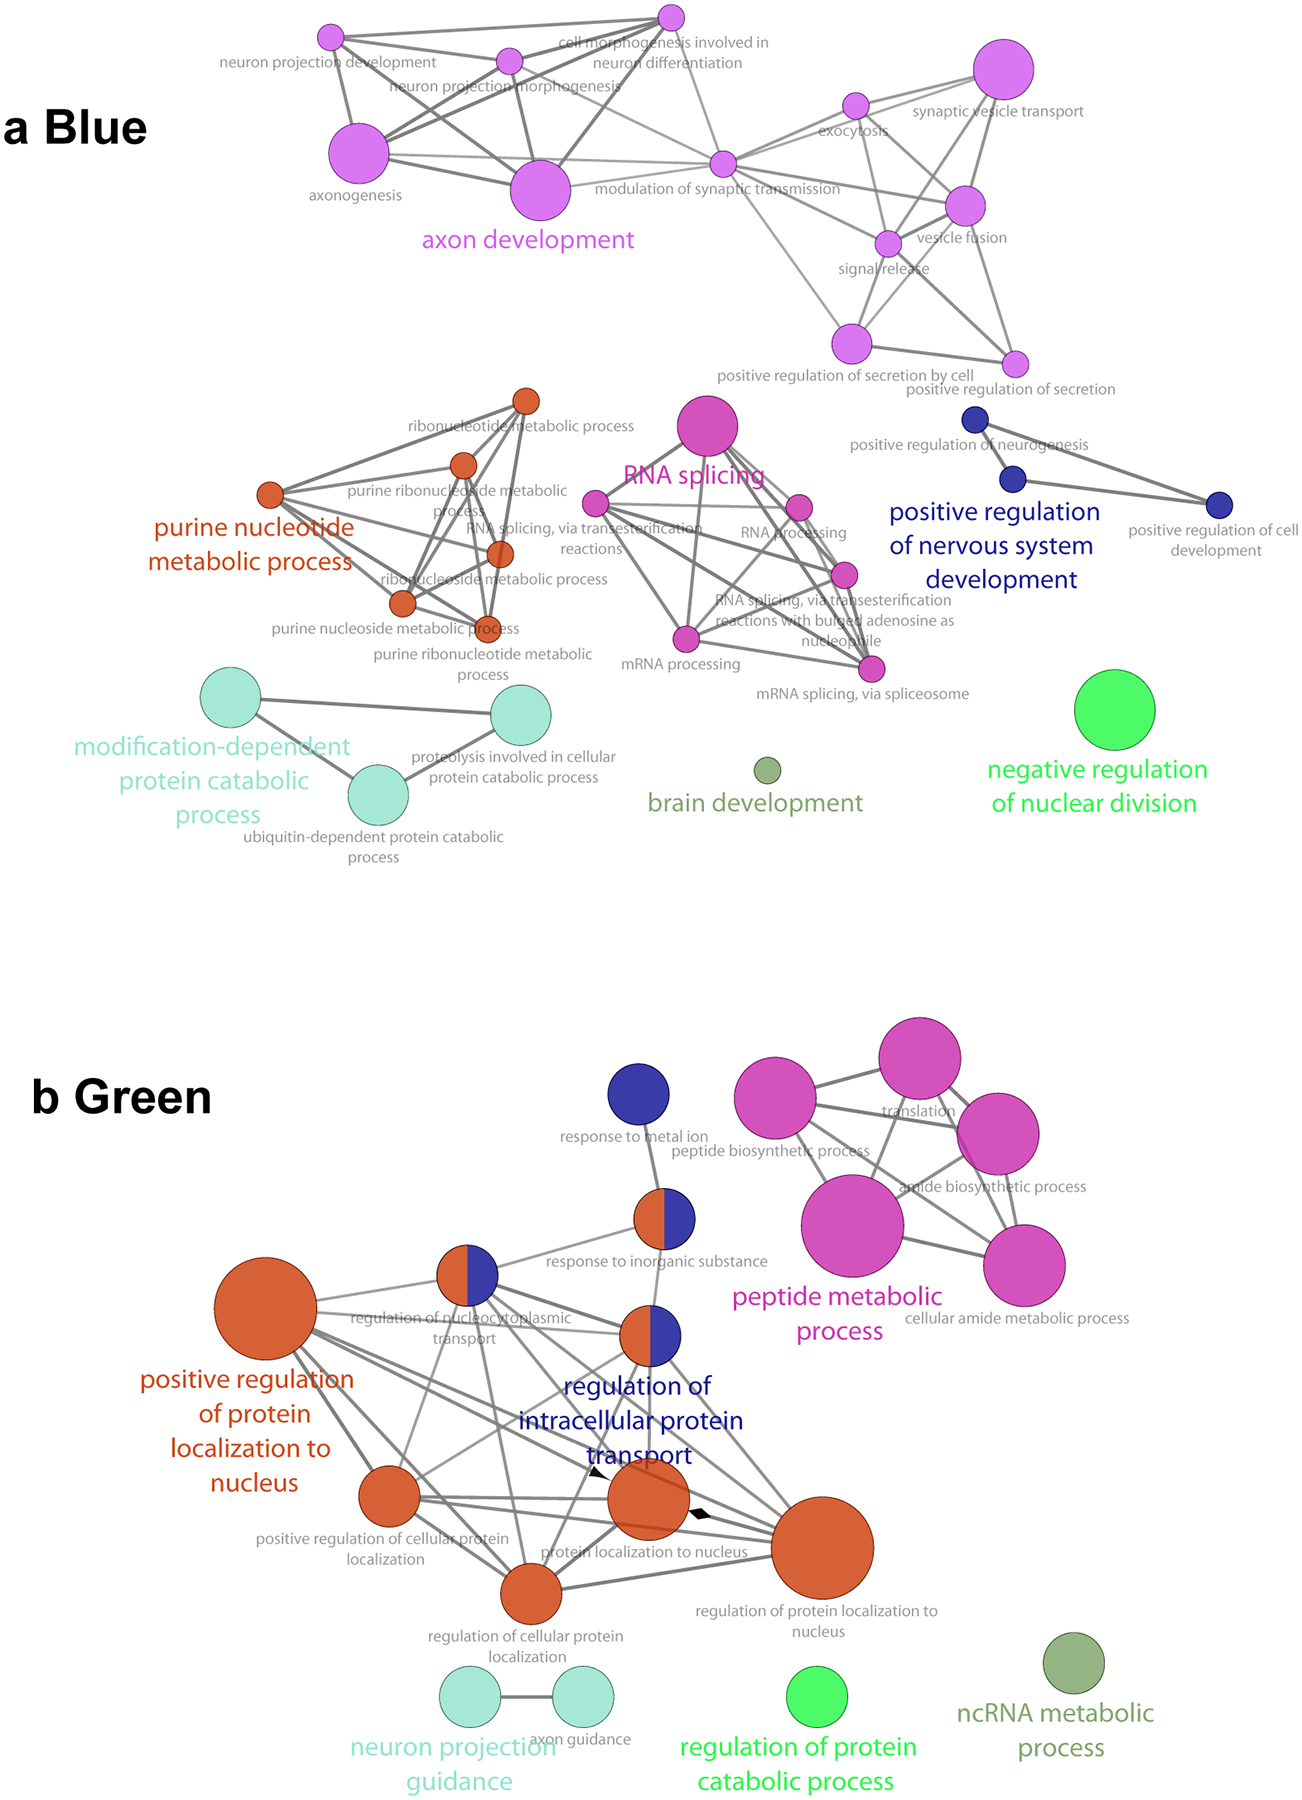
GO networks enriched in the Blue (a) and Green (b) modules show unique GOs for each module.
Extended Data Fig. 6. Kcnn2 expression is not increased in other major brain regions involved in motor learning.
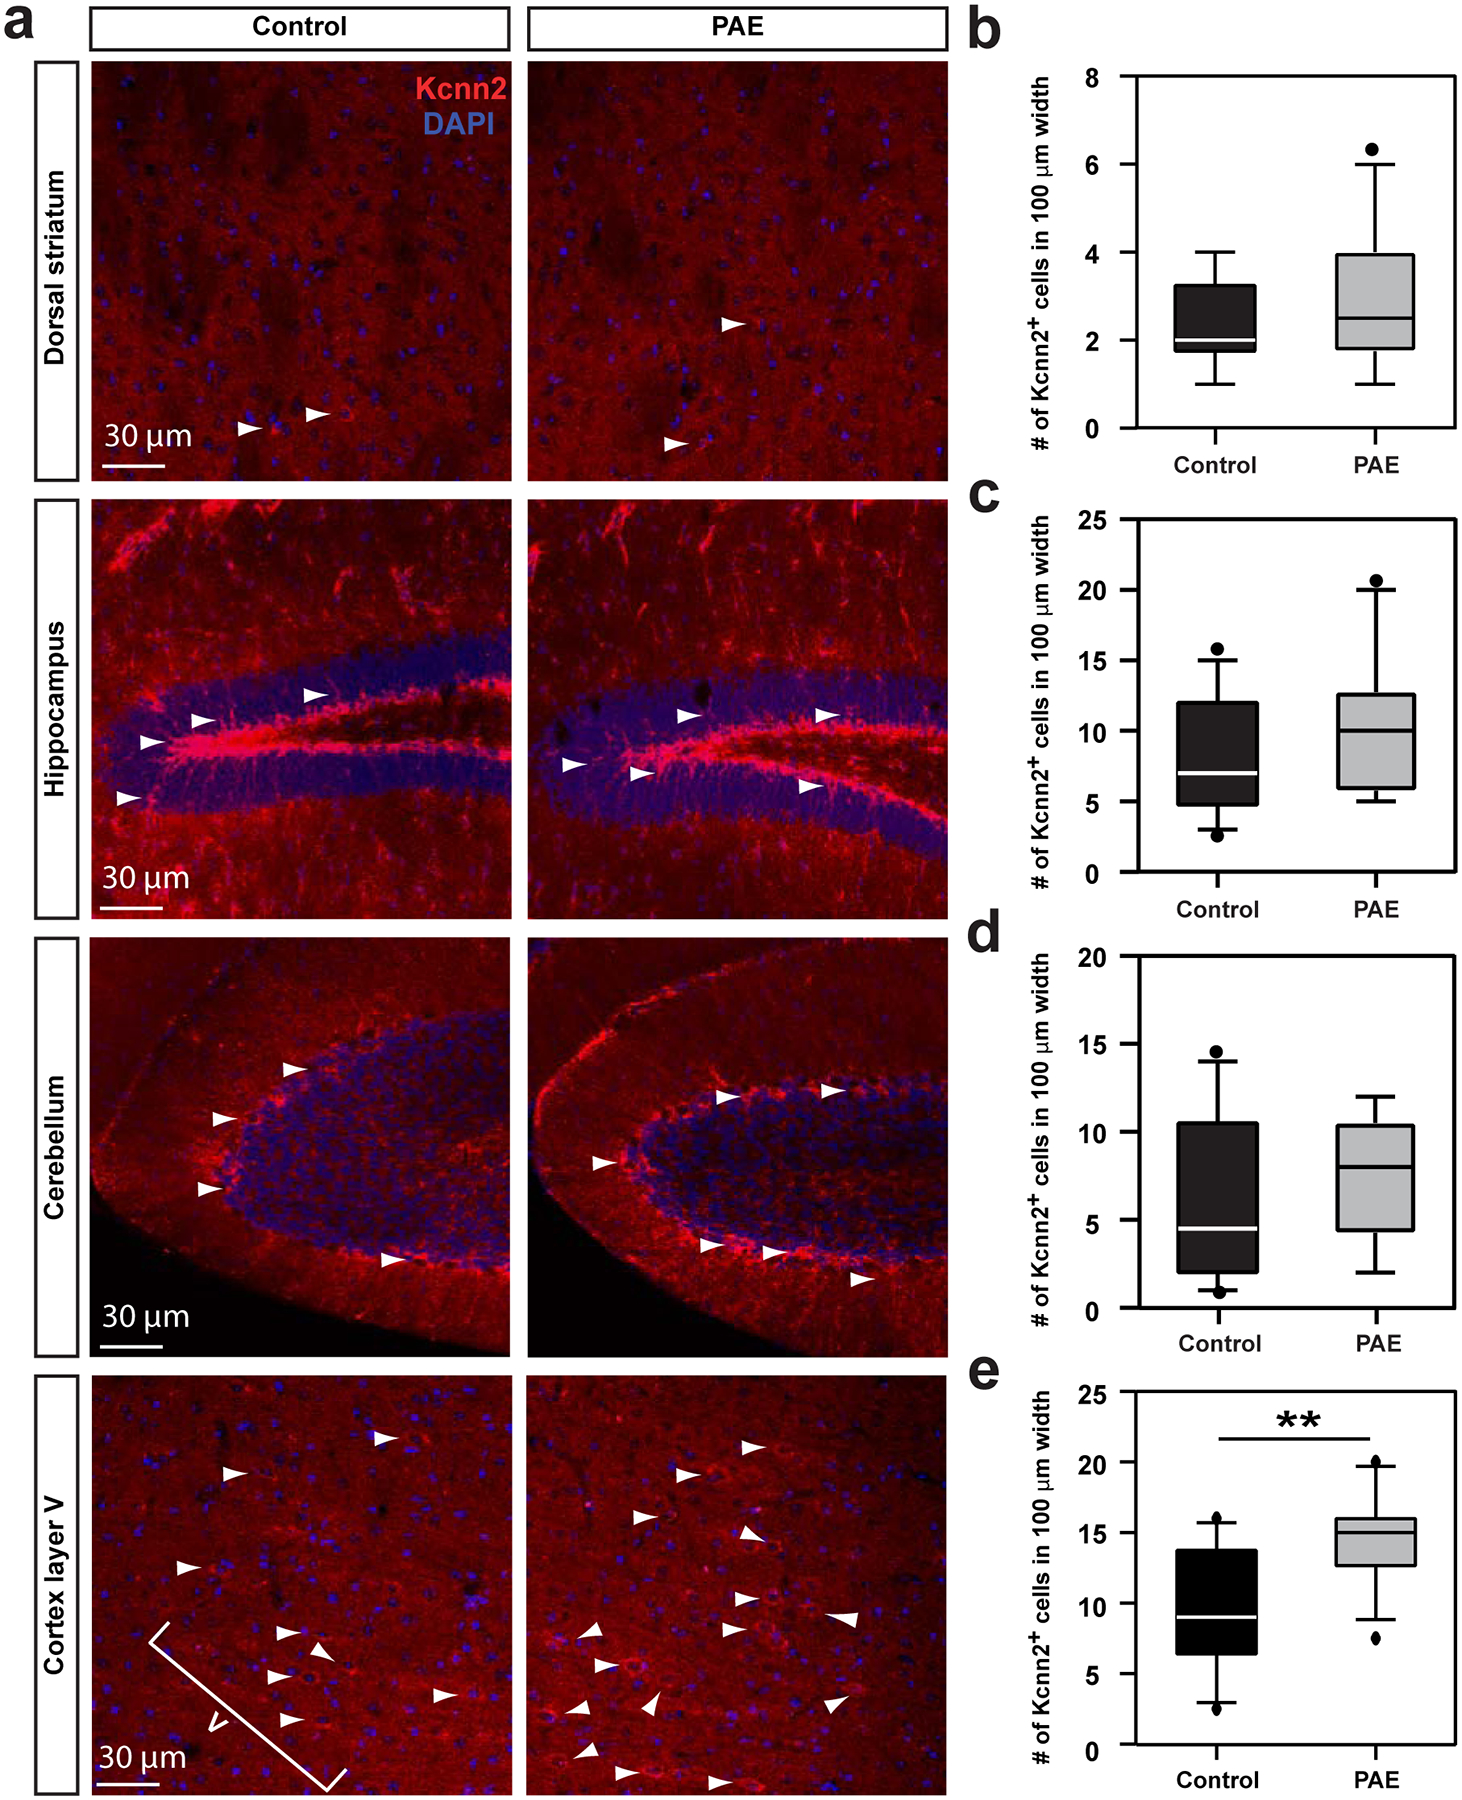
(a) Immunohistochemistry for Kcnn2 (red) with nuclear staining with DAPI (blue) in the indicated brain regions in control and PAE mice at P30. Arrowheads indicate Kcnn2+ cells. (b-e) Quantification of Kcnn2+ cells in dorsal striatum (b), hippocampus (granule cell layer of dentate gyrus) (c), cerebellum (granular layer in lobule VI) (d) and layer V in M1 (e). P = 0.51 (b), 0.26 (c), 0.37 (d), and 0.002 (e) by two-tailed Student’s t-test (n = 10 per group). In box plots (b-e), the line within the box indicates the median, and the upper and lower edges of the box represent the 25th and 75th percentiles, respectively. The upper and lower whisker boundaries indicate the 10th and 90th percentiles, respectively, and dots indicate outliers.
Extended Data Fig. 7. Tamapin binding colocalizes with Kcnn2 protein.
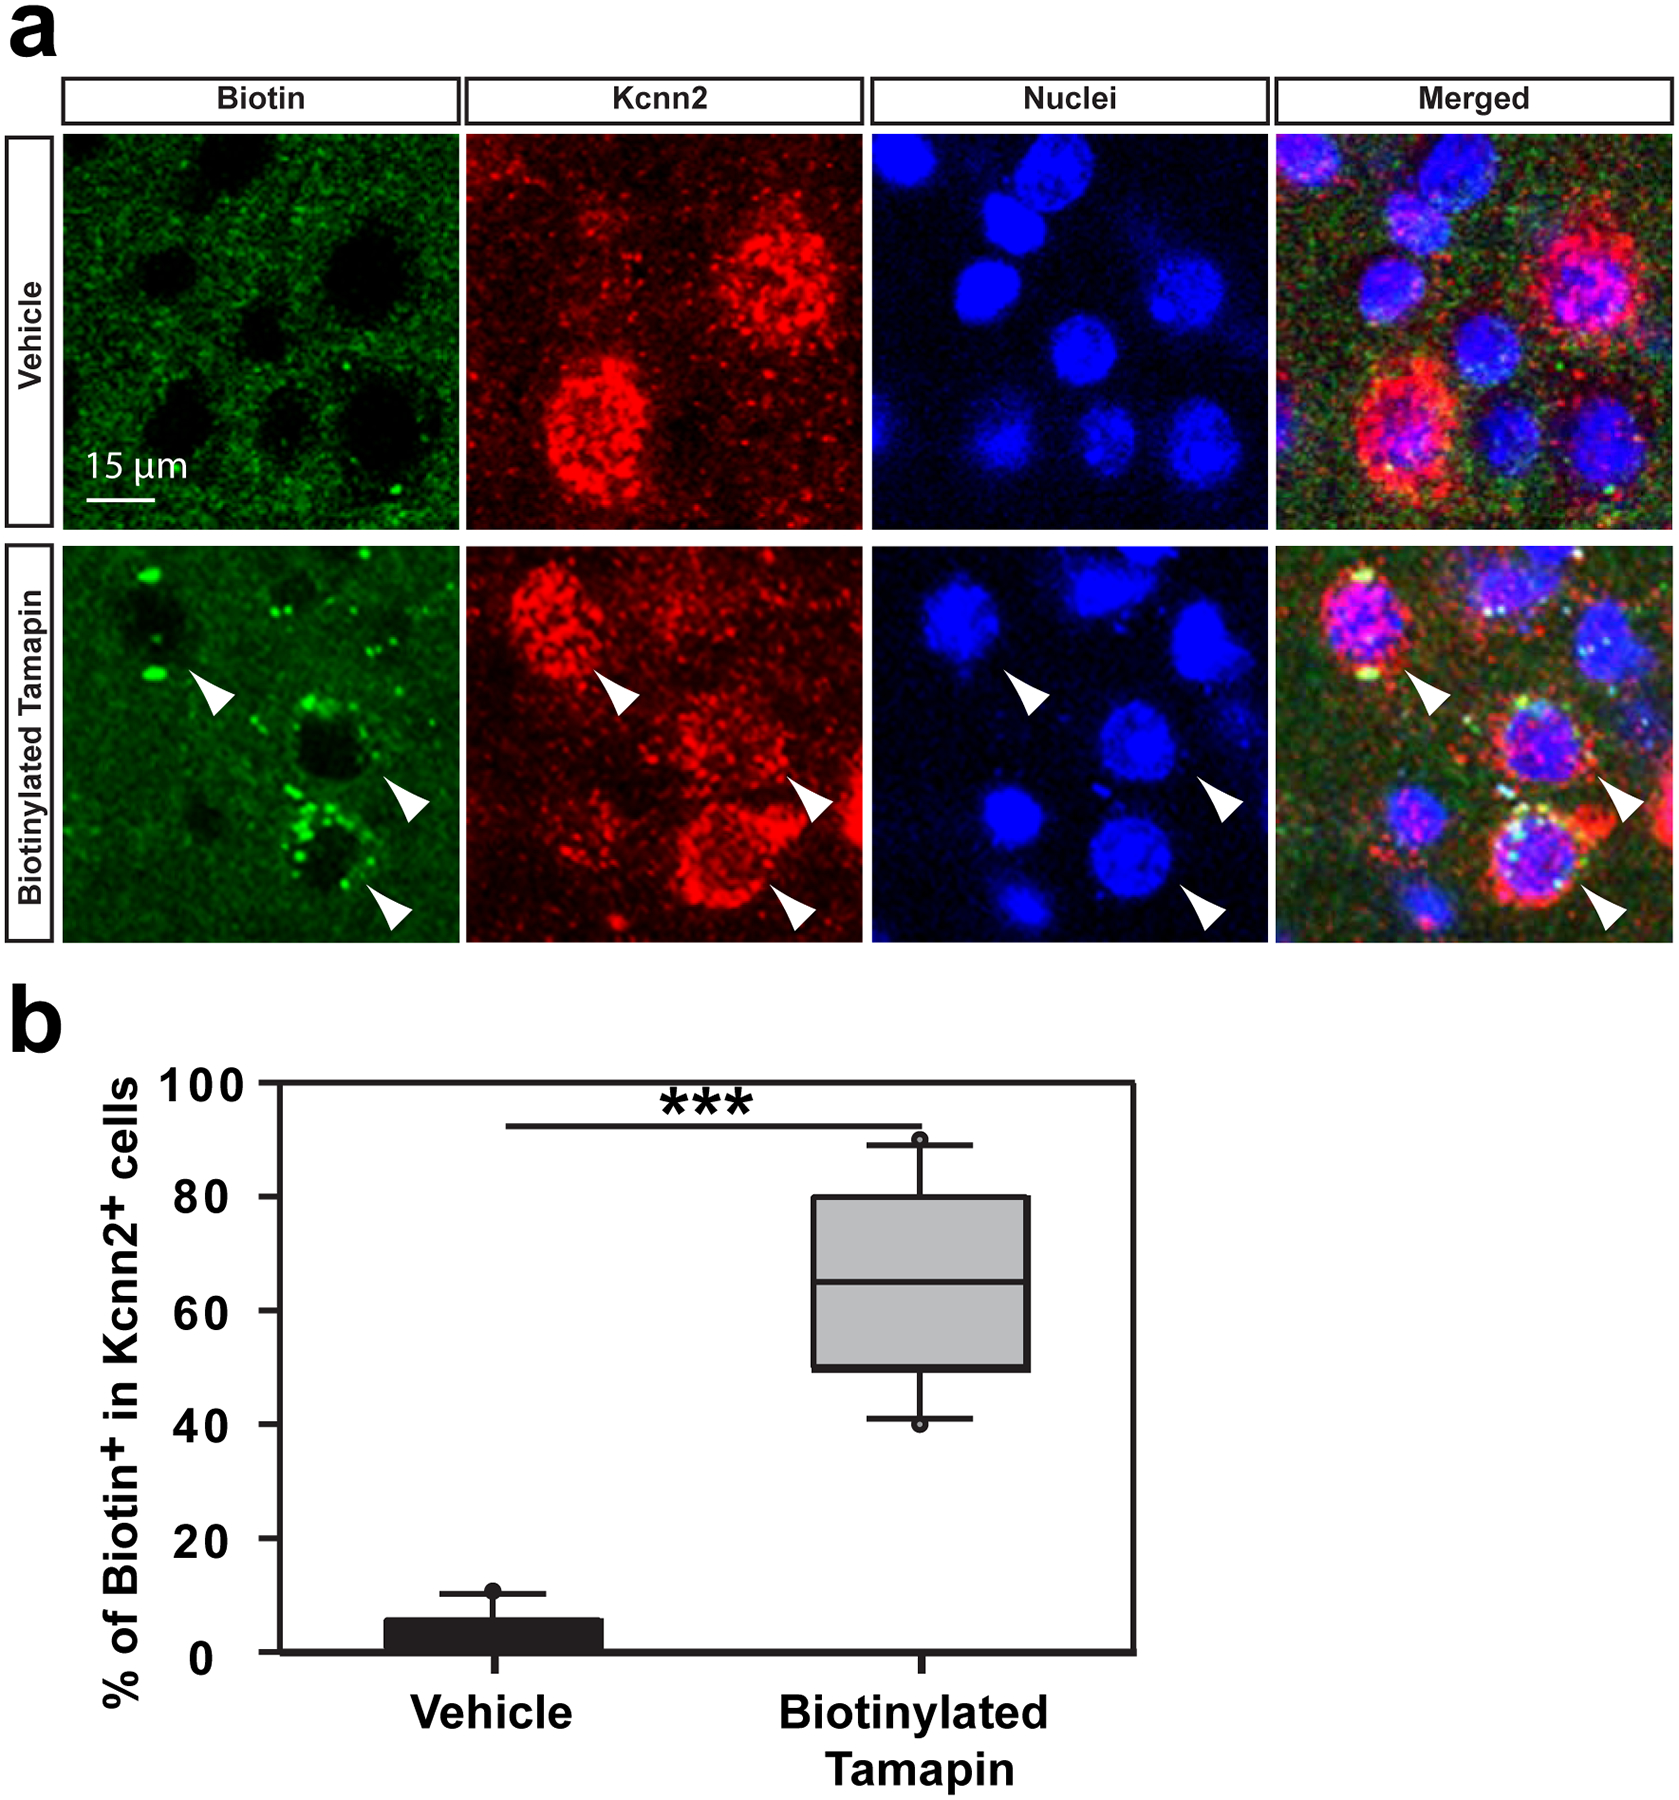
Biotinylated Tamapin (or vehicle-only control) was injected i.p. to control and PAE mice at P30. The cortex was fixed 30 minutes later for staining of biotin (green) and Kcnn2 (red). (a) Labeling for biotin (arrowhead) in layer III in M1 shows the co-localization of Tamapin and Kcnn2 protein. (b) Many Kcnn2+ cells in layer III in M1 are co-labeled for biotin in biotinylated Tamapin-injected PAE mice; ***P < 0.0001 by two-tailed Mann-Whitney U test (n = 10 per group). In the box plot, the line within the box indicates the median, and the upper and lower edges of the box represent the 25th and 75th percentiles, respectively. The upper and lower whisker boundaries indicate the 10th and 90th percentiles, respectively, and dots indicate outliers.
Extended Data Fig. 8. Minimal binding of Tamapin to Kcnn1+ or Kcnn3+ cells.
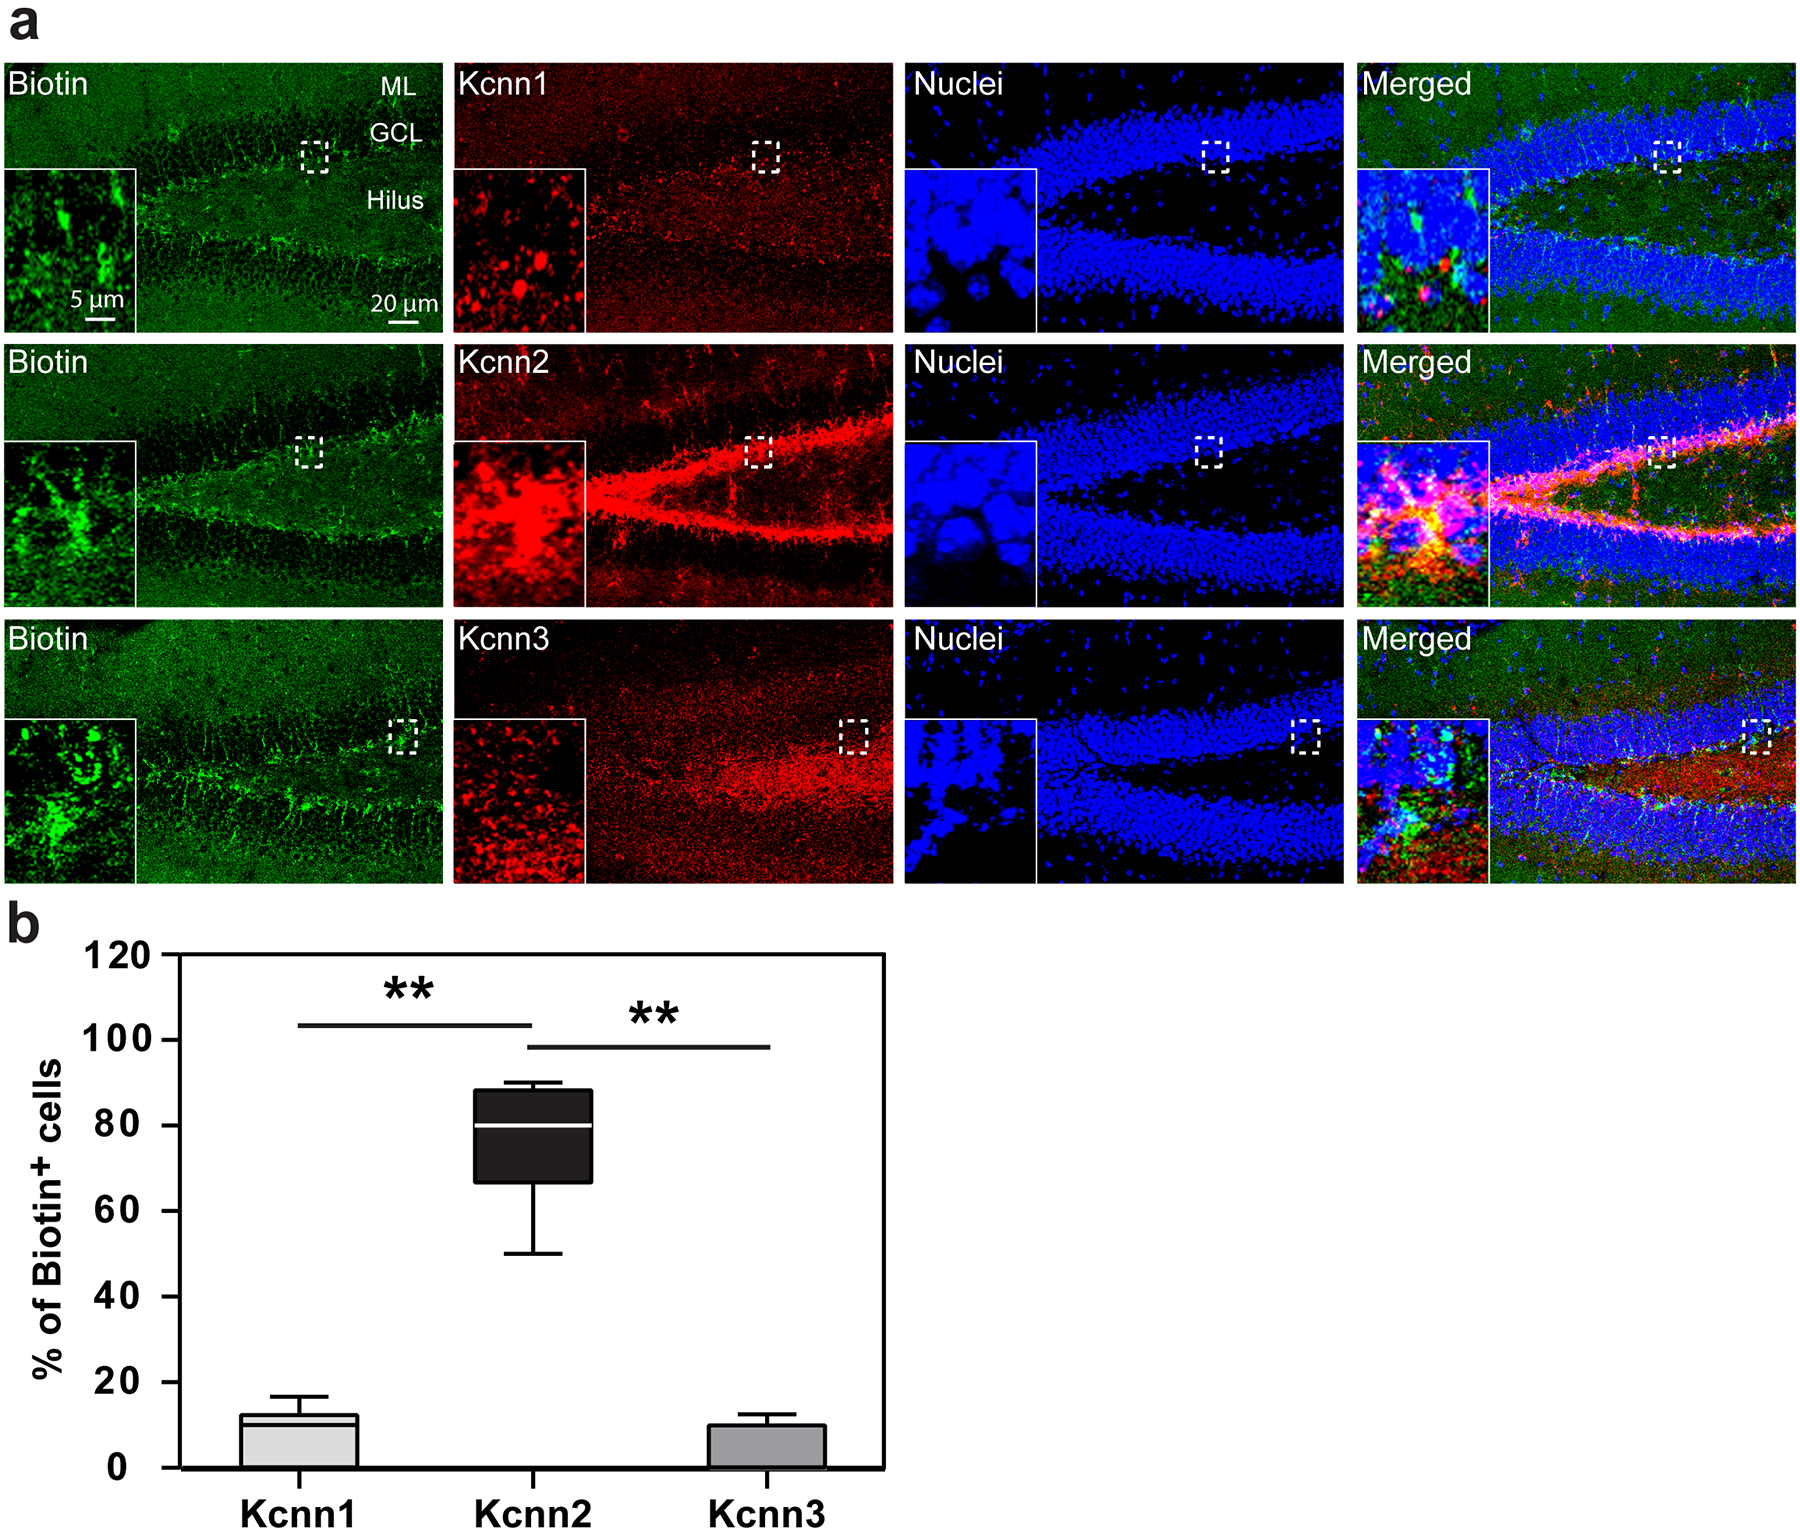
(a) Biotinylated Tamapin was injected i.p. to PAE mice at P30. The cortex was fixed 30 minutes later for staining of biotin (green) and Kcnn1, 2, or 3 (red) in the hilus, in which Kcnn1, 2, and 3 have distinct expression patterns. Insets show higher magnification views of the areas outlined by broken lines. (b) The percentage of biotin-labeled cells among the cells that express Kcnn1, 2, or 3 in the hilus, showing specific binding of biotinylated Tamapin to Kcnn2+ cells. F(2,21) = 148.21, P < 0.0001 by one-way ANOVA, **P < 0.01 by Tukey test (n = 8 brains per group). In the box plot, the line within the box indicates the median, and the upper and lower edges of the box represent the 25th and 75th percentiles, respectively. The upper and lower whisker boundaries indicate the 10th and 90th percentiles, respectively, and dots indicate outliers.
Extended Data Fig. 9. Tamapin does not alter locomotor activity or anxiety-like behavior.
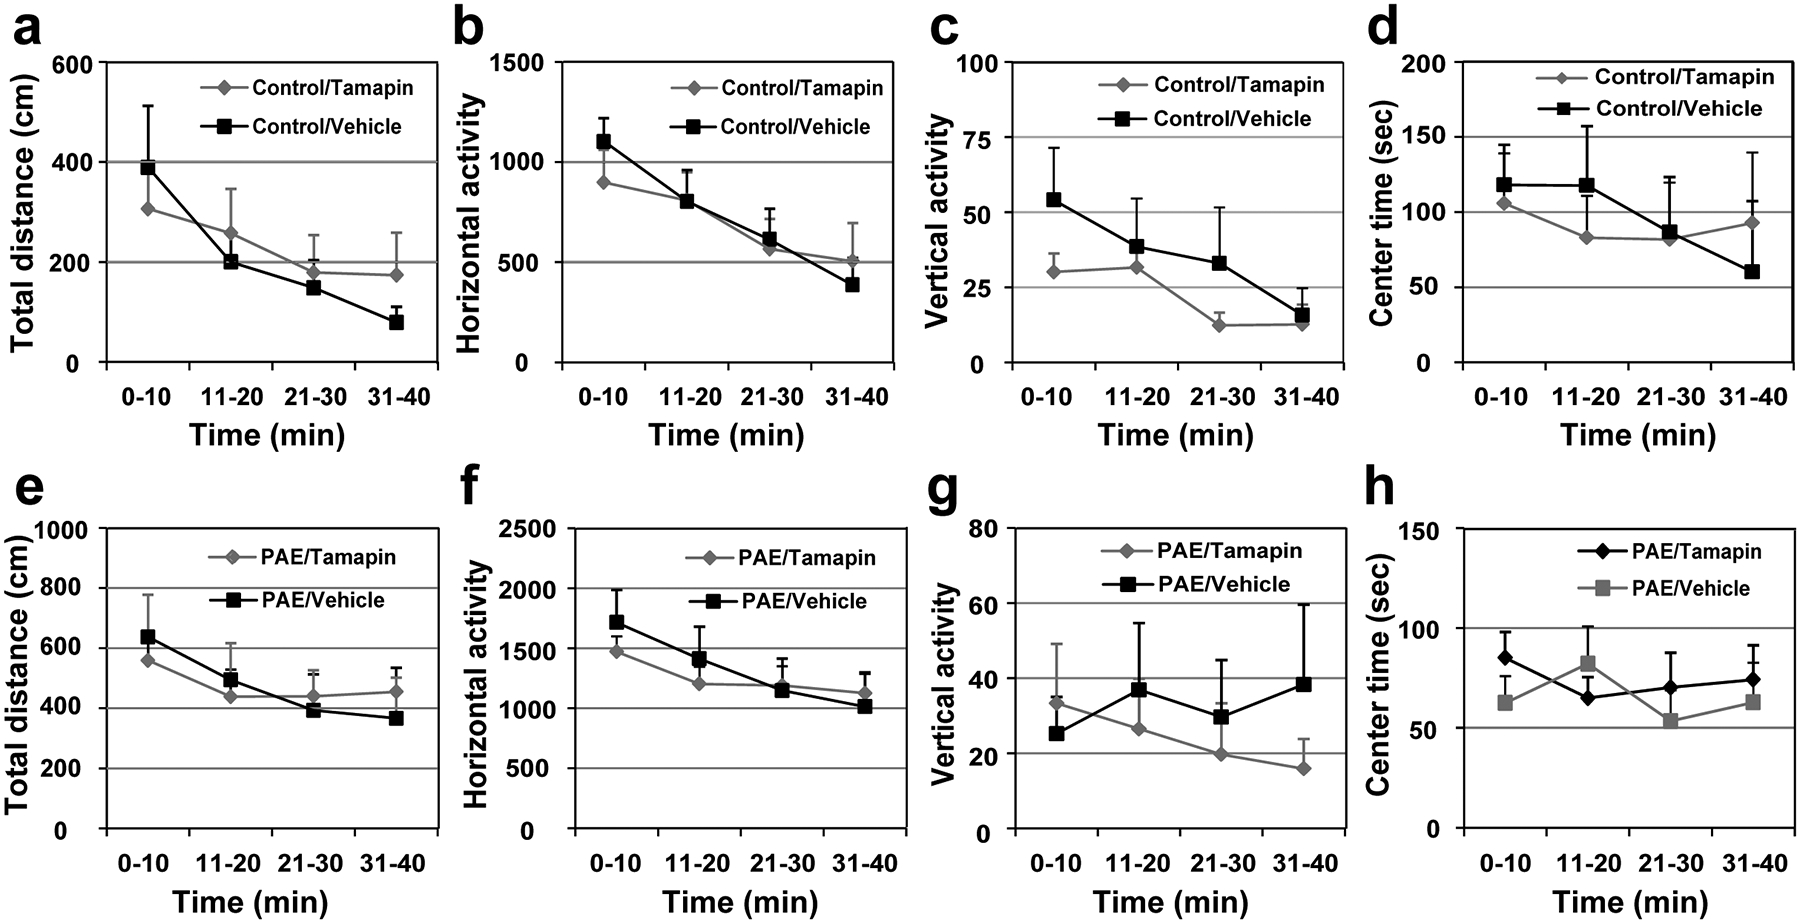
(a-h) The open field test shows that locomotor activity, measured by total distance (a, e), horizontal activity (b, f) and vertical activity (c, g), as well as anxiety-like behavior, measured by center time (d, h), are not altered by postnatal Tamapin administration in both control (a-d) and PAE (e-h) mice; F(1,18) = 0.06, P = 0.81 (a), F(1,18) = 0.03, P = 0.87 (b), F(1,16) = 0.88, P = 0.36 (c), F(1,18) = 0.01, P = 0.92 (d), F(1,18) = 0.001, P = 1.00 (e), F(1,18) = 0.06, P = 0.81 (f), F(1,17) = 0.22, P = 0.65 (g), F(1,18) = 0.21, P = 0.65 (h) by two-way repeated measures ANOVA (n = 10 animals per group). Separate sets of mice were used for open field testing. Graph shows mean ± SEM.
Extended Data Fig. 10. Knockdown of Kcnn2 in layer II/III neurons in M1 improves motor learning deficits in PAE mice.
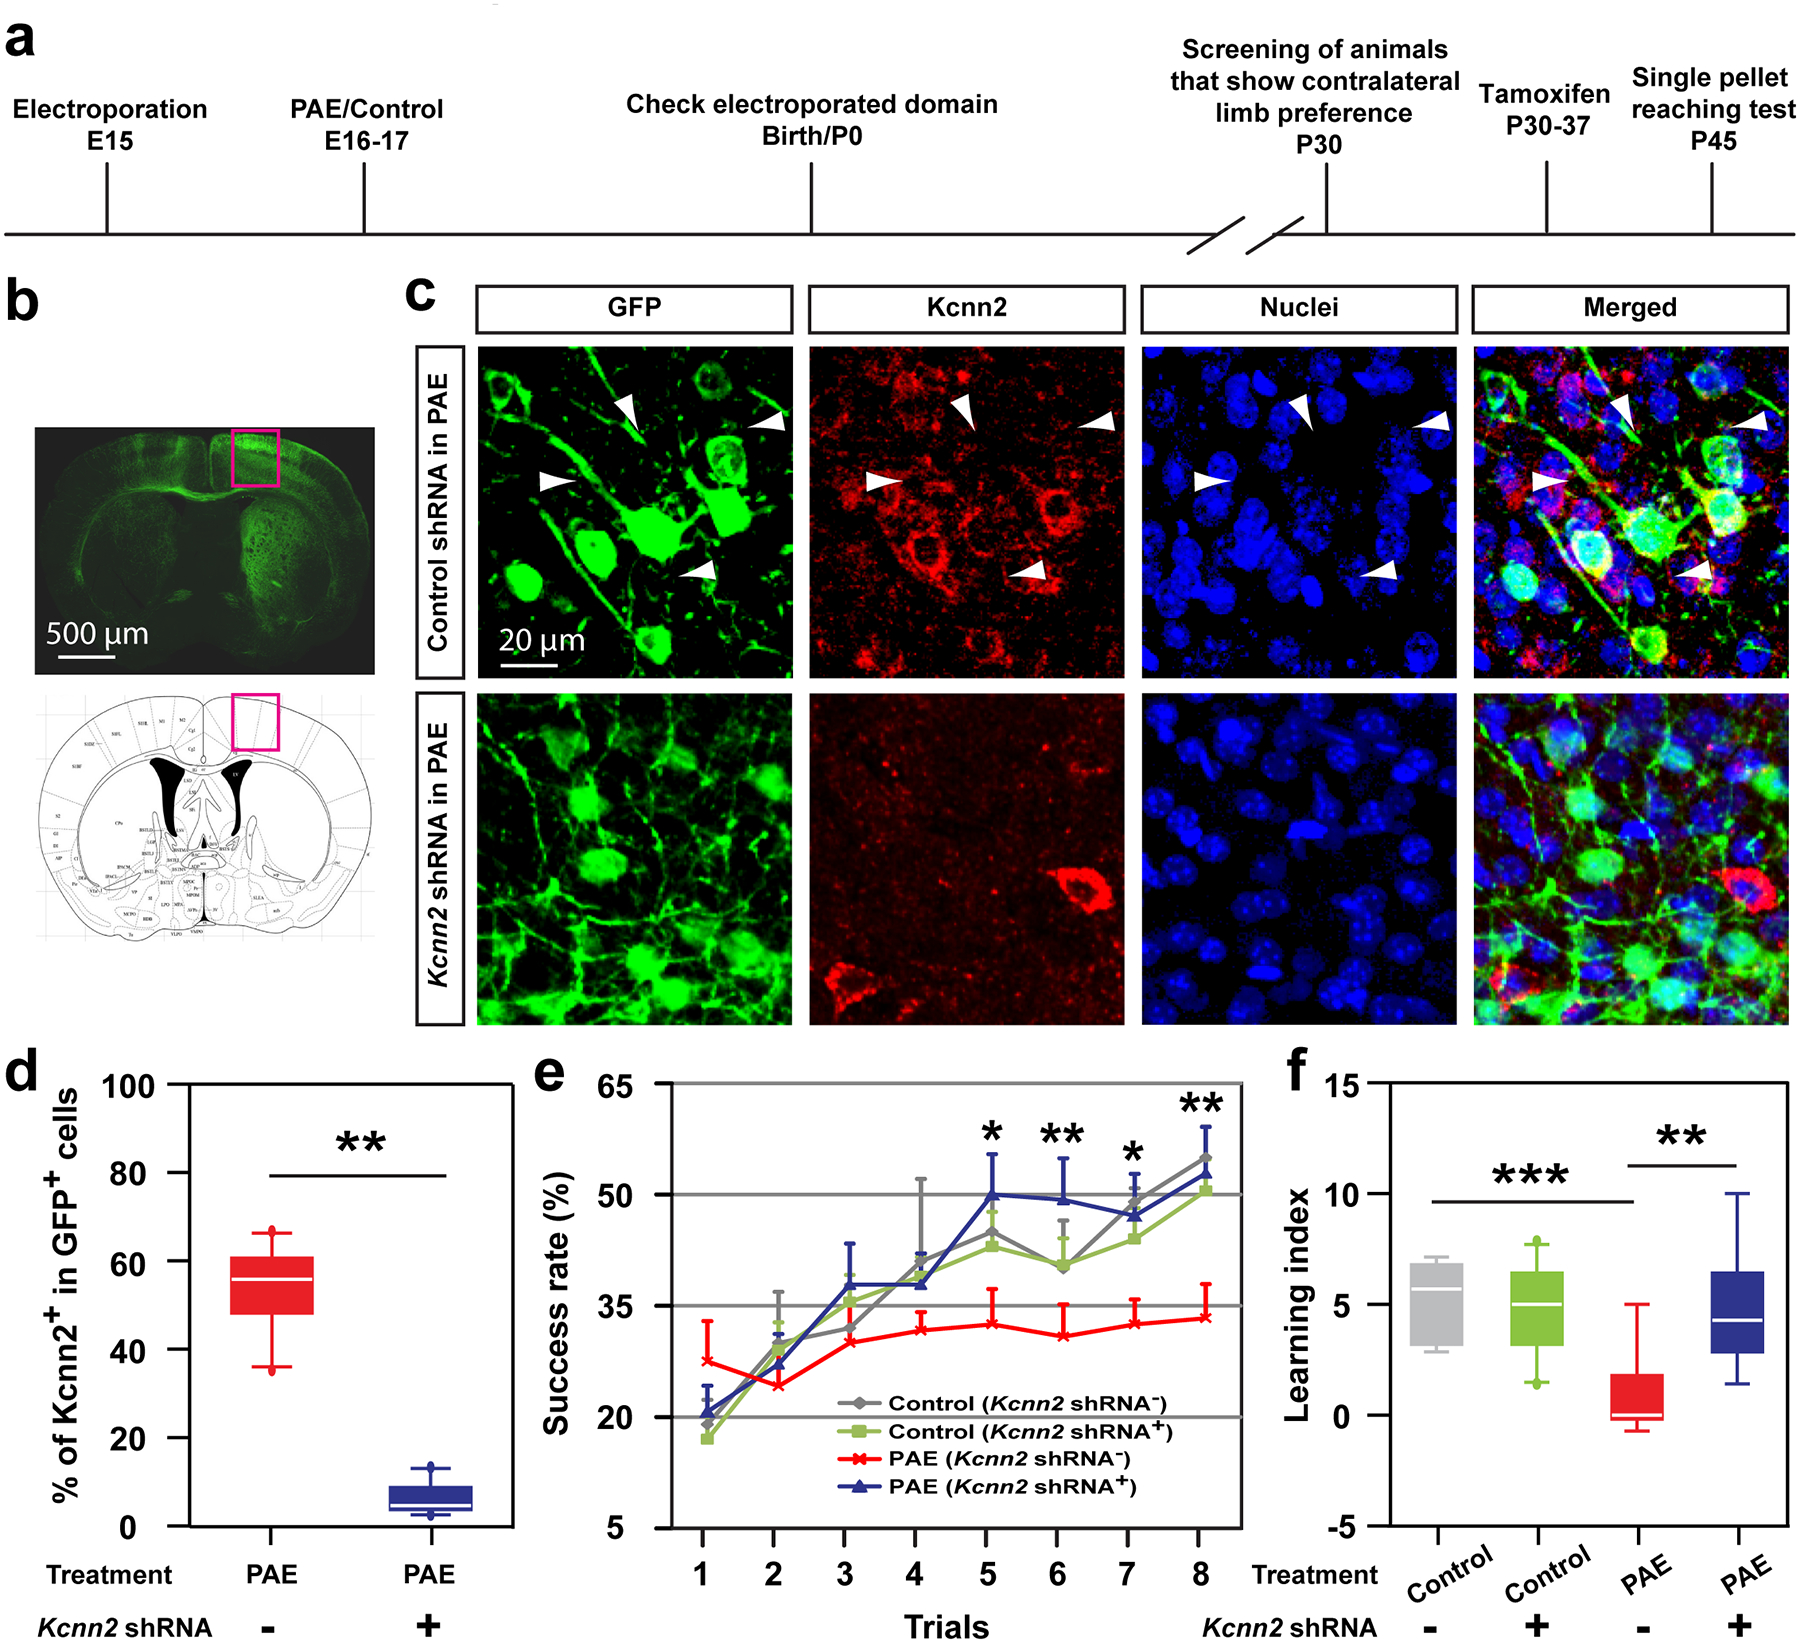
a) Timeline of the experiment. (b) Representative image of a brain that received Kcnn2 (or control) knockdown (visualized by co-expressed GFP) in the motor area (outlined by red rectangles). (c) Immunohistochemistry for Kcnn2 (red) shows that Kcnn2 shRNA, but not control shRNA, suppresses the increase in Kcnn2 expression in layer III neurons in M1 in PAE mice. Arrowheads indicate Kcnn2+ cells among GFP+ electroporated cells. (d) Percentage of Kcnn2+ cells among GFP+ electroporated cells in the indicated experimental groups. **P = 0.001 by two-tailed Student’s t-test (n = 10 per group). (e, f) Motor learning deficits in PAE mice, revealed by lower success rate (e) and learning index (f) in the single pellet reaching test, are mitigated by Kcnn2 knockdown in layer II/III neurons in M1. A significant interaction was observed between the effects of condition (treatment plus shRNA) and trial (e); F(1,11) = 2.80, P = 0.01 by two-way repeated measures ANOVA, *P < 0.05, **P < 0.01 by simple main effect test [PAE (Kcnn2 shRNA−) vs PAE (Kcnn2 shRNA+)], and between treatment and shRNA (f); F(1,24) = 5.55, P = 0.03 by two-way ANOVA, **P < 0.05, ***P < 0.005 by simple main effect test (n = 10 animals per group). Graph shows mean ± SEM. In box plots (d, f), the line within the box indicates the median, and the upper and lower edges of the box represent the 25th and 75th percentiles, respectively. The upper and lower whisker boundaries indicate the 10th and 90th percentiles, respectively, and dots indicate outliers.
Supplementary Material
Supplementary Table 1. List of the entire gene sets detected by single-cell RNA-sequencing
Supplementary Table 2. ROKU ranking of single-cell RNA-sequencing data of reporter+ neurons. Ranking of gene expression specificity in reporter+ cell population in PAE mice.
Supplementary Table 3. List of the genes in Fig. 2h and i
Supplementary Table 4. List of the genes classified into gene modules defined by WGCNA
Supplementary Table 5. Reporter+ cell-specific genes defined by both WGCNA and ROKU
Supplementary Table 6. ROKU ranking of single-cell RNA-sequencing data of reporter- neurons in PAE mice. Ranking of gene expression specificity in reporter- cell population in PAE mice.
Supplementary Table 7. ROKU ranking of single-cell RNA-sequencing data of reporter- neurons in control mice. Ranking of gene expression specificity in reporter- cell population in control (PBS-exposed) mice.
Acknowledgements
We thank Abdul Wafa Syed and Shivaprasad Bhuvanendran for technical assistance. We also thank Dr. Alexander I. Son for critical reading of the manuscript. This work was supported by National Institute of Health Grants R01AA025215 (to K.H.-T.), R01AA026272 (to M.T. and K.H.-T.), and UH2AA026106 as part of the Collaborative Initiative on Fetal Alcohol Spectrum Disorders (CIFASD)(to K.H.-T. and M.T.). The study was also funded by Scott-Gentle Foundation (to K.H.-T. and M.T.). This study was supported by Award Number 1U54HD090257-01 from the NIH, District of Columbia Intellectual and Developmental Disabilities Research Center Award (DC-IDDRC) program.
Footnotes
Code availability
Codes are available from the authors upon reasonable request and with permission of the Children’s National Institutional Review Board.
Competing Interests Statement
K.H-T., M.T. and S.M. are founders of Cogthera LLC, a biotechnology company with a mission to develop SK2 blockers for neurocognitive disorders.
References
- 1.Sakurai T et al. Converging models of schizophrenia--Network alterations of prefrontal cortex underlying cognitive impairments. Prog. Neurobiol 134, 178–201 (2015). [DOI] [PMC free article] [PubMed] [Google Scholar]
- 2.Thompson BL, Levitt P & Stanwood GD Prenatal exposure to drugs: effects on brain development and implications for policy and education. Nat. Rev. Neurosci 10, 303–312 (2009). [DOI] [PMC free article] [PubMed] [Google Scholar]
- 3.Grandjean P & Landrigan PJ Developmental neurotoxicity of industrial chemicals. Lancet 368, 2167–2178 (2006). [DOI] [PubMed] [Google Scholar]
- 4.May PA et al. Prevalence of Fetal Alcohol Spectrum Disorders in 4 US Communities. JAMA 319, 474–482 (2018). [DOI] [PMC free article] [PubMed] [Google Scholar]
- 5.Diamond A & Lee EY Inability of five-month-old infants to retrieve a contiguous object: a failure of conceptual understanding or of control of action? Child Dev 71, 1477–1494 (2000). [DOI] [PubMed] [Google Scholar]
- 6.Streissguth AP, Barr HM & Sampson PD Moderate prenatal alcohol exposure: effects on child IQ and learning problems at age 7 1/2 years. Alcohol. Clin. Exp. Res 14, 662–669 (1990). [DOI] [PubMed] [Google Scholar]
- 7.Hashimoto-Torii K et al. Roles of heat shock factor 1 in neuronal response to fetal environmental risks and its relevance to brain disorders. Neuron 82, 560–572 (2014). [DOI] [PMC free article] [PubMed] [Google Scholar]
- 8.Torii M et al. Detection of vulnerable neurons damaged by environmental insults in utero. Proc. Natl. Acad. Sci. U.S.A 114, 2367–2372 (2017). [DOI] [PMC free article] [PubMed] [Google Scholar]
- 9.Hashimoto-Torii K, Kawasawa YI, Kuhn A & Rakic P Combined transcriptome analysis of fetal human and mouse cerebral cortex exposed to alcohol. Proc. Natl. Acad. Sci. U.S.A 108, 4212–4217 (2011). [DOI] [PMC free article] [PubMed] [Google Scholar]
- 10.Ishii S et al. Variations in brain defects result from cellular mosaicism in the activation of heat shock signalling. Nat Commun 8, 15157 (2017). [DOI] [PMC free article] [PubMed] [Google Scholar]
- 11.Akerfelt M, Morimoto RI & Sistonen L Heat shock factors: integrators of cell stress, development and lifespan. Nat. Rev. Mol. Cell Biol 11, 545–555 (2010). [DOI] [PMC free article] [PubMed] [Google Scholar]
- 12.Ishii S & Hashimoto-Torii K Impact of prenatal environmental stress on cortical development. Front Cell Neurosci 9, 207 (2015). [DOI] [PMC free article] [PubMed] [Google Scholar]
- 13.El Fatimy R et al. Heat shock factor 2 is a stress-responsive mediator of neuronal migration defects in models of fetal alcohol syndrome. EMBO Mol Med 6, 1043–1061 (2014). [DOI] [PMC free article] [PubMed] [Google Scholar]
- 14.Lämke J, Brzezinka K, Altmann S & Bäurle I A hit-and-run heat shock factor governs sustained histone methylation and transcriptional stress memory. EMBO J 35, 162–175 (2016). [DOI] [PMC free article] [PubMed] [Google Scholar]
- 15.Bayer SA & Altman J Neocortical development vol. 1 (Raven Press; New York, 1991). [Google Scholar]
- 16.Molyneaux BJ, Arlotta P, Menezes JRL & Macklis JD Neuronal subtype specification in the cerebral cortex. Nat. Rev. Neurosci 8, 427–437 (2007). [DOI] [PubMed] [Google Scholar]
- 17.Tan X & Shi S-H Neocortical neurogenesis and neuronal migration. Wiley Interdiscip Rev Dev Biol 2, 443–459 (2013). [DOI] [PMC free article] [PubMed] [Google Scholar]
- 18.Gupta A, Tsai L-H & Wynshaw-Boris A Life is a journey: a genetic look at neocortical development. Nat. Rev. Genet 3, 342–355 (2002). [DOI] [PubMed] [Google Scholar]
- 19.Rash BG & Grove EA Area and layer patterning in the developing cerebral cortex. Curr. Opin. Neurobiol 16, 25–34 (2006). [DOI] [PubMed] [Google Scholar]
- 20.Marzban H et al. Cellular commitment in the developing cerebellum. Front Cell Neurosci 8, 450 (2014). [DOI] [PMC free article] [PubMed] [Google Scholar]
- 21.Heck DH, Roy S, Xie N & Waters RS Prenatal alcohol exposure delays acquisition and use of skilled reaching movements in juvenile rats. Physiol. Behav 94, 540–544 (2008). [DOI] [PubMed] [Google Scholar]
- 22.Amos-Kroohs RM et al. Abnormal Eating Behaviors Are Common in Children with Fetal Alcohol Spectrum Disorder. J. Pediatr 169, 194–200.e1 (2016). [DOI] [PMC free article] [PubMed] [Google Scholar]
- 23.Padmashri R, Reiner BC, Suresh A, Spartz E & Dunaevsky A Altered structural and functional synaptic plasticity with motor skill learning in a mouse model of fragile X syndrome. J. Neurosci 33, 19715–19723 (2013). [DOI] [PMC free article] [PubMed] [Google Scholar]
- 24.Xu T et al. Rapid formation and selective stabilization of synapses for enduring motor memories. Nature 462, 915–919 (2009). [DOI] [PMC free article] [PubMed] [Google Scholar]
- 25.Esposito MS, Capelli P & Arber S Brainstem nucleus MdV mediates skilled forelimb motor tasks. Nature 508, 351–356 (2014). [DOI] [PubMed] [Google Scholar]
- 26.Niwa M et al. Knockdown of DISC1 by in utero gene transfer disturbs postnatal dopaminergic maturation in the frontal cortex and leads to adult behavioral deficits. Neuron 65, 480–489 (2010). [DOI] [PMC free article] [PubMed] [Google Scholar]
- 27.Tabata H & Nakajima K Labeling embryonic mouse central nervous system cells by in utero electroporation. Dev. Growth Differ 50, 507–511 (2008). [DOI] [PubMed] [Google Scholar]
- 28.Delatour LC, Yeh PW & Yeh HH Ethanol Exposure In Utero Disrupts Radial Migration and Pyramidal Cell Development in the Somatosensory Cortex. Cereb. Cortex 29, 2125–2139 (2019). [DOI] [PMC free article] [PubMed] [Google Scholar]
- 29.Qiu S et al. Single-neuron RNA-Seq: technical feasibility and reproducibility. Front Genet 3, 124 (2012). [DOI] [PMC free article] [PubMed] [Google Scholar]
- 30.van den Brink SC et al. Single-cell sequencing reveals dissociation-induced gene expression in tissue subpopulations. Nat. Methods 14, 935–936 (2017). [DOI] [PubMed] [Google Scholar]
- 31.Kadota K, Ye J, Nakai Y, Terada T & Shimizu K ROKU: a novel method for identification of tissue-specific genes. BMC Bioinformatics 7, 294 (2006). [DOI] [PMC free article] [PubMed] [Google Scholar]
- 32.Geschwind DH & Konopka G Neuroscience in the era of functional genomics and systems biology. Nature 461, 908–915 (2009). [DOI] [PMC free article] [PubMed] [Google Scholar]
- 33.Vancassel S et al. Plasma fatty acid levels in autistic children. Prostaglandins Leukot. Essent. Fatty Acids 65, 1–7 (2001). [DOI] [PubMed] [Google Scholar]
- 34.Najmabadi H et al. Deep sequencing reveals 50 novel genes for recessive cognitive disorders. Nature 478, 57–63 (2011). [DOI] [PubMed] [Google Scholar]
- 35.Krishnan A et al. Genome-wide prediction and functional characterization of the genetic basis of autism spectrum disorder. Nat. Neurosci 19, 1454–1462 (2016). [DOI] [PMC free article] [PubMed] [Google Scholar]
- 36.Lin MT, Luján R, Watanabe M, Adelman JP & Maylie J SK2 channel plasticity contributes to LTP at Schaffer collateral-CA1 synapses. Nat. Neurosci 11, 170–177 (2008). [DOI] [PMC free article] [PubMed] [Google Scholar]
- 37.Pedarzani P et al. Tamapin, a venom peptide from the Indian red scorpion (Mesobuthus tamulus) that targets small conductance Ca2+-activated K+ channels and afterhyperpolarization currents in central neurons. J. Biol. Chem 277, 46101–46109 (2002). [DOI] [PubMed] [Google Scholar]
- 38.Abel HJ, Lee JCF, Callaway JC & Foehring RC Relationships between intracellular calcium and afterhyperpolarizations in neocortical pyramidal neurons. J. Neurophysiol 91, 324–335 (2004). [DOI] [PubMed] [Google Scholar]
- 39.Bean BP The action potential in mammalian central neurons. Nat. Rev. Neurosci 8, 451–465 (2007). [DOI] [PubMed] [Google Scholar]
- 40.Sun J et al. UBE3A Regulates Synaptic Plasticity and Learning and Memory by Controlling SK2 Channel Endocytosis. Cell Rep 12, 449–461 (2015). [DOI] [PMC free article] [PubMed] [Google Scholar]
- 41.Baudry M et al. Ampakines promote spine actin polymerization, long-term potentiation, and learning in a mouse model of Angelman syndrome. Neurobiol. Dis 47, 210–215 (2012). [DOI] [PMC free article] [PubMed] [Google Scholar]
- 42.Chen L et al. SK channel blockade reverses cognitive and motor deficits induced by nigrostriatal dopamine lesions in rats. Int. J. Neuropsychopharmacol 17, 1295–1306 (2014). [DOI] [PubMed] [Google Scholar]
- 43.Lam J, Coleman N, Garing ALA & Wulff H The therapeutic potential of small-conductance KCa2 channels in neurodegenerative and psychiatric diseases. Expert Opin. Ther. Targets 17, 1203–1220 (2013). [DOI] [PMC free article] [PubMed] [Google Scholar]
- 44.Beggs JM & Plenz D Neuronal avalanches in neocortical circuits. J. Neurosci 23, 11167–11177 (2003). [DOI] [PMC free article] [PubMed] [Google Scholar]
- 45.Iwawaki T et al. Transgenic mouse model for imaging of ATF4 translational activation-related cellular stress responses in vivo. Scientific Reports 7, 46230 (2017). [DOI] [PMC free article] [PubMed] [Google Scholar]
- 46.Oikawa D, Akai R, Tokuda M & Iwawaki T A transgenic mouse model for monitoring oxidative stress. Sci Rep 2, (2012). [DOI] [PMC free article] [PubMed] [Google Scholar]
- 47.Disterhoft JF & Oh MM Learning, aging and intrinsic neuronal plasticity. Trends Neurosci 29, 587–599 (2006). [DOI] [PubMed] [Google Scholar]
- 48.Strassmaier T et al. A novel isoform of SK2 assembles with other SK subunits in mouse brain. J. Biol. Chem 280, 21231–21236 (2005). [DOI] [PubMed] [Google Scholar]
- 49.Cholewa-Waclaw J et al. The Role of Epigenetic Mechanisms in the Regulation of Gene Expression in the Nervous System. J. Neurosci 36, 11427–11434 (2016). [DOI] [PMC free article] [PubMed] [Google Scholar]
- 50.Ostrea EM et al. Fatty acid ethyl esters in meconium: are they biomarkers of fetal alcohol exposure and effect? Alcohol. Clin. Exp. Res 30, 1152–1159 (2006). [DOI] [PMC free article] [PubMed] [Google Scholar]
- 51.Hashimoto-Torii K et al. Interaction between Reelin and Notch signaling regulates neuronal migration in the cerebral cortex. Neuron 60, 273–284 (2008). [DOI] [PMC free article] [PubMed] [Google Scholar]
- 52.Torii M & Levitt P Dissociation of corticothalamic and thalamocortical axon targeting by an EphA7-mediated mechanism. Neuron 48, 563–575 (2005). [DOI] [PubMed] [Google Scholar]
- 53.Raymond CS & Soriano P High-efficiency FLP and PhiC31 site-specific recombination in mammalian cells. PLoS ONE 2, e162 (2007). [DOI] [PMC free article] [PubMed] [Google Scholar]
- 54.Matsuda T & Cepko CL Electroporation and RNA interference in the rodent retina in vivo and in vitro. Proc. Natl. Acad. Sci. U.S.A 101, 16–22 (2004). [DOI] [PMC free article] [PubMed] [Google Scholar]
- 55.Yang T et al. Small-Conductance Ca2+-Activated Potassium Channels Negatively Regulate Aldosterone Secretion in Human Adrenocortical Cells. Hypertension 68, 785–795 (2016). [DOI] [PMC free article] [PubMed] [Google Scholar]
- 56.Langmead B, Trapnell C, Pop M & Salzberg SL Ultrafast and memory-efficient alignment of short DNA sequences to the human genome. Genome Biol 10, R25 (2009). [DOI] [PMC free article] [PubMed] [Google Scholar]
- 57.Kim D et al. Tophat2: Accurate Alignment of Transcriptomes in the Presence of Insertions, Deletions and Gene Fusions. Genome biology 14, R36 (2013). [DOI] [PMC free article] [PubMed] [Google Scholar]
- 58.Trapnell C et al. Transcript assembly and quantification by RNA-Seq reveals unannotated transcripts and isoform switching during cell differentiation. Nat. Biotechnol 28, 511–515 (2010). [DOI] [PMC free article] [PubMed] [Google Scholar]
- 59.Anders S & Huber W Differential expression analysis for sequence count data. Genome Biol 11, R106 (2010). [DOI] [PMC free article] [PubMed] [Google Scholar]
- 60.Langfelder P & Horvath S WGCNA: an R package for weighted correlation network analysis. BMC Bioinformatics 9, 559 (2008). [DOI] [PMC free article] [PubMed] [Google Scholar]
- 61.Langfelder P & Horvath S Fast R Functions for Robust Correlations and Hierarchical Clustering. J Stat Softw 46, (2012). [PMC free article] [PubMed] [Google Scholar]
- 62.Bindea G et al. ClueGO: a Cytoscape plug-in to decipher functionally grouped gene ontology and pathway annotation networks. Bioinformatics 25, 1091–1093 (2009). [DOI] [PMC free article] [PubMed] [Google Scholar]
- 63.Takeuchi K et al. Serotonin-2C receptor involved serotonin-induced Ca2+ mobilisations in neuronal progenitors and neurons in rat suprachiasmatic nucleus. Scientific Reports 4, 4106 (2014). [DOI] [PMC free article] [PubMed] [Google Scholar]
- 64.Zonouzi M et al. GABAergic regulation of cerebellar NG2 cell development is altered in perinatal white matter injury. Nat. Neurosci 18, 674–682 (2015). [DOI] [PMC free article] [PubMed] [Google Scholar]
- 65.Shiotsuki H et al. A rotarod test for evaluation of motor skill learning. J. Neurosci. Methods 189, 180–185 (2010). [DOI] [PubMed] [Google Scholar]
- 66.Li W, Ma L, Yang G & Gan W-B REM sleep selectively prunes and maintains new synapses in development and learning. Nat. Neurosci 20, 427–437 (2017). [DOI] [PMC free article] [PubMed] [Google Scholar]
- 67.Yang G et al. Sleep promotes branch-specific formation of dendritic spines after learning. Science 344, 1173–1178 (2014). [DOI] [PMC free article] [PubMed] [Google Scholar]
- 68.Ma L et al. Experience-dependent plasticity of dendritic spines of layer 2/3 pyramidal neurons in the mouse cortex. Dev Neurobiol 76, 277–286 (2016). [DOI] [PMC free article] [PubMed] [Google Scholar]
- 69.Wang L et al. Modulation of social deficits and repetitive behaviors in a mouse model of autism: the role of the nicotinic cholinergic system. Psychopharmacology (Berl.) 232, 4303–4316 (2015). [DOI] [PubMed] [Google Scholar]
- 70.Chen C-C, Gilmore A & Zuo Y Study motor skill learning by single-pellet reaching tasks in mice. J Vis Exp (2014) doi: 10.3791/51238. [DOI] [PMC free article] [PubMed] [Google Scholar]
- 71.Hodges JL et al. Astrocytic Contributions to Synaptic and Learning Abnormalities in a Mouse Model of Fragile X Syndrome. Biol. Psychiatry 82, 139–149 (2017). [DOI] [PMC free article] [PubMed] [Google Scholar]
Associated Data
This section collects any data citations, data availability statements, or supplementary materials included in this article.
Supplementary Materials
Supplementary Table 1. List of the entire gene sets detected by single-cell RNA-sequencing
Supplementary Table 2. ROKU ranking of single-cell RNA-sequencing data of reporter+ neurons. Ranking of gene expression specificity in reporter+ cell population in PAE mice.
Supplementary Table 3. List of the genes in Fig. 2h and i
Supplementary Table 4. List of the genes classified into gene modules defined by WGCNA
Supplementary Table 5. Reporter+ cell-specific genes defined by both WGCNA and ROKU
Supplementary Table 6. ROKU ranking of single-cell RNA-sequencing data of reporter- neurons in PAE mice. Ranking of gene expression specificity in reporter- cell population in PAE mice.
Supplementary Table 7. ROKU ranking of single-cell RNA-sequencing data of reporter- neurons in control mice. Ranking of gene expression specificity in reporter- cell population in control (PBS-exposed) mice.
Data Availability Statement
All raw data and processed data of RNA sequencing are available (GSE141714). Other Data are available from the authors upon reasonable request and with permission of the Children’s National Institutional Review Board.


