

Abstract
Introduction
Disruption of metabolic function is a recognized feature of late onset Alzheimer's disease (LOAD). We sought to determine whether similar metabolic pathways are implicated in adults with Down syndrome (DS) who have increased risk for Alzheimer's disease (AD).
Methods
We examined peripheral blood from 292 participants with DS who completed baseline assessments in the Alzheimer's Biomarkers Consortium–Down Syndrome (ABC‐DS) using untargeted mass spectrometry (MS). Our sample included 38 individuals who met consensus criteria for AD (DS‐AD), 43 who met criteria for mild cognitive impairment (DS‐MCI), and 211 who were cognitively unaffected and stable (CS).
Results
We measured relative abundance of 8,805 features using MS and 180 putative metabolites were differentially expressed (DE) among the groups at false discovery rate‐corrected q< 0.05. From the DE features, a nine‐feature classifier model classified the CS and DS‐AD groups with receiver operating characteristic area under the curve (ROC AUC) of 0.86 and a two‐feature model classified the DS‐MCI and DS‐AD groups with ROC AUC of 0.88. Metabolite set enrichment analysis across the three groups suggested alterations in fatty acid and carbohydrate metabolism.
Discussion
Our results reveal metabolic alterations in DS‐AD that are similar to those seen in LOAD. The pattern of results in this cross‐sectional DS cohort suggests a dynamic time course of metabolic dysregulation which evolves with clinical progression from non‐demented, to MCI, to AD. Metabolomic markers may be useful for staging progression of DS‐AD.
Keywords: Alzheimer's disease, carbohydrate metabolism, Down syndrome, energy metabolism, fatty acid metabolism, lipid metabolism, metabolism, metabolomics, mild cognitive impairment
1. INTRODUCTION
Down syndrome (DS) is the most common neurodevelopmental disorder, affecting more than 250,000 individuals in the United States. 1 The syndrome is characterized by triplication of the 21st chromosome (Ch21) which contains the APP gene encoding the amyloid precursor protein (APP). 2 Overexpression of APP results in accelerated amyloid beta (Aβ) accumulation, leading to the development of the hallmark neuropathology of Alzheimer's disease (AD) in most individuals with DS by age 40. 3 , 4 , 5 Despite the same genetic risk for AD neuropathology from birth, age at onset of AD clinical symptoms varies across individuals with DS, with some showing cognitive impairment as early as the mid 30s while others maintain cognitive stability until their early 70s. 6 This strongly suggests that factors in addition to increasing Aβ accumulation are involved in individual trajectories of AD in DS (DS‐AD).
Several metabolic pathways have been implicated as modifiers of AD risk in the neurotypical population including inflammation and immune response, 7 oxidative stress, 8 lipid metabolism, 9 and single carbon metabolism. 10 Alterations in these same metabolic pathways are also characteristic of people with DS and there is growing appreciation of the role of inflammation, 11 oxidative stress, 12 , 13 and lipid and energy metabolism 14 , 15 , 16 as risk factors for cognitive decline and dementia in adults with DS. Several genes on Ch21 including S100β, SOD1, PIGP, and BACH1 are linked to these metabolic pathways and may also contribute to DS‐AD risk beyond that directly due to Aβ accumulation. Further, early accumulation of Aβ may lead to dysregulation of these and other pathways, which may modify individual DS‐AD trajectories in ways to accelerate or delay symptom onset. Deep metabolomic analysis of people with DS can capture alterations in these and other metabolic pathways that serve to modify trajectories of risk and resilience.
There is now great interest in developing early biomarkers of preclinical AD to identify those at highest risk for developing late onset Alzheimer's disease (LOAD) and to determine when to intervene when effective therapies become available. 17 , 18 , 19 To date, most fluid DS‐AD biomarker investigations have focused on traditional biomarkers obtained from blood or cerebrospinal fluid (CSF) that characterize the proteopathy required for neuropathological diagnosis, namely Aβ1‐42, total tau, and phospho‐tau. 20 , 21 , 22 , 23 , 24 , 25 However, other studies in DS have shown promising results for novel biomarkers such as the neurofilament light chain (NF‐L) protein 26 , 27 and markers of inflammation. 28 Regarding Aβ, results from blood biomarker studies generally show higher Aβ levels in people with DS compared to neurotypical controls, 29 but the relationship between Aβ and DS‐AD is inconsistent. 30 Many studies show higher Aβ levels in DS‐AD relative to non‐demented individuals with DS 20 , 23 , 25 , 31 but others show lower levels. 31 , 32 With the overexpression of APP from birth, Aβ levels may not be as informative for diagnosis or predicting onset of clinical symptoms in DS as in the neurotypical population. Given that most people with DS will develop AD, the main role of a biomarker (or combination of biomarkers) is to inform when symptoms are most likely to begin.
Metabolomic analysis may be ideally suited to answering this question in the case of DS‐AD because the time course of biological processes measured by metabolomic analysis is much shorter than proteomic, transcriptomic, and genomic or epigenomic levels and thus may be a more accurate representation of the current phenotypic state. 33 Furthermore, because small molecule end products of metabolism are most proximate to the clinical phenotype, they may more accurately reflect small changes in pathobiology that affect the phenotype. 34
To date, there have been some metabolomic biomarker studies applied to DS and most have focused on characterizing the metabolome of younger individuals with DS, including children. 35 Caracausi et al. found increased levels of key metabolites involved in mitochondrial metabolism including pyruvate, succinate, fumarate, lactate, and formate, that were generally consistent with the 3:2 gene dosage model of trisomy21. 36 These findings in a pediatric DS sample are provocative because they suggest chronic alterations of cellular energy metabolism in DS, which may contribute to Aβ accumulation and produce individual trajectories of DS‐AD over the lifespan.
In a cross‐sectional study, Borelli et al. found overall hypogalactosylation in adults with DS (age range: 10–58 years, median age = 26) compared to non‐DS controls (age range 12–52 years, median age = 31), but an age‐related increase in several glycomic features suggesting accelerated aging in DS. 36 These results suggest that glycosylation may be associated with an aging phenotype in DS that only partially overlaps with aging in neurotypical individuals. They also suggest that altered glycosylation may be associated with DS‐AD, given the age‐related risk of DS‐AD. However, this study did not examine this directly.
In a third study by our group, 37 we used untargeted metabolomics to examine metabolic pathways in adults with DS and DS‐AD. We found higher levels of lactate, pyruvic acid, and methyladipic acid in addition to lower levels of uridine in the participants with DS‐AD relative to participants with DS, but without AD. We consider these findings in adults with DS‐AD an extension of those from Caracausi et al. in children with DS. Together, both studies suggest that disruption of energy metabolism, particularly mitochondrial metabolism, is a prominent feature of DS and DS‐AD.
Here, we sought to examine the metabolic differences that characterize stages of cognitive and functional impairment over the course of DS‐AD, from cognitively stable, to mild cognitive impairment (MCI), to DS‐AD. We hypothesized that the pathobiology of DS‐AD and LOAD overlap significantly in a final common pathway that includes cellular energy metabolism. We predicted that metabolic alterations of DS‐AD progression would be similar to those seen in LOAD.
2. METHODS
2.1. Participants
All participants for this study were enrolled in Alzheimer's Biomarkers Consortium‐Down Syndrome (ABC‐DS; https://www.nia.nih.gov/research/abc-ds), a multi‐site, longitudinal cohort study of adults with DS over age 25. The ABC‐DS is designed to discover biomarkers of DS‐AD at eight clinical performance sites including The University of California Irvine, Columbia University Irving Medical Center, The Institute for Basic Research in Developmental Disabilities, Massachusetts General Hospital, The University of Wisconsin‐Madison, The University of Pittsburgh, Barrow Institute, and Cambridge University (UK). All ABC‐DS participants undergo deep clinical and cognitive phenotyping, neuroimaging including positron emission tomography (PET) amyloid and tau and structural and functional magnetic resonance imaging (MRI), and CSF and blood collection at 16‐month intervals. All ABC‐DS protocols and procedures are approved by the respective local clinical performance site Institutional Review Boards. Informed consent is obtained from all participants where possible, otherwise assent is obtained from the participant and informed consent obtained from the participant's proxy or legally authorized representative.
RESEARCH IN CONTEXT
Systematic review: The authors reviewed the literature on the relationship between markers of metabolism found in peripheral blood and dementia status in adults with Down syndrome (DS) using traditional sources including PubMed, GoogleScholar, and ResearchGate. We found very few published studies directly addressing the metabolic characteristics of mild cognitive impairment and clinical Alzheimer's disease (AD) in adults with DS. Several studies examined metabolism in children with DS, but did not directly address AD. We felt this is a neglected area of study given the strong risk for AD in adults with DS.
Interpretation: We found strong evidence of fatty acid and cellular energy metabolic differences which might underlie AD‐related clinical and cognitive decline in people with DS.
Future directions: These findings call for a prospective study to examine within‐individual longitudinal changes in metabolism that may be useful for understanding the evolution of AD in people with DS.
A total of 353 adults with DS were enrolled in ABC‐DS at the time of the Wave I data freeze (January 15, 2019) and 329 had (1) sufficient data to make a clinical consensus decision and (2) a blood sample for analysis. The 329 DS participants were classified into four non‐overlapping groups by expert ABC‐DS clinicians who considered all available clinical and cognitive measures.
We classified participants into four groups, generally consistent with the recommendations of the AAMR‐IASSID Working Group for the Establishment of Criteria for the Diagnosis of Dementia in Individuals with Developmental Disability. 39 , 40 Participants were classified as cognitively unaffected and stable (CS) if there was no evidence of clinically significantly cognitive or functional decline from baseline based on caregiver report and medical record review. We classified participants as mild cognitive impairment (DS‐MCI) if they had shown some cognitive and/or functional decline over and above what would be expected with aging per se, but not severe enough to indicate the presence of DS‐AD. Participants were classified as DS‐AD if there was evidence of substantial decline in cognitive function and activities of daily living compared to caregiver‐reported baseline and medical record review. Finally, we classified individuals with cognitive and functional impairment that could be better explained by changes in life circumstance (eg, staff changes, bereavement) or medical conditions unrelated to AD (eg, severe sensory loss, chronic pain, psychiatric diagnosis, seizure disorder) as “unable to determine” and these participants were excluded from this study. The consensus conference was able to confidently classify 312 participants and unable to confidently classify 17 DS participants.
DNA samples were genotyped for two apolipoprotein (APOE) single‐nucleotide polymorphisms (SNPs; rs429358 and rs7412) with the kompetitve allele specific PCR (KASP) genotyping system (LGC Genomics). Genotype data for these two SNPs were used to define APOE ε2, ε3, and ε4 alleles. Participants with at least one copy of the APOE ε4 allele were classified as APOE ε4 carriers. A total of 20 participants were missing APOE data and were excluded from the analysis. In total, 292 DS participants had a consensus clinical classification, an available blood sample, and APOE status for inclusion in this study. Characteristics of the participants can be found in Table 1.
TABLE 1.
Participant characteristics
| N (M/F) | Age (SEM) | BMI (SEM) | % with ApoE ε4 * | |
|---|---|---|---|---|
| Cognitively unaffected and stable (CS) | 211 (109/102) | 42.16 (0.59) | 31.99 (0.5) | 21.3% (45/211) |
| Mild cognitive impairment (Down syndrome [DS]‐MCI) | 43 (30/13) | 52.21 (1.06) | 28.89 (0.95) | 34.9% (15/43) |
| Alzheimer's Disease (DS‐AD) | 38 (18/20) | 54.39 (0.93) | 30.15 (1.1) | 36.8% (14/38) |
The groups differed in proportion with ε4 (χ2 = 6.52, P < .05).
2.2. Blood collection and processing
All blood collection and processing methods were harmonized across all ABC‐DS sites. Venous blood was collected from the median cubital vein using standard venipuncture technique into a 10 mL ethylenediaminetetraacetic acid (EDTA; Lavender top) vacutainer blood collection tube. The EDTA tube was the first tube collected, followed by Sodium Heparin, Serum Separator, and PAXgene tubes. Given the general considerations of working with people with DS, we did not attempt to standardize blood collection procedures with regard to prescribed medication administration, prandial state, or time of day. After venipuncture, collection tubes were gently inverted 8 to 10 times, placed on wet ice, then centrifuged to separate the plasma component. Centrifugation took place in a chilled (4°C) centrifuge for 10 minutes at a site‐specific RPM equivalent to 2000 × g. The plasma fraction was aliquoted in 250 μL units to individual 500 μL siliconized cryovials, and stored at −80°C at local ABC‐DS clinical performance sites. Time from blood draw to storage at −80° was estimated to be <3 hours. The vials were shipped from the local ABC‐DS sites on dry ice via overnight courier to the National Cell Repository for Alzheimer's Disease at Indiana University, where they were stored at −80° until sent in one shipment to the Lombardi Cancer Center Shared Resource Facility Metabolomics Core at Georgetown University for mass spectrometry (MS) analyses. The time in storage from blood draw to MS for all samples was <2 years.
2.3. Untargeted UPLC‐ESI‐QTOF‐MS metabolomics
We used ultra‐performance liquid chromatography electro‐spray ionization‐quadrupole‐time of flight‐mass spectrometry (UPLC‐ESI‐QTOF‐MS;Xevo‐G2 QTOF, Waters Corporation) based data acquisition for untargeted metabolomic profiling as described in our previous work. 9 , 38 , 41 , 42 Briefly, we prepared plasma samples for MS by solvent extraction and resolved using reverse phase chromatography on an Acquity UPLC (Waters Corp.) online with a QTOF‐MS in the positive and negative electrospray mode with optimized run parameters. A total of 8805 features (4790 ESI+ detection mode; 4015 ESI‐ detection mode) representing putative metabolites were identified by mass‐to‐charge ratio (m/z) and retention time (RT) after processing of raw spectral data using XCMS software. 42 We submitted these putative metabolites to differential expression (DE) analysis. A subset of relevant metabolites were identified using tandem MS.
3. STATISTICAL METHODS
3.1. Differential expression analysis of metabolite features
We used R version 3.6.1 and the limma package to assess DE of individual metabolites as a function of clinical status (CS/DS‐MCI/DS‐AD). Individual F‐statistics were derived for each metabolite feature passing quality control thresholding as we have implemented previously. 38 , 44 Because metabolomic abundance measurements are often positively skewed, we logarithm transformed abundance values prior to analysis consistent with other applications of surrogate variable analysis (SVA). 44 , 45 Resulting F‐test statistic P‐values were false discovery rate (FDR)‐corrected to reduce the multiple testing burden, resulting in a corresponding q‐value. 45 An FDR q < 0.05 was considered significantly DE. We quantified the magnitude of group‐wise DE as the logarithm of the group‐wise fold change provided by the limma function topTableF(). Because fold change is only capable of representing pairwise comparisons, we explicitly make note of the groups compared for the remainder of this article when necessary. We also explicitly indicate the reference condition (eg, CS, DS‐MCI) from which fold‐change comparisons are made.
3.2. Parametrization of nuisance variability in the peripheral metabolome
In addition to metabolite variability attributable to disease progression, the plasma metabolome is likely to reflect physiological processes and technical artefacts unrelated to neurological disease. This is a challenge because (1) these confounding factors have the potential to limit reproducibility of differential expression findings and (2) the identity and number of these variables may be incompletely known a priori. We have previously proposed and employed SVA to approximate these confounders (eg, due to sample age, analytical batch, medication status) in high‐dimensional metabolomic data. 38 , 44 , 47
We used the “be” method 47 to estimate a non‐zero number of surrogate variables which we included as covariates in further DE analyses conducted using limma (SVs = 25). Because APOE ε4 carrier status was significantly disproportionate among the three groups (χ2 = 6.52, P < .05), and ε4 may impact peripheral metabolic processes related to dementia in DS, 48 we explicitly directed SVA to consider the presence of this allele in fitting the 25 SVs obtained here.
3.3. Metabolite set enrichment analysis of LC‐MS metabolites
We used the Mummichog software library to generate statistical inferences regarding metabolic pathway alterations in the DS‐AD participants. 49 To minimize false positives, we used the most recent Mummichog 2 software, which enforces RT matching across putatively related mass features (personal communication; Dr. Shuzhao Li 9/2018). We specified instrument accuracy as 7 ppm. Significance thresholds for DE calling were selected over the list of all nominal P‐values generated by the preceding DE analysis. 49 In all comparisons for metabolite set enrichment analyses, we considered a nominal P‐value < .05 to be DE.
3.4. Machine learning classifier models for group prediction
We submitted all metabolite features found to be significantly DE at the q < .05 level per pairwise contrast to predictive modelling. To integrate surrogate variable derived information into our modelling analysis and maximally leverage available data, we took an empirical Bayesian approach (ie, empiricalBayesLM in the R package WGCNA) and residualized all metabolite abundances by their corresponding sample‐level loadings on each SV. This resulted in an augmented metabolite expression matrix free of nuisance variability attributable to each of the 25 SVs parametrized here. These data were further log transformed, quantile normalized, and adjusted to have unit variance and zero mean (ie, z‐scaled, autoscaled). 9 , 41 , 44
It is possible that choices in machine learning algorithm and resampling scheme selection may affect model performance in a way unrelated to underlying disease‐associated signal in the plasma metabolome. To address this, we evaluated several resampling schemes (ie, 10‐fold cross validation [CV], Monte Carlo CV) and algorithmic approaches (ie, least absolute shrinkage and selection operator [LASSO]‐regularized logistic regression, linear support vector machine [SVM]) in parallel. We evaluated classification performance quantitatively using receiver operating characteristic area under the curve (ROC AUC) statistics and qualitatively according to the distribution of prediction accuracy (Figure S1 in supporting information). In all cases, plotted ROC curves reflect testing/validation performance, as opposed to classification over the training data set, which is likely to yield overoptimistic estimates of model strength. 43 In the case of our modeling efforts contrasting DS‐MCI and DS‐AD, we found the FDR‐significant feature space to be small (ie, 17 features) and thus unsuitable for LASSO‐regularized variable selection. In this case, we prioritized a subset of these features using a linear SVM‐based approach. 50
3.5. Targeted LC‐MS/MS metabolomics
We used multiple reaction monitoring mass spectrometry (MRM MS/MS) targeted analysis of the putatively identified metabolites selected by LASSO and SVM feature selection algorithms. Briefly, we mixed plasma samples (25 μl) with 300 μl of methanol: chloroform (2:1). To this, we added 100 μl of water and chloroform, separately. The samples were vortexed and incubated on ice for 10 minutes. We centrifuged the samples at 13,000 rpm at 60°C for 15 minutes. The upper aqueous layer was transferred to a separate vial and dried under a stream of nitrogen. We reconstituted the samples in ACN:water (50:50) containing 1 μg/mL of internal standard (tyrosine‐15N). The supernatant was transferred to an MS vial and 5 μl of sample was used for analysis. The LC and MRM methods used in this study were optimized in the metabolomics core at Georgetown in collaboration with Sciex. The sample queue was randomized and solvent blanks were injected to assess sample carryover using four biological replicates for each comparative group.
4. RESULTS
4.1. Plasma metabolites are differentially expressed as a function of cognitive status
We identified 8,805 putative metabolites across negative and positive mode LC‐MS analyses. We found no DE features comparing the CS and DS‐MCI groups under the multiple testing correction (all FDR q > .05; Figure 1A). This contrast was consequently not considered a candidate for further classification modeling. However, a total of 180 features were DE at the FDR q < .05 level across the pairwise DS‐MCI versus DS‐AD, and CS versus DS‐AD contrasts (Figure 1 B&C).
FIGURE 1.
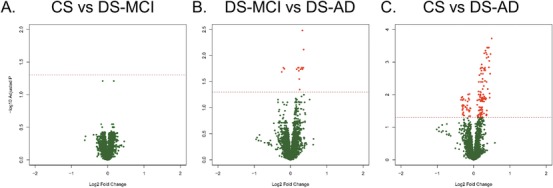
Differentially expressed metabolite features. Volcano plots showing differential expression (DE) of individual features for each of the three comparisons: cognitively unaffected and stable (CS) versus Down syndrome‐mild cognitive impairment (DS‐MCI; A), DS‐MCI versus Down syndrome‐Alzheimer's disease (DS‐AD; B), and CS versus DS‐AD (C). We enforced false discovery rate (FDR) q < 0.05, but no fold change criterion for DE. There were no DE features for the CS versus DS‐MCI comparison, 17 DE features for the DS‐MCI versus DS‐AD comparison, and 163 DE features for the CS versus DS‐AD comparison. The red horizontal line represents the cut‐off for FDR and red circles represent DE features in each plot
4.2. Differentially expressed metabolite features predict cognitive status
In the case of the DS‐AD versus CS contrast, 163 features FDR q < .05 were submitted to LASSO‐regularized regression modelling using 10‐fold CV. Considering only the subset of features selected over at least 50% of resampling epochs, the algorithm selected nine metabolites (Figure 2A), which were combined in a logistic regression classifier model. The 10‐fold CV of this model showed strong discrimination of the CS and DS‐AD groups (ROC AUC = 0.87, 95% confidence interval [CI] = 0.81–0.95). Sensitivity was 0.84 (95%CI = 0.84 ‐ 0.96) and specificity was 0.87 (95%CI = 0.83–0.92). This finding was confirmed by the more rigorous 100‐fold Monte Carlo CV (ROC AUC = 0.86, 95%CI = 0.73–0.94) and the alternative SVM modelling approach (ROC AUC = 0.87, 95%CI = 0.78‐0.94; Figure 3A). Classification accuracy for the 100‐fold Monte Carlo CV was 78.8% (Figure S1A).
FIGURE 2.
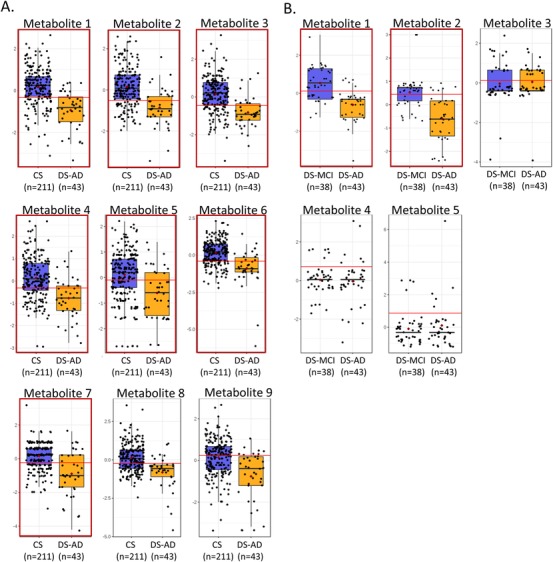
Features selected by the machine learning algorithms. This figure shows the group distributions of the nine features selected by the least absolute shrinkage selection operator (LASSO) feature selection algorithm for the cognitively unaffected and stable (CS) versus Down syndrome‐Alzheimer's disease (DS‐AD) comparison (A) and the five features selected by the support vector machine (SVM) for the Down syndrome‐mild cognitive impairment (DS‐MCI) versus DS‐AD comparison. The boxplots show the distribution of metabolite abundances for each group with each participant represented as a solid circle. The solid line in each box represents the median while the lower and upper boundaries of the box reflect the first and third quartiles. The whiskers reflect the minimum and maximum values. The horizontal red line in each panel represents the optimum cut‐off for sensitivity and specificity in a univariate receiver operating characteristic area under the curve (ROC AUC). Panels with red outlines are the metabolites definitively identified by MS/MS and are listed by name in Table 2. Panels without red outlines could not be definitively identified by MS/MS
FIGURE 3.
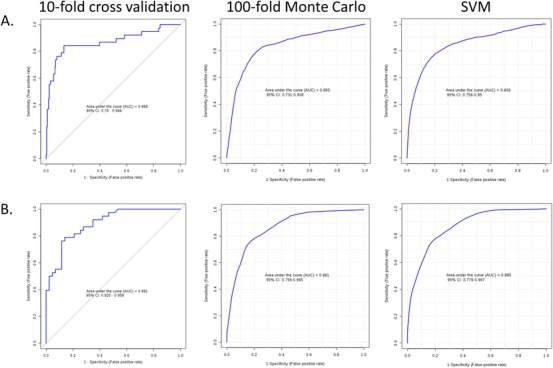
Classification performance using putative metabolites. Receiver operating characteristic area under the curve (ROC AUC) for the classification models using the nine unidentified features for the cognitively unaffected and stable (CS) versus Down syndrome‐Alzheimer's disease (DS‐AD) comparison (A) and the five features for Down syndrome‐mild cognitive impairment (DS‐MCI) versus DS‐AD comparison (B). For the CS versus DS‐AD comparison, the left panel shows strong classification using a logistic regression model with 10‐fold cross validation (ROC AUC = 0.868), the middle panel shows similar performance for the same model using a more rigorous 100‐fold Monte Carlo cross validation procedure (ROC AUC = 0.855), and the right panel shows consistent classification performance using an alternate support vector machine (SVM) classification algorithm (ROC AUC = 0.859). In the DS‐AD versus DS‐MCI comparison (B) the left panel shows strong classification performance using the logistic regression model with 10‐fold cross validation (ROC AUC = 0.891), the middle panel shows similar performance with 10‐fold Monte Carlo resampling approach (ROC AUC = 0.881) and the right panel shows strong SVM performance (ROC AUC = 0.885)
We also created classification models for the DS‐AD versus DS‐MCI contrast, using the set of 17 DE features (FDR q < .05). The LASSO‐based feature selection method was unable to produce stable results given the sparsity of the feature matrix, so we used SVM‐based feature selection. The SVM algorithm selected five features (Figure 2B), which when combined in a logistic regression model, classified the DS‐AD and DS‐MCI groups with ROC AUC = 0.89 (95%CI = 0.83–0.96). Sensitivity was 0.79 (95%CI = 0.78–0.86) and specificity was 0.86 (95%CI = 0.76–0.96). This finding was supported by the more rigorous 100‐fold Monte Carlo CV (ROC AUC = 0.88; 95% CI = 0.76–0.97) and the alternative SVM modelling approach (ROC AUC = 0.86, 95%CI = 0.78–0.97; Figure 3B). Classification accuracy for the 100‐fold Monte Carlo CV was 78.1% (Figure S1B).
Our MS approach was untargeted in nature meaning that definitive identification of the metabolites selected for the classification models is necessary. Using the tandem LC‐MS/MS technique we were able to definitely identify seven of the nine features in the DS‐AD versus CS contrast andtwo of the five features in the DS‐AD versus DS‐MCI contrast (Table 2 and red outlines in Figure 2A&B). Classification models using the smaller metabolite sets of definitely identified metabolites (n = 7 and n = 2) produced ROC performance characteristics that did not differ significantly from the models using the putatively identified metabolites (Figure 4, A&B).
TABLE 2.
Identities of the metabolites selected by LASSO and SVM algorithms
| Comparison | Ion mode | Precursor m/z ( RT) | Metabolite | Compound name |
|---|---|---|---|---|
| CS versus DS‐AD | NEG | 1100.522 (8.99) | Metabolite 1 | CDP‐DG(22:5) |
| CS versus DS‐AD | POS | 732.6076 (10.02) | Metabolite 2 | 1‐Oleoyl‐2‐myristoyl‐sn‐glycero‐3‐phosphocholine |
| CS versus DS‐AD | POS | 723.4909 (10.01) | Metabolite 3 | 1,2‐Dioleoyl‐sn‐glycero‐3‐phosphate |
| CS versus DS‐AD | NEG | 721.4582 (6.97) | Metabolite 4 | PA(15:0/20:2) |
| CS versus DS‐AD | POS | 459.1245 (2.09) | Metabolite 5 | 3,4,5‐trihydroxy‐6‐(2‐hydroxy‐1,2‐diphenylethoxy)oxane‐2‐carboxylic acid |
| CS versus DS‐AD | NEG | 840.6669 (0.3) | Metabolite 6 | PE‐Nme(18:1) |
| CS versus DS‐AD | NEG | 593.4771 (7.55) | Metabolite 7 | DG(15:0/18:4) |
| CS versus DS‐AD | NEG | 1102.75 (0.3) | Metabolite 8 | ‐ |
| CS versus DS‐AD | NEG | 493.3887 (7.35) | Metabolite 9 | ‐ |
| DS‐MCI versus DS‐AD | POS | 500.3502 (5.35) | Metabolite 1 | Oleyloxyethyl phosphorylcholine |
| DS‐MCI versus DS‐AD | POS | 840.521 (10.09) | Metabolite 2 | PS(20:0/20:3(8Z,11Z,14Z)) |
| DS‐MCI versus DS‐AD | POS | 518.4922 (8.09) | Metabolite 3 | ‐ |
| DS‐MCI versus DS‐AD | POS | 628.4103 (7.28) | Metabolite 4 | ‐ |
| DS‐MCI versus DS‐AD | POS | 536.4959 (8.12) | Metabolite 5 | ‐ |
Abbreviations: AD, Alzheimer's disease; CS, cognitively unaffected and stable; DS, Down syndrome; LASSO, least absolute shrinkage selection operator; MCI, mild cognitive impairment; SVM, support vector machine
FIGURE 4.
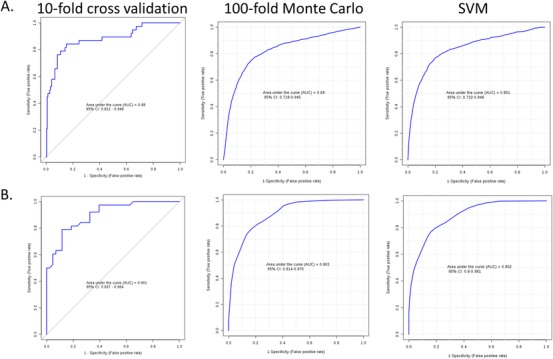
Classification performance using definitively identified metabolites. These receiver operating characteristic (ROC) plots show the classification model performance using the seven MS/MS definitively identified metabolites for the cognitively unaffected and stable (CS) versus Down syndrome‐Alzheimer's disease (DS‐AD) comparison (A) and the two definitively identified metabolites for the DS‐AD versus Down syndrome‐mild cognitive impairment (DS‐MCI) comparison (B). The classification performance from these reduced set of metabolites is not significantly different from the larger sets used in Figure 3. The consistency of the ROC AUC across the resampling schemes (10‐fold CV and 100‐fold Monte Carlo CV) and classification models (logistic regression and support vector machine) shows the overall stability of the models and argues against overfitting
4.3. Differentially expressed LC‐MS metabolites underscore role of energy and lipid metabolism in DS‐AD progression
Although we were able to form effective, robust classifiers of cognitive status for (1) DS‐AD versus CS and (2) DS‐AD versus DS‐MCI comparisons, the underlying biochemical perturbations driving this discriminability could only be inferred from the few definitively identified metabolites included in the classifier models. Furthermore, it was not clear whether semantic biological meaning could be distilled from the DS‐MCI versus CS contrast in spite of a lack of FDR q < .05 significant features. To evaluate this, all DE features on the basis of group‐wise DE nominal P‐values were putatively identified based on m/z and mobile phase column RT. We submitted these features to metabolic set enrichment analysis for high‐level semantic characterization and systems biochemical interpretation. 49 Corroborating earlier reports from our group in an independent cohort of DS adults, we again find that known metabolic pathways involved in fatty acid/lipid metabolism and central carbon/carbohydrate metabolism appear perturbed in peripheral blood plasma with dementia progression (Table 3). Interestingly, metabolic pathways characterizing contiguous phenotype transitions (ie, CS vs DS‐MCI and DS‐AD vs DS‐MCI) appear particularly enriched with metabolites involved in fatty acid metabolism. Fatty acid metabolism in the brain has been increasingly linked to neuropathology and cognitive integrity in LOAD; however, the overall metabolic contributions to AD progression remain unclear broadly. 51 That fatty acid metabolism involving both biosynthesis and oxidation may index these transitions specifically is an intriguing idea implicating well‐understood genetic programs and metabolic regulatory mechanisms. In addition to their role as biomarker candidates, these findings may consequently suggest novel therapeutic targets in DS‐AD, and perhaps AD broadly, that are currently better understood in other types of metabolic pathology (eg, type 2 diabetes; non‐alcoholic fatty liver disease, NAFLD).
TABLE 3.
Metabolic set enrichment analysis
| KEGG Pathway | Pathways | CS versus DS‐MCI | DS‐MCI versus DS‐AD | CS versus DS‐AD |
|---|---|---|---|---|
| Fatty acid metabolism | Fatty acid oxidation, peroxisome | 0.04025 | ||
| Fatty acid metabolism | Leukotriene metabolism | 0.03823 | ||
| Fatty acid metabolism | De novo fatty acid biosynthesis | 0.04537 | 0.00067 | |
| Fatty acid metabolism | Fatty acid activation | 0.00445 | 0.00067 | |
| Fatty acid metabolism | Fatty acid oxidation | 0.00462 | 0.00622 | |
| Fatty acid metabolism | Omega‐3 fatty acid metabolism | 0.00975 | 0.01874 | |
| Lipid metabolism | Glycerophospholipid metabolism | 0.02185 | 0.01244 | |
| Amino acid metabolism | Arginine and proline metabolism | 0.03748 | 0.00857 | |
| Metabolism of xenobiotics by cytochrome P450 | Xenobiotics metabolism | 0.03487 | ||
| Fatty acid metabolism | Linoleate metabolism | 0.01218 | ||
| Fatty acid metabolism | Saturated fatty acids beta‐oxidation | 0.02823 | ||
| Fatty acid metabolism | Omega‐6 fatty acid metabolism | 0.02823 | ||
| Fatty acid metabolism | Carnitine shuttle | 0.0037 | 0.01462 | |
| Lipid metabolism | Phosphatidylinositol phosphate metabolism | 0.00639 | 0.00202 | |
| Nucleotide metabolism | Purine metabolism | 0.00302 | 0.00202 | |
| Neuroactive ligand‐receptor interaction | Dynorphin metabolism | 0.02773 | 0.04016 | 0.04949 |
| Lipid metabolism | Limonene and pinene degradation | 0.03445 | 0.04193 | |
| Lipid metabolism | Bile acid biosynthesis | 0.04655 | ||
| Lipid metabolism | Glycosylphosphatidylinositol (GPI)‐anchor biosynthesis | 0.04193 | ||
| Lipid metabolism | Vitamin D3 metabolism | 0.04865 | ||
| Lipid metabolism/Carbohydrate metabolism | Glycosphingolipid metabolism | 0.04672 | ||
| Carbohydrate metabolism | Hexose phosphorylation | 0.04193 | ||
| Carbohydrate metabolism | Pentose phosphate pathway | 0.00588 | ||
| Carbohydrate metabolism | Galactose metabolism | 0.04193 | ||
| Carbohydrate metabolism | Fructose and mannose metabolism | 0.04193 | ||
| Nucleic acid/Purine metabolism; Carbohydrate metabolism | Vitamin B1 (thiamin) metabolism | 0.04193 | ||
| Carbohydrate metabolism/Glycan biosynthesis and metabolism | Aminosugars metabolism | 0.04193 | ||
| Glycan biosynthesis and metabolism | Heparan sulfate degradation | 0.04193 | ||
| Glycan biosynthesis and metabolism | Keratan sulfate degradation | 0.04193 | ||
| Glycan biosynthesis and metabolism | Chondroitin sulfate degradation | 0.04193 | ||
| Glycan biosynthesis and metabolism | Sialic acid metabolism | 0.04672 |
KEGG, Kyoto Encyclopedia of Genes and Genomes (https:http://www.genome.jp/kegg/).
Contrasts highlighted in red involved fatty acid metabolism pathways.
Contrasts highlighted in green involve lipid metabolic pathways.
Contrasts highlighted in yellow involve cellular energy metabolic pathways.
* P values reflect significant enrichment of metabolites on the relevant KEGG pathways.
5. DISCUSSION
This is one of the first, large‐scale blood‐based investigations of metabolic factors associated with aging and cognitive status in adults with DS‐AD. We used untargeted metabolomics to consider a broad scope of metabolic alterations which can be followed up in subsequent targeted metabolomic studies. We find strong evidence of metabolic perturbations which characterize groups of people with DS who were cognitively unaffected with stable cognition, DS‐MCI, and DS‐AD. In general, changes in lipid metabolism including fatty acid biosynthesis and degradation pathways characterize these phenotypic state changes, with evidence of broad, cellular energy metabolic decline present in adults with DS, from unimpaired to manifest DS‐AD. It is not clear from this study if these energy alterations begin in adulthood or are present from birth, but this is an interesting avenue for future research.
A valid concern with classification models derived from a large number of parameters and a significantly fewer number of cases (here, 8805 metabolites and 292 participants) is the risk of model overfitting and lack of generalizability from the experimental sample to the population of interest. This remains a challenge in biomarker development across many fields. 18 , 44 , 53 Here, we attempted to mitigate model overfitting by using machine learning algorithms for feature selection to eliminate biases for particular metabolites or classes of metabolites. Further, the logistic regression classification models were refined using multiple re‐sampling schemes (10‐fold CV and 100‐fold Monte Carlo cross‐validation) and cross‐checked using a separate SVM model. Finally, we attempted to minimize the effects of other known variables (eg, APOE, sex, medications, age, etc) or unknown variables which might produce false positive results or complicate interpretation using the surrogate variable approach. In aggregate, the models produced consistent and robust classification results with ROC AUC's ranging from 0.84 to 0.90 and accuracies around 78%. These classification models need to be replicated in additional cohorts, but appear robust and consistent with previous literature from our group and others implicating lipid‐ and energy‐related metabolites as possible markers of DS‐AD progression. While large‐scale external replication is the current gold standard for biomarker validation, multiple independent observations of the same phenomena on a smaller scale are also useful for validating a set of results and we would consider other attempts to replicate these findings in small to medium sized cohorts valuable.
The metabolite enrichment set analysis also produced findings that are consistent with the extant literature regarding the involvement of lipid metabolism in LOAD. 54 , 55 , 56 These lipid alterations may not be independent from the hallmark neuropathology of LOAD. With respect to plaque formation, it has been observed that membrane lipid compositional changes may increase amyloidogenic processing of APP. The mechanism for this is thought to involve increased proximity of the β‐secretase (BACE1) enzyme and its substrate APP via lipid rafts, which overall serves to promote BACE1 activity and amyloidogenesis. 56 It has also been proposed that the tauopathy and neurofibrillary tangle (NFT) formation that are hallmarks of LOAD may be subject to lipid‐dependent mechanisms; tau paired helical filament aggregation may initiate at the plasma membrane and lipids (ie, phospholipids, cholesterol, sphingomyelins) have been isolated from paired helical filaments derived from LOAD brain. 58 , 59
There is also a growing appreciation of lipid metabolic alterations in DS. For example, individuals with DS have peripheral lipid metabolism that differs from euploid siblings independent of body weight. 59 Furthermore, our group has recently reported evidence of lipid and small‐molecule metabolic alterations in the peripheral blood of adults with DS as a function of cognitive impairment. 37 Although it is possible that our peripheral metabolomic analyses reported here index DS‐AD associated pathology directly at the cellular or subcellular level within the CNS, there is increasing reason to suspect that peripherally evident metabolic alterations (eg, of lipids, bioenergetically relevant small molecules) may co‐occur with cognitive decline and reflect disease progression in a manner not entirely dependent on CNS metabolism. 56 , 61 , 62 , 63 , 64 , 65 It is challenging to contextualize lipid physiological findings in both the dementing and pre‐symptomatic brain across multiple levels of organization (eg, single neuron/glial cell, autonomously considered CNS tissue, cross‐organ‐system communication). 66 , 67 , 68 , 69 We are therefore encouraged by the fact that, within the ABC‐DS cohort, we have recapitulated a previously identified, disease‐associated metabolic signature of dementia in an independent, expanded, and rigorously prospectively collected cohort of adults with DS. 37 Consistent with these earlier findings, we find lipid/fatty acid metabolism and central carbon pathway metabolites to be principally affected.
5.1. Lipid metabolism in AD: shared vulnerabilities in LOAD and DS‐AD?
Lipid alterations may impact plaque formation via amyloid‐processing genes (presenilin 1‐2; PSEN1‐2) implicated in rare, heritable forms of AD (familial Alzheimer's disease [FAD]); however, there is substantial reason to think that aberrant lipid metabolism may impact sporadic LOAD directly. 69 Furthermore, the pattern of lipid alteration in LOAD (versus other dementias such as frontotemporal, vascular, Lewy body) may be relatively specific, suggesting a potential role of these molecules in differential diagnosis. 70 Importantly, the APOE ε4 allele represents one of the earliest discovered and strongest common risk variants predisposing individuals to LOAD specifically, 71 although it is only now being considered a therapeutic target in AD. 72 apoE serves to clear amyloid plaques within the aging brain, but is also crucially important for intercellular lipid transport. 73 APOE is expressed in metabolically relevant peripheral tissues such as the liver and is primarily produced in the brain by glial cells (eg, astrocytes, microglia). 75 , 76 Within the CNS, lipidated lipoprotein complexes (1) facilitate axonal remodeling and survival in neurons through their uptake by the low‐density lipoprotein receptor (LDLR) and (2) modulate microglial inflammatory phenotype by signaling through LDLRs and triggering receptor expressed on myeloid cells 2 (TREM2). 75 , 77 , 78 The rare, recently described R47H mutation in TREM2 represents another genetic, lipid‐associated risk factor impacting LOAD specifically and underscores the role of neuroinflammatory homeostasis and microglia in AD. 79 , 80 , 81
That glia disproportionately express APOE is an intriguing finding, given that these cells have substantial capacity for lipid synthesis and metabolic plasticity, 82 , 83 , 84 , 85 , 86 whereas neurons routinely avoid lipid catabolism for bioenergetic purposes under physiologic circumstances. 86 This relationship may instead highlight the non‐metabolic (ie, bioactive signaling) roles of certain lipids (polyunsaturated fatty acids [PUFAs]) which are produced substantially in astrocytes, but exert neuroprotective and immunomodulatory roles within neurons when taken up by these latter cells. 88 , 89 Although the role of glia in AD has become substantially better understood, 90 , 91 , 92 the degeneration of neurons remains the factor most proximally driving cognitive decline in AD. 93 , 94 , 95 , 96
It is also in substantial part through lipidation of apoE that cholesterol efflux is facilitated within the CNS. Although the brain represents 2% of total body mass, it contains ≈ 25% of the total unesterified cholesterol. 96 This may be of importance in AD given findings that individuals experiencing cognitive impairment (either due to MCI or manifest AD) demonstrate up to 30% reduction in ABCA1‐mediated cholesterol efflux into the CSF compared to cognitively intact controls. 97 Interestingly, this parallels earlier reports suggesting that patients experiencing AD or vascular dementia demonstrate elevated levels of the plasma oxysterol 24S‐hydroxycholesterol (cerebrosterol). This may suggest that enhanced flux of this metabolite across the blood‐brain barrier is associated with dementia severity. 98 Crucially, oxysterols of CNS origin can cross the blood‐brain barrier and enter the plasma, and studies in humans have confirmed that most of the oxysterol that appears in peripheral circulation comes from the brain. 97 , 100 Underscoring our systems‐level approach to AD metabolomics, it is worth noting that oxysterols such as cerebrosterol represent a key biosynthetic intermediate bridging sterol and primary bile acid synthesis. Bile acids may be altered in AD as a function of cognitive impairment, reflect the role of brain‐gut axis dyshomeostasis in the disease, and suggest a broader association of this metabolite class with dementia‐associated neuroinflammatory processes. 101 , 102
Although peripheral dyslipidemia and poor metabolic control are associated with dementia risk, 102 there is paradoxically little correspondence between and relatively low turnover of CNS relative to peripheral cholesterol (ie, most CNS cholesterol is synthesized de novo). 96 Interestingly, APOE genotype is itself associated with efficiency of cholesterol efflux, with the APOE ε4 AD risk allele producing the greatest reduction and promoting the formation of lipid‐depleted apoE lipoprotein complexes in CSF. 66 , 98 , 104
Although it is possible that APOE‐driven LOAD risk is principally mediated through effects on amyloid processing and deposition, 104 it is also feasible that direct effects of apoE‐associated lipid trafficking may impact the dementing brain. 105 This is perhaps particularly relevant, given that CNS tissues are metabolically heterogeneous (both macro‐anatomically and with respect to cell type) and may experience suboptimal provisioning of lipids (eg, cholesterol, phospholipids) with AD progression in a cell‐type or regionally dependent manner. It is thus possible that constraints upon lipoprotein (eg, apoE, apoJ/Clusterin) mediated lipid trafficking are of substantial importance within the dementing brain, perhaps compounding other core metabolic deficits (ie, brain glucose hypometabolism) well established as features of early AD in both euploid and DS populations. 15 , 16 , 107 , 108 , 109 , 110 Moving forward, it will be of great importance to better understand how core AD neuropathology such as plaques and NFTs are differentially impacted by lipid dyshomeostasis and metabolic/bioenergetic stress. 110
5.2. Systemic metabolic alterations in DS‐AD: evidence beyond the brain
One limitation of the present study is that the untargeted metabolomic (ie, LC‐MS) approaches used do not permit unambiguous chemical identification of individual dementia‐associated metabolites in peripheral blood. 50 , 112 Nonetheless, our statistical approaches to better delineate disease‐associated signals within the plasma metabolome and characterize systems‐level biochemical alterations revealed several metabolic pathways (ie, lipid/fatty acid and central carbon metabolism) which demonstrated a significantly overrepresented number of differentially expressed LC‐MS features. Potentially representing high‐value druggable targets, these findings remain challenging to interpret.
It is noteworthy that recent work in AD metabolomics has attempted to link disease‐associated alterations within the peripheral blood metabolome to corresponding alterations in the CNS metabolome, 56 , 113 thereby grounding peripheral blood biochemical alterations as surrogate biomarkers for CNS lipid abnormalities. Due to the extensive, “connective” role of the cardiovascular system, it is, however, unclear if these blood plasma perturbations uniquely reflect brain pathology, as opposed to pathological alterations of other organ systems. In recent years, AD has been increasingly understood as a metabolic disease, 63 necessarily implicating structures beyond the CNS. This is certainly applicable to DS, which is marked by substantially elevated, genetically penetrant risk for both AD and type 1 diabetes. 114 , 115 , 116 It is similarly reflected in the variety of biomolecules recently implicated in AD via metabolomics approaches. In many cases, while these molecules possess currently underappreciated roles within the CNS, their conventional roles in peripheral, metabolically active tissues remain physiologically better understood. It will be important for future work in adults with DS‐AD to better contextualize the heterogeneity of these molecules and implicated physiological processes with respect to core AD pathophysiology. Rather than simply reflecting an imperfect signal of brain metabolism, the peripheral plasma metabolome may instead index broader metabolic derangement associated with disease progression. 117 , 118 , 119 , 120 , 121 , 122 , 123 , 124 , 125 , 126 , 127 , 128 , 129 To the extent that this suggests interventional targets and effective biomarkers, this may prove to be an advantage rather than a shortcoming of peripheral metabolomic approaches within DS‐AD.
CONFLICTS OF INTEREST
MM and AKC are listed as inventors on issued and pending patents related to material in this manuscript and assigned to Georgetown University. The terms of this arrangement have been reviewed and approved by the University of California, Irvine in accordance with its conflict of interest policies. Remaining authors declare no competing financial interests.
Supporting information
Supporting Information
ACKNOWLEDGMENTS
The Alzheimer's Biomarkers Consortium–Down Syndrome (ABC‐DS) is funded by the National Institute on Aging and the National Institute for Child Health and Human Development (U01 AG051406 and U01 AG051412). The work contained in this publication was also supported through the following National Institutes of Health Programs: The Alzheimer's Disease Research Centers Program (P50 AG008702, P30 AG062421, P50 AG16537, P50 AG005133, P50 AG005681, and P30 AG062715), the Eunice Kennedy Shriver Intellectual and Developmental Disabilities Research Centers Program (U54 HD090256 and U54 HD087011), the National Center for Advancing Translational Sciences (UL1 TR001873, UL1 TR002373, UL1 TR001414, UL1 TR001857, UL1 TR002345), the National Centralized Repository for Alzheimer's Disease and Related Dementias (U24 AG21886), and DS‐Connect® (The Down Syndrome Registry) supported by the Eunice Kennedy Shriver National Institute of Child Health and Human Development (NICHD).
The authors are grateful to the ABC‐DS study participants, their families and care providers, and the ABC‐DS research and support staff for their contributions to this study. The authors especially thank Drs. Shivani Bansal and Michael Girgis and Mr. Meth Jayatilake for technical assistance. This manuscript has been reviewed by ABC‐DS investigators for scientific content and consistency of data interpretation with previous ABC‐DS study publications. The content is solely the responsibility of the authors and does not necessarily represent the official views of the NIH.
Mapstone M, Gross TJ, Macciardi F, et al. Metabolic correlates of prevalent mild cognitive impairment and Alzheimer's disease in adults with Down syndrome. Alzheimer's Dement. 2020;12:12028 10.1002/dad2.12028
REFERENCES
- 1. Presson AP, Partyka G, Jensen KM, et al. Current estimate of Down Syndrome population prevalence in the United States. J Pediatr. 2013;163(4):1163‐1168. [DOI] [PMC free article] [PubMed] [Google Scholar]
- 2. Rumble B, Retallack R, Hilbich C, et al. Amyloid A4 and its precursor in Down's syndrome and Alzheimer's disease. New Engl J Med. 1989;320:1446‐1462. [DOI] [PubMed] [Google Scholar]
- 3. Mann DMA, Esiri MM. The pattern of acquisition of plaques and tangles in the brains of patients under 50 years of age with Down's syndrome. J Neurol Sci. 1989;89:169‐179. [DOI] [PubMed] [Google Scholar]
- 4. Wisniewski K, Howe J, Williams G, Wisniewski HM. Precocious aging and dementia in patients with Down's syndrome. Biol Psychiatry. 1978;13(5):619‐627. [PubMed] [Google Scholar]
- 5. Wisniewski K, Wisniewski H, Wen G. Occurrence of neuropathological changes and dementia of Alzheimer's disease in Down's syndrome. Ann Neurol. 1985;17:278‐282. [DOI] [PubMed] [Google Scholar]
- 6. Sinai A, Mokrysz C, Bernal J, et al. Predictors of age of diagnosis and survival of Alzheimer's disease in down syndrome. JAD. 2018;61(2):717‐728. [DOI] [PMC free article] [PubMed] [Google Scholar]
- 7. Kinney JW, Bemiller SM, Murtishaw AS, Leisgang AM, Salazar AM, Lamb BT. Inflammation as a central mechanism in Alzheimer's disease. Alzheimers Dement (N Y). 2018;4:575‐590. [DOI] [PMC free article] [PubMed] [Google Scholar]
- 8. Butterfield DA, Halliwell B. Oxidative stress, dysfunctional glucose metabolism and Alzheimer disease. Nat Rev Neurosci. 2019;20(3):148‐160. [DOI] [PMC free article] [PubMed] [Google Scholar]
- 9. Mapstone M, Cheema AK, Fiandaca MS, et al. Plasma phospholipids identify antecedent memory impairment in older adults. Nat Med. 2014;20(4):415‐418. [DOI] [PMC free article] [PubMed] [Google Scholar]
- 10. Kaddurah‐Daouk R, Zhu H, Sharma S, et al. Alterations in metabolic pathways and networks in Alzheimer's disease. Translat Psychiatry. 2013;3:e244. [DOI] [PMC free article] [PubMed] [Google Scholar]
- 11. Wilcock DM, Griffin WS. Down's syndrome, neuroinflammation, and Alzheimer neuropathogenesis. J Neuroinflamm.. 2013;10:84. [DOI] [PMC free article] [PubMed] [Google Scholar]
- 12. Culp‐Hill R, Zheng C, Reisz JA, et al. Red blood cell metabolism in Down syndrome: hints on metabolic derangements in aging. Blood Adv. 2017;1(27):2776‐2780. [DOI] [PMC free article] [PubMed] [Google Scholar]
- 13. Butterfield DA, Di Domenico F, Swomley AM, Head E, Perluigi M. Redox proteomics analysis to decipher the neurobiology of Alzheimer‐like neurodegeneration: overlaps in Down's syndrome and Alzheimer's disease brain. Biochem J. 2014;463(2):177‐189. [DOI] [PMC free article] [PubMed] [Google Scholar]
- 14. Lao PJ, Handen BL, Betthauser TJ, et al. Alzheimer‐like pattern of hypometabolism emerges with elevated amyloid‐beta burden in down syndrome. JAD. 2018;61(2):631‐644. [DOI] [PMC free article] [PubMed] [Google Scholar]
- 15. Matthews DC, Lukic AS, Andrews RD, et al. Dissociation of Down syndrome and Alzheimer's disease effects with imaging. Alzheimers Dement (N Y). 2016;2(2):69‐81. [DOI] [PMC free article] [PubMed] [Google Scholar]
- 16. Labudova O, Cairns N, Kitzmuller E, Lubec G. Impaired brain glucose metabolism in patients with Down syndrome. J Neural Transm Suppl. 1999;57:247‐256. [DOI] [PubMed] [Google Scholar]
- 17. Hampel H, Frank R, Broich K, et al. Biomarkers for Alzheimer's disease: academic, industry and regulatory perspectives. Nat Rev Drug Discovery. 2010;9(7):560‐574. [DOI] [PubMed] [Google Scholar]
- 18. O'Bryant SE, Mielke MM, Rissman RA, et al. Blood‐based biomarkers in Alzheimer disease: current state of the science and a novel collaborative paradigm for advancing from discovery to clinic. Alzheimer's Dementia. 2017;13(1):45‐58. [DOI] [PMC free article] [PubMed] [Google Scholar]
- 19. Zetterberg H, Burnham SC. Blood‐based molecular biomarkers for Alzheimer's disease. Molecular Brain. 2019;12(1):26. [DOI] [PMC free article] [PubMed] [Google Scholar]
- 20. Schupf N, Patel B, Pang D, et al. Elevated plasma β‐amyloid peptide Aβ42 levels, incident dementia, and mortality in Down syndrome. Arch Neurol. 2007;64(7):1007‐1013. [DOI] [PMC free article] [PubMed] [Google Scholar]
- 21. Schupf N, Patel B, Pang D, et al. Elevated plasma beta‐amyloid peptide Abeta(42) levels, incident dementia, and mortality in Down syndrome. Arch Neurol. 2007;64(7):1007‐1013. [DOI] [PMC free article] [PubMed] [Google Scholar]
- 22. Schupf N, Patel B, Silverman W, et al. Elevated plasma amyloid β‐peptide 1‐42 and onset of dementia in adults with Down syndrome. Neurosci Lett. 2001;301(3):199‐203. [DOI] [PubMed] [Google Scholar]
- 23. Schupf N, Tang MX, Fukuyama H, et al. Peripheral Aβ subspecies as risk biomarkers of Alzheimer's disease. Proc Natl Acad Sci USA. 2008;105(37):14052‐14057. [DOI] [PMC free article] [PubMed] [Google Scholar]
- 24. Lee NC, Yang SY, Chieh JJ, et al. Blood beta‐amyloid and tau in down syndrome: a comparison with Alzheimer's disease. Front Aging Neurosci. 2016;8:316. [DOI] [PMC free article] [PubMed] [Google Scholar]
- 25. Coppus AM, Schuur M, Vergeer J, et al. Plasma beta amyloid and the risk of Alzheimer's disease in Down syndrome. Neurobiol Aging. 2012;33(9):1988‐1994. [DOI] [PubMed] [Google Scholar]
- 26. Strydom A, Heslegrave A, Startin CM, et al. Neurofilament light as a blood biomarker for neurodegeneration in Down syndrome. Alzheimer's Res Ther. 2018;10(1):39. [DOI] [PMC free article] [PubMed] [Google Scholar]
- 27. Rafii MS, Donohue MC, Matthews DC, et al. Plasma neurofilament light and Alzheimer's disease biomarkers in down syndrome: results from the down syndrome biomarker initiative (DSBI). JAD. 2019;70(1):131‐138. [DOI] [PubMed] [Google Scholar]
- 28. O'Bryant S, Zhang F, Lee JH, et al. Proteomic biomarkers for detecting and predicting risk among adults with down syndrome. Alzheimer's Dementia. 2018;14(7, Supplement):P1624‐P1625. [Google Scholar]
- 29. Conti E, Galimberti G, Piazza F, Raggi ME, Ferrarese C. Increased soluble APPalpha, Abeta 1‐42, and anti‐Abeta 1‐42 antibodies in plasma from down syndrome patients. Alzheimer Disease Assoc Disorders. 2010;24(1):96‐100. [DOI] [PubMed] [Google Scholar]
- 30. Petersen ME, O'Bryant SE. Blood‐based biomarkers for Down syndrome and Alzheimer's disease: a systematic review. Develop Neurobiol. 2019;79(7):699‐710. [DOI] [PMC free article] [PubMed] [Google Scholar]
- 31. Fortea J, Carmona‐Iragui M, Benejam B, et al. Plasma and CSF biomarkers for the diagnosis of Alzheimer's disease in adults with Down syndrome: a cross‐sectional study. Lancet Neurol. 2018;17(10):860‐869. [DOI] [PubMed] [Google Scholar]
- 32. Head E, Doran E, Nistor M, et al. Plasma amyloid‐beta as a function of age, level of intellectual disability, and presence of dementia in Down syndrome. JAD. 2011;23(3):399‐409. [DOI] [PMC free article] [PubMed] [Google Scholar]
- 33. Tebani A, Abily‐Donval L, Afonso C, Marret S, Bekri S. Clinical metabolomics: the new metabolic window for inborn errors of metabolism investigations in the post‐genomic era. Int J Mol Sci. 2016;17(7). [DOI] [PMC free article] [PubMed] [Google Scholar]
- 34. Balog J, Sasi‐Szabo L, Kinross J, et al. Intraoperative tissue identification using rapid evaporative ionization mass spectrometry. Sci Transl Med. 2013;5(194):194ra193. [DOI] [PubMed] [Google Scholar]
- 35. Buonuomo PS, Bartuli A, Mastrogiorgio G, et al. Lipid profiles in a large cohort of Italian children with Down syndrome. Eur J Med Genet. 2016;59(8):392‐395. [DOI] [PubMed] [Google Scholar]
- 36. Caracausi M, Ghini V, Locatelli C, et al. Plasma and urinary metabolomic profiles of Down syndrome correlate with alteration of mitochondrial metabolism. Sci Rep. 2018;8:2977. [DOI] [PMC free article] [PubMed] [Google Scholar]
- 37. Borelli V, Vanhooren V, Lonardi E, et al. Plasma N‐glycome signature of down syndrome. J Proteome Res. 2015;14(10):4232‐4245. [DOI] [PubMed] [Google Scholar]
- 38. Gross TJ, Doran E, Cheema AK, Head E, Lott IT, Mapstone M. Plasma metabolites related to cellular energy metabolism are altered in adults with Down syndrome and Alzheimer's disease. Dev Neurobiol. 2019;79(7):622‐638. [DOI] [PubMed] [Google Scholar]
- 39. Aylward EH, Burt DB, Thorpe LU, Lai F, Dalton A. Diagnosis of dementia in individuals with intellectual disability. J Intellect Disabil Res. 1997;41 (Pt 2):152‐164. [DOI] [PubMed] [Google Scholar]
- 40. Burt DB, Aylward EH. Test battery for the diagnosis of dementia in individuals with intellectual disability. Working Group for the Establishment of Criteria for the Diagnosis of Dementia in Individuals with Intellectual Disability. J Intellect Disabil Res. 2000;44 (Pt 2):175‐180. [DOI] [PubMed] [Google Scholar]
- 41. Fiandaca MS, Zhong X, Cheema AK, et al. Plasma 24‐metabolite Panel predicts preclinical transition to clinical stages of Alzheimer's Disease. Front Neurol. 2015;6:237. [DOI] [PMC free article] [PubMed] [Google Scholar]
- 42. Mapstone M, Lin F, Nalls MA, et al. What success can teach us about failure: the plasma metabolome of older adults with superior memory and lessons for Alzheimer's disease. Neurobiol Aging. 2017;51:148‐155. [DOI] [PMC free article] [PubMed] [Google Scholar]
- 43. Smith CA, Want EJ, O'Maille G, Abagyan R, Siuzdak G. XCMS: processing mass spectrometry data for metabolite profiling using nonlinear peak alignment, matching, and identification. Anal Chem. 2006;78(3):779‐787. [DOI] [PubMed] [Google Scholar]
- 44. Gross T, Mapstone M, Miramontes R, et al. Toward reproducible results from targeted metabolomic studies: perspectives for data pre‐processing and a basis for analytic pipeline development. Curr Top Med Chem. 2018;18(11):883‐895. [DOI] [PubMed] [Google Scholar]
- 45. Kim CH, Tworoger SS, Stampfer MJ, et al. Stability and reproducibility of proteomic profiles measured with an aptamer‐based platform. Sci Rep. 2018;8(1):8382. [DOI] [PMC free article] [PubMed] [Google Scholar]
- 46. Benjamini Y, Hochberg Y. Controlling the false discovery rate ‐ a practical and powerful approach to multiple testing. J Royal Stat Soc Series B‐Statistical Methodol. 1995;57(1):289‐300. [Google Scholar]
- 47. Leek JT, Storey JD. Capturing heterogeneity in gene expression studies by surrogate variable analysis. PLoS Genet. 2007;3(9):1724‐1735. [DOI] [PMC free article] [PubMed] [Google Scholar]
- 48. Buja A, Eyuboglu N. Remarks on parallel analysis. Multivariate Behav Res. 1992;27(4):509‐540. [DOI] [PubMed] [Google Scholar]
- 49. Wang C, Yu JT, Wang HF, et al. Meta‐analysis of peripheral blood apolipoprotein E levels in Alzheimer's disease. PLoS One. 2014;9(2):e89041. [DOI] [PMC free article] [PubMed] [Google Scholar]
- 50. Li S, Park Y, Duraisingham S, et al. Predicting network activity from high throughput metabolomics. PLoS Comput Biol. 2013;9(7):e1003123. [DOI] [PMC free article] [PubMed] [Google Scholar]
- 51. Chong J, Soufan O, Li C, et al. MetaboAnalyst 4.0: towards more transparent and integrative metabolomics analysis. Nucleic Acids Res. 2018;46(W1):W486‐w494. [DOI] [PMC free article] [PubMed] [Google Scholar]
- 52. Snowden SG, Ebshiana AA, Hye A, et al. Association between fatty acid metabolism in the brain and Alzheimer disease neuropathology and cognitive performance: A nontargeted metabolomic study. PLoS Med. 2017;14(3):e1002266. [DOI] [PMC free article] [PubMed] [Google Scholar]
- 53. O'Bryant SE, Gupta V, Henriksen K, et al. Guidelines for the standardization of preanalytic variables for blood‐based biomarker studies in Alzheimer's disease research. Alzheimer's Dementia. 2015;11(5):549‐560. [DOI] [PMC free article] [PubMed] [Google Scholar]
- 54. Wong MW, Braidy N, Poljak A, Pickford R, Thambisetty M, Sachdev PS. Dysregulation of lipids in Alzheimer's disease and their role as potential biomarkers. Alzheimers Dement. 2017;13(7):810‐827. [DOI] [PubMed] [Google Scholar]
- 55. Farmer BC, Kluemper J, Johnson LA. Apolipoprotein E4 alters astrocyte fatty acid metabolism and lipid droplet formation. Cells. 2019;8(2). [DOI] [PMC free article] [PubMed] [Google Scholar]
- 56. Varma VR, Oommen AM, Varma S, et al. Brain and blood metabolite signatures of pathology and progression in Alzheimer disease: a targeted metabolomics study. PLoS Med. 2018;15(1):e1002482. [DOI] [PMC free article] [PubMed] [Google Scholar]
- 57. Hicks DA, Nalivaeva NN, Turner AJ. Lipid rafts and Alzheimer's disease: protein‐lipid interactions and perturbation of signaling. Front Physiol. 2012;3:189. [DOI] [PMC free article] [PubMed] [Google Scholar]
- 58. Gellermann GP, Appel TR, Davies P, Diekmann S. Paired helical filaments contain small amounts of cholesterol, phosphatidylcholine and sphingolipids. Biol Chem. 2006;387(9):1267‐1274. [DOI] [PubMed] [Google Scholar]
- 59. Elbaum‐Garfinkle S, Ramlall T, Rhoades E. The role of the lipid bilayer in tau aggregation. Biophys J. 2010;98(11):2722‐2730. [DOI] [PMC free article] [PubMed] [Google Scholar]
- 60. Adelekan T, Magge S, Shults J, Stallings V, Stettler N. Lipid profiles of children with Down syndrome compared with their siblings. Pediatrics. 2012;129(6):e1382‐1387. [DOI] [PMC free article] [PubMed] [Google Scholar]
- 61. Toledo JB, Arnold M, Kastenmuller G, et al. Metabolic network failures in Alzheimer's disease: a biochemical road map. Alzheimers Dement. 2017;13(9):965‐984. [DOI] [PMC free article] [PubMed] [Google Scholar]
- 62. Tynkkynen J, Chouraki V, van der Lee SJ, et al. Association of branched‐chain amino acids and other circulating metabolites with risk of incident dementia and Alzheimer's disease: a prospective study in eight cohorts. Alzheimer's Dementia. 2018;14(6):723‐733. [DOI] [PMC free article] [PubMed] [Google Scholar]
- 63. Maldonado‐Ruiz R, Montalvo‐Martinez L, Fuentes‐Mera L, Camacho A. Microglia activation due to obesity programs metabolic failure leading to type two diabetes. Nutr Diabetes. 2017;7(3):e254. [DOI] [PMC free article] [PubMed] [Google Scholar]
- 64. de la Monte SM, Wands JR. Alzheimer's disease is type 3 diabetes‐evidence reviewed. J Diabetes Sci Technol. 2008;2(6):1101‐1113. [DOI] [PMC free article] [PubMed] [Google Scholar]
- 65. Morris G, Berk M, Maes M, Puri BK. Could Alzheimer's disease originate in the periphery and if so how so? Mol Neurobiol. 2019;56(1):406‐434. [DOI] [PMC free article] [PubMed] [Google Scholar]
- 66. Rebeck GW. The role of APOE on lipid homeostasis and inflammation in normal brains. J Lipid Res. 2017;58(8):1493‐1499. [DOI] [PMC free article] [PubMed] [Google Scholar]
- 67. Adeosun SO, Hou X, Zheng B, et al. Cognitive deficits and disruption of neurogenesis in a mouse model of apolipoprotein E4 domain interaction. J Biol Chem. 2014;289(5):2946‐2959. [DOI] [PMC free article] [PubMed] [Google Scholar]
- 68. Liao F, Yoon H, Kim J. Apolipoprotein E metabolism and functions in brain and its role in Alzheimer's disease. Curr Opin Lipidol. 2017;28(1):60‐67. [DOI] [PMC free article] [PubMed] [Google Scholar]
- 69. Zhang H, Wu LM, Wu J. Cross‐talk between apolipoprotein E and cytokines. Mediators Inflamm. 2011;2011:949072. [DOI] [PMC free article] [PubMed] [Google Scholar]
- 70. Cho YY, Kwon OH, Park MK, Kim TW, Chung S. Elevated cellular cholesterol in Familial Alzheimer's presenilin 1 mutation is associated with lipid raft localization of β‐amyloid precursor protein. PLoS One. 2019;14(1):e0210535. [DOI] [PMC free article] [PubMed] [Google Scholar]
- 71. Sarrafpour S, Ormseth C, Chiang A, Arakaki X, Harrington M, Fonteh A. Lipid metabolism in late‐onset alzheimer's disease differs from patients presenting with other dementia phenotypes. Int J Environ Res Public Health. 2019;16(11). [DOI] [PMC free article] [PubMed] [Google Scholar]
- 72. Saunders AM, Strittmatter WJ, Schmechel D, et al. Association of apolipoprotein E allele epsilon 4 with late‐onset familial and sporadic Alzheimer's disease. Neurology. 1993;43(8):1467‐1472. [DOI] [PubMed] [Google Scholar]
- 73. Safieh M, Korczyn AD, Michaelson DM. ApoE4: an emerging therapeutic target for Alzheimer's disease. BMC Med. 2019;17(1):64. [DOI] [PMC free article] [PubMed] [Google Scholar]
- 74. Bales KR. Brain lipid metabolism, apolipoprotein E and the pathophysiology of Alzheimer's disease. Neuropharmacology. 2010;59(4‐5):295‐302. [DOI] [PubMed] [Google Scholar]
- 75. Wang H, Eckel RH. What are lipoproteins doing in the brain? Trends Endocrinol Metab. 2014;25(1):8‐14. [DOI] [PMC free article] [PubMed] [Google Scholar]
- 76. Getz GS, Reardon CA. Apoprotein E as a lipid transport and signaling protein in the blood, liver, and artery wall. J Lipid Res. 2009;50(Suppl):S156‐S161. [DOI] [PMC free article] [PubMed] [Google Scholar]
- 77. Yeh FL, Wang Y, Tom I, Gonzalez LC, Sheng M. TREM2 binds to apolipoproteins, including APOE and CLU/APOJ, and thereby facilitates uptake of amyloid‐beta by microglia. Neuron. 2016;91(2):328‐340. [DOI] [PubMed] [Google Scholar]
- 78. Hayashi H, Campenot RB, Vance DE, Vance JE. Apolipoprotein E‐containing lipoproteins protect neurons from apoptosis via a signaling pathway involving low‐density lipoprotein receptor‐related protein‐1. J Neurosci. 2007;27(8):1933‐1941. [DOI] [PMC free article] [PubMed] [Google Scholar]
- 79. Korvatska O, Leverenz JB, Jayadev S, et al. R47H Variant of TREM2 associated with alzheimer disease in a large late‐onset family: clinical, genetic, and neuropathological study. JAMA Neurol. 2015;72(8):920‐927. [DOI] [PMC free article] [PubMed] [Google Scholar]
- 80. Ulland TK, Song WM, Huang SC, et al. TREM2 maintains microglial metabolic fitness in Alzheimer's Disease. Cell. 2017;170(4):649‐663.e613. [DOI] [PMC free article] [PubMed] [Google Scholar]
- 81. Ulland TK, Colonna M. TREM2 ‐ a key player in microglial biology and Alzheimer disease. Nat Rev Neurol. 2018;14(11):667‐675. [DOI] [PubMed] [Google Scholar]
- 82. Orihuela R, McPherson CA, Harry GJ. Microglial M1/M2 polarization and metabolic states. Br J Pharmacol. 2016;173(4):649‐665. [DOI] [PMC free article] [PubMed] [Google Scholar]
- 83. Bak LK, Walls AB, Schousboe A, Waagepetersen HS. Astrocytic glycogen metabolism in the healthy and diseased brain. J Biol Chem. 2018;293(19):7108‐7116. [DOI] [PMC free article] [PubMed] [Google Scholar]
- 84. Morita M, Ikeshima‐Kataoka H, Kreft M, Vardjan N, Zorec R, Noda M. Metabolic plasticity of astrocytes and aging of the brain. Int J Mol Sci. 2019;20(4). [DOI] [PMC free article] [PubMed] [Google Scholar]
- 85. Baik SH, Kang S, Lee W, et al. A breakdown in metabolic reprogramming causes microglia dysfunction in Alzheimer's disease. Cell Metab. 2019;30(3):493‐507.e496. [DOI] [PubMed] [Google Scholar]
- 86. Ghosh S, Castillo E, Frias ES, Swanson RA. Bioenergetic regulation of microglia. Glia. 2018;66(6):1200‐1212. [DOI] [PMC free article] [PubMed] [Google Scholar]
- 87. Schonfeld P, Reiser G. Why does brain metabolism not favor burning of fatty acids to provide energy? Reflections on disadvantages of the use of free fatty acids as fuel for brain. J Cereb Blood Flow Metab. 2013;33(10):1493‐1499. [DOI] [PMC free article] [PubMed] [Google Scholar]
- 88. Moore SA, Yoder E, Murphy S, Dutton GR, Spector AA. Astrocytes, not neurons, produce docosahexaenoic acid (22:6 omega‐3) and arachidonic acid (20:4 omega‐6). J Neurochem. 1991;56(2):518‐524. [DOI] [PubMed] [Google Scholar]
- 89. Bazinet RP, Layé S. Polyunsaturated fatty acids and their metabolites in brain function and disease. Nat Rev Neurosci. 2014;15(12):771‐785. [DOI] [PubMed] [Google Scholar]
- 90. McQuade A, Blurton‐Jones M. Microglia in Alzheimer's disease: exploring how genetics and phenotype influence risk. J Mol Biol. 2019;431(9):1805‐1817. [DOI] [PMC free article] [PubMed] [Google Scholar]
- 91. Kim YS, Jung HM, Yoon BE. Exploring glia to better understand Alzheimer's disease. Anim Cells Syst (Seoul). 2018;22(4):213‐218. [DOI] [PMC free article] [PubMed] [Google Scholar]
- 92. Hamlett ED, Ledreux A, Gilmore A, et al. Inhibitory designer receptors aggravate memory loss in a mouse model of down syndrome. Neurobiol Dis. 2019;134:104616. [DOI] [PMC free article] [PubMed] [Google Scholar]
- 93. Arriagada PV, Growdon JH, Hedley‐Whyte ET, Hyman BT. Neurofibrillary tangles but not senile plaques parallel duration and severity of Alzheimer's disease. Neurology. 1992;42(3 Pt 1):631‐639. [DOI] [PubMed] [Google Scholar]
- 94. Theofilas P, Ehrenberg AJ, Nguy A, et al. Probing the correlation of neuronal loss, neurofibrillary tangles, and cell death markers across the Alzheimer's disease Braak stages: a quantitative study in humans. Neurobiol Aging. 2018;61:1‐12. [DOI] [PMC free article] [PubMed] [Google Scholar]
- 95. Chi H, Chang HY, Sang TK. Neuronal cell death mechanisms in major neurodegenerative diseases. Int J Mol Sci. 2018;19(10). [DOI] [PMC free article] [PubMed] [Google Scholar]
- 96. Ihara R, Vincent BD, Baxter MR, et al. Relative neuron loss in hippocampal sclerosis of aging and Alzheimer's disease. Ann Neurol. 2018;84(5):741‐753. [DOI] [PMC free article] [PubMed] [Google Scholar]
- 97. Dietschy JM, Turley SD. Cholesterol metabolism in the brain. Curr Opin Lipidol. 2001;12(2):105‐112. [DOI] [PubMed] [Google Scholar]
- 98. Yassine HN, Feng Q, Chiang J, et al. ABCA1‐mediated cholesterol efflux capacity to cerebrospinal fluid is reduced in patients with mild cognitive impairment and alzheimer's disease. J Am Heart Assoc. 2016;5(2). [DOI] [PMC free article] [PubMed] [Google Scholar]
- 99. Lütjohann D, Papassotiropoulos A, Björkhem I, et al. Plasma 24S‐hydroxycholesterol (cerebrosterol) is increased in Alzheimer and vascular demented patients. J Lipid Res. 2000;41(2):195‐198. [PubMed] [Google Scholar]
- 100. Björkhem I, Lütjohann D, Diczfalusy U, Ståhle L, Ahlborg G, Wahren J. Cholesterol homeostasis in human brain: turnover of 24S‐hydroxycholesterol and evidence for a cerebral origin of most of this oxysterol in the circulation. J Lipid Res. 1998;39(8):1594‐1600. [PubMed] [Google Scholar]
- 101. MahmoudianDehkordi S, Arnold M, Nho K, et al. Altered bile acid profile associates with cognitive impairment in Alzheimer's disease—An emerging role for gut microbiome. Alzheimer's Dementia. 2019;15(1):76‐92. [DOI] [PMC free article] [PubMed] [Google Scholar]
- 102. Nho K, Kueider‐Paisley A, MahmoudianDehkordi S, et al. Altered bile acid profile in mild cognitive impairment and Alzheimer's disease: Relationship to neuroimaging and CSF biomarkers. Alzheimers Dement. 2019;15(2):232‐244. [DOI] [PMC free article] [PubMed] [Google Scholar]
- 103. Frisardi V, Solfrizzi V, Seripa D, et al. Metabolic‐cognitive syndrome: a cross‐talk between metabolic syndrome and Alzheimer's disease. Ageing Res Rev. 2010;9(4):399‐417. [DOI] [PubMed] [Google Scholar]
- 104. Hanson AJ, Bayer‐Carter JL, Green PS, et al. Effect of apolipoprotein E genotype and diet on apolipoprotein E lipidation and amyloid peptides: randomized clinical trial. JAMA Neurol. 2013;70(8):972‐980. [DOI] [PMC free article] [PubMed] [Google Scholar]
- 105. Kanekiyo T, Xu H, Bu G. ApoE and Aβ in Alzheimer's disease: accidental encounters or partners? Neuron. 2014;81(4):740‐754. [DOI] [PMC free article] [PubMed] [Google Scholar]
- 106. Lim WL, Martins IJ, Martins RN. The involvement of lipids in Alzheimer's disease. J Genet Genomics. 2014;41(5):261‐274. [DOI] [PubMed] [Google Scholar]
- 107. Lao PJ, Handen BL, Betthauser TJ, et al. Alzheimer‐like pattern of hypometabolism emerges with elevated amyloid‐β burden in down syndrome. J Alzheimers Dis. 2018;61(2):631‐644. [DOI] [PMC free article] [PubMed] [Google Scholar]
- 108. Manning CA, Honn VJ, Stone WS, Jane JS, Gold PE. Glucose effects on cognition in adults with Down's syndrome. Neuropsychology. 1998;12(3):479‐484. [DOI] [PubMed] [Google Scholar]
- 109. Mosconi L, Berti V, Glodzik L, Pupi A, De Santi S, de Leon MJ. Pre‐clinical detection of Alzheimer's disease using FDG‐PET, with or without amyloid imaging. J Alzheimers Dis. 2010;20(3):843‐854. [DOI] [PMC free article] [PubMed] [Google Scholar]
- 110. Shivamurthy VK, Tahari AK, Marcus C, Subramaniam RM. Brain FDG PET and the diagnosis of dementia. AJR Am J Roentgenol. 2015;204(1):W76‐85. [DOI] [PubMed] [Google Scholar]
- 111. Arboleda‐Velasquez JF, Lopera F, O'Hare M, et al. Resistance to autosomal dominant Alzheimer's disease in an APOE3 Christchurch homozygote: a case report. Nat Med. 2019;25(11):1680‐1683. [DOI] [PMC free article] [PubMed] [Google Scholar]
- 112. Chaleckis R, Meister I, Zhang P, Wheelock CE. Challenges, progress and promises of metabolite annotation for LC–MS‐based metabolomics. Curr Opin Biotechnol. 2019;55:44‐50. [DOI] [PubMed] [Google Scholar]
- 113. Huo Z, Yu L, Yang J, Zhu Y, Bennett DA, Zhao J. Brain and blood metabolome for Alzheimer's dementia: findings from a targeted metabolomics analysis. Neurobiol Aging. 2020;86:123‐133. [DOI] [PMC free article] [PubMed] [Google Scholar]
- 114. Pelleri MC, Cicchini E, Petersen MB, et al. Partial trisomy 21 map: Ten cases further supporting the highly restricted Down syndrome critical region (HR‐DSCR) on human chromosome 21. Mol Genet Genomic Med. 2019;7(8):e797. [DOI] [PMC free article] [PubMed] [Google Scholar]
- 115. Gillespie KM, Dix RJ, Williams AJ, et al. Islet autoimmunity in children with Down's syndrome. Diabetes. 2006;55(11):3185‐3188. [DOI] [PubMed] [Google Scholar]
- 116. Doran E, Keator D, Head E, et al. Down Syndrome, Partial Trisomy 21, and absence of alzheimer's disease: the role of APP. JAD. 2017;56(2):459‐470. [DOI] [PMC free article] [PubMed] [Google Scholar]
- 117. Kulas JA, Puig KL, Combs CK. Amyloid precursor protein in pancreatic islets. J Endocrinol. 2017;235(1):49‐67. [DOI] [PMC free article] [PubMed] [Google Scholar]
- 118. Miklossy J, Qing H, Radenovic A, et al. Beta amyloid and hyperphosphorylated tau deposits in the pancreas in type 2 diabetes. Neurobiol Aging. 2010;31(9):1503‐1515. [DOI] [PMC free article] [PubMed] [Google Scholar]
- 119. Seo SW, Gottesman RF, Clark JM, et al. Nonalcoholic fatty liver disease is associated with cognitive function in adults. Neurology. 2016;86(12):1136‐1142. [DOI] [PMC free article] [PubMed] [Google Scholar]
- 120. Kim DG, Krenz A, Toussaint LE, et al. Non‐alcoholic fatty liver disease induces signs of Alzheimer's disease (AD) in wild‐type mice and accelerates pathological signs of AD in an AD model. J Neuroinflammation. 2016;13:1. [DOI] [PMC free article] [PubMed] [Google Scholar]
- 121. Parimisetty A, Dorsemans AC, Awada R, Ravanan P, Diotel N, Lefebvre d'Hellencourt C. Secret talk between adipose tissue and central nervous system via secreted factors‐an emerging frontier in the neurodegenerative research. J Neuroinflammation. 2016;13(1):67. [DOI] [PMC free article] [PubMed] [Google Scholar]
- 122. Astarita G, Jung KM, Berchtold NC, et al. Deficient liver biosynthesis of docosahexaenoic acid correlates with cognitive impairment in Alzheimer's disease. PLoS One. 2010;5(9):e12538. [DOI] [PMC free article] [PubMed] [Google Scholar]
- 123. Sehgal N, Gupta A, Valli RK, et al. Withania somnifera reverses Alzheimer's disease pathology by enhancing low‐density lipoprotein receptor‐related protein in liver. Proc Natl Acad Sci U S A. 2012;109(9):3510‐3515. [DOI] [PMC free article] [PubMed] [Google Scholar]
- 124. Ridelman E, Kavanaugh J, McMillan R, Pittman J, Hulver M, Frisard M. Mitochondrial dysregulation in skeletal muscle from patients diagnosed with alzheimer's disease and sporadic inclusion body myositis. Open J Mol Integrative Physiol. 2014;04:11‐19. [Google Scholar]
- 125. Askanas V, Engel WK, Nogalska A. Pathogenic considerations in sporadic inclusion‐body myositis, a degenerative muscle disease associated with aging and abnormalities of myoproteostasis. J Neuropathol Exp Neurol. 2012;71(8):680‐693. [DOI] [PubMed] [Google Scholar]
- 126. De Paepe B. Sporadic inclusion body myositis: an acquired mitochondrial disease with extras. Biomolecules. 2019;9(1). [DOI] [PMC free article] [PubMed] [Google Scholar]
- 127. Gang Q, Bettencourt C, Machado PM, et al. The effects of an intronic polymorphism in TOMM40 and APOE genotypes in sporadic inclusion body myositis. Neurobiol Aging. 2015;36(4):1766.e1761‐1766.e1763. [DOI] [PMC free article] [PubMed] [Google Scholar]
- 128. Ishii M, Iadecola C. Metabolic and non‐cognitive manifestations of alzheimer's disease: the hypothalamus as both culprit and target of pathology. Cell Metab. 2015;22(5):761‐776. [DOI] [PMC free article] [PubMed] [Google Scholar]
- 129. Vercruysse P, Vieau D, Blum D, Petersén Å, Dupuis L. Hypothalamic alterations in neurodegenerative diseases and their relation to abnormal energy metabolism. Front Mol Neurosci. 2018;11:2. [DOI] [PMC free article] [PubMed] [Google Scholar]
Associated Data
This section collects any data citations, data availability statements, or supplementary materials included in this article.
Supplementary Materials
Supporting Information