

Summary
The neural retina and retinal pigment epithelium (RPE) maintain a symbiotic metabolic relationship, disruption of which leads to debilitating vision loss. The current study was undertaken to identify the differences in the steady-state metabolite levels and the pathways functioning between bona fide neural retina and RPE. Global metabolomics and cluster analyses identified 650 metabolites differentially modulated between the murine neural retina and RPE. Of these, 387 and 163 were higher in the RPE and the neural retina, respectively. Further analysis coupled with transcript and protein level investigations revealed that under normal physiological conditions, the RPE utilizes the pentose phosphate (>3-fold in RPE), serine (>10-fold in RPE), and sphingomyelin biosynthesis (>5-fold in RPE) pathways. Conversely, the neural retina relied mostly on glycolysis. These results show how the RPE and the neural retina have acquired an efficient, complementary and metabolically diverse symbiotic niche to support each other's distinct functions.
Subject Areas: Metabolomics, Omics, Specialized Functions of Cells
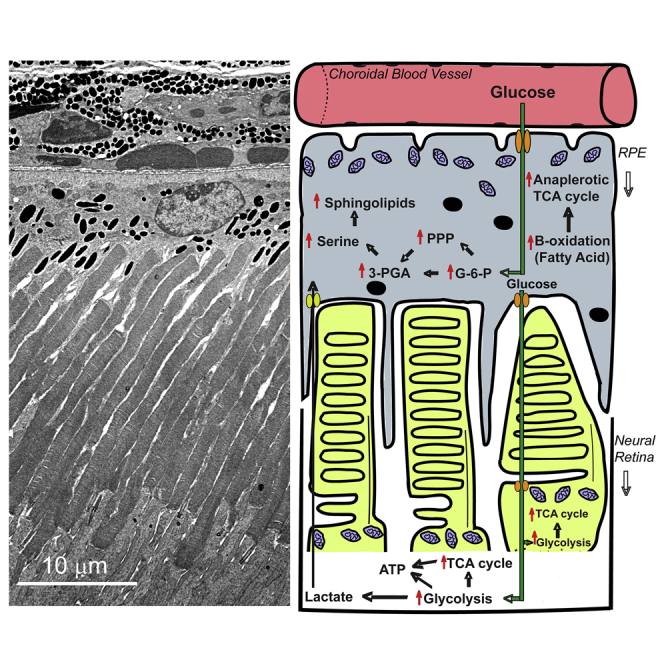
Graphical Abstract
Highlights
-
•
The first metabolic profiling of bona fide RPE and corresponding neural retina (NR)
-
•
Metabolomics correctly matches gene expression pattern of RPE-NR metabolic symbiosis
-
•
Serine biosynthesis, sphingolipid metabolism, and PPP are elevated in RPE over NR
Metabolomics; Omics; Specialized Functions of Cells
Introduction
Although the neural retina is known to be glycolytic (Ames et al., 1992, Winkler, 1981), until recently little attention has been given to the metabolic activity of the retinal pigment epithelium (RPE). Besides its structural support, the RPE maintains its metabolic homeostasis and that of the neural retina by bidirectional filtering of metabolites and thus providing highly regulated nutritional support to the neural retina (Lehmann et al., 2014, Strauss, 2005). One of the most critical roles of the RPE is the daily phagocytosis of the photoreceptor outer segments (OSs) and recycling of their essential components back to the neural retina (Kevany and Palczewski, 2010). This is further compounded by the fact that a single RPE cell interacts with multiple photoreceptor OSs (Snodderly et al., 2002, Volland et al., 2015) and thus undoubtedly increases its metabolic and recycling load (Strauss, 2005). As the high metabolic activity of the neural retina is mainly contributed by the photoreceptors (Country, 2017, Wong-Riley, 2010), this creates more demand on the RPE to maintain the high metabolic requirements (Kanow et al., 2017). Any dysregulation to this will lead to retinal dystrophies like age-related macular degeneration (AMD) and retinitis pigmentosa (RP) (Ferrington et al., 2017, Golestaneh et al., 2017, He and Tombran-Tink, 2010, Mao et al., 2014, Rohrer et al., 2016, Terluk et al., 2015).
Interestingly, most of our knowledge of the metabolic equilibrium between the RPE and the neural retina came from studies focused on OS phagocytosis in ex vivo or in vitro (Adijanto et al., 2014, Chinchore et al., 2017, Du et al., 2016a, Du et al., 2016b, Kanow et al., 2017, Reyes-Reveles et al., 2017, Swarup et al., 2019). These studies have demonstrated the dependence of the RPE metabolism on OS phagocytosis and recycling back to the neural retina. Although these studies support the notion of metabolic interdependence between these tissues, a comprehensive comparative metabolic profiling of the RPE and the neural retina under physiological steady-state condition is lacking. However, a recent in vivo study demonstrated the effect of factors like mode of euthanasia and how they could differentially alter the levels of some metabolites in the neural retina and RPE (Zhu et al., 2018). It is therefore imperative to comparatively evaluate the homeostatic metabolic signature of both the neural retina and the RPE.
In the current study, we elucidated the metabolic symbiosis between the neural retina and the RPE by measuring their steady-state metabolites and mapped their respective pathways. To eliminate potential variabilities, samples were highly controlled using inbred 45-days-old C57BL/6 mice that were fasted for 6 h; tissues were collected within short time (~2 min per sample), at a specific time of the day (2–3 p.m.), and from anesthetized animals to avoid the effect of carbon dioxide euthanasia. Furthermore, neural retina and its corresponding RPE-choroid from six animals were combined to increase the power of each data point. Ultra-high-performance liquid chromatography-tandem mass spectrometry (UPLC-MS/MS) analyses on at least eight different samples identified 650 metabolites from both tissues that showed differential levels. A total of 387 metabolites were found higher in the RPE-choroid, whereas 163 were higher in the neural retina. Mapping their pathways pointed to the significant increase in the synthesis of phospholipids like phosphatidylserine and sphingolipid metabolism in the RPE-choroid. We also found that both the pentose phosphate pathway (PPP) and the serine biosynthesis pathway that feed off the glycolytic intermediates upstream to PGA (3-phosphoglycerate) were all elevated in the RPE-choroid by at least 2-fold over the neural retina. We also show several fold upregulation in β-oxidation of fatty acid in the RPE-choroid over the neural retina. In summary, our data state that the RPE-choroid is at a much higher metabolic state than previously appreciated.
Results
Metabolic Clustering Is Significantly Different in the RPE and the Neural Retina
In vivo comparisons of the steady-state levels of metabolites in the neural retina and the RPE are understudied. Most of our information on the levels of these metabolites has been from in vitro system and flux analyses (Du et al., 2016a, Kanow et al., 2017, Yam et al., 2019). Here, we focused our studies to address the steady-state differences in these metabolites between the neural retina and the RPE-choroid in inbred C57BL/6 mice at a time of the day where the least variabilities are anticipated from OS shedding (Yu et al., 2018) and rhythmic protein synthesis (Serin and Acar Tek, 2019). We also chose to fast the animals for 6 h to overcome the inconsistencies arising from blood nutrient level variations resulting from ad libitum feeding. We have recently shown that 6-h fasting is adequate to reflect the steady-state level of some metabolites in the neural retina and the RPE (Sinha et al., 2018). Indeed, blood glucose levels from fasted animals were significantly lower than the ad libitum-fed animals, and more interestingly, we noticed much less variabilities between the samples (Figure 1A). Furthermore, and to ensure reliability of the data, we combined samples from six different animals where their RPE-choroid was collected in one tube and comparable neural retinas in the other tube and was considered as one sample. At least eight samples were collected for each tissue. It is important to note that sample collections were done within a short period (~2 min per eye) and while the animal is under anesthesia to avoid interference from euthanasia with carbon dioxide (Overmyer et al., 2015). Samples were immediately flash frozen and stored at −80°C until analysis.
Figure 1.

Metabolic Clustering in the RPE and Retina
(A) Blood glucose levels in fasted and unfasted animals before tissue collection for metabolomics analyses shown as min-max whisker plot with error bars reflecting mean ± SEM.
(B) Principal-component analysis of all samples reveal significantly discrete separation for both groups (neural retina in red, RPE-choroid in green), with contribution of each principal component showed in % along the axes.
(C) Volcano plot on all samples shows significantly different metabolites (shown in pink) across RPE-choroid and neural retina with a cutoff of p < 0.05 (t test).
(D) Pathway enrichment using respective HMDB and KEGG ID segregates these metabolites in distinct metabolic pathway as clusters, with each reflecting RPE-choroid to neural retina ratio as elevation in red circle and reduction in green circle. The degree of impact of each change to the respective metabolic pathway is reflected by the size of the circles.
(E) Scattered plots of the metabolites whose comparative levels have been previously published are shown here to corroborate with our analysis. Student's two-tailed t test was done for statistical test with ∗∗∗∗p < 0.0001. (NR, neural retina; RPE-Ch, RPE-choroid).
Principal component analysis revealed clear segregation between the metabolites of the two tissues for all samples (Figure 1B), with principal component 1 (PC1) contributing 61.3% and principal component 2 (PC2) contributing 8.4%. Furthermore, volcano plot analyses revealed 650 metabolites having either Kyoto Encyclopedia of Genes and Genomes (KEGG) or Human Metabolome Database (HMDB) IDs to be significantly different (t test, p < 0.05) between the neural retina and the RPE-choroid (Figure 1C). Statistical analysis coupled with pathway enrichment segregated these metabolites into discrete clusters, reflecting their elevation or depression as a ratio of their levels in the RPE-choroid to the neural retina and the impact of these changes on each of the cluster (Figure 1D). The clusters associated with the amino acid, peptide, and lipid metabolism have the highest degree of impact on the RPE-choroid over the neural retina, whereas the cluster associated with the carbohydrate metabolism has lesser impact. In the neural retina, we found that the cluster linked with purine/pyrimidine metabolism has the highest effect. As a confirmation of the validity of our finding, we show (Figure 1E) that the measurements of known metabolites like cGMP (Diederen et al., 2007, Ferrendelli and De Vries, 1983), flavins (Sinha et al., 2018), gamma-aminobutyric acid (GABA) (Bringmann et al., 2013, Cheng et al., 2013), and retinoids (Kuksa et al., 2003) are in agreement with previous data.
Parts of the Glycolysis Pathway in the RPE Are Selectively Elevated
It is known that the glucose flux through glycolysis in the neural retina is much higher than in the RPE, although it is mainly transported from the RPE (Hurley et al., 2015, Kanow et al., 2017). In cases when glucose uptake by the RPE was reduced, neural retinal glucose uptake was diminished (Swarup et al., 2019). However, the steady-state levels of glucose in the RPE relative to the neural retina have not been assessed. Figure 2A shows that the steady-state level of glucose in the RPE-choroid is 3-fold higher than in the neural retina, after 6 h of fasting. To ascertain whether this higher level of glucose in the RPE-choroid is to satisfy the metabolic demand of the RPE or to act as a reservoir for the neural retina, the levels of phosphorylated glucose were assessed (Figure 2B). RPE-choroid level of glucose-6-phosphate (G-6-P) is ~3.5-fold higher than that of the neural retina, mirroring the glucose levels. This suggests that the RPE utilizes glucose for its own metabolic needs. The fact that we observed no differences in the levels of the subsequent glycolytic intermediate, fructose 1,6-bisphosphate, between the neural retina and the RPE-choroid (Figure 2C), suggests that the RPE uses G-6-P in an alternative pathway, likely the PPP.
Figure 2.

Upregulation of Specific Glycolytic Intermediates
(A–K) Various metabolites involved in the glycolysis and pentose phosphate pathway were analyzed from neural retina and RPE-choroid. The levels of these metabolites for both neural retina and RPE-choroid are shown (A–J) along with a graphical representation of glycolysis (K), with the significantly elevated metabolites in RPE-choroid boxed in red, those elevated in neural retina marked by an underline, and those not measured marked by an asterisk. Each group has a sample size of n = 8 for neural retina and n = 9 for RPE-choroid. The metabolites having significant differences between neural retina and RPE-choroid are shown (A–G) with ∗∗p<0.001, ∗∗∗p<0.0001, and ∗∗∗∗p<0.00001. Data presented as mean ± SEM. (NR, neural retina; RPE-Ch, RPE-choroid).
Pentose Phosphate Pathway Is Significantly Higher in the RPE
We next evaluated the metabolites involved in the PPP to assess whether it is indeed the alternative pathway for the RPE to utilize G-6-P. As the rate-limiting step of the PPP is 6-phosphogluconate, it is expected that if levels of 6-phosphogluconate are high, then G-6-P does not enter PPP (Stincone et al., 2015). Interestingly, 6-phosphogluconate level in the RPE-choroid is about half that in the neural retina (Figure 2D), demonstrating that PPP is more active in the RPE than in the neural retina and that it is likely the pathway for the RPE to utilize G-6-P. This observation is further supported by the higher levels of the subsequent intermediates of the PPP in the RPE-choroid, ribose monophosphate (~3-fold) and sedoheptulose-7-phosphate (~2.5-fold) (Figures 2E and 2F).
In support of our observation is the fact that when isocitrate dehydrogenase activity was blocked (i.e., reductive carboxylation), steady-state levels of redox potential markers were found unchanged in the RPE-choroid, suggesting that they likely are provided by the PPP (Du et al., 2016b). Indeed, assessment of the primary output of PPP (NADP+/NADPH) revealed that NADPH level is high in the RPE-choroid (Figure S1A), further validating the preference of the RPE to run an elevated PPP than the neural retina.
Glycolysis Is Partially Elevated Post-Pentose Phosphate Pathway
As PPP feeds back to glycolysis via glyceraldehyde-3-phosphate (Figure 2K), we here assessed the steady state levels of 3-phosphoglycerate and found it to be ≥ 3-fold higher in the RPE-choroid (Figure 2G). We next assessed the steady-state levels of the metabolites post this step in the glycolytic pathway and found them to be comparable to that of the neural retina (Figures 2H–2J). Because of this unexpected outcome and the fact that glucose in the neural retina is converted to lactate (Winkler et al., 2008) and flux analysis showed it to be transported to the RPE to enter the tricarboxylic acid (TCA) cycle (Hurley et al., 2015), the comparable steady-state levels of lactate in the RPE is likely maintained by the neural retina. This is supported by the high expression level of pyruvate kinase M2 (Figure 2K) in the photoreceptors (Chinchore et al., 2017, Lindsay et al., 2014, Rajala et al., 2016, Rajala et al., 2018, Rueda et al., 2016, Wubben et al., 2017).
RPE Harbors an Elevated Anaplerotic TCA Cycle
We next evaluated the steady-state levels of the TCA metabolites. The levels of citrate and aconitate are found to be higher in the RPE-choroid by >1.3-fold and >2.5-fold, respectively, whereas α-ketoglutarate level is lower by ~2.5-fold (Figures 3A–3C). As the latter feeds the next steps in the TCA cycle and to glutamate synthesis, we next evaluate their associated metabolites. For the next step in the TCA, we measured the steady-state level of succinate and found it to be 1.5-fold higher in the RPE-choroid (Figure 3D), whereas fumarate and malate are slightly lower (Figures 3E and 3F). As previously shown (Du et al., 2013), we also found that the glutamate level is significantly lower in the RPE-choroid (Figure 3G), whereas levels of glutamine, ornithine, and proline, metabolites derived from glutamate, are unexpectedly higher (Figures 3H–3J). Based on these results, we conclude that the TCA cycle intermediates are used by both the neural retina and the RPE to support the synthesis of these non-essential amino acids, but more so in the RPE. This observation is in sync with the higher flux of proline synthesis from glucose seen in the RPE (Du et al., 2016b) and with the observation that proline is a modulator of cellular redox potential (Krishnan et al., 2008) known to be high in the RPE.
Figure 3.

Differential Anaplerotic Shunt in the RPE and Retina
(A–K) Metabolites involved in the TCA cycle were analyzed from neural retina and RPE-choroid. The levels of these metabolites for both neural retina and RPE-choroid are shown (A–H, J, and K) along with a graphical representation of TCA cycle (I), with the significantly elevated metabolites in RPE-choroid boxed in red, those elevated in neural retina marked by underline, and those not measured marked by an asterisk. Each group has a sample size of n = 8 for neural retina and n = 9 for RPE-choroid. The metabolites having significant differences between neural retina and RPE-choroid are shown (A–E) with ∗p < 0.05, ∗∗p < 0.001, ∗∗∗p < 0.0001, and ∗∗∗∗p < 0.00001. Data represented as mean ± SEM. (NR, neural retina; RPE-Ch, RPE-choroid).
Progression of the TCA cycle is controlled chiefly by the synthesis of α-ketoglutarate and its irreversible breakdown into succinate (Figure 3K) (Wan et al., 1989). It has been shown that the higher level of succinate inhibits α-ketoglutarate dehydrogenase activity and thus prevents its progression through the TCA cycle (Smith et al., 1974). Therefore, it is likely that the consumption of α-ketoglutarate in the RPE is through anaplerotic part of the TCA rather than through cataplerosis. This is supported by our finding that the combined (cytoplasmic and mitochondrial) ratio of NAD+/NADH in the RPE-choroid is > 3-fold higher (Figure S1B).
β-Oxidation of Fatty Acids Is the Main Source of Fuel for the RPE
Two interesting questions arise from the previous results. First, how does the RPE manage to maintain higher level of the initial TCA cycle intermediates even with levels of pyruvate and lactate are comparable to those of the neural retina? Second, if the RPE is diverting its TCA cycle intermediates toward anaplerotic reactions, what is the main source of its ATP production? Acetyl CoA is produced from ketone bodies, β-oxidation of fatty acids, or lactate that is released from the neural retina (Akram, 2014, Kanow et al., 2017). All precursors of β-oxidation of fatty acids were found higher in the RPE-choroid (Figures 4A–4C) thus driving the reaction forward. This suggests that the majority of acetyl CoA entering the TCA cycle is likely coming from elevated β-oxidation of fatty acids in the RPE. Moreover, β-oxidation of fatty acids generates [(n/2)-1] molecules of NADH and FADH2 per cycle of β-oxidation from “n” carbons. We next assessed the steady-state levels of malonylcarnitine and deoxycarnitine, two rate-limiting metabolites in β-oxidation of fatty acids. Malonylcarnitine is known to be essential for the long-chain acylcarnitine entry into the mitochondria for fatty acid oxidation and was found to be ~4-fold higher in the RPE-choroid (Figure 4D). Following this, all the members of acylcarnitine involved in oxidation of fatty acids are elevated in the RPE-choroid. In addition, the precursor to L-carnitine, γ-butyrobetaine (deoxycarnitine), is significantly reduced >0.5-fold in the RPE-choroid (Figure 4E) thus pushing the acylcarnitine biosynthesis forward in the RPE-choroid. L-carnitine is essential for the oxidation of fatty acids as it enables transport of fatty acids across the mitochondrial membrane to trigger the process. Thus, the oxidation of fatty acids seems to be the primary source of energy generation in the RPE, in agreement with what was previously observed in an in vitro system (Adijanto et al., 2014). Products of fatty acid oxidation can be recycled as precursors for phospholipid synthesis, as evident from the higher level of diacylglycerol we detected in the RPE-choroid (Figures 4F and 4G). These oxidized lipids are known to recycle into sphingolipid synthesis in other tissues (Gault et al., 2010) and in agreement with our results showing elevated levels of sphingolipids and ceramides in the RPE-choroid (Figures 4H and 4I).
Figure 4.

Fatty Acid Metabolites and Sphingolipids Are Higher in RPE
(A–G) Metabolites involved in β-oxidation of fatty acids and sphingolipids (H and I) were analyzed in neural retina and RPE-choroid. The levels of these metabolites as a ratio of RPE-choroid over neural retina are shown, with only significantly elevated metabolites being marked inside red box and the significantly lower metabolites being marked inside green boxes. Each group has a sample size of n = 8 for neural retina and n = 8 for RPE-choroid. (A) Heatmap and dendrogram clustering for acylcarnitine metabolites in neural retina and RPE-choroid samples reflects distinct clustering between the two groups and clear elevation for most metabolites in the RPE-choroid. (B) Acylcarnitine metabolites involved in β-oxidation of fatty acids and having significant change (t test with p < 0.05) shown as fold change of RPE-choroid to neural retina from among the features identified in (C). (C) EBAM plot for the metabolites involved in acylcarnitine metabolism with a cutoff of 0.9 for delta identifies 43 significant metabolites (features) shown in empty green circles. (D) Malonylcarnitine levels shown in neural retina and RPE-choroid samples as a scatterplot (mean ± SEM) with t test for significance (∗∗∗∗p<0.00001). (E) Deoxycarnitine levels shown in neural retina and RPE-choroid samples as scatterplot (mean ± SEM) with t test of significance (∗∗∗∗p<0.00001). (F) Heatmap and dendrogram clustering for diacylglycerol metabolites across all neural retina and RPE-choroid samples reflects distinct clustering between the two groups and clear elevation for most metabolites in the RPE-choroid. (G) EBAM plot for the diacylglycerol metabolites with a cutoff of 0.9 for delta identifies 17 significant metabolites (features) shown in empty green circles.
(H) Heatmap and dendrogram clustering for sphingolipid metabolites across all neural retina and RPE-choroid samples reflects distinct clustering between the two groups and clear elevation for most metabolites in the RPE-choroid.
(I) EBAM plot for the metabolites involved in sphingolipid metabolism with a cutoff of 0.9 for delta identifies 29 significant metabolites (features) shown in empty green circles. (NR, neural retina; RPE-Ch, RPE-choroid).
Phosphatidylserine and Sphingolipid Biosynthesis Is Partially Responsible for Glycolytic Elevation in the RPE
The elevated steady-state level of 3-phosphoglycerate in the RPE-choroid coupled with comparable levels of metabolites downstream glycolysis suggests the utilization of 3-phosphoglycerate by an alternative pathway, likely serine biosynthesis. Both serine and its precursor phosphoserine were found to be >1.5-fold higher in the RPE-choroid (Figures 5A, 5D, and 5E). Accordingly, levels of specific members of phosphatidylserine listed in Figure 5A were also found higher in the RPE-choroid. As phosphatidylserine is synthesized in the final step, with inositol being replaced by serine, levels of the members of phosphatidylinositol pathway are lower in the RPE-choroid (Figure 5B), further indicative of the direction of the reaction. The lysophospholipids that are incorporated into these phospholipids also reflect a similar trend as above (Figure 5C), i.e., serine incorporated into lysophospholipids is significantly higher, whereas inositol incorporated into lysophospholipids is significantly lower.
Figure 5.

Phosphatidylserine Synthesis is Elevated Over Other Phospholipids
(A–C) Metabolites involved in phospholipid synthesis were analyzed in neural retina and RPE-choroid. Each group has a sample size of n = 8 for neural retina and n = 8 for RPE-choroid, with only significantly elevated metabolites being marked inside red box and the significantly lower metabolites being marked inside green box in the tables for respective pathway. (A) Heatmap with dendrogram clustering of metabolites involved in phosphatidylserine synthesis across neural retina and RPE-choroid samples reflects clear elevated levels in the RPE-choroid samples and distinct clustering between the two groups. EBAM plot for the metabolites involved in phosphatidylserine biosynthesis with a cutoff of 0.9 for delta identifies the significant metabolites (features) shown in empty green circles shown in Figure S2. Fold change of RPE-choroid to neural retina is shown for five of these metabolites here, with the precursors of phosphatidylserine biosynthesis in the upper table and the products in the lower table. (B) Heatmap and dendogram clustering of metabolites involved in phosphatidylinositol synthesis across neural retina and RPE-choroid samples reflects clear reduced levels in the RPE-choroid and distinct clustering between the two groups. EBAM plot for the metabolites involved in phosphatidylinositol synthesis with a cutoff of 0.9 for delta identifies the significant metabolites (features) shown in empty green circles shown in Figure S2. Three of these metabolites are shown here in the table as fold change of RPE-choroid to neural retina and reflects the highly reduced levels in RPE-choroid. (C) Heatmap and dendogram clustering of metabolites involved in lysophospholipid synthesis across neural retina and RPE-choroid samples reflects distinct clustering between the two groups. EBAM plot for the metabolites involved in lysophospholipid synthesis with a cutoff of 0.9 for delta identifies the significant metabolites (features) shown in empty green circles shown in Figure S2. Six of these metabolites having significance are shown in the tables as fold change of RPE-choroid to neural retina and reflect highly reduced levels in RPE-choroid for the lysophospholipids with inositol, whereas the ones with serine being higher.
(D–I) (D and E) Serine biosynthesis metabolites and their utilization in glycine (F) and sphingolipid metabolism (G and H) are shown as scatterplots to supplement to their heatmap as in Figures 4 and 5, along with a representation of the pathway (I) with the significantly elevated metabolites in RPE-choroid boxed in red, those elevated in neural retina marked by underline, and those not measured marked by an asterisk. Student's two-tailed t test was done for statistical test with ∗∗∗∗p < 0.0001. (NR, neural retina; RPE-Ch, RPE-choroid).
These results are in agreement with the above-mentioned higher levels of sphingolipid in the RPE-choroid and conclude that serine is the main precursor for its synthesis (Nikolova-Karakashian and Reid, 2011). Even though serine can be converted to glycine, we found that the latter's level is < 0.6-fold lower in the RPE-choroid (Figure 5F). In support of the finding that serine biosynthesis is elevated in the RPE-choroid, we interestingly observed increase in the steady-state levels of the precursors of sphingolipid synthesis, sphingadienine (>3-fold) and sphinganine (>3-fold) (Figures 5G and 5H). These changes are summarized in Figure 5I, depicting the serine biosynthesis pathway and sphingolipid biosynthesis being elevated in the RPE over the NR. Our data so far are in sync with a previous in vitro study showing that the RPE harbors enhanced glucose flux entering serine biosynthesis (Du et al., 2016b).
Enzyme Levels in the Pentose Phosphate, Serine, and Sphingolipid Biosynthesis Pathways Are Significantly Elevated in the RPE
To determine whether the steady-state levels of metabolites in various metabolic pathways are differential between the RPE and the neural retina or also a reflection of their elevated relevant enzyme levels, we assessed the publicly available microarray gene expression dataset (GSE10246) (Lattin et al., 2008). This dataset was selected because both the age and strain of mice used matched ours. Processing the raw data and as presented in Figure 6A, we found that the transcript levels of almost all enzymes involved in metabolism are reflective of our metabolomics findings. A set of genes known to be highly expressed in the neural retina or the RPE, respectively, were chosen as controls and helped in validation of the dataset. Subsequently, the expression level of genes transcribing enzymes for glutathione peroxidase, sphingolipid biosynthesis, and initial reactions of the TCA cycle, serine biosynthesis, PPP, and β-oxidation of fatty acids were found to be higher in the RPE. To confirm this observation and to determine whether the level of the proteins were reflective of their equivalent message, key metabolic enzymes, in the RPE-choroid and neural retina, were quantified using immunoblotting. Both the transcript and protein levels for PGD (phosphogluconate dehydrogenase), the rate-limiting enzyme in the PPP, are higher (Figures 6A and 6B) in the RPE-choroid. The NADP+/NADPH ratio (Figure S1A) also supports this observation. The elevated levels of glutathione peroxidase transcripts found in the RPE-choroid (Figure 6A) are in agreement with the lower ratio of GSH/GSSG we detected in the RPE-choroid (Figure S1C). In addition, transcript levels of serine biosynthesis enzymes are all found elevated in the RPE-choroid, whereas the transcripts of the glycolytic enzymes leading to pyruvate synthesis are lower (Figure 6A). This is in agreement with our data in Figures 2 and 3 and the immunoblots in Figure 6B showing more PHGDH (phosphoglycerate dehydrogenase) and PSAT1 (phosphoserine aminotransferase 1) present in the RPE-choroid. Similarly, higher amount of PKM2 (pyruvate kinase) is detected in the neural retina at the protein level (Figure 6B). The heatmap and the accompanying immunoblots (Figures 6A and 6B) also show that the transcripts of the first two enzymes in the TCA cycle, citrate synthase and aconitase, along with all the enzymes involved in β-oxidation of fatty acids are also higher in the RPE-choroid, in support of our conclusion that the primary fuel entering the TCA cycle in the RPE-choroid is probably from β-oxidation and not glycolysis. Also, the transcripts of the enzymes involved in sphingolipid biosynthesis as well as the immunoblot of SGMS1 (sphingomyelin synthase 1) (Figures 6A and 6B) are higher in the RPE-choroid indicating sphingolipid metabolism being a critical component of the RPE-choroid as shown also in Figures 4H and 4I.
Figure 6.

Transcript and Protein Levels of Metabolic Enzymes
(A) Microarray expression data from GSE10246 shows relative enrichment of the RPE-choroid in multiple enzymes involved in various metabolic pathways. The enzyme names are shown on the right, and the ones further analyzed at protein level in (B) have been marked with black arrowheads. The pathways the enzymes are involved in are shown on the left side of the heatmap.
(B) Steady-state protein levels of some of the metabolic enzymes as in (A) for both RPE-choroid and neural retina further show elevated levels in the RPE-choroid. Each blot was performed twice, and a single representative image is shown here. Graphical representation of the quantitation performed on the immunoblots is shown next to the respective blot. Each group had n = 4, and each experiment was performed twice with five pooled retina and RPE-choroid in each sample. (NR, neural retina; RPE-Ch, RPE-choroid).
Discussion
Studies using animal models have provided invaluable information on the important role of metabolic homeostasis in the health of the retina and pointed to the complex network of many players, which when altered lead to an aberrant metabolism. Although studies on human fetal (Adijanto et al., 2014, Adijanto and Philp, 2014, Chao et al., 2017, Du et al., 2016b, Kanow et al., 2017, Reyes-Reveles et al., 2017, Swarup et al., 2019, Yam et al., 2019), immortalized (Iacovelli et al., 2016, Samuel et al., 2017), or patient-derived RPE cells (Jin et al., 2012, Jin and Takahashi, 2012, Jun et al., 2019, Liao et al., 2010, Maeda et al., 2013) had surfaced the importance of metabolic symbiosis between the neural retina and the RPE, in vivo assessments are lacking. Much of our present knowledge on the differences in metabolic “flux” between the “RPE” and the neural retina comes from published work on either the “mouse eyecup (choroid, sclera, RPE)” or the “RPE-choroid” metabolic activity being interpreted as the “RPE” metabolic activity in both physiology and pathology (Brown et al., 2019, Grenell et al., 2019, Kanow et al., 2017, Kurihara et al., 2016, Wang et al., 2018, Yam et al., 2019, Zhu et al., 2018). One of the seminal articles credited for unraveling the mechanism of the RPE-photoreceptor metabolic ecosystem measured flux of labeled metabolites in between the two tissues (Kanow et al., 2017). In fact, in multiple experiments the authors used mouse eyecups and termed it as “bona fide” RPE. This was possible as they show that even though “RPE-choroid” of the mouse eyecup was composed of choroid and sclera tightly associated to the mouse RPE, the latter is far more metabolically active than either sclera or choroid and thus contributes overwhelmingly to the metabolite pool of “RPE-choroid” (Kanow et al., 2017). In the current study, we present a picture of the neural retina-RPE steady-state metabolic ecosystem taken in the middle of the light cycle and after 6 h of fasting. We reconstructed this metabolic landscape by correlating the respective steady-state metabolites and their corresponding metabolic enzyme levels from the murine neural retina and its respective RPE. As stated above, even though the flux of labeled metabolites between these two tissues is known, we show here that these differ significantly from the steady-state levels. Compared with the neural retina, we found the RPE has selectively elevated certain glycolytic and TCA cycle intermediates and coupled it with a highly elevated PPP to enable efficient serine and sphingolipid biosynthesis.
To measure the steady-state levels in the current study, we kept the time of collection of the tissue constant, i.e., at the middle of the light cycle (2–3 p.m.) to prevent effects of shedding and time of day being a variable; we fasted the animals for 6 h to ensure differential feeding does not interfere with the steady-state level of the metabolites; we used bona fide neural retina and corresponding RPE-choroid; and we collected the tissue from anesthetized animals rather than post-euthanasia with carbon dioxide. As explained earlier, it is well established that the RPE-choroid metabolic signature is actually representative of the bona fide RPE metabolism and does not skew the latter. Thus we used RPE-choroid in all our metabolite measurements.
It is important to note that the steady-state levels of glycolysis in the RPE have never been looked at under physiological conditions and we here show that the RPE has more than 3-fold requirement for glycolysis than the neural retina. Even though it is well accepted that the rate of glycolysis in the neural retina is very high (Futterman and Kinoshita, 1959, Winkler, 1981), the argument exists that the primary reason for this, besides rapid ATP production, is the generation of secondary metabolites as by-products of glycolysis (Ng et al., 2015). It has been suggested that the RPE is less dependent on glucose (Kanow et al., 2017) and transports most of its blood-supplied glucose to the neural retina (Wang et al., 2019). Glucose deprivation has also failed to result in significant RPE degeneration or metabolic imbalance (Swarup et al., 2019). Even though the neural retina may initially take up the majority of glucose entering the RPE (Wang et al., 2019), our results suggest that the neural retina not only has lower basal level of glucose but also metabolizes less glucose than the RPE. This likely indicates that upon retinal saturation with glucose, the RPE's steady-state level of glucose accumulates for its own use. This observation is further supported by higher levels of glycolytic products that feed to serine biosynthesis and PPP. Both these pathways can generate the reductive currency to combat oxidative stress. In agreement with this, our study also revealed significant elevation of PPP, ratio of GSH/GSSG, and glutamine levels along with reduction in NADP+/NADPH ratio in the RPE to facilitate the scavenging efficiency of free radicals. We have also recently reported that the RPE also acquires high levels of flavins, another free radical-scavenging cofactor, when compared with neural retina at all ages (Sinha et al., 2018). Reduction in the steady-state levels of these radical-scavenging components in the RPE can disrupt the neural retina-RPE metabolic homeostasis, leading to pathologies such as AMD and diabetic retinopathy (DR) (Coffe et al., 2006).
Furthermore, we found the RPE matches the neural retina in PEP, pyruvate, and lactate levels. These results can be explained by the rapid transport of lactate from the neural retina to the RPE (Hurley et al., 2015), albeit remotely as these are steady-state levels and the notion that the RPE glycolytic flux is not only driven by pyruvate requirement but also by our finding of elevated serine biosynthesis. It is further possible that the metabolic preferences change in the RPE in diseased conditions and that the RPE may have a better fallback option than the neural retina to switch to, which helps it recuperate rapidly even when glucose reliance is removed (Chinchore et al., 2017). We also show that the RPE has an effective TCA cycle anaplerosis, a finding supported by recent study showing glucose deprivation affecting the RPE to a lesser degree (Swarup et al., 2019). Thus, it seems the RPE is less reliant on glycolysis. The initial metabolites for the TCA cycle in the RPE can alternatively be obtained from (1) a high level of β-oxidation (Reyes-Reveles et al., 2017), (2) lactate transport from the neural retina (Kanow et al., 2017), and (3) a highly efficient reductive carboxylation system (Du et al., 2016b).
It has been reported that under in vitro conditions the RPE is highly reliant on ketogenesis of the phagocytosed OSs (Reyes-Reveles et al., 2017). Similarly, Sparrow et al. (Sparrow et al., 2010) and Diegner et al. (Deigner et al., 1989, Rando, 1991) have independently shown that retinoid recycling by the RPE is fueled by metabolizing the phospholipids obtained during OS phagocytosis. It is possible that the RPE is more dynamic than the neural retina and actually utilizes different fuel at different times of the day. Similarly, our results indicate that in the middle of the light cycle, the acylcarnitine-mediated lipid oxidation in the mitochondria is higher in the RPE than in the neural retina. This coupled with the finding that the TCA cycle is more anaplerotic indicates that most of the ATP in the RPE is actually generated via fatty acid oxidation following OS phagocytosis. Thus, not only do the photoreceptors rely on the RPE for proper functioning but also the major bulwark of the RPE metabolism cannot function in the absence of healthy OS and their subsequent phagocytosis into the RPE.
It is also interesting that the serine biosynthesis pathway is preferentially elevated in the RPE over the neural retina, even though concentrated amounts of serine are observed at the tips of the phagocytosed OSs (Ruggiero et al., 2012). Our results are in agreement with previous flux studies (Du et al., 2016b), which demonstrated that serine levels are higher in the RPE and may be transported to the neural retina. We also observed that the levels of phosphatidylserine are much higher in the RPE than in the neural retina. As all samples were collected in the middle of the light cycle, these products likely reflect newly synthesized rather than remnants of phagocytosed OSs. Whether these phospholipids are to satisfy RPE's need or are transported back to the photoreceptors, is an interesting question that deserves further investigation. An essential pathway that can utilize newly synthesized serine would be sphingolipid metabolism. It is well known that sphingolipids are critical for the neural retina, but their presence in the RPE has not been described. We show that almost all sphingolipid species are far higher in the RPE than in the neural retina. Our metabolite data show that sphingolipids are actually synthesized in the RPE and are corroborated with evidence from both protein and transcript level expression. This means we may have new therapeutic targets for all these retinal dystrophies and calls for much needed research in their dysregulation in the RPE as well. This also presents an unforeseen function as the role of sphingolipids in RPE metabolism has barely been investigated, although there have been so many reports of an impaired sphingolipid rheostat in various diseases affecting both the neural retina and the RPE. Examples of such diseases are AMD, Stargardt disease, DR, and RP (Simon et al., 2019, Stiles et al., 2016). Patients suffering from macular diseases are also known to have impaired serine metabolism (Scerri et al., 2017), and a recent publication showed that toxic sphingolipids in the neural retina pose a risk factor for macular telangiectasia type 2 and peripheral neuropathy (Gantner et al., 2019). However, in light of our results here, it is possible that the impaired serine metabolism in these patients actually impairs RPE metabolism initially, in turn resulting in complete breakdown of the neural retina-RPE metabolic homeostasis leading to the pathology. Finally, the inter-relationship between phagocytosis and sphingolipid metabolism is quickly unfolding (Acharya et al., 2003, Bryan et al., 2015, Hinkovska-Galcheva et al., 2005). Therefore, it is imperative to question whether these elevated sphingolipid species in the RPE are a reflection of a similar or a distinct function.
Collectively, our work compares the steady-state metabolic activity in the neural retina with that in the RPE and we show that the steady-state adaptations are significantly different from the existent knowledge of labeled metabolite flux between these two tissues. Data presented show how the RPE-neural retina has adapted into an efficient, complimentary, and metabolically diverse symbiotic niche to support each other's distinct metabolic requirements. Further work needs to be done to elucidate if dysregulation of any of these pathways in the RPE or the neural retina may make the other more susceptible to pathologies that could affect either one.
Limitations of the Study
Tissue was collected while the animals were under anesthesia rather than euthanasia, so as to eliminate changes that may be attributed to elevated carbon dioxide in the blood. However, we cannot rule out potential effects of anesthesia as a factor. However, tissue collection time was minimized by performing the steps on ice, keeping the duration consistent and short.
It is widely accepted that flux and steady state together provide a complementary picture of metabolism, even though they independently may not reflect the same results under the same conditions. Multiple flux analyses have been performed on the neural retina and very few on the RPE but no studies so far addressed the steady-state measurements. Our results coupled with published flux data help us build a comprehensive understanding of the neural retina-RPE metabolic niche. However, it must be kept in mind that many factors could significantly affect both steady state and flux analyses and their interpretations. Examples of these factors are mode of euthanasia/anesthesia, time of tissue harvest, strain, whether neural retina was separated from the RPE-choroid before incubation in labeled metabolite, or analysis was performed in vivo. Another contributing experimental manipulation is whether animals were fasted or ad libitum fed.
The findings in this study are based on UPLC-MS/MS measurements and frozen samples from the murine retina. As noted in previous sections, measurement of metabolites using NMR can result in different values than UPMC-MS/MS. Furthermore, as elucidated in Transparent Methods section, we matched the metabolites identified to the ones known and cataloged in HMDB at the time we analyzed the data. Thus, there might be far more metabolites present differentially between the two tissues, which would become more apparent as they are added to HMDB. Another limitation as emphasized in the article is that all these measurements are done only at a specific time of the day and in mouse from a single strain/background. It would be interesting to note if the steady-state levels of the metabolites change significantly at different times of the day and also if they vary across different strains of mice.
Methods
All methods can be found in the accompanying Transparent Methods supplemental file.
Acknowledgments
We thank Dr. James Hurley for his insightful comments on the manuscript. This study was supported by a grant from the National Eye Institute (EY026499).
Author Contributions
T.S., M.R.A.-U., and M.I.N. all contributed to designing the experiments and writing the manuscript while T.S. performed all of the experiments and associated analyses.
Declaration of Interests
The authors declare no competing interests.
Published: April 24, 2020
Footnotes
Supplemental Information can be found online at https://doi.org/10.1016/j.isci.2020.101004.
Contributor Information
Muna I. Naash, Email: mnaash@central.uh.edu.
Muayyad R. Al-Ubaidi, Email: malubaid@central.uh.edu.
Supplemental Information
References
- Acharya U., Patel S., Koundakjian E., Nagashima K., Han X., Acharya J.K. Modulating sphingolipid biosynthetic pathway rescues photoreceptor degeneration. Science. 2003;299:1740–1743. doi: 10.1126/science.1080549. [DOI] [PubMed] [Google Scholar]
- Adijanto J., Du J., Moffat C., Seifert E.L., Hurle J.B., Philp N.J. The retinal pigment epithelium utilizes fatty acids for ketogenesis. J. Biol. Chem. 2014;289:20570–20582. doi: 10.1074/jbc.M114.565457. [DOI] [PMC free article] [PubMed] [Google Scholar]
- Adijanto J., Philp N.J. Cultured primary human fetal retinal pigment epithelium (hfRPE) as a model for evaluating RPE metabolism. Exp. Eye Res. 2014;126:77–84. doi: 10.1016/j.exer.2014.01.015. [DOI] [PMC free article] [PubMed] [Google Scholar]
- Akram M. Citric acid cycle and role of its intermediates in metabolism. Cell Biochem. Biophys. 2014;68:475–478. doi: 10.1007/s12013-013-9750-1. [DOI] [PubMed] [Google Scholar]
- Ames A., 3rd, Li Y.Y., Heher E.C., Kimble C.R. Energy metabolism of rabbit retina as related to function: high cost of Na+ transport. J. Neurosci. 1992;12:840–853. doi: 10.1523/JNEUROSCI.12-03-00840.1992. [DOI] [PMC free article] [PubMed] [Google Scholar]
- Bringmann A., Grosche A., Pannicke T., Reichenbach A. GABA and glutamate uptake and metabolism in retinal glial (muller) cells. Front. Endocrinol. (Lausanne) 2013;4:48. doi: 10.3389/fendo.2013.00048. [DOI] [PMC free article] [PubMed] [Google Scholar]
- Brown E.E., DeWeerd A.J., Ildefonso C.J., Lewin A.S., Ash J.D. Mitochondrial oxidative stress in the retinal pigment epithelium (RPE) led to metabolic dysfunction in both the RPE and retinal photoreceptors. Redox Biol. 2019;24:101201. doi: 10.1016/j.redox.2019.101201. [DOI] [PMC free article] [PubMed] [Google Scholar]
- Bryan A.M., Del Poeta M., Luberto C. Sphingolipids as regulators of the phagocytic response to fungal infections. Mediators Inflamm. 2015;2015:640540. doi: 10.1155/2015/640540. [DOI] [PMC free article] [PubMed] [Google Scholar]
- Chao J.R., Knight K., Engel A.L., Jankowski C., Wang Y.K., Manson M.A., Gu H.W., Djukovic D., Raftery D., Hurley J.B. Human retinal pigment epithelial cells prefer proline as a nutrient and transport metabolic intermediates to the retinal side. J. Biol. Chem. 2017;292:12895–12905. doi: 10.1074/jbc.M117.788422. [DOI] [PMC free article] [PubMed] [Google Scholar]
- Cheng Z.Y., Wang X.P., Schmid K.L., Liu L. Identification of GABA receptors in chick retinal pigment epithelium. Neurosci. Lett. 2013;539:43–47. doi: 10.1016/j.neulet.2013.01.038. [DOI] [PubMed] [Google Scholar]
- Chinchore Y., Begaj T., Wu D., Drokhlyansky E., Cepko C.L. Glycolytic reliance promotes anabolism in photoreceptors. Elife. 2017;6:1–22. doi: 10.7554/eLife.25946. [DOI] [PMC free article] [PubMed] [Google Scholar]
- Coffe V., Carbajal R.C., Salceda R. Glucose metabolism in rat retinal pigment epithelium. Neurochem. Res. 2006;31:103–108. doi: 10.1007/s11064-005-9236-7. [DOI] [PubMed] [Google Scholar]
- Country M.W. Retinal metabolism: a comparative look at energetics in the retina. Brain Res. 2017;1672:50–57. doi: 10.1016/j.brainres.2017.07.025. [DOI] [PubMed] [Google Scholar]
- Deigner P.S., Law W.C., Canada F.J., Rando R.R. Membranes as the energy-source in the endergonic transformation of vitamin-a to 11-cis-retinol. Science. 1989;244:968–971. doi: 10.1126/science.2727688. [DOI] [PubMed] [Google Scholar]
- Diederen R.M.H., La Heij E.C., Markerink-van Ittersum M., Kijlstra A., Hendrikse F., de Vente J. Cyclic GMP synthesis by human retinal pigment epithelial cells is mainly mediated via the particulate guanylyl cyclase pathway. Ophthalmic Res. 2007;39:55–59. doi: 10.1159/000098015. [DOI] [PubMed] [Google Scholar]
- Du J., Cleghorn W., Contreras L., Linton J.D., Chan G.C., Chertov A.O., Saheki T., Govindaraju V., Sadilek M., Satrustegui J. Cytosolic reducing power preserves glutamate in retina. Proc. Natl. Acad. Sci. U S A. 2013;110:18501–18506. doi: 10.1073/pnas.1311193110. [DOI] [PMC free article] [PubMed] [Google Scholar]
- Du J., Rountree A., Cleghorn W.M., Contreras L., Lindsay K.J., Sadilek M., Gu H., Djukovic D., Raftery D., Satrustegui J. Phototransduction influences metabolic flux and nucleotide metabolism in mouse retina. J. Biol. Chem. 2016;291:4698–4710. doi: 10.1074/jbc.M115.698985. [DOI] [PMC free article] [PubMed] [Google Scholar]
- Du J., Yanagida A., Knight K., Engel A.L., Vo A.H., Jankowski C., Sadilek M., Tran V.T.B., Manson M.A., Ramakrishnan A. Reductive carboxylation is a major metabolic pathway in the retinal pigment epithelium. Proc. Natl. Acad. Sci. U S A. 2016;113:14710–14715. doi: 10.1073/pnas.1604572113. [DOI] [PMC free article] [PubMed] [Google Scholar]
- Ferrendelli J.A., De Vries G.W. Cyclic GMP systems in the retina. Fed. Proc. 1983;42:3103–3106. [PubMed] [Google Scholar]
- Ferrington D.A., Ebeling M.C., Kapphahn R.J., Terluk M.R., Fisher C.R., Polanco J.R., Roehrich H., Leary M.M., Geng Z., Dutton J.R. Altered bioenergetics and enhanced resistance to oxidative stress in human retinal pigment epithelial cells from donors with age-related macular degeneration. Redox Biol. 2017;13:255–265. doi: 10.1016/j.redox.2017.05.015. [DOI] [PMC free article] [PubMed] [Google Scholar]
- Futterman S., Kinoshita J.H. Metabolism of the retina. I. Respiration of cattle retina. J. Biol. Chem. 1959;234:723–726. [PubMed] [Google Scholar]
- Gantner M.L., Eade K., Wallace M., Handzlik M.K., Fallon R., Trombley J., Bonelli R., Giles S., Harkins-Perry S., Heeren T.F.C. Serine and lipid metabolism in macular disease and peripheral neuropathy. N. Engl. J. Med. 2019;381:1422–1433. doi: 10.1056/NEJMoa1815111. [DOI] [PMC free article] [PubMed] [Google Scholar]
- Gault C.R., Obeid L.M., Hannun Y.A. An overview of sphingolipid metabolism: from synthesis to breakdown. Adv. Exp. Med. Biol. 2010;688:1–23. doi: 10.1007/978-1-4419-6741-1_1. [DOI] [PMC free article] [PubMed] [Google Scholar]
- Golestaneh N., Chu Y., Xiao Y.Y., Stoleru G.L., Theos A.C. Dysfunctional autophagy in RPE, a contributing factor in age-related macular degeneration. Cell Death Dis. 2017;8:e2537. doi: 10.1038/cddis.2016.453. [DOI] [PMC free article] [PubMed] [Google Scholar]
- Grenell A., Wang Y., Yam M., Swarup A., Dilan T.L., Hauer A., Linton J.D., Philp N.J., Gregor E., Zhu S. Loss of MPC1 reprograms retinal metabolism to impair visual function. Proc. Natl. Acad. Sci. U S A. 2019;116:3530–3535. doi: 10.1073/pnas.1812941116. [DOI] [PMC free article] [PubMed] [Google Scholar]
- He Y., Tombran-Tink J. Mitochondrial decay and impairment of antioxidant defenses in aging RPE cells. In: Anderson R., Hollyfield J., LaVail M., editors. Retinal Degenerative Diseases. Advances in Experimental Medicine and Biology. Springer; New York, NY: 2010. pp. 165–183. [DOI] [PubMed] [Google Scholar]
- Hinkovska-Galcheva V., Boxer L.A., Kindzelskii A., Hiraoka M., Abe A., Goparju S., Spiegel S., Petty H.R., Shayman J.A. Ceramide 1-phosphate, a mediator of phagocytosis. J. Biol. Chem. 2005;280:26612–26621. doi: 10.1074/jbc.M501359200. [DOI] [PubMed] [Google Scholar]
- Hurley J.B., Lindsay K.J., Du J. Glucose, lactate, and shuttling of metabolites in vertebrate retinas. J. Neurosci. Res. 2015;93:1079–1092. doi: 10.1002/jnr.23583. [DOI] [PMC free article] [PubMed] [Google Scholar]
- Iacovelli J., Rowe G.C., Khadka A., Diaz-Aguilar D., Spencer C., Arany Z., Saint-Geniez M. PGC-1 alpha induces human RPE oxidative metabolism and antioxidant capacity. Invest. Ophth Vis. Sci. 2016;57:1038–1051. doi: 10.1167/iovs.15-17758. [DOI] [PMC free article] [PubMed] [Google Scholar]
- Jin Z.B., Okamoto S., Xiang P., Takahashi M. Integration-free induced pluripotent stem cells derived from retinitis pigmentosa patient for disease modeling. Stem Cells Transl. Med. 2012;1:503–509. doi: 10.5966/sctm.2012-0005. [DOI] [PMC free article] [PubMed] [Google Scholar]
- Jin Z.B., Takahashi M. Generation of retinal cells from pluripotent stem cells. Prog. Brain Res. 2012;201:171–181. doi: 10.1016/B978-0-444-59544-7.00008-1. [DOI] [PubMed] [Google Scholar]
- Jun S., Datta S., Wang L., Pegany R., Cano M., Handa J.T. The impact of lipids, lipid oxidation, and inflammation on AMD, and the potential role of miRNAs on lipid metabolism in the RPE. Exp. Eye Res. 2019;181:346–355. doi: 10.1016/j.exer.2018.09.023. [DOI] [PMC free article] [PubMed] [Google Scholar]
- Kanow M.A., Giarmarco M.M., Jankowski C.S., Tsantilas K., Engel A.L., Du J., Linton J.D., Farnsworth C.C., Sloat S.R., Rountree A. Biochemical adaptations of the retina and retinal pigment epithelium support a metabolic ecosystem in the vertebrate eye. Elife. 2017;6:1–25. doi: 10.7554/eLife.28899. [DOI] [PMC free article] [PubMed] [Google Scholar]
- Kevany B.M., Palczewski K. Phagocytosis of retinal rod and cone photoreceptors. Physiology. 2010;25:8–15. doi: 10.1152/physiol.00038.2009. [DOI] [PMC free article] [PubMed] [Google Scholar]
- Krishnan N., Dickman M.B., Becker D.F. Proline modulates the intracellular redox environment and protects mammalian cells against oxidative stress. Free Radic. Biol. Med. 2008;44:671–681. doi: 10.1016/j.freeradbiomed.2007.10.054. [DOI] [PMC free article] [PubMed] [Google Scholar]
- Kuksa V., Imanishi Y., Batten M., Palczewski K., Moise A.R. Retinoid cycle in the vertebrate retina: experimental approaches and mechanisms of isomerization. Vis. Res. 2003;43:2959–2981. doi: 10.1016/s0042-6989(03)00482-6. [DOI] [PubMed] [Google Scholar]
- Kurihara T., Westenskow P.D., Gantner M.L., Usui Y., Schultz A., Bravo S., Aguilar E., Wittgrove C., Friedlander M., Paris L.P. Hypoxia-induced metabolic stress in retinal pigment epithelial cells is sufficient to induce photoreceptor degeneration. Elife. 2016;5:1–22. doi: 10.7554/eLife.14319. [DOI] [PMC free article] [PubMed] [Google Scholar]
- Lattin J.E., Schroder K., Su A.I., Walker J.R., Zhang J., Wiltshire T., Saijo K., Glass C.K., Hume D.A., Kellie S. Expression analysis of G Protein-Coupled Receptors in mouse macrophages. Immunome Res. 2008;4:5. doi: 10.1186/1745-7580-4-5. [DOI] [PMC free article] [PubMed] [Google Scholar]
- Lehmann G.L., Benedicto I., Philp N.J., Rodriguez-Boulan E. Plasma membrane protein polarity and trafficking in RPE cells: past, present and future. Exp. Eye Res. 2014;126:5–15. doi: 10.1016/j.exer.2014.04.021. [DOI] [PMC free article] [PubMed] [Google Scholar]
- Liao J.L., Yu J., Huang K., Hu J., Diemer T., Ma Z., Dvash T., Yang X.J., Travis G.H., Williams D.S. Molecular signature of primary retinal pigment epithelium and stem-cell-derived RPE cells. Hum. Mol. Genet. 2010;19:4229–4238. doi: 10.1093/hmg/ddq341. [DOI] [PMC free article] [PubMed] [Google Scholar]
- Lindsay K.J., Du J.H., Sloat S.R., Contreras L., Linton J.D., Turner S.J., Sadilek M., Satrustegui J., Hurley J.B. Pyruvate kinase and aspartate-glutamate carrier distributions reveal key metabolic links between neurons and glia in retina. Proc. Natl. Acad. Sci. U S A. 2014;111:15579–15584. doi: 10.1073/pnas.1412441111. [DOI] [PMC free article] [PubMed] [Google Scholar]
- Maeda T., Lee M.J., Palczewska G., Marsili S., Tesar P.J., Palczewski K., Takahashi M., Maeda A. Retinal pigmented epithelial cells obtained from human induced pluripotent stem cells possess functional visual cycle enzymes in vitro and in vivo. J. Biol. Chem. 2013;288:34484–34493. doi: 10.1074/jbc.M113.518571. [DOI] [PMC free article] [PubMed] [Google Scholar]
- Mao H., Seo S.J., Biswal M.R., Li H., Conners M., Nandyala A., Jones K., Le Y.Z., Lewin A.S. Mitochondrial oxidative stress in the retinal pigment epithelium leads to localized retinal degeneration. Invest. Ophthalmol. Vis. Sci. 2014;55:4613–4627. doi: 10.1167/iovs.14-14633. [DOI] [PMC free article] [PubMed] [Google Scholar]
- Ng S.K., Wood J.P., Chidlow G., Han G., Kittipassorn T., Peet D.J., Casson R.J. Cancer-like metabolism of the mammalian retina. Clin. Exp. Ophthalmol. 2015;43:367–376. doi: 10.1111/ceo.12462. [DOI] [PubMed] [Google Scholar]
- Nikolova-Karakashian M.N., Reid M.B. Sphingolipid metabolism, oxidant signaling, and contractile function of skeletal muscle. Antioxid. Redox Signal. 2011;15:2501–2517. doi: 10.1089/ars.2011.3940. [DOI] [PMC free article] [PubMed] [Google Scholar]
- Overmyer K.A., Thonusin C., Qi N.R., Burant C.F., Evans C.R. Impact of anesthesia and euthanasia on metabolomics of mammalian tissues: studies in a C57BL/6J mouse model. PLoS One. 2015;10:e0117232. doi: 10.1371/journal.pone.0117232. [DOI] [PMC free article] [PubMed] [Google Scholar]
- Rajala A., Wang Y., Brush R.S., Tsantilas K., Jankowski C.S.R., Lindsay K.J., Linton J.D., Hurley J.B., Anderson R.E., Rajala R.V.S. Pyruvate kinase M2 regulates photoreceptor structure, function, and viability. Cell Death Dis. 2018;9:240. doi: 10.1038/s41419-018-0296-4. [DOI] [PMC free article] [PubMed] [Google Scholar]
- Rajala R.V., Rajala A., Kooker C., Wang Y., Anderson R.E. The warburg effect mediator pyruvate kinase M2 expression and regulation in the retina. Sci. Rep. 2016;6:37727. doi: 10.1038/srep37727. [DOI] [PMC free article] [PubMed] [Google Scholar]
- Rando R.R. Membrane phospholipids as an energy-source in the operation of the visual cycle. Biochemistry. 1991;30:595–602. doi: 10.1021/bi00217a001. [DOI] [PubMed] [Google Scholar]
- Reyes-Reveles J., Dhingra A., Alexander D., Bragin A., Philp N.J., Boesze-Battaglia K. Phagocytosis-dependent ketogenesis in retinal pigment epithelium. J. Biol. Chem. 2017;292:8038–8047. doi: 10.1074/jbc.M116.770784. [DOI] [PMC free article] [PubMed] [Google Scholar]
- Rohrer B., Bandyopadhyay M., Beeson C. Reduced metabolic capacity in aged primary retinal pigment epithelium (RPE) is correlated with increased susceptibility to oxidative stress. Adv. Exp. Med. Biol. 2016;854:793–798. doi: 10.1007/978-3-319-17121-0_106. [DOI] [PubMed] [Google Scholar]
- Rueda E.M., Johnson J.E., Jr., Giddabasappa A., Swaroop A., Brooks M.J., Sigel I., Chaney S.Y., Fox D.A. The cellular and compartmental profile of mouse retinal glycolysis, tricarboxylic acid cycle, oxidative phosphorylation, and ~P transferring kinases. Mol. Vis. 2016;22:847–885. [PMC free article] [PubMed] [Google Scholar]
- Ruggiero L., Connor M.P., Chen J., Langen R., Finnemann S.C. Diurnal, localized exposure of phosphatidylserine by rod outer segment tips in wild-type but not Itgb5-/- or Mfge8-/- mouse retina. Proc. Natl. Acad. Sci. U S A. 2012;109:8145–8148. doi: 10.1073/pnas.1121101109. [DOI] [PMC free article] [PubMed] [Google Scholar]
- Samuel W., Jaworski C., Postnikova O.A., Kutty R.K., Duncan T., Tan L.X., Poliakov E., Lakkaraju A., Redmond T.M. Appropriately differentiated ARPE-19 cells regain phenotype and gene expression profiles similar to those of native RPE cells. Mol. Vis. 2017;23:60–89. [PMC free article] [PubMed] [Google Scholar]
- Scerri T.S., Quaglieri A., Cai C., Zernant J., Matsunami N., Baird L., Scheppke L., Bonelli R., Yannuzzi L.A., Friedlander M. Genome-wide analyses identify common variants associated with macular telangiectasia type 2. Nat. Genet. 2017;49:559–567. doi: 10.1038/ng.3799. [DOI] [PubMed] [Google Scholar]
- Serin Y., Acar Tek N. Effect of circadian rhythm on metabolic processes and the regulation of energy balance. Ann. Nutr. Metab. 2019;74:322–330. doi: 10.1159/000500071. [DOI] [PubMed] [Google Scholar]
- Simon M.V., Spalm F.H.P., Vera M.S., Rotstein N.P. Sphingolipids as emerging mediators in retina degeneration. Front. Cell Neurosci. 2019;13:246. doi: 10.3389/fncel.2019.00246. [DOI] [PMC free article] [PubMed] [Google Scholar]
- Sinha T., Makia M., Du J., Naash M.I., Al-Ubaidi M.R. Flavin homeostasis in the mouse retina during aging and degeneration. J. Nutr. Biochem. 2018;62:123–133. doi: 10.1016/j.jnutbio.2018.09.003. [DOI] [PMC free article] [PubMed] [Google Scholar]
- Smith C.M., Bryla J., Williamson J.R. Regulation of mitochondrial alpha-ketoglutarate metabolism by product inhibition at alpha-ketoglutarate dehydrogenase. J. Biol. Chem. 1974;249:1497–1505. [PubMed] [Google Scholar]
- Snodderly D.M., Sandstrom M.M., Leung I.Y., Zucker C.L., Neuringer M. Retinal pigment epithelial cell distribution in central retina of rhesus monkeys. Invest. Ophthalmol. Vis. Sci. 2002;43:2815–2818. [PubMed] [Google Scholar]
- Sparrow J.R., Wu Y., Kim C.Y., Zhou J. Phospholipid meets all-trans-retinal: the making of RPE bisretinoids. J. Lipid Res. 2010;51:247–261. doi: 10.1194/jlr.R000687. [DOI] [PMC free article] [PubMed] [Google Scholar]
- Stiles M., Qi H., Sun E., Tan J., Porter H., Allegood J., Chalfant C.E., Yasumura D., Matthes M.T., LaVail M.M. Sphingolipid profile alters in retinal dystrophic P23H-1 rats and systemic FTY720 can delay retinal degeneration. J. Lipid Res. 2016;57:818–831. doi: 10.1194/jlr.M063719. [DOI] [PMC free article] [PubMed] [Google Scholar]
- Stincone A., Prigione A., Cramer T., Wamelink M.M.C., Campbell K., Cheung E., Olin-Sandoval V., Gruning N.-M., Kruger A., Tauqeer Alam M. The return of metabolism: biochemistry and physiology of the pentose phosphate pathway. Biol. Rev. Camb Philos. Soc. 2015;90:927–963. doi: 10.1111/brv.12140. [DOI] [PMC free article] [PubMed] [Google Scholar]
- Strauss O. The retinal pigment epithelium in visual function. Physiol. Rev. 2005;85:845–881. doi: 10.1152/physrev.00021.2004. [DOI] [PubMed] [Google Scholar]
- Swarup A., Samuels I.S., Bell B.A., Han J.Y.S., Du J., Massenzio E., Abel E.D., Boesze-Battaglia K., Peachey N.S., Philp N.J. Modulating GLUT1 expression in retinal pigment epithelium decreases glucose levels in the retina: impact on photoreceptors and Muller glial cells. Am. J. Physiol. Cell Physiol. 2019;316:C121–C133. doi: 10.1152/ajpcell.00410.2018. [DOI] [PMC free article] [PubMed] [Google Scholar]
- Terluk M.R., Kapphahn R.J., Soukup L.M., Gong H., Gallardo C., Montezuma S.R., Ferrington D.A. Investigating mitochondria as a target for treating age-related macular degeneration. J. Neurosci. 2015;35:7304–7311. doi: 10.1523/JNEUROSCI.0190-15.2015. [DOI] [PMC free article] [PubMed] [Google Scholar]
- Volland S., Esteve-Rudd J., Hoo J., Yee C., Williams D.S. A comparison of some organizational characteristics of the mouse central retina and the human macula. PLoS One. 2015;10:e0125631. doi: 10.1371/journal.pone.0125631. [DOI] [PMC free article] [PubMed] [Google Scholar]
- Wan B., LaNoue K.F., Cheung J.Y., Scaduto R.C., Jr. Regulation of citric acid cycle by calcium. J. Biol. Chem. 1989;264:13430–13439. [PubMed] [Google Scholar]
- Wang W., Kini A., Wang Y., Liu T., Chen Y., Vukmanic E., Emery D., Liu Y., Lu X., Jin L. Metabolic deregulation of the blood-outer retinal barrier in retinitis pigmentosa. Cell Rep. 2019;28:1323–1334 e1324. doi: 10.1016/j.celrep.2019.06.093. [DOI] [PMC free article] [PubMed] [Google Scholar]
- Wang Y., Grenell A., Zhong F., Yam M., Hauer A., Gregor E., Zhu S., Lohner D., Zhu J., Du J. Metabolic signature of the aging eye in mice. Neurobiol. Aging. 2018;71:223–233. doi: 10.1016/j.neurobiolaging.2018.07.024. [DOI] [PMC free article] [PubMed] [Google Scholar]
- Winkler B.S. Glycolytic and oxidative metabolism in relation to retinal function. J. Gen. Physiol. 1981;77:667–692. doi: 10.1085/jgp.77.6.667. [DOI] [PMC free article] [PubMed] [Google Scholar]
- Winkler B.S., Starnes C.A., Twardy B.S., Brault D., Taylor R.C. Nuclear magnetic resonance and biochemical measurements of glucose utilization in the cone-dominant ground squirrel retina. Invest. Ophthalmol. Vis. Sci. 2008;49:4613–4619. doi: 10.1167/iovs.08-2004. [DOI] [PubMed] [Google Scholar]
- Wong-Riley M.T. Energy metabolism of the visual system. Eye Brain. 2010;2:99–116. doi: 10.2147/EB.S9078. [DOI] [PMC free article] [PubMed] [Google Scholar]
- Wubben T.J., Pawar M., Smith A., Toolan K., Hager H., Besirli C.G. Photoreceptor metabolic reprogramming provides survival advantage in acute stress while causing chronic degeneration. Sci. Rep. 2017;7:17863. doi: 10.1038/s41598-017-18098-z. [DOI] [PMC free article] [PubMed] [Google Scholar]
- Yam M., Engel A.L., Wang Y., Zhu S., Hauer A., Zhang R., Lohner D., Huang J., Dinterman M., Zhao C. Proline mediates metabolic communication between retinal pigment epithelial cells and the retina. J. Biol. Chem. 2019;294:10278–10289. doi: 10.1074/jbc.RA119.007983. [DOI] [PMC free article] [PubMed] [Google Scholar]
- Yu B., Egbejimi A., Dharmat R., Xu P., Zhao Z., Long B., Miao H., Chen R., Wensel T.G., Cai J. Phagocytosed photoreceptor outer segments activate mTORC1 in the retinal pigment epithelium. Sci. Signal. 2018;11:eaag3315. doi: 10.1126/scisignal.aag3315. [DOI] [PMC free article] [PubMed] [Google Scholar]
- Zhu S., Yam M., Wang Y., Linton J.D., Grenell A., Hurley J.B., Du J. Impact of euthanasia, dissection and postmortem delay on metabolic profile in mouse retina and RPE/choroid. Exp. Eye Res. 2018;174:113–120. doi: 10.1016/j.exer.2018.05.032. [DOI] [PMC free article] [PubMed] [Google Scholar]
Associated Data
This section collects any data citations, data availability statements, or supplementary materials included in this article.