

Abstract
RNA polymerase II (RNAPII) transcription is crucial for gene expression. RNAPII density peaks at gene boundaries, associating these key regions for gene expression control with limited RNAPII movement. The connections between RNAPII transcription speed and gene regulation in multicellular organisms are poorly understood. Here, we directly modulate RNAPII transcription speed by point mutations in the second largest subunit of RNAPII in Arabidopsis thaliana. A RNAPII mutation predicted to decelerate transcription is inviable, while accelerating RNAPII transcription confers phenotypes resembling auto‐immunity. Nascent transcription profiling revealed that RNAPII complexes with accelerated transcription clear stalling sites at both gene ends, resulting in read‐through transcription. The accelerated transcription mutant NRPB2‐Y732F exhibits increased association with 5′ splice site (5′SS) intermediates and enhanced splicing efficiency. Our findings highlight potential advantages of RNAPII stalling through local reduction in transcription speed to optimize gene expression for the development of multicellular organisms.
Keywords: NET‐seq, speed, splicing, stalling, transcription
Subject Categories: Chromatin, Epigenetics, Genomics & Functional Genomics; Plant Biology
RNAPII mutations that accelerate transcription cause auto‐immunity‐like phenotypes, read‐through transcription at RNAPII stalling sites and enhanced splicing in Arabidopsis, indicating that controlled transcription speed is required for optimal gene expression and plant development.
Introduction
A decisive step during gene expression is the conversion of the DNA sequences of a gene into pre‐mRNA by RNA polymerase II (RNAPII) transcription. Profiles of RNAPII transcription across genes in eukaryotes revealed two main RNAPII localization peaks at gene boundaries, near gene transcription start sites (TSSs) and poly‐adenylation sites (PASs) 1. At the 3′ end of genes, RNAPII peaks promote nascent RNA 3′ end processing and transcriptional termination in mammals 2, 3. The function of RNAPII peaks at promoter‐proximal regions near TSSs is actively debated. On the one hand, “pause‐release” of RNAPII can facilitate rapid induction of gene expression 4; on the other hand, imaging of Drosophila and human RNAPII at promoter‐proximal positions revealed rapid turnover, arguing against stable “pausing” of the same population of RNAPII complexes over time 5, 6. In metazoans, the negative elongation factor (NELF) complex promotes promoter‐proximal pausing of RNAPII by limiting RNAPII mobility 7. However, NELF is conspicuously absent in yeast and plants, which implies that many organisms use alternative mechanisms to stall RNAPII at promoter‐proximal region (i.e., RNAPII stalling) 8. In gene bodies, RNAPII accumulates at exon–intron boundaries and exhibits distinct accumulation profiles for exons with alternative splicing (AS) outcomes 9, 10. The efficiency of splicing may hence be coupled to the local speed of RNAPII elongation at exon–intron boundaries 11. In summary, peaks of accumulated RNAPII represent sites with reduced RNAPII forward movement, which may facilitate the integration of cellular signals to control gene expression post‐initiation by co‐transcriptional RNA processing 12.
RNAPII forward movement depends on the dynamics of the trigger loop (TL), a central structure in the RNAPII active center 13, 14, 15. In addition, RNAPII backtracking induced by weak RNA–DNA hybrids (i.e., nucleotide misincorporation) limits RNAPII forward movement 16, 17, 18. A “gating tyrosine” in the RNAPII second largest subunit RPB2 (i.e., Y769 in budding yeast Rpb2) stacks with the first backtracked nucleotide and is proposed to prevent further backtracking 19 and is also positioned to interact with the TL when in its closed, catalysis‐promoting state. Point mutations in budding yeast Rpb1 TL residues and Rpb2 TL‐interacting residues alter the RNAPII elongation speed in vivo 20, 21, 22, 23, 24. Such “kinetic RNAPII mutants” have informed greatly on the effects of altered transcription speed on gene expression and transcription‐related phenotypes. For example, the budding yeast rpb2‐P1018S slow transcription mutant (i.e., rpb2‐10) promotes RNAPII arrest and reduces transcription processivity 25, 26. Moreover, kinetic RNAPII mutants displaying accelerated transcription favor the use of upstream TSSs, while mutants displaying slow transcription tend to use downstream TSSs 27. Variations of transcription speed alter profiles of co‐transcriptional chromatin signatures and of RNAPII C‐terminal domain (CTD) phosphorylation that impact pre‐mRNA processing 28, 29, 30. These observations indicate a profound effect of RNAPII transcription elongation speed on gene expression. The important question of whether growth and differentiation programs in a multicellular organism can be executed when RNAPII carries kinetic point mutations remains largely unclear.
Here, we altered RNAPII transcription activity in Arabidopsis through point mutations in NRPB2, the second largest subunit of Arabidopsis RNAPII. A mutant accelerating RNAPII transcription triggered phenotypes consistent with auto‐immunity, but was able to execute key steps of pattern formation and organogenesis. A mutation predicted to decrease RNAPII transcription speed was inviable. Nascent RNAPII transcription profiling revealed that the mutant accelerating transcription resulted in reduced RNAPII stalling at both gene boundaries. Our findings highlight mechanistic connections between the intrinsic speed of RNAPII and RNAPII stalling at both gene boundaries that coordinate gene expression in the context of a multicellular organism.
Results
Altering transcription activity of RNAPII by targeted mutagenesis of NRPB2
To alter the in vivo RNAPII transcription activity in whole plants, we generated point mutations in Arabidopsis RNAPII. The target residues were identified in Rpb2, the second largest budding yeast RNAPII subunit. The Rpb2 proline 1018 to serine substitution (rpb2‐P1018S) represents the classic slow transcription mutant rpb2‐10, and the tyrosine 769 to phenylalanine substitution (rpb2‐Y769F) represents a mutation which might influence backtracking and TL function (Fig 1A) 19, 31, 32. Sequence alignments identified P979S and Y732F in the highly conserved regions of NRPB2, the second largest subunit of Arabidopsis RNAPII as the equivalent positions to budding yeast P1018S (rpb2‐10) and Y769F, respectively (Fig 1B). We generated these point mutations in constructs carrying the genomic NRPB2 sequence fused to a C‐terminal FLAG‐tag driven by the endogenous NRPB2 promoter and integrated them into the nrpb2‐2 null mutant background 33 (Fig EV1A). To investigate whether these point mutations affected NRPB2 protein accumulation, we performed Western blotting on FLAG‐tagged NRPB2P979S‐FLAG, NRPB2Y732F‐FLAG, and wild‐type NRPB2‐FLAG (NRPB2WT‐FLAG; Fig 1C). We identified several individual transformant lines with comparable steady‐state protein levels; thus, any differences we detected in the characterization of these lines would have to be attributed to the effects of the point mutations on RNAPII activity.
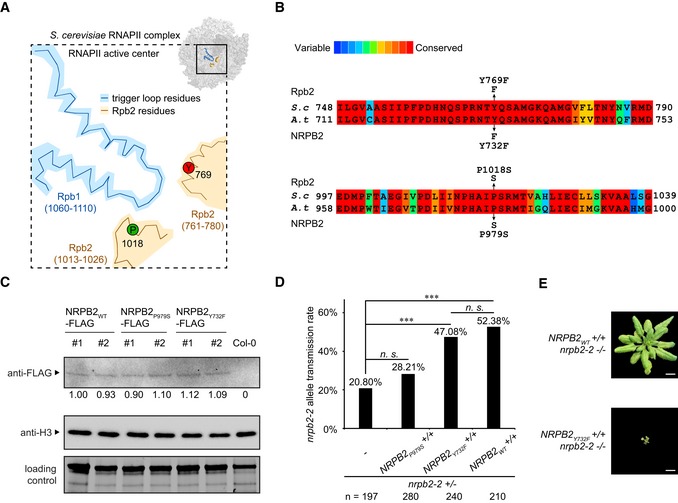
Figure 1. Altering transcription activity of RNAPII by targeted mutagenesis in NRPB2.
-
ASchematic drawing of Saccharomyces cerevisiae RNAPII transcription active center. Trigger loop is shown in blue. TL‐interacting Rpb2 domain is shown in beige. Proline 1018 (P1018, green) and gating tyrosine 769 (Y769, red) are highlighted. The schematic drawing is based on PDB: 2e2h 15.
-
BProtein sequence alignment of RNAPII Rpb2 Y769 and P1018 regions in S. cerevisiae and Arabidopsis thaliana. P979S and Y732F are the yeast equivalent point mutations in Arabidopsis. The color scheme indicates conservation from variable (blue) to conserved (red).
-
CDetection of NRPB2WT‐FLAG, NRPB2P979S‐FLAG, and NRPB2Y732F‐FLAG protein by Western blotting in NRPB2 WT ‐FLAG Col‐0, NRPB2 P979S ‐FLAG Col‐0, and NRPB2Y 732F ‐FLAG Col‐0 plants. Untagged NRPB2 (Col‐0) was used as a negative control. Histone H3 was used as an internal control, and total protein level detected by stain‐free blot was used as a loading control. Quantification was done by normalizing to the loading control and anti‐H3 blot based on three independent replicates.
-
DTransmission rate of nrpb2‐2 allele in nrpb2‐2 +/− line (n = 197) and nrpb2‐ +/− lines combined with homozygous NRPB2 P979S ‐FLAG +/+ (n = 280), NRPB2 Y732F ‐FLAG +/+ (n = 240), and NRPB2 WT ‐FLAG +/+ (n = 210), respectively. Fisher's exact test was used as a statistical test, three asterisks denote P < 0.001 between samples, and n.s. stands for not significant.
-
EImage of homozygous mutant nrpb2‐2 fully complemented by NRPB2 WT ‐FLAG (top, NRPB2 WT +/+ nrpb2‐2 −/−) and partially complemented by NRPB2 Y732F ‐FLAG (bottom, NRPB2 Y732F +/+ nrpb2‐2 −/−). Plants were grown for 4 weeks in soil. Scale bars represent 1 cm.
Source data are available online for this figure.
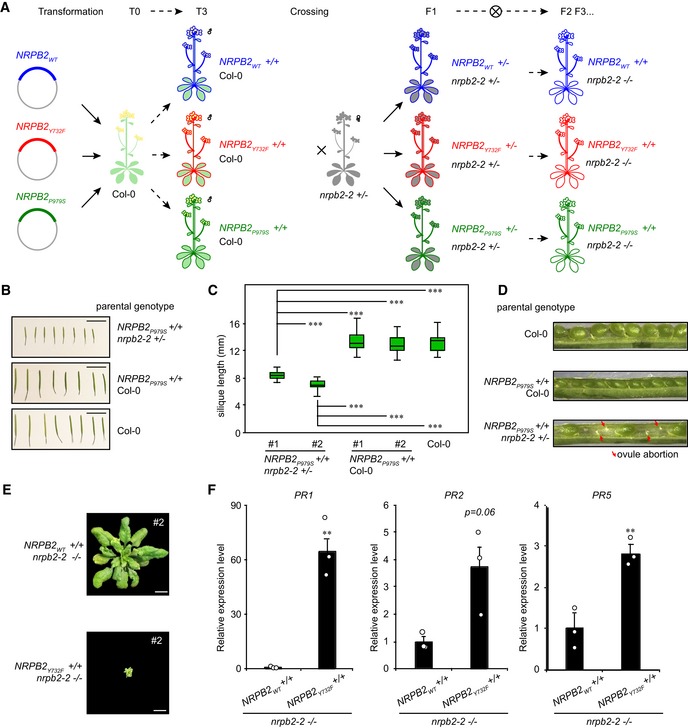
Figure EV1. Generation and characterization of Arabidopsis NRPB2 point mutations (related to Fig 1).
-
ASchematic overview of a work flow to generate NRPB2 WT +/+ nrpb2‐2 −/−, NRPB2 Y732F +/+ nrpb2‐2 −/− , and NRPB2 P979S +/+ nrpb2‐2 +/− Arabidopsis. First, constructs harboring NRPB2 WT (blue), NRPB2 Y732F (red), and NRPB2 P979S (green) transgene expression cassette were transformed into wild‐type (Col‐0) Arabidopsis via Agrobacterium‐mediated transformation; T3 transformant plants with homozygous transgenes are crossed with nrpb2‐2 +/− (gray) heterozygous Arabidopsis; then, plants positive for both transgenes and nrpb2‐2 allele were selected for propagation into F3 generation to screen for homozygous double mutants of transgene and nrpb2‐2.
-
BPhenotype of Arabidopsis siliques of wild‐type (Col‐0), NRPB2 P979S +/+ Col‐0, and NRPB2 P979S nrpb2‐2 +/− plants. Scale bars represent 10 mm.
-
CSilique length of wild‐type (Col‐0), NRPB2 P979S Col‐0, and NRPB2 P979S +/+ nrpb2‐2 +/− plants (n > 20 for each genotype). Two‐sided Student's t‐test was used for statistical test, *** denotes P < 0.001. The solid horizontal lines and box limits represent median, lower and upper quartiles of data values in each group. The upper and lower whiskers extend to the largest or smallest value, respectively, no further than 1.5*IQR from the relevant quartile.
-
DOpened siliques from wild‐type (Col‐0), NRPB2 P979S +/+ Col‐0, and NRPB2 P979S +/+ nrpb2‐2 +/− plants. Red arrows indicate aborted ovules.
-
EPhenotype of alternative transformation events to lines presented in Fig 1E. Homozygous mutant nrpb2‐2 was fully complemented by NRPB2‐FLAG (top) and partially complemented by NRPB2 Y732F ‐FLAG (bottom). Plants were grown for 4 weeks in soil. Scale bars represent 1 cm.
-
FRelative expression level of PR1, PR2, and PR5 in NRPB2 WT +/+ nrpb2‐2 −/− and NRPB2 Y732F +/+ nrpb2‐2 −/− by RT–qPCR. Error bars represent SEM from three independent replicates. **denotes P < 0.01 by two‐sided Student's t‐test.
Source data are available online for this figure.
The Arabidopsis nrpb2‐2 null allele is female gametophytic lethal, but can be transmitted through the male germline with reduced transmission rate 33. We could hence assay complementation of the gametophytic phenotypes to gain insights into the effects of RNAPII mutants. We assayed the transmission rate of the nrpb2‐2 null allele in the plants carrying homozygous NRPB2 WT, NRPB2 P979S , or NRPB2 Y732F transgenes in nrpb2‐2 +/− background (Fig EV1A). We would predict increased transmission rate of the nrpb2‐2 allele if the gametophytic defects could be complemented. As predicted, NRPB2 WT can fully (i.e., to the expected level of 50%) complement the transmission of nrpb2‐2 compared to non‐transformed controls (Fig 1D). Interestingly, NRPB2 Y732F could almost fully complement nrpb2‐2 transmission, while NRPB2 P979S did not significantly increase transmission rate compared to non‐transformed controls (Fig 1D). These data suggest that NRPB2 P979S fails to provide the RNAPII activity necessary for germline development. Indeed, silique dissection revealed that the germline defects in NRPB2 P979S nrpb2‐2 +/− were associated with reduced fertility and ovule abortion (Fig EV1B–D). Consistently, we identified plants homozygous for both NRPB2 Y732F transgene and nrpb2‐2 mutant (NRPB2 Y732F +/+ nrpb2‐2 −/−) while NRPB2 P979S +/+ nrpb2‐2 −/− genotype could not be recovered. Remarkably, when all RNAPII complexes carried the NRPB2 Y732F mutation (i.e., NRPB2 Y732F +/+ nrpb2‐2 −/−) we observed viable plant growth and development. These plants exhibited a dwarfed stature (Figs 1E and EV1E), but resembled Arabidopsis seedlings concerning basic patterning and organ formation. The dwarfed stature was reminiscent of mutants displaying auto‐immunity, which is often associated with increased expression of pathogen‐related (PR) genes 34. Indeed, we detected elevated expression of PR1, PR2, and PR5 in NRPB2 Y732F +/+ nrpb2‐2−/− compared to NRPB2 WT +/+ nrpb2‐2−/− (Fig EV1F). These data highlight important roles of the ability to control the speed of RNAPII transcription during plant growth and development. In summary, Arabidopsis RNAPII harboring the NRPB2 P979S point mutation failed to provide viable RNAPII activity during gametogenesis. However, the NRPB2 Y732F mutation can partly rescue the germline defects in nrpb2‐2 null mutants and allow plant growth and basic aspects of development.
NRPB2 Y732F accelerates RNAPII transcription in vivo
To investigate the effect of NRPB2 Y732F on RNAPII transcription speed, we first tested whether the equivalent rpb2‐Y769F mutant in budding yeast classifies as a fast or slow RNAPII transcription mutant by assaying its sensitivity towards mycophenolic acid (MPA) and Mn2+ 35, 36. Budding yeast RNAPII mutants conferring enhanced catalytic activity (RNAPII fast mutants) are more sensitive towards Mn2+ than the RNAPII slow mutants 20. In budding yeast, RNAPII fast mutants are sensitive to MPA due to deficient expression of IMD2 gene, which counteracts the inhibition of GTP synthesis by MPA. RNAPII slow mutants tend to be resistant to MPA due to the constitutive IMD2 expression 21. rpb2‐Y769F exhibited strong growth defects towards MPA and Mn2+ while we observed no effect for rpb2‐P1018S (Fig EV2A). rpb2‐Y769F thus shows a growth phenotype consistent with fast RNAPII transcription mutants 20. Interestingly, the rpb2‐Y769F/P1018S double mutant exhibited mild sensitivity towards MPA compared to either single mutant (Fig EV2A), consistent with a complementary effect on transcription speed as seen across many RNAPII active site mutations in budding yeast 27. Primer extension analyses of alternative TSSs usage of the ADH1 gene represent an additional assay for RNAPII catalytic rate and therefore putative elongation speed 27, where catalytically hyperactive RNAPII mutants exhibit an upstream shift of TSS. In agreement with previously characterized fast RNAPII transcription mutants, rpb2‐Y769F shifts the ADH1 TSS upstream compared to wild type or other Y769 substitutions (Fig EV2B). We next tested the combinations of rpb2‐Y769F with TL residue mutants previously demonstrated to alter RNAPII transcription speed. rpb2‐Y769F was synthetically lethal with previously characterized fast RNAPII transcription mutants such as rpb1‐L1101S, rpb1‐E1103G, and rpb1‐G1097D (Fig EV2C), suggesting that these combinations synergistically accelerated RNAPII transcription and supporting the interaction between Y769 and TL residues. Conversely, rpb2‐Y769F suppressed the growth defect of previously characterized slow RNAPII transcription mutants such as rpb1‐F1086S, rpb1‐H1085Q, and rpb1‐H1085Y 27, 35 (Fig EV2C), suggesting compensatory effects on transcription speed when combining these “slow” mutations with rpb2‐Y769F. In conclusion, our results characterized budding yeast rpb2‐Y769F as a mutation conferring phenotypes consistent with hyperactive RNAPII mutants which increase RNAPII transcription speed.
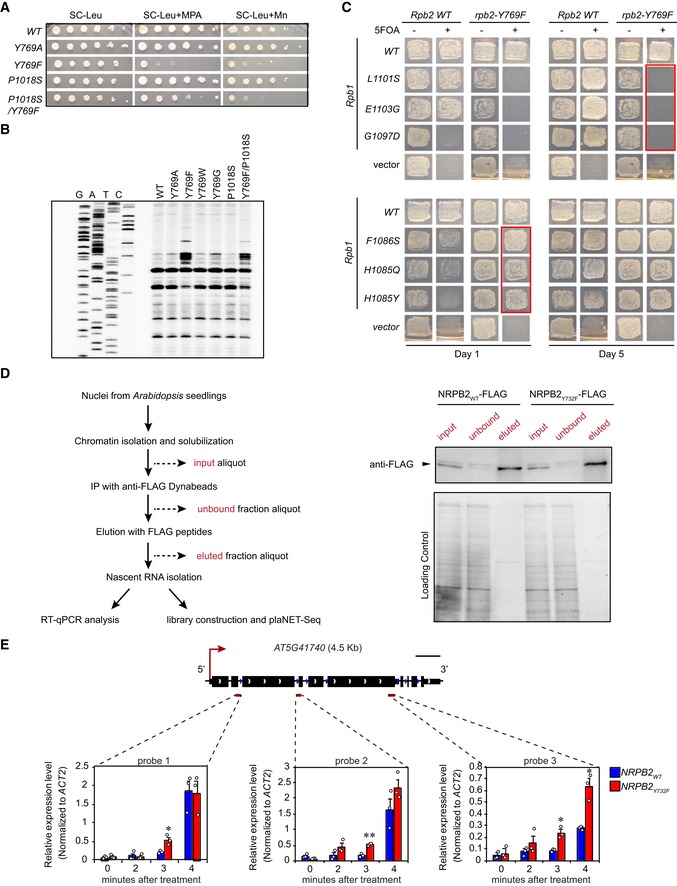
Figure EV2. Molecular and phenotypic characterization of the rpb2‐Y769F mutation in budding yeast and Arabidopsis equivalent NRPB2Y732F (related to Fig 2).
-
ADifferential sensitivity of various budding yeast rpb2 mutants towards Mn2+ and MPA in SC‐Leu media.
-
BPrimer extension analyses for ADH1 transcription start site usage in rpb2 mutants in budding yeast.
-
CGenetic interaction between rpb2‐Y769F and Rpb1 TL mutations. Growth was assayed at day 1 and day 5. Ability to grow on SC‐Leu + 5FOA indicates that rpb2‐Y769F counteracts Rpb1 TL mutations. Red box indicates the phenotype of rpb2‐Y769F crossed with Rpb1 TL mutations.
-
DA work flow of immunoprecipitation (IP) of FLAG‐tagged NRPB2 protein by anti‐FLAG followed by nascent RNA isolation, RT–qPCR analyses, and plaNET‐seq (left). Western blotting (right) of NRPB2WT‐FLAG and NRPB2Y732F‐FLAG as IP input (input), after IP (unbound), and after elution by FLAG peptides (eluted). Upper panel shows representative anti‐FLAG blots. Lower panel shows total proteins as loading control for indicated fractions.
-
ENascent RNA profile of AT5G41740. Nascent RNA RT–qPCR assay measuring RNAPII signal at three positions (dark red bars: probes 1, 2, and 3) on gene upon flagellin 22 treatment in a 0‐, 2‐, 3‐, and 4‐min time course. Nascent RNA signal values were normalized to reference gene ACT2. Error bars represent SEM from 3 independent replicates. The statistical significance of differences between NRPB2 Y732F and NRPB2 WT at the same time point was assessed by two‐sided Student's t‐test. n.s. denotes not significant; * denotes P < 0.05; and ** denotes P < 0.01. Scale bar (black) represent 0.5 kb.
Source data are available online for this figure.
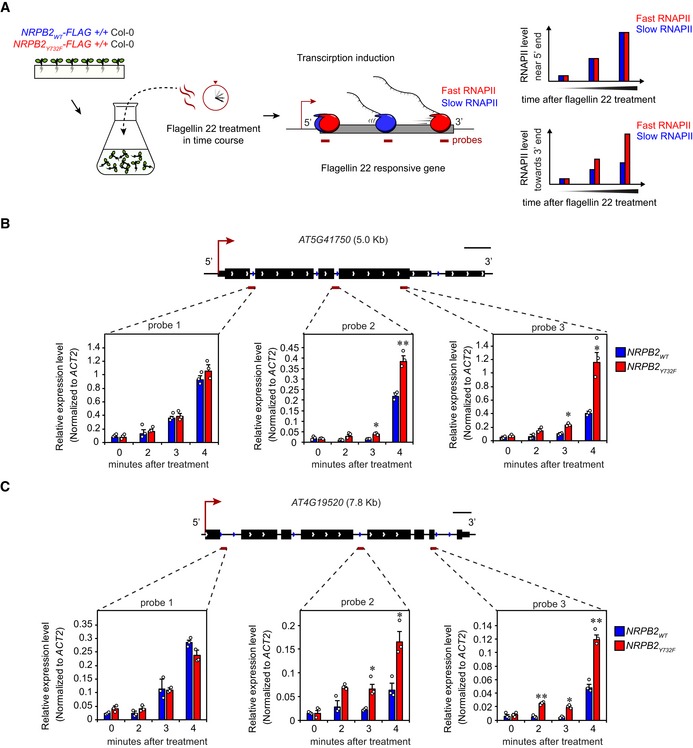
To investigate the in vivo RNAPII transcription speed of Arabidopsis RNAPII carrying the NRPB2 Y732F mutation, we developed an assay to monitor nascent RNAPII elongation after rapid transcription induction. To avoid time‐consuming sample handling and processing issues associated with RNAPII chromatin immunoprecipitation from plants (RNAPII‐ChIP) 25, 37, we analyzed nascent RNA attached to RNAPII to monitor RNAPII elongation 38. We identified three pathogen resistance‐related Toll/interleukin receptor (TIR)‐type NB‐LRR genes AT4G19520, AT5G41740, and AT5G41750 39, 40 that are rapidly induced by flagellin 22 treatment. To monitor the “waves” of RNAPII elongation on these three genes after transcriptional induction, we performed a time course experiment during flagellin 22 treatment and determined the RNAPII signal by analyzing nascent RNA attached to RNAPII 38. We chose NRPB2 WT ‐FLAG +/+ Col‐0 and NRPB2 Y732F ‐FLAG +/+ Col‐0 as material for this assay since we detected no differences in growth and immune response in this background. In brief, FLAG‐tagged NRPB2WT and NRPB2Y732F proteins were immunoprecipitated by anti‐FLAG antibody; RNAPII‐associated RNA was purified and used in RT–qPCR analyses of three locations spanning these genes (Fig 2A). When gene induction is well synchronized, fast transcription is expected to show higher nascent RNA level in the gene body and towards the 3′ end of candidate genes during flagellin 22 treatment. We found that the candidate genes were rapidly induced by flagellin 22 treatment, as we detected an increase in nascent RNA level at probe 1 of these genes from 0 to 4 min after treatment (Figs 2B and C, and EV2E). Furthermore, data for the probe capturing RNAPII transcription shortly after induction (i.e., probe 1) suggest that these genes were induced with similar kinetics and to similar levels in NRPB2 WT and NRPB2 Y732F. Interestingly, we found that NRPB2 Y732F showed higher nascent RNA level than NRPB2 WT at probe 2 and probe 3 located further into the gene, from 3 min of flagellin 22 treatment onwards (Figs 2B and C, and EV2E). These data suggest that although wild‐type RNAPII and mutant RNAPII were equally induced near the 5′ ends of genes, the NRPB2 Y732F RNAPII reaches the 3′ ends of genes earlier than NRPB2 WT , supporting faster RNAPII transcription in the NRPB2 Y732F mutants. In summary, we detect evidence that the Arabidopsis NRPB2 Y732F mutant exhibits accelerated RNAPII transcription in vivo.
Figure 2. NRPB2 Y732F accelerates RNAPII transcription in vivo .
-
ASchematic drawing of the experimental design to investigate RNAPII transcription speed in vivo. In brief, Arabidopsis seedlings of NRPB2 WT ‐FLAG Col‐0 and NRPB2 Y732F ‐FLAG Col‐0 were grown on MS media for 12 days and then were transferred to MS liquid media for 2 days. Flagellin peptides (flagellin 22) were added into media, and treated samples were collected in a 0‐min (no treatment), 2‐, 3‐ and 4‐min time course. The nascent RNA was isolated and used for reverse transcription and qPCR analyses to reveal RNAPII accumulation at different region in genes. See Materials and Methods for technical details.
-
BNascent RNA profile of AT5G41750. Nascent RNA RT–qPCR assay measuring RNAPII signal at three positions (dark red bars: probes 1, 2, and 3) on the gene upon flagellin 22 treatment in a 0‐, 2‐, 3‐, and 4‐min time course. Nascent RNA signal values were normalized to reference gene ACT2. Error bars represent SEM from three independent replicates. The statistical significance of differences between NRPB2 Y732F and NRPB2 WT at the same time point was assessed by a two‐sided Student's t‐test. n.s. denotes not significant; * denotes P < 0.05; and ** denotes P < 0.01. Scale bar (black) represent 0.5 kb.
-
CNascent RNA profile of AT4G19520. Nascent RNA RT–qPCR assay measuring RNAPII signal at three positions (dark red bars: probes 1, 2, and 3) on the gene upon flagellin 22 treatment in a 0‐, 2‐, 3‐, and 4‐min time course. Nascent RNA signal values were normalized to reference gene ACT2. Error bars represent SEM from three independent replicates. The statistical significance of differences between NRPB2 Y732F and NRPB2 WT at the same time point was assessed by a two‐sided Student's t‐test. n.s. denotes not significant; * denotes P < 0.05; and ** denotes P < 0.01. Scale bar (black) represents 0.5 kb.
Source data are available online for this figure.
Accelerated RNAPII transcription reduces promoter‐proximal RNAPII stalling
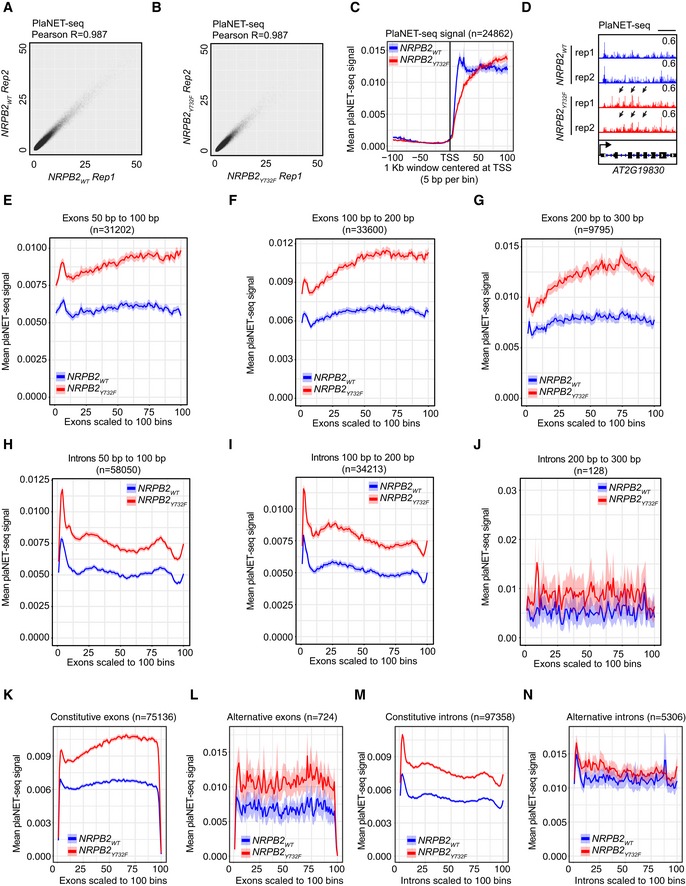
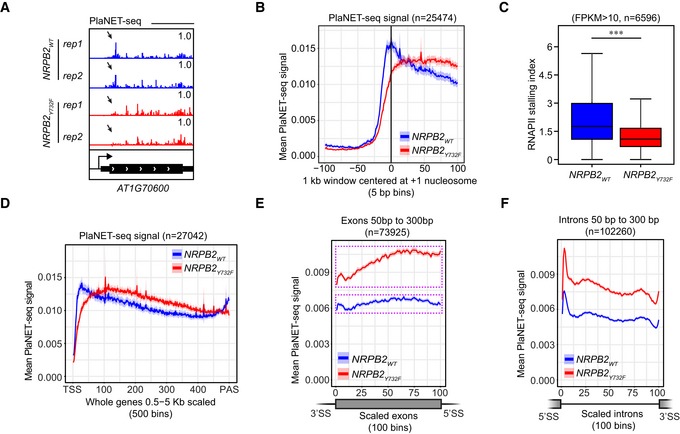
To study the genome‐wide effects of accelerated RNAPII transcription speed in NRPB2 Y732F, we performed plant Native Elongating Transcript sequencing (plaNET‐seq) to monitor nascent RNAPII transcription 8. Two independent replicates of plaNET‐seq were performed for NRPB2 Y732F +/+ nrpb2‐2 −/− mutant and NRPB2 WT +/+ nrpb2‐2 −/− control (Fig EV3A and B). Nascent RNA profiling in Arabidopsis revealed RNAPII stalling peaks near the beginning of transcription units in promoter‐proximal regions. The positioning of the first nucleosome correlates well with the position of promoter‐proximal RNAPII stalling in Arabidopsis 8. To address the role of transcription speed in regulating promoter‐proximal stalling, we investigated the RNAPII signal in promoter‐proximal regions from plaNET‐seq in NRPB2 Y732F +/+ nrpb2‐2 −/− and NRPB2 WT +/+ nrpb2‐2 −/−. Visual inspection suggested that NRPB2 Y732F reduced peaks of RNAPII near the 5′ ends of genes when compared to NRPB2 WT (Fig 3A). A metagene plot showing plaNET‐seq RNAPII signal in a 1 kb region centered at the +1 nucleosomes 41 revealed that NRPB2 Y732F reduced promoter‐proximal RNAPII stalling centered at the +1 nucleosome position genome‐wide compared to NRPB2 WT (Fig 3B). The metagene‐level reduction in RNAPII stalling in NRPB2 Y732F was confirmed when the plaNET‐seq signal was anchored at TSSs (Fig EV3C). To further quantify this effect, we calculated the RNAPII stalling index for well‐expressed genes (plaNET‐seq signal FPKM > 10, n = 6,596), which represents relative enrichment of RNAPII signal at promoter‐proximal regions compared to the whole gene body. This analysis quantified a 35% reduction in the median value of RNAPII promoter‐proximal stalling index in NRPB2 Y732F compared to NRPB2 WT (Fig 3C). These data illustrate that a restriction of RNAPII transcription speed contributes strongly to the formation of characteristic promoter‐proximal RNAPII peaks.
Figure EV3. Genome‐wide effects of NRPB2 Y732F on nascent RNAPII transcription by plaNET‐seq compared to NRPB2 WT (related to Fig 3).
-
AScatterplot showing the biological reproducibility of plaNET‐seq experiment in NRPB2 WT +/+ nrpb2‐2 −/−. TPM‐normalized plaNET‐seq signal was summarized within 10‐bp bins genome‐wide. Pearson R = 0.987.
-
BScatterplot showing the biological reproducibility of plaNET‐seq experiment in NRPB2 Y732F +/+ nrpb2‐2 −/−. TPM‐normalized plaNET‐seq signal was summarized within 10‐bp bins genome‐wide. Pearson R = 0.987.
-
CMetagene profile of plaNET‐seq mean signal of RNAPII in a 1 kb window centered at the TSS of Arabidopsis genes (n = 24,862) in NRPB2 WT (blue) and NRPB2 Y732F (red).
-
DplaNET‐seq signal of RNAPII across the whole AT2G19830 gene in NRPB2 WT (blue) and NRPB2 Y732F (red). Arrows indicate the elevated nascent RNAPII signal in the gene body.
-
EMetagene profile of plaNET‐seq mean signal of RNAPII in exons (50–100 bp, scaled to 100 bins, n = 31,202) in NRPB2 WT +/+ nrpb2‐2 −/− (NRPB2 WT, blue) and NRPB2 Y732F +/+ nrpb2‐2 −/− (NRPB2 Y732F , red).
-
FMetagene profile of plaNET‐seq mean signal of RNAPII in exons (100–200 bp, scaled to 100 bins, n = 33,600) in NRPB2 WT +/+ nrpb2‐2 −/− (NRPB2 WT, blue) and NRPB2 Y732F +/+ nrpb2‐2 −/− (NRPB2 Y732F , red).
-
GMetagene profile of plaNET‐seq mean signal of RNAPII in exons (200–300 bp, scaled to 100 bins, n = 9,795) in NRPB2 WT +/+ nrpb2‐2 −/− (NRPB2 WT, blue) and NRPB2 Y732F +/+ nrpb2‐2 −/− (NRPB2 Y732F , red).
-
HMetagene profile of plaNET‐seq mean signal of RNAPII in introns (50–100 bp, scaled to 100 bins, n = 58,050) in NRPB2 WT +/+ nrpb2‐2 −/− (NRPB2 WT, blue) and NRPB2 Y732F +/+ nrpb2‐2 −/− (NRPB2 Y732F , red).
-
IMetagene profile of plaNET‐seq mean signal of RNAPII in introns (100–200 bp, scaled to 100 bins, n = 34,213) in NRPB2 WT +/+ nrpb2‐2 −/− (NRPB2 WT, blue) and NRPB2 Y732F +/+ nrpb2‐2 −/− (NRPB2 Y732F , red).
-
JMetagene profile of plaNET‐seq mean signal of RNAPII in introns (200–300 bp, scaled to 100 bins, n = 128) in NRPB2 WT +/+ nrpb2‐2 −/− (NRPB2 WT, blue) and NRPB2 Y732F +/+ nrpb2‐2 −/− (NRPB2 Y732F , red).
-
KMetagene profile of plaNET‐seq mean signal of RNAPII in constitutive exons (n = 75,136) in NRPB2 WT +/+ nrpb2‐2 −/− (NRPB2 WT, blue) and NRPB2 Y732F +/+ nrpb2‐2 −/− (NRPB2 Y732F , red).
-
LMetagene profile of plaNET‐seq mean signal of RNAPII in alternative exons (n = 724) in NRPB2 WT +/+ nrpb2‐2 −/− (NRPB2 WT, blue) and NRPB2 Y732F +/+ nrpb2‐2 −/− (NRPB2 Y732F , red).
-
MMetagene profile of plaNET‐seq mean signal of RNAPII in constitutive exons (n = 97,358) in NRPB2 WT +/+ nrpb2‐2 −/− (NRPB2 WT, blue) and NRPB2 Y732F +/+ nrpb2‐2 −/− (NRPB2 Y732F , red).
-
NMetagene profile of plaNET‐seq mean signal of RNAPII in alternative exons (n = 5,306) in NRPB2 WT +/+ nrpb2‐2 −/− (NRPB2 WT, blue) and NRPB2 Y732F +/+ nrpb2‐2 −/− (NRPB2 Y732F , red).
Figure 3. Accelerated RNAPII transcription reduces promoter‐proximal RNAPII stalling and enhances RNAPII activity in gene body.
-
AplaNET‐seq signal of RNAPII in the promoter‐proximal region of AT1G70600 in NRPB2 WT +/+ nrpb2‐2 −/− (NRPB2 WT, blue) and NRPB2 Y732F +/+ nrpb2‐2 −/− (NRPB2 Y732F , red). Arrows indicate the RNAPII signal at the region of promoter‐proximal stalling.
-
BMetagene profile of plaNET‐seq mean signal of RNAPII in a 1 kb window centered at the +1 nucleosome in Arabidopsis genes (n = 25,474) in NRPB2 WT +/+ nrpb2‐2 −/− (NRPB2 WT, blue) and NRPB2 Y732F +/+ nrpb2‐2 −/− (NRPB2 Y732F, red). The significance of differences of plaNET‐seq signal in the region from −25 bins to +25 bins around +1 nucleosome between NRPB2 WT and NRPB2 Y732F was assessed by a two‐sided Mann–Whitney U‐test, P = 5.20e‐10.
-
CRNAPII stalling index calculated for all the genes with plaNET‐seq FPKM ≥ 10 in NRPB2 WT +/+ nrpb2‐2 −/− (NRPB2 WT, blue) and NRPB2 Y732F +/+ nrpb2‐2 −/− (NRPB2 Y732F , red; n = 6,596). Medians of the stalling index are 1.891 and 1.222 for NRPB2 WT and NRPB2 Y732F, respectively. *** denotes P‐value < 0.001 by Wilcoxon signed‐rank test. The solid horizontal lines and box limits represent median, lower and upper quartiles of data values in each group. The upper and lower whiskers extend to the largest or smallest value, respectively, no further than 1.5*IQR from the relevant quartile.
-
DMetagene profile of plaNET‐seq mean signal over whole genes (length from 0.5 kb to 5 kb, scaled to 500 bins, n = 27,042) in NRPB2 WT +/+ nrpb2‐2 −/− (NRPB2 WT, blue) and NRPB2 Y732F +/+ nrpb2‐2 −/− (NRPB2 Y732F , red).
-
EMetagene profile of plaNET‐seq mean signal of RNAPII in exons (length from 50 to 300 bp, scaled to 100 bins, n = 73,925) in NRPB2 WT +/+ nrpb2‐2 −/− (NRPB2 WT, blue) and NRPB2 Y732F +/+ nrpb2‐2 −/− (NRPB2 Y732F , red). Pink dashed line rectangle illustrates the amplitude of differences between the minimum and the maximum of RNAPII signal across the exons. A two‐sided Mann–Whitney U‐test was used to assess the plaNET‐seq signal of NRPB2 WT (blue) and NRPB2 Y732F (red) in exons, P < 1e‐16.
-
FMetagene profile of plaNET‐seq mean signal of RNAPII in introns (length from 50–300 bp, scaled to 100 bins, n = 102,260) in NRPB2 WT +/+ nrpb2‐2 −/− (NRPB2 WT, blue) and NRPB2 Y732F +/+ nrpb2‐2 −/− (NRPB2 Y732F , red). A two‐sided Mann–Whitney U‐test was used to assess the plaNET‐seq signal of NRPB2 WT (blue) and NRPB2 Y732F (red) in introns, P < 1e‐16.
Accelerated transcription increases nascent RNAPII signal in gene bodies
We observed increased RNAPII signals in NRPB2 Y732F compared to NRPB2 WT at intragenic positions downstream of promoter‐proximal stalling sites (Fig EV3D). A metagene analysis of RNAPII activity across gene bodies confirmed this observation on a genome‐wide scale (Fig 3D). Increased RNAPII signal in gene bodies could be reconciled by less RNAPII at promoter‐proximal stalling regions in NRPB2 Y732F compared to NRPB2 WT. Consistently, increased nascent transcription in gene bodies in NRPB2 Y732F correlated with increased plaNET‐seq metagene profiles of exons and introns (Fig 3E and F). Interestingly, we detected an accumulation of exonic plaNET‐seq signal towards the 3′ end of exons in NRPB2 Y732F (Fig 3E). This effect was insensitive to the exon length (Fig EV3E–G). Exon–intron boundaries may thus trigger a pile‐up of nascent RNAPII transcription when transcription is accelerated. In introns, accelerated RNAPII transcription amplifies nascent RNAPII signal compared to NRPB2 WT and resulted in a uniform accumulation profile, which can be observed in metagene plots for introns of variable length genome‐wide (Figs 3F, and EV3H–J). We next tested possible connections between increased intragenic nascent RNAPII signal and splicing regulation. However, the fast mutant showed increased signal over both constitutive and alternative exons and introns (Fig EV3K–N). In conclusion, accelerated RNAPII transcription in NRPB2 Y732F resulted in increased nascent RNAPII transcription in gene bodies.
Accelerated transcription enhances intron splicing and exon skipping
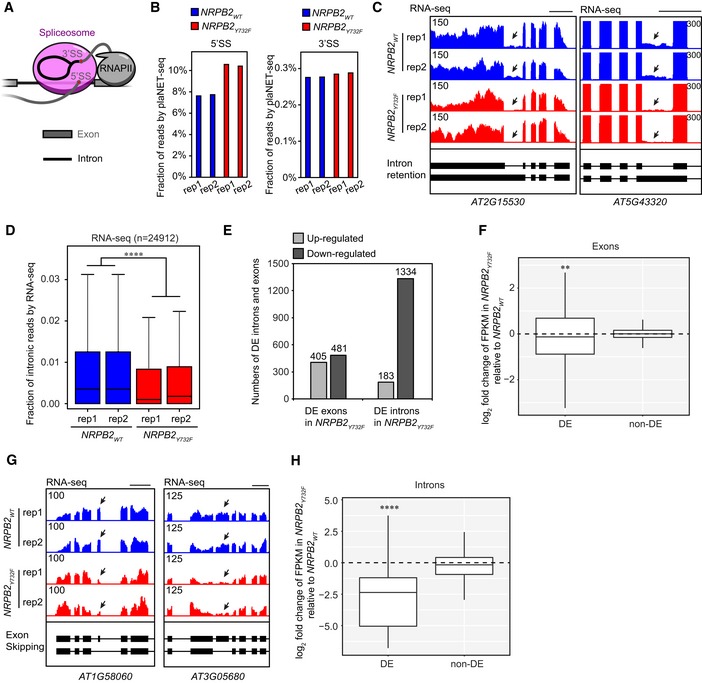
plaNET‐seq co‐purifies splicing intermediates due to co‐transcriptional spliceosome association with RNAPII (Fig 4A). The splicing intermediates appear as single‐nucleotide sharp peaks at 5′ splicing site (5′SS) and 3′ splicing site (3′SS) and thus can be distinguished from the nascent reads 10, 42. We detected an increased fraction of splicing intermediate reads corresponding to 5′SS in plaNET‐seq of NRPB2 Y732F compared to NRPB2 WT, while no obvious difference could be detected for 3′ splicing intermediates (Fig 4B). These data suggested an increased association of accelerated RNAPII transcription with splicing intermediates overlapping a 5′SS. Since 5′ splicing intermediates are associated with the spliceosome, we predicted that higher RNAPII coverage in gene bodies could increase spliceosome association and perhaps enhance splicing in NRPB2 Y732F. To test this idea, two independent replicates of RNA‐seq were performed for NRPB2 Y732F +/+ nrpb2‐2 −/− and NRPB2 WT +/+ nrpb2‐2 −/− seedlings (Fig EV4A). RNA‐seq detects predominantly spliced transcripts with a characteristic signal intensity profile matching annotated exons. However, we noticed RNA‐seq signal corresponding to some introns, presumably representing regulatory or poorly spliced introns (i.e., retained introns). Interestingly, initial visual inspection of several retained introns indicated that accelerated RNAPII transcription in NRPB2 Y732F appeared to decrease intronic RNA‐seq signal (Fig 4C). Strikingly, this finding is supported by a genome‐wide decrease in the fraction of intronic RNA‐seq signal across all genes (Fig 4D), suggesting a genome‐wide trend of increased splicing efficiency in plants when RNAPII transcription is accelerated. A systematic genome‐wide analysis identified 1,517 differentially expressed (DE) introns from the RNA‐seq data of NRPB2 Y732F compared to NRPB2 WT. The majority (1,334 out of 1,517) of DE introns exhibit decreased fraction of intronic reads (Table EV2). We identified similar numbers of DE exons with increased or decreased expression in NRPB2 Y732F compared to NRPB2 WT, while we detected many more introns with decreased expression (Fig 4E). Quantification of DE exons revealed a small yet significant reduction in expression (Fig 4F) that we visualized for internal exons of the AT1G58060 and AT3G05680 genes (Fig 4G). In contrast, we detected a stronger decrease for DE introns in NRPB2 Y732F mutant compared to NRPB2 WT (Fig 4H). We next tested alternative 5′SS and 3′SS usage (Fig EV4B) in the NRPB2 Y732F mutant compared to NRPB2 WT and found a trend to shift 5′SS upstream and 3′SS downstream (Fig EV4C–E). We note that a downstream shift of 3′SS is consistent with effects observed in the splicing factor mutant ntr1 linked to increased transcription speed in Arabidopsis 16. In summary, our RNA‐seq data revealed multiple effects of accelerated RNAPII transcription on splicing in Arabidopsis. Our analyses highlighted reduced intron retention as the most notable effect of altered RNAPII activity in Arabidopsis on splicing. The data support the idea that inefficient splicing of these introns in wild type may be interpreted through a model where RNAPII transcription speed could be limiting their splicing.
Figure 4. Analysis of alternative splicing in NRPB2 WT and NRPB2 Y732F mutant.
-
AA schematic illustration of the co‐transcriptional RNAPII–spliceosome complex. plaNET‐seq mainly detects splicing intermediates corresponding to 5′ splicing site (5′SS) co‐purified with engaged RNAPII complex.
-
BBar charts showing the fractions of 5′ and 3′ splicing intermediate reads from plaNET‐seq in NRPB2 WT +/+ nrpb2‐2 −/− (NRPB2 WT, blue) and NRPB2 Y732F +/+ nrpb2‐2 −/− (NRPB2 Y732F , red).
-
CGenome browser snapshots illustrating enhanced intron splicing in NRPB2 Y732F +/+ nrpb2‐2 −/− (NRPB2 Y732F, red) compared to NRPB2 WT +/+ nrpb2‐2 −/− (NRPB2 WT , blue). Scale bars denote 0.5 kb.
-
DThe fraction of RNA‐seq intronic reads calculated for all genes (n = 24,912) in NRPB2 WT +/+ nrpb2‐2 −/− and NRPB2 Y732F +/+ nrpb2‐2 −/−. Two‐sided Mann–Whitney U‐test: **** denotes P‐value < 2.2e‐16. The solid horizontal lines and box limits represent median, lower and upper quartiles of data values in each group. The upper and lower whiskers extend to the largest or smallest value, respectively, no further than 1.5*IQR from the relevant quartile.
-
EDifferentially expressed (DE) exons and introns in NRPB2 Y732F +/+ nrpb2‐2 −/− compared to NRPB2 WT +/+ nrpb2‐2 −/− based on RNA‐seq results. Numbers of DE exons and introns were shown in plot.
-
FQuantification (log2 fold change of FPKM from RNA‐seq) of differentially expressed (DE) exons and non‐DE exons in NRPB2 Y732F +/+ nrpb2‐2 −/− compared to NRPB2 WT +/+ nrpb2‐2 −/−. ** denotes P‐value < 0.01 by Wilcoxon signed‐rank test. The solid horizontal lines and box limits represent median, lower and upper quartiles of data values in each group. The upper and lower whiskers extend to the largest or smallest value, respectively, no further than 1.5*IQR from the relevant quartile.
-
GGenome browser snapshots illustrating enhanced exon skipping in NRPB2 Y732F +/+ nrpb2‐2 −/− (NRPB2 Y732F, red) compared to NRPB2 WT +/+ nrpb2‐2 −/− (NRPB2 WT , blue). Scale bars denote 0.5 kb.
-
HQuantification (log2 fold change of FPKM from RNA‐seq) of differentially expressed (DE) introns and non‐DE exons in NRPB2 Y732F +/+ nrpb2‐2 −/− compared to NRPB2 WT +/+ nrpb2‐2 −/−. **** denotes P‐value < 0.0001 by Wilcoxon signed‐rank test. The solid horizontal lines and box limits represent median, lower and upper quartiles of data values in each group. The upper and lower whiskers extend to the largest or smallest value, respectively, no further than 1.5*IQR from the relevant quartile.
Source data are available online for this figure.
Figure EV4. Genome‐wide effects of NRPB2 Y732F on gene expression by RNA‐seq compared to NRPB2 WT (related to Fig 4).
-
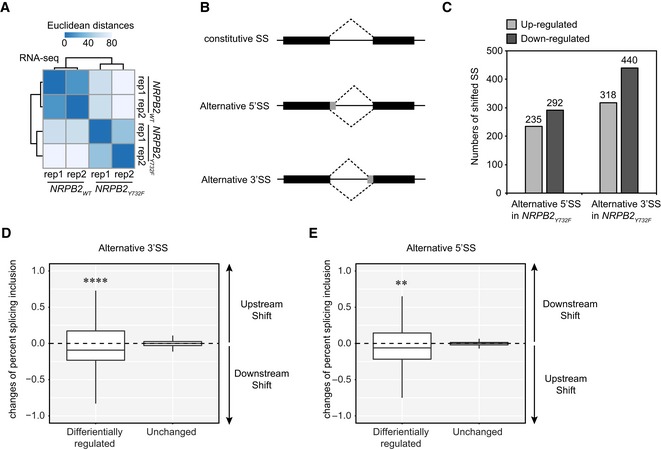
AReproducibility of RNA‐seq data demonstrated by clustered heatmap of Euclidean distances between two independent replicates of RNA‐seq in both NRPB2 WT +/+ nrpb2‐2 −/− and NRPB2 Y732F +/+ nrpb2‐2 −/−. Darker blue stands for higher reproducibility, and lighter blue represents low reproducibility.
-
BIllustration of constitutive splicing site (SS), alternative 5′ splicing site (SS), and alternative 3′ splicing site (SS).
-
CDifferentially regulated alternative 5′SS and 3′SS in NRPB2 Y732F +/+ nrpb2‐2 −/− compared to NRPB2 WT +/+ nrpb2‐2 −/− based on RNA‐seq results. Numbers of up‐ and down‐regulated SS were shown on the plot.
-
DQuantification (the changes of present splicing inclusion, dPSI) of differentially regulated alternative 3′SS exons and non‐DE exons in NRPB2 Y732F +/+ nrpb2‐2 −/− compared to NRPB2 WT +/+ nrpb2‐2 −/−. dPSI > 0 and dPSI < 0 suggest upstream and downstream shift of alternative 5′SS, respectively. **** denotes P‐value < 0.0001 by Wilcoxon signed‐rank test. The solid horizontal lines and box limits represent median, lower and upper quartiles of data values in each group. The upper and lower whiskers extend to the largest or smallest value, respectively, no further than 1.5*IQR from the relevant quartile.
-
EQuantification (the changes of present splicing inclusion, dPSI) of differentially regulated alternative 5′SS exons and non‐DE exons in NRPB2 Y732F +/+ nrpb2‐2 −/− compared to NRPB2 WT +/+ nrpb2‐2 −/−. dPSI > 0 and dPSI < 0 suggest downstream and upstream shift of alternative 5′SS, respectively. ** denotes P‐value < 0.01 by Wilcoxon signed‐rank test. The solid horizontal lines and box limits represent median, lower and upper quartiles of data values in each group. The upper and lower whiskers extend to the largest or smallest value, respectively, no further than 1.5*IQR from the relevant quartile.
Accelerated RNAPII transcription reduces RNAPII stalling at gene ends
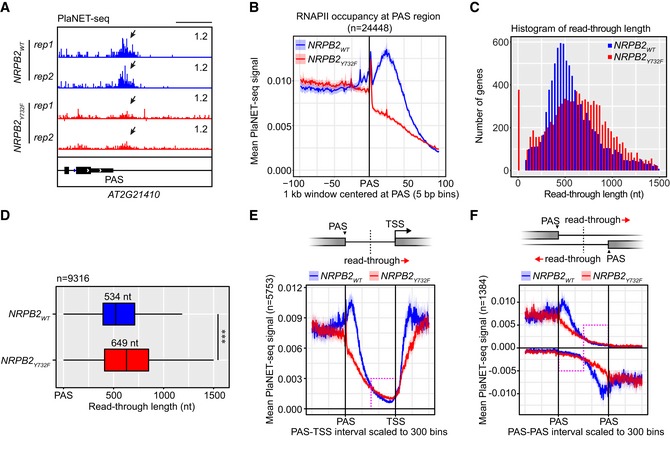
plaNET‐seq resolves peaks of RNAPII activity at 3′ ends of plant genes. This localized reduction in transcription speed at gene ends may assist RNAPII transcriptional termination. To test this hypothesis, we investigated the RNAPII stalling peaks at 3′ ends of genes by plaNET‐seq in the fast transcription mutant NRPB2 Y732F compared to NRPB2 WT. We detected RNAPII stalling downstream of poly (A) sites (PASs) of Arabidopsis genes in NRPB2 WT (Fig 5A). In contrast, PAS‐stalling peaks of RNAPII in this region were often undetectable in NRPB2 Y732F, as shown for the AT2G21410 gene (Fig 5A). A metagene analysis confirmed RNAPII peaks downstream of PAS at 3′ gene ends in NRPB2 WT and a strong reduction in NRPB2 Y732F genome‐wide (Fig 5B). These data connect increased RNAPII transcription speed and reduced RNAPII stalling at gene ends downstream of PAS. If RNAPII stalling were promoting transcription termination, we would expect termination defects in NRPB2 Y732F. Indeed, genome browser screenshots indicated higher RNAPII signal downstream of the PAS‐stalling region in NRPB2 Y732F in comparison with NRPB2 WT (Fig 5A), suggesting transcriptional read‐through as a consequence of increased transcription speed. To quantify this effect genome‐wide, we determined the transcriptional read‐through lengths in NRPB2 WT and NRPB2 Y732F. We used a statistical model which was based on empirical distributions of plaNET‐seq tag counts in both genic and intergenic regions (see Materials and Methods). Strikingly, we observed that NRPB2 Y732F extended transcriptional read‐through genome‐wide (FPKM > 5, n = 9,316; Fig 5C). We detected a 115 nt increase of median transcriptional read‐through length in NRPB2 Y732F compared to NRPB2 WT (NRPB2 Y732F, 649 nt; NRPB2 WT, 534 nt; Fig 5D). NRPB2 Y732F accelerating transcription speed thus reduces RNAPII termination efficiency and extends transcriptional read‐through. The process of RNAPII termination is sensitive to the RNAPII active site and putative catalysis, consistent with a model where increased RNAPII speed alters kinetic competition between transcriptional stalling, termination, and further elongation.
Figure 5. Accelerated transcription reduces RNAPII stalling at 3′ gene ends and enhances transcriptional read‐through downstream of PAS .
-
AplaNET‐seq signal of RNAPII at 3′ end of AT2G21410 in NRPB2 WT +/+ nrpb2‐2 −/− (NRPB2 WT, blue) and NRPB2 Y732F +/+ nrpb2‐2 −/− (NRPB2 Y732F , red). Arrows indicate the RNAPII signal peaks at PAS‐stalling region.
-
BMetagene profile of plaNET‐seq mean signal of RNAPII in a 1 kb window centered at PAS (n = 24,448) in NRPB2 WT +/+ nrpb2‐2 −/− (NRPB2 WT, blue) and NRPB2 Y732F +/+ nrpb2‐2 −/− (NRPB2 Y732F , red). The significance of differences of plaNET‐seq signal in the region from PAS to +100 bins between NRPB2 WT and NRPB2 Y732F was assessed by two‐sided Mann–Whitney U‐test, P = 1.53e‐06.
-
CHistogram of transcriptional read‐through length (nt) from PAS of protein‐coding gene (plaNET‐seq FPKM > 5, n = 9,316) in NRPB2 WT +/+ nrpb2‐2 −/− (NRPB2 WT, blue) and NRPB2 Y732F +/+ nrpb2‐2 −/− (NRPB2 Y732F , red).
-
DBox plot shows the RNAPII transcriptional read‐through length from PAS of protein‐coding genes (plaNET‐seq, FPKM > 5, n = 9,316) called based on statistical model (see Materials and Methods) in NRPB2 WT +/+ nrpb2‐2 −/− (NRPB2 WT, blue) and NRPB2 Y732F +/+ nrpb2‐2 −/− (NRPB2 Y732F , red). Medians of read‐through length in NRPB2 WT and NRPB2 Y732F mutant are 534 and 649 nt. Two‐sided Mann–Whitney U‐test: *** denotes P = 9.9e‐62. The solid horizontal lines and box limits represent median, lower and upper quartiles of data values in each group. The upper and lower whiskers extend to the largest or smallest value, respectively, no further than 1.5*IQR from the relevant quartile.
-
EMetagene plot of RNAPII signal by plaNET‐seq anchored at both PAS of upstream genes and TSS of downstream genes for tandemly oriented genes (n = 5,753) in NRPB2 WT +/+ nrpb2‐2 −/− (NRPB2 WT, blue) and NRPB2 Y732F +/+ nrpb2‐2 −/− (NRPB2 Y732F , red). Red arrow denotes the direction of transcriptional read‐through. Pink dashed line rectangle indicates the region corresponding to the second half of PAS‐TSS gaps along 5′–3′ direction.
-
FMetagene plot of RNAPII signal by plaNET‐seq anchored at PASs of both upstream genes and downstream genes for gene pairs located in “tail‐to‐tail” orientation (n = 1,384) in NRPB2 WT +/+ nrpb2‐2 −/− (NRPB2 WT, blue) and NRPB2 Y732F +/+ nrpb2‐2 −/− (NRPB2 Y732F , red). Red arrows denote the directions of transcriptional read‐through from both PASs. Pink dashed line rectangles indicate the region corresponding to the second half of PAS‐TSS gaps along 5′–3′ direction.
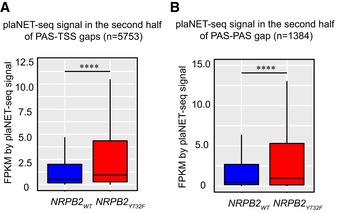
Transcriptional read‐through blurs the boundaries of transcription units, which could result in overlapping transcripts and potential gene expression conflicts. To investigate this, we focused on read‐through transcription of tandemly oriented genes, where transcription read‐through from upstream‐located genes may invade downstream genes. RNAPII with accelerated transcription speed is expected to extend transcriptional read‐through into the intergenic space (i.e., gaps) between the PAS of an upstream gene and the TSS of a downstream gene (PAS‐TSS gaps). Indeed, NRPB2 Y732F shows higher RNAPII signal than NRPB2 WT in the second half of PAS‐TSS gaps (n = 5,753) while RNAPII in NRPB2 WT stalls downstream of PAS in the first half of PAS‐TSS gaps (Figs 5E and EV5A). We further investigated plaNET‐seq RNAPII signal in PAS‐PAS gaps of paired genes facing each other in “tail‐to‐tail” orientation (n = 1,384). Also for this subset of genes, NRPB2 Y732F lacked the characteristic RNAPII PAS‐stalling in the first half of PAS‐PAS gaps and showed significantly higher RNAPII signal in the second half of PAS‐PAS gaps (Figs 5F and EV5B). These data suggest that accelerated transcription speed triggers transcriptional read‐through genome‐wide, resulting in overlapping transcripts and potential gene expression conflicts. In conclusion, our data highlight connections between reduced speed of RNAPII transcription at gene ends (i.e., PAS‐stalling) and the termination of RNAPII transcription, linking the speed of transcription to spatial separation of plant transcription units.
Figure EV5. Quantification of read‐through transcription in NRPB2 Y732F compared to NRPB2 WT (related to Fig 5).
-
ABox plot showing the comparison of plaNET‐seq signal of NRPB2 WT (blue) and NRPB2 Y732F (red) in the region corresponding to the second half of PAS‐TSS gaps (n = 5,753) between tandemly oriented genes. Mann–Whitney test, **** denotes P = 1.70e‐43. The solid horizontal lines and box limits represent median, lower and upper quartiles of data values in each group. The upper and lower whiskers extend to the largest or smallest value, respectively, no further than 1.5*IQR from the relevant quartile.
-
BBox plot showing the comparison of plaNET‐seq signal of NRPB2 WT (blue) and NRPB2 Y732F (red) in the region corresponding to the second half of PAS‐PAS gaps (n = 1,384) between genes located in “tail‐to‐tail” orientation. Mann–Whitney test, **** denotes P = 7.10e‐14. The solid horizontal lines and box limits represent median, lower and upper quartiles of data values in each group. The upper and lower whiskers extend to the largest or smallest value, respectively, no further than 1.5*IQR from the relevant quartile.
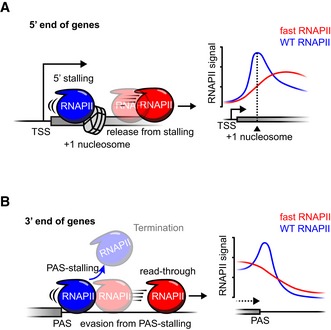
Our findings highlight molecular and organismal consequences of altered RNAPII elongation speed in a multicellular organism. The two main peaks of RNAPII localization in genomes at gene boundaries were depleted when transcription speed was accelerated (Fig 6A and B). Accelerated RNAPII transcription impacted gene expression after transcriptional initiation, through profound effects on splicing and transcriptional termination. Our data support that transcription speed control at gene boundaries is a key step in gene expression of multicellular organisms.
Figure 6. Cartoon summarizing the effect of NRPB2 Y732F on RNAPII genomic stalling and transcription read‐through.
-
AA schematic illustrating the effect of transcription speed on RNAPII stalling at promoter‐proximal regions. Accelerated RNAPII is prone to move out of stalling regions (centered at the position of the +1 nucleosome) at 5′ end of genes, resulting in reduced promoter‐proximal stalling peaks in RNAPII profile by plaNET‐seq.
-
BA schematic illustration showing that accelerated RNAPII tends to evade from RNAPII stalling near gene poly‐(A) sites (PAS). This leads to less efficient transcription termination and extended transcription read‐through, reflected by the absence of RNAPII signal peaks downstream of PAS and elevated signal downstream of PAS‐stalling region by plaNET‐seq.
Discussion
RNAPII transcription speed and organismal development
While we succeeded in generation of viable plants carrying a fast RNAPII mutation, we were unable to obtain plants with a mutation in a conserved residue that reduced RNAPII transcription speed in yeast. This observation is reminiscent of embryonic lethality in mice through a point mutation in the largest RNAPII subunit that decreases transcription speed 43. Female germline development in Arabidopsis involves more complex cellular differentiation than male germline development 44. A genetic dissection of factors required for female germline development revealed cell specification by multiple splicing factors 44, 45. Accelerated RNAPII transcription in NRPB2 Y732F was associated with increased splicing efficiency, perhaps offering an explanation for enhanced viability of the female gametophyte compared to nrpb2‐2.
Accelerated RNAPII transcription and RNAPII stalling
Promoter‐proximal stalling represents a common feature of transcription throughout eukaryotic genomes 46. The purpose of promoter‐proximal RNAPII stalling is debated actively, yet a reduction in RNAPII transcription speed during stalling could be part of a checkpoint regulating gene expression. In organisms without NELF, for example, plants, promoter‐proximal RNAPII stalling correlates with the position of the +1 nucleosome encountered by the transcription machinery 8. Accelerated transcription in NRPB2 Y732F decreased promoter‐proximal stalling and resulted in increased intragenic RNAPII transcription. Our data thus suggest that a reduction in RNAPII elongation speed near promoters facilitates the accumulation of promoter‐proximal RNAPII peaks. In Arabidopsis, these peaks form independently of NELF and perhaps form through contributions by nucleosome barriers that correlate well with the peak position 8, 47.
Possible advantages of promoter‐proximal RNAPII stalling include a reduced response time to adjust gene expression to new environmental conditions. Instead of initiating the process of RNAPII transcription from recruitment and complex assembly, stalled RNAPII may represent pre‐assembled and elongation competent RNAPII complexes waiting for signals to transcribe the full gene 1. Defense signaling is crucial for plant fitness and regulated with fast temporal dynamics, perhaps achieved by a release of RNAPII into elongation from promoter‐proximal stalling sites. If true, this would predict constitutive defense signaling when transcription is accelerated. Interestingly, NRPB2 Y732F +/+ nrpb2‐2 −/− plants resembled mutants with constitutively active defense signaling 34. PR gene induction represents a diagnostic molecular hallmark of elevated defense signaling 48. While alternative molecular explanations for stunted growth in NRPB2 Y732F +/+ nrpb2‐2 −/− may exist, for example, indirect effects, the induction of PR gene expression is consistent with an auto‐immunity phenotype triggered by accelerated transcription. Our data thus provide a potential connection between plant defense signaling, promoter‐proximal RNAPII stalling, and the speed of RNAPII transcription. In conclusion, these data imply that transcription speed limits at gene boundaries may benefit plants by avoiding constitutive defense signaling that triggers auto‐immunity.
Accelerated RNAPII transcription and RNA processing
Our targeted introduction of candidate point mutations represents a direct approach to address mechanistic links between the speed of RNAPII transcription and RNA processing. Nevertheless, some molecular effects we reported could represent indirect effects caused by differences in growth and development between NRPB2 Y732F +/+ nrpb2‐2 −/− and NRPB2 WT +/+ nrpb2‐2 −/−. RNA‐seq revealed that intron retention is reduced when RNAPII is accelerated; in other words, splicing efficiency of poorly spliced introns is increased. plaNET‐seq data indicate that increased splicing efficiency is associated with the capture of splicing intermediates with 3′ terminal bases overlapping 5′SS, perhaps indicating that splicing of retained introns could be increased by promoting RNAPII binding to 5′SS. In conclusion, the speed of RNAPII transcription contributes to plant gene expression by modulating splicing efficiency, particularly at retained introns.
plaNET‐seq data informed on transcriptional termination of RNAPII. Strikingly, we found a reduction in RNAPII peaks associated with termination when transcription is accelerated, and an increased distance of read‐through transcription downstream of the PAS (Fig 5D). Read‐through transcription triggered by elevated temperature has been reported in budding yeast and mammalian cell culture 37, 49. Extended read‐through as observed in an accelerated RNAPII transcription mutant may have functional consequences on gene expression. The increased transcriptional read‐through may result in gene expression defects for neighboring genes, for example, by transcriptional interference 50, 51. In summary, our data support the idea that a reduction in RNAPII transcription speed promotes RNAPII density peaks in genomes with functional consequences for the process of transcriptional termination.
Materials and Methods
Reagents and Tools Table
| Reagent or resource | Source | Identifier |
|---|---|---|
| Antibodies | ||
| Rabbit Anti‐Mouse Immunoglobulins/HRP | Dako | P0161; RRID:AB_2687969 |
| Swine anti‐rabbit Ig HRP antibody | Dako | P0217; RRID:AB_2728719 |
| Anti‐Histone H3 antibody | Abcam | Ab1791; RRID:AB_302613 |
| Monoclonal ANTI‐FLAG® M2 antibody produced in mouse | Sigma‐Aldrich | F3165; RRID: AB_259529 |
| Monoclonal ANTI‐FLAG® M2 antibody produced in mouse | Sigma‐Aldrich | F1804; RRID:AB_262044 |
| Bacterial and virus strains | ||
| Escherichia coli DH5α™ competent cells | Thermo Fisher | Cat no. 18265017 |
| Agrobacterium tumefaciens GV3101(PMP90) | N/A | N/A |
| Peptides | ||
| Flagellin 22 peptides | Schafer‐N | Peptide 40007 |
| Critical commercial assays | ||
| miRNeasy Mini Kit | QIAGEN | ID: 217004 |
| SuperScript™ IV First‐Strand Synthesis System | Invitrogen | Cat. no.18091050 |
| NEXTflex Small RNA‐Seq Kit v3 | Bioo Scientific | N/A |
| DNA High Sensitivity Kit | Agilent | 5067‐4626 |
| 4–15% Criterion™ TGX Stain‐Free™ Protein Gel | Bio‐Rad | Cat. no. 5678084 |
| TURBO DNA‐free Kit | Thermo Fisher | Cat. no. AM1907 |
| Dynabeads™ Antibody Coupling Kit | Thermo Fisher | Cat. no. 114311D |
| TruSeq RNA Library Prep Kit v2 | Illuminia | RS‐122‐2001 |
| GoTaq® qPCR Master Mix | Promega | Cat no. A6002 |
| RNeasy Plant Mini Kit | QIAGEN | ID: 74904 |
| Deposited data | ||
| GSE133143 | NCBI GEO | https://www.ncbi.nlm.nih.gov/geo/query/acc.cgi?acc=GSE133143 |
| Experimental models: organisms/strains | ||
| Arabidopsis thaliana Col‐0 | N/A | N/A |
| NRPB2/nrpb2‐2 mutant | Dr. Craig Pikaard | N/A |
| Software and algorithms | ||
| Software for bioinformatic analysis: see Materials and Methods | GitHub | https://github.com/Maxim-Ivanov/Leng_et_al_2019 |
Methods and Protocols
Plant material and growth conditions
The Arabidopsis mutant lines generated in this study were based on A. thaliana Columbia ecotype (Col‐0) background. Generation of transgenic Arabidopsis plants was performed by Agrobacterium‐mediated transformation as described 52. NRPB2 Y732F and NRPB2 WT transgenes were first introduced to Col‐0 and then crossed with nrpb2‐2 +/− mutant. NRPB2 WT +/+ nrpb2‐2 −/− and NRPB2 Y732F +/+ nrpb2‐2 −/− double mutants were screened by genotyping from F3 generation (Fig EV1A).
For in vitro growth, Arabidopsis seeds were surface‐sterilized and placed on ½ MS media agar plates (1% sucrose). The seeds were stratified in 4°C for 3 days before transferred into 22°C with 16/8‐h light/dark. For flagellin 22 treatment experiments, Arabidopsis seeds were grown on ½ MS media agar plate (1% sucrose) for 12 days, and seedlings were transferred into ½ MS liquid media (1% sucrose) and grew in flasks under 22°C with 16/8‐h light/dark and 150 rpm shaking for 2 days. For growth on soil, Arabidopsis seeds were sowed on soil directly and undergo stratification in 4°C for 3 days before growth under 22°C with 16/8‐h light/dark on soil.
Plasmid construction
The construction of vectors for Agrobacterium‐mediated stable transformation was based on pEarleyGate 302 vector (pEG302). pEG302‐AtNRPB2WT‐FLAG construct was kindly provided by Craig Pikaard 33. To generate pEG302‐AtNRPB2Y732F‐FLAG and pEG302‐AtNRPB2Y732F‐FLAG, pEG302‐AtNRPB2WT‐FLAG construct was linearized by DraIII digestion and used as backbone in isothermal assembly reactions; the inserts in isothermal assembly are partial genomic NRPB2 sequences containing Y732F (TAT to TTT) point mutation and P979S (CCG to TCG), respectively. Fragment containing DNA mutation for Y732F mutant was generated by overlapping PCR (primer pair 3089/3082) fusing two fragments generated by primer pair 3089/3467 and 3082/3466. By using similar strategy, fragment containing DNA mutation for P979S mutant was also generated by overlapping PCR (primer pair 3089/3082) fusing two fragments generated by primer pair 3089/3084 and 3082/3083. Isothermal assembly was performed subsequently to generate pEG302‐AtNRPB2Y732F‐FLAG and pEG302‐AtNRPB2Y732F‐FLAG. All constructs were verified by extensive restriction enzyme digestions, and the fragment with DNA mutations for NRPB2 Y732F and NRPB2 WT was confirmed by DNA sequencing analysis. The primers used in plasmid construction are listed in Table EV1.
Flagellin treatment
Flagellin 22 (N‐terminus acetylated) was synthesized by Schafer‐N (https://schafer-n.com). For each replicate, flagellin 22 treatment was carried out by adding the 0.75 ml flagellin 22 solution (1 mg/ml in DMSO) to Arabidopsis seedlings from 50 μl seeds growing in 100 ml liquid MS media in a flask (3.3 μM as final concentration of flagellin 22). The treatment was set in 0‐min (before treatment), 2‐, 3‐, and 4‐min time course. Each experiment was performed in three independent replicates. After flagellin 22 treatment, the seedlings were flash‐frozen in liquid nitrogen.
Protein extraction and western blotting
NRPB2WT‐FLAG, NRPB2Y732F‐FLAG, and NRPB2P979S‐FLAG proteins were extracted from 2‐week‐old Arabidopsis seedlings of NRPB2 WT +/+ Col‐0, NRPB2 Y732F +/+ Col‐0, and NRPB2 P979S +/+ Col‐0, respectively. Equal amounts of plant material were ground into a fine powder, and proteins were extracted in 2.5× extraction buffer (150 mM Tris–HCl pH 6.8; 5% SDS; 25% Glycerol; 0.025% Bromophenol blue; 0.1 mM DTT). Total proteins were separated by SDS–PAGE on precast 4–15% Criterion TGX stain‐free protein gels (Bio‐Rad) and transferred to PVDF membrane by Trans‐Blot Turbo transfer system (Bio‐Rad). 5% non‐fat milk in PBS was used to block blotted membrane (30 min at room temperature). Anti‐FLAG (Sigma F1804 or F3165) antibodies and anti‐mouse HRP‐conjugated secondary antibody (Dako P0161) were used as primary and secondary antibodies for the detection of FLAG‐tagged NRPB2 proteins. Anti‐H3 (abcam ab1791) antibody and anti‐rabbit HRP‐conjugated secondary antibody (Dako P0217) were used as primary and secondary antibodies for the detection of histone H3. The membrane was incubated with primary antibody overnight at 4°C with gentle rotation (final concentration 0.25 μg/ml in PBS). Membranes were washed with PBS and then incubated with secondary antibody (1:10,000 dilution in PBS) for 1 h at room temperature, followed by two‐time washes with PBS (5 min each) and one‐time wash with PBST (10 min). Chemiluminescent signals were detected using Super‐Signal West Pico Chemiluminescent (Thermo Fisher Scientific) according to manufacturer's instructions.
Yeast strains, media, and primer extension analysis
Yeast media are prepared as described 27. For MPA and Mn2+ growth assay, MPA (final concentration 20 mg/ml) and MnCl2 (15 mM) were supplemented to minimal SC‐Leucine medium. The yeast RNAPII mutant strains were generated by site‐directed mutagenesis as previously described 20. TSS selection of ADH1 gene was assayed by primer extension analysis. In brief, corresponding yeast strains were grown in YPD media to mid‐log phase; 30 μg of isolated yeast total RNA from each indicated strains was used in primer extension analysis exactly as previously described 20, 27.
Nascent RNA isolation
Nascent RNA was isolated according to previously described protocol with minor changes 38. NRPB2 WT +/+ Col‐0, NRPB2 Y732F +/+ Col‐0 seedlings from flagellin 22 treatment were ground into a fine powder. Nuclei were isolated and washed with HONDA buffer [0.44 M sucrose, 1.25% Ficoll, 2.5% Dextran T40, 20 mM Tris–HCl pH 7.5, 10 mM MgCl2, 0.5% Triton X‐100, 5 mM DTT, 1× EDTA‐free Complete protease inhibitor (Roche)]. The nuclear fraction was digested by 600 U DNase I in 0.5 ml Lysis buffer [0.3 M NaCl, 20 mM Tris–HCl pH 7.5, 5 mM MgCl2, 5 mM β‐mercaptoethanol, 1× EDTA‐free Complete protease inhibitor (Roche), 0.5% Tween‐20, 10 μl RNase inhibitor (moloX GmbH, http://www.molox.de)] at 4°C for 20 min with shaking at 2,000 rpm on an Eppendorf ThermoMixer. The supernatant of a centrifugation (10,000 g for 10 min at 4°C) was recovered into a new tube and combined with Dynabeads M‐270 (Invitrogen) coupled with anti‐FLAG antibody (Sigma) for 2 h at 4°C with gentle rotation. Anti‐FLAG antibody was coupled with Dynabeads according to the manufacturer's instructions. After FLAG‐IP, beads were washed 6 times using 0.5 ml Wash buffer [0.3 M NaCl, 20 mM Tris–HCl pH 7.5, 5 mM MgCl2, 5 mM β‐mercaptoethanol, 1× EDTA‐free Complete protease inhibitor (Roche), and RNase inhibitor]. Bead‐bound protein was eluted with 0.5 mg/ml 3xFLAG peptide (ApexBio) for 30 min twice at 4°C. RNA attached to immunoprecipitated proteins was isolated using QIAGEN miRNeasy Mini Kit according to manufacturer's instructions. Western blot has been done as previously described 38 for input, unbound, and eluted fractions to monitor IP efficiency.
Nascent RNA analysis
Isolated nascent RNA was treated with Turbo DNase to remove DNA contamination following the manufacturer's instruction (Ambion). Hundred nanograms of DNase‐treated RNA was used for reverse transcription into cDNA by gene‐specific primers following the manufacturer's instruction of Superscript IV (Invitrogen) kit. Quantitative analysis of the generated cDNA was carried out by qPCR using the GoTaq qPCR Master Mix (Promega) and CFX384 Touch Real‐Time PCR Detection System (Bio‐Rad). Negative controls lacking the reverse transcriptase enzyme (−RT) were performed alongside all RT–qPCR experiments. qPCR expression level of each primer pair was calculated relative to the level of reference gene ACT2. All the primers used in RT and qPCR were summarized in Table EV1.
PlaNET‐seq library construction and sequencing
Libraries for plaNET‐seq were prepared as previously described 8. Nascent RNA from NRPB2 WT +/+ nrpb2‐2 −/− and NRPB2 Y732F +/+ nrpb2‐2 −/− seedlings was used in plaNET‐seq. In specific, the plaNET‐seq libraries were constructed according to Bioo Scientific's NEXTflex Small RNA‐Seq Kit v3 using a customized protocol. Two independent replicate libraries were constructed for each plant genotype. Approximately 100 ng RNA was used for each replicate. The isolated RNA was ligated with 3′‐linker and fragmented in alkaline solution (100 mM NaCO3 pH 9.2, 2 mM EDTA). The fragmented RNA was cleaned up and subjected to T4 PNK treatment (20 U PNK, NEB) for 20 min at 37°C followed by re‐annealing of RT primer (5′‐GCCTTGGCACCCGAGAATTCCA‐3′; 70°C, 5 min; 37°C, 30 min; and 25°C, 15 min). The RNA was then re‐introduced to the manufacturer's protocol at the adapter inactivation step. The final libraries were quantified with DNA High Sensitivity Kit on Agilent Bioanalyzer 2100 and then sequenced on the Illumina HiSeq 4000 platform in PE150 mode at Novogene (https://en.novogene.com).
Total RNA extraction and RNA‐seq
Total RNA was extracted from 2‐week‐old NRPB2 WT +/+ nrpb2‐2 −/− and NRPB2 Y732F +/+ nrpb2‐2 −/− Arabidopsis seedlings using Plant RNeasy Mini Kit following manufactural instructions (QIAGEN). Turbo DNase (Ambion) was used to treat extracted RNA using oligo‐dT primers and Superscript IV (Invitrogen) as per manufacturer's instructions. The poly(A)‐enriched libraries for RNA‐seq were constructed using Illumina TruSeq Sample Prep Kit v2 following the manufacturer's protocol and quantified on Agilent 2100 Bioanalyzer. The sequencing was performed on Illumina HiSeq 4000 platform in PE100 mode.
Bioinformatics
All the supporting code for bioinformatics analysis is available at https://github.com/Maxim-Ivanov/Leng_et_al_2019.
Alignment and post‐processing of plaNET‐seq reads were done as previously described 8. The first 4 bases of both R1 and R2 reads in plaNET‐seq are unique molecular identifiers (UMIs). They were trimmed from read sequences and appended to read names using UMI‐Tools v0.5.3. After UMI trimming, the 5′‐terminal base of R2 corresponds to the 3′‐end of original RNA molecule and thus denoted the genomic position of RNAPII active center. R2 reads were aligned to TAIR10 genome assembly using STAR v2.5.2b in transcriptome‐guided mode with the following settings: –outSAMmultNmax 1 –alignEndsType Extend5pOfRead1 –clip3pAdapterSeq GATCGTCGGACT. Ensembl Plants release 28 was used as the source of transcript annotation for alignment. The BAM files were sorted using Samtools v1.3.1. The following categories of reads were filtered out: (i) PCR duplicates (UMI‐Tools); (ii) reads aligned within 100 bp from any rRNA, tRNA, snRNA, or snoRNA gene from Araport11 on either strand (BEDtools v2.17.0); and (iii) reads aligned with MAPQ < 10 (Samtools). The filtered BAM files were imported into R environment v3.5.1 using GenomicAlignments_1.18.1 library. The strand orientation of reads was flipped to restore strandedness of the original RNA molecules. 3′‐terminal bases of flipped reads were found to overlap with donor or acceptor splice sites much more frequently than could be expected by chance. Such reads most likely represent splicing intermediates due to co‐immunoprecipitation of the spliceosome together with FLAG‐tagged RNAPII complexes. These reads were filtered out by overlap with the union of splice sites obtained from both Ensembl Plants 28 (TxDb.Athaliana.BioMart.plantsmart28 package) and Araport11 annotations. In addition, all split reads were removed as possible mature RNA contaminations. The remaining reads are expected to represent the nascent RNA population. Their genomic coverage was exported as strand‐specific BigWig and bedgraph files using rtracklayer_1.42.2. For details on the alignment procedure, see 01‐Alignment_of_plaNET‐Seq_data.sh and 02‐Postprocessing_of_plaNET‐Seq_data.R.
Araport11 annotation was used throughout all further steps of data analysis because it is more comprehensive in terms of non‐coding transcripts than both TAIR10 and Ensembl Plants 28 annotations. We adjusted gene borders from Araport11 using coordinates of TSS and PAS tag clusters which were called using CAGEfightR package 53 from the available TSS‐seq 50 and direct RNA‐seq datasets 54, 55, respectively. If multiple TSS or PAS tag clusters were connected to the same gene, the strongest of them was chosen as the new border. For details, see 03_Adjustment_of_Araport11_gene_boundaries.
To draw metagene plots of plaNET‐seq, we merged Bedgraph tracks of the two biological replicates of each genotype. The merged tracks were then normalized to 1 million reads in nuclear protein‐coding genes. The X axes of metagene plots represent the genomic intervals of choice (whole genes, exons, introns, etc.) which were scaled to the defined number of bins. Intervals overlapping multiple annotated transcription units were excluded from consideration. Both introns and exons were trimmed by 5 bp each side prior to scaling to avoid possible artifacts. The Y axes show the sequencing coverage averaged between the genomic intervals. The shaded area in metagene plots represents normal‐based standard error of mean of normalized plaNET‐seq signal at each genomic bin. For details, see 08‐Metagene_plots.R. The positions of nucleosomes in Arabidopsis were obtained from the PlantDHS database 56.
To calculate the read‐through (RT) length, we considered transcribed genes (plaNET‐seq FPKM in WT samples above 5). Genomic intervals for RT length estimation were defined from PAS of the analyzed gene to the nearest downstream TSS. Coordinates of TSS and PAS clusters were called from TSS‐seq and direct RNA‐seq datasets as described above. For each gene of interest, the empirical distribution of plaNET‐seq tag counts in 100‐bp sliding window was obtained (the “transcription” model). The “random” model corresponding to the un‐transcribed state was represented by Poisson distribution where the rate parameter was estimated from plaNET‐seq tag counts in intergenic regions. Then, plaNET‐seq tags were counted in every 100‐bp window moving in 10‐bp steps along the candidate RT genomic interval. For each window, the probability to observe at most this tag count under the gene‐specific “transcription” model was divided by the probability to observe at least this tag count under the alternative “random” model. The start position of the first window where the probability ratio dropped below 1 was considered as the end of the read‐through region. For details, see 04‐Read‐through_distance.R.
To calculate promoter‐proximal RNAPII stalling index for each gene, we first found 100‐bp windows with the highest plaNET‐seq coverage within the interval (TSS − 100 bp, TSS + 300 bp). Center of this window was considered as the summit of promoter‐proximal RNAPII peak. The stalling index was then calculated as the ratio of plaNET‐seq coverage in this window vs the whole gene (normalized by gene width). To avoid statistical artifacts, genes shorter than 1 kb or having plaNET‐seq FPKM below 1 were skipped from consideration. For details, see 05‐Promoter‐proximal_stalling_index.R.
RNA‐seq reads were adapter‐ and quality‐trimmed by TrimGalore v0.4.3 in paired‐end mode and then aligned to TAIR10 by STAR v2.5.2b in local mode. Aligned reads with MAPQ below 10 were removed by Samtools v1.3.1. BAM files were converted to unstranded Bedgraph and BigWig files using BEDtools genomecov v2.26.0 and kentUtils bedGraphToBigWig v4, respectively. The code was detailed in the section 06‐Alignment_of_RNA‐Seq_data.sh in the mentioned GitHub page.
Differentially expressed genes were called from RNA‐seq data using DESeq2 57. Differentially expressed exons and introns were detected independently from the changes in gene expression level by DEXSeq 58. Exons and introns were defined as disjoint exonic or intronic intervals, respectively, in Araport11. For details, see 07‐Differential_expression.R.
To detect the differential usage of alternative 5′ and 3′ splice sites, transcript isoforms were first quantified by Cufflinks 59. Then, the Cufflinks output was used to quantify the different AS events extracted from an Arabidopsis reference transcript dataset AtRTD2 60 with SUPPA2 61. For details, see 10‐SUPPA2_pipeline.sh and 11‐Differential_AS.R scripts.
Author contributions
Conceptualization: XL, CDK, SM; Methodology: MI, PK, SM; Investigation: XL, PK, IM, MI, SM; Formal analysis: MI, AT, AS; Data curation: MI; Writing—original draft: XL, SM; Writing—review and editing: XL, MI, CDK, PK, PB, AS, SM; Visualization, XL, MI; Resources: CDK, SM; Supervision: CDK, SM; Funding acquisition: SM.
Conflict of interest
The authors declare that they have no conflict of interest.
Supporting information
Expanded View Figures PDF
Table EV1
Table EV2
Source Data for Expanded View
Review Process File
Source Data for Figure 1
Source Data for Figure 2
Source Data for Figure 4
Acknowledgements
Research in the laboratory of S.M. is supported by a Hallas‐Møller Investigator award by the Novo Nordisk Foundation NNF15OC0014202 and a Copenhagen Plant Science Centre Young Investigator Starting grant. In addition, this project has received funding from the European Research Council (ERC) and the Marie Curie Actions under the European Union's Horizon 2020 research and innovation program StG2017‐757411 (S.M.) and MSCA‐IF 703085 (P.K.). Research in the laboratory of C.D.K. is supported by NIH R01GM097260. We are grateful to Mary Gehring and Steve Buratowski for support during early stages of this project and Morgan Moeglein for excellent plant care. We are grateful to Craig Pikaard for sharing key reagents. We thank the members of the Marquardt lab for feedback on the manuscript.
EMBO Reports (2020) 21: e49315
Data availability
The raw and processed plaNET‐seq and RNA‐seq data were deposited in Gene Expression Omnibus (https://www.ncbi.nlm.nih.gov/geo/) under accession number GSE133143.
References
- 1. Jonkers I, Lis JT (2015) Getting up to speed with transcription elongation by RNA polymerase II. Nat Rev Mol Cell Biol 16: 167–177 [DOI] [PMC free article] [PubMed] [Google Scholar]
- 2. Gromak N, West S, Proudfoot NJ (2006) Pause sites promote transcriptional termination of mammalian RNA polymerase II. Mol Cell Biol 26: 3986–3996 [DOI] [PMC free article] [PubMed] [Google Scholar]
- 3. Proudfoot NJ (2016) Transcriptional termination in mammals: stopping the RNA polymerase II juggernaut. Science 352: aad9926 [DOI] [PMC free article] [PubMed] [Google Scholar]
- 4. Mahat DB, Salamanca HH, Duarte FM, Danko CG, Lis JT (2016) Mammalian heat shock response and mechanisms underlying its genome‐wide transcriptional regulation. Mol Cell 62: 63–78 [DOI] [PMC free article] [PubMed] [Google Scholar]
- 5. Steurer B, Janssens RC, Geverts B, Geijer ME, Wienholz F, Theil AF, Chang J, Dealy S, Pothof J, van Cappellen WA et al (2018) Live‐cell analysis of endogenous GFP‐RPB1 uncovers rapid turnover of initiating and promoter‐paused RNA polymerase II. Proc Natl Acad Sci USA 115: E4368–E4376 [DOI] [PMC free article] [PubMed] [Google Scholar]
- 6. Krebs AR, Imanci D, Hoerner L, Gaidatzis D, Burger L, Schubeler D (2017) Genome‐wide single‐molecule footprinting reveals high RNA polymerase II turnover at paused promoters. Mol Cell 67: 411 [DOI] [PMC free article] [PubMed] [Google Scholar]
- 7. Vos SM, Farnung L, Urlaub H, Cramer P (2018) Structure of paused transcription complex Pol II‐DSIF‐NELF. Nature 560: 601 [DOI] [PMC free article] [PubMed] [Google Scholar]
- 8. Kindgren P, Ivanov M, Marquardt S (2019) Native elongation transcript sequencing reveals temperature dependent dynamics of nascent RNAPII transcription in Arabidopsis . Nucleic Acids Res 48: 2332–2347 [DOI] [PMC free article] [PubMed] [Google Scholar]
- 9. Mayer A, di Iulio J, Maleri S, Eser U, Vierstra J, Reynolds A, Sandstrom R, Stamatoyannopoulos JA, Churchman LS (2015) Native elongating transcript sequencing reveals human transcriptional activity at nucleotide resolution. Cell 161: 541–554 [DOI] [PMC free article] [PubMed] [Google Scholar]
- 10. Nojima T, Gomes T, Grosso ARF, Kimura H, Dye MJ, Dhir S, Carmo‐Fonseca M, Proudfoot NJ (2015) Mammalian NET‐Seq reveals genome‐wide nascent transcription coupled to RNA processing. Cell 161: 526–540 [DOI] [PMC free article] [PubMed] [Google Scholar]
- 11. Fong N, Kim H, Zhou Y, Ji X, Qiu JS, Saldi T, Diener K, Jones K, Fu XD, Bentley DL (2014) Pre‐mRNA splicing is facilitated by an optimal RNA polymerase II elongation rate. Genes Dev 28: 2663–2676 [DOI] [PMC free article] [PubMed] [Google Scholar]
- 12. Laitem C, Zaborowska J, Isa NF, Kufs J, Dienstbier M, Murphy S (2015) CDK9 inhibitors define elongation checkpoints at both ends of RNA polymerase II‐transcribed genes. Nat Struct Mol Biol 22: 396–403 [DOI] [PMC free article] [PubMed] [Google Scholar]
- 13. Cramer P, Bushnell DA, Kornberg RD (2001) Structural basis of transcription: RNA polymerase II at 2.8 angstrom resolution. Science 292: 1863–1876 [DOI] [PubMed] [Google Scholar]
- 14. Vassylyev DG, Vassylyeva MN, Zhang JW, Palangat M, Artsimovitch I, Landick R (2007) Structural basis for substrate loading in bacterial RNA polymerase. Nature 448: 163–168 [DOI] [PubMed] [Google Scholar]
- 15. Wang D, Bushnell DA, Westover KD, Kaplan CD, Kornberg RD (2006) Structural basis of transcription: role of the trigger loop in substrate specificity and catalysis. Cell 127: 941–954 [DOI] [PMC free article] [PubMed] [Google Scholar]
- 16. Dolata J, Guo YW, Kolowerzo A, Smolinski D, Brzyzek G, Jarmolowski A, Swiezewski S (2015) NTR1 is required for transcription elongation checkpoints at alternative exons in Arabidopsis . EMBO J 34: 544–558 [DOI] [PMC free article] [PubMed] [Google Scholar]
- 17. Herz MAG, Kubaczka MG, Brzyzek G, Servi L, Krzyszton M, Simpson C, Brown J, Swiezewski S, Petrillo E, Kornblihtt AR (2019) Light regulates plant alternative splicing through the control of transcriptional elongation. Mol Cell 73: 1066 [DOI] [PubMed] [Google Scholar]
- 18. Sheridan RM, Fong N, D'Alessandro A, Bentley DL (2019) Widespread backtracking by RNA Pol II is a major effector of gene activation, 5′ pause release, termination, and transcription elongation rate. Mol Cell 73: 107–118.e4 [DOI] [PMC free article] [PubMed] [Google Scholar]
- 19. Cheung AC, Cramer P (2011) Structural basis of RNA polymerase II backtracking, arrest and reactivation. Nature 471: 249–253 [DOI] [PubMed] [Google Scholar]
- 20. Qiu CX, Erinne OC, Dave JM, Cui P, Jin HY, Muthukrishnan N, Tang LK, Babu SG, Lam KC, Vandeventer PJ et al (2016) High‐resolution phenotypic landscape of the RNA polymerase II trigger loop. PLoS Genet 12: e1006321 [DOI] [PMC free article] [PubMed] [Google Scholar]
- 21. Malik I, Qiu CX, Snavely T, Kaplan CD (2017) Wide‐ranging and unexpected consequences of altered Pol II catalytic activity in vivo . Nucleic Acids Res 45: 4431–4451 [DOI] [PMC free article] [PubMed] [Google Scholar]
- 22. Kireeva ML, Nedialkov YA, Cremona GH, Purtov YA, Lubkowska L, Malagon F, Burton ZF, Strathern JN, Kashlev M (2008) Transient reversal of RNA polymerase II active site closing controls fidelity of transcription elongation. Mol Cell 30: 557–566 [DOI] [PMC free article] [PubMed] [Google Scholar]
- 23. Malagon F, Kireeva ML, Shafer BK, Lubkowska L, Kashlev M, Strathern JN (2006) Mutations in the Saccharomyces cerevisiae RPB1 gene conferring hypersensitivity to 6‐azauracil. Genetics 172: 2201–2209 [DOI] [PMC free article] [PubMed] [Google Scholar]
- 24. Kaplan CD, Larsson KM, Kornberg RD (2008) The RNA polymerase II trigger loop functions in substrate selection and is directly targeted by alpha‐amanitin. Mol Cell 30: 547–556 [DOI] [PMC free article] [PubMed] [Google Scholar]
- 25. Mason PB, Struhl K (2005) Distinction and relationship between elongation rate and processivity of RNA polymerase II in vivo . Mol Cell 17: 831–840 [DOI] [PubMed] [Google Scholar]
- 26. Powell W, Reines D (1996) Mutations in the second largest subunit of RNA polymerase II cause 6‐azauracil sensitivity in yeast and increased transcriptional arrest in vitro . T J Biol Chem 271: 6866–6873 [DOI] [PMC free article] [PubMed] [Google Scholar]
- 27. Kaplan CD, Jin HY, Zhang IL, Belyanin A (2012) Dissection of Pol II trigger loop function and Pol II activity‐dependent control of start site selection in vivo . PLoS Genet 8: 172–188 [DOI] [PMC free article] [PubMed] [Google Scholar]
- 28. Corden JL (2013) RNA polymerase II C‐terminal domain: tethering transcription to transcript and template. Chem Rev 113: 8423–8455 [DOI] [PMC free article] [PubMed] [Google Scholar]
- 29. Soares LM, He PC, Chun Y, Suh H, Kim T, Buratowski S (2017) Determinants of histone H3K4 methylation patterns. Mol Cell 68: 773–785.e6 [DOI] [PMC free article] [PubMed] [Google Scholar]
- 30. Fong N, Saldi T, Sheridan RM, Cortazar MA, Bentley DL (2017) RNA Pol II dynamics modulate co‐transcriptional chromatin modification, CTD phosphorylation, and transcriptional direction. Mol Cell 66: 546–557.e3 [DOI] [PMC free article] [PubMed] [Google Scholar]
- 31. Wang D, Bushnell DA, Huang XH, Westover KD, Levitt M, Kornberg RD (2009) Structural basis of transcription: backtracked RNA polymerase II at 3.4 Angstrom resolution. Science 324: 1203–1206 [DOI] [PMC free article] [PubMed] [Google Scholar]
- 32. Da LT, Pardo‐Avila F, Xu L, Silva DA, Zhang L, Gao X, Wang D, Huang X (2016) Bridge helix bending promotes RNA polymerase II backtracking through a critical and conserved threonine residue. Nat Commun 7: 11244 [DOI] [PMC free article] [PubMed] [Google Scholar]
- 33. Onodera Y, Nakagawa K, Haag JR, Pikaard D, Mikami T, Ream T, Ito Y, Pikaard CS (2008) Sex‐biased lethality or transmission of defective transcription machinery in Arabidopsis . Genetics 180: 207–218 [DOI] [PMC free article] [PubMed] [Google Scholar]
- 34. Petersen M, Brodersen P, Naested H, Andreasson E, Lindhart U, Johansen B, Nielsen HB, Lacy M, Austin MJ, Parker JE et al (2000) Arabidopsis map kinase 4 negatively regulates systemic acquired resistance. Cell 103: 1111–1120 [DOI] [PubMed] [Google Scholar]
- 35. Braberg H, Jin H, Moehle EA, Chan YA, Wang S, Shales M, Benschop JJ, Morris JH, Qiu C, Hu F et al (2013) From structure to systems: high‐resolution, quantitative genetic analysis of RNA polymerase II. Cell 154: 775–788 [DOI] [PMC free article] [PubMed] [Google Scholar]
- 36. Cabart P, Jin H, Li L, Kaplan CD (2014) Activation and reactivation of the RNA polymerase II trigger loop for intrinsic RNA cleavage and catalysis. Transcription 5: e28869 [DOI] [PMC free article] [PubMed] [Google Scholar]
- 37. Hazelbaker DZ, Marquardt S, Wlotzka W, Buratowski S (2013) Kinetic competition between RNA polymerase II and Sen1‐dependent transcription termination. Mol Cell 49: 55–66 [DOI] [PMC free article] [PubMed] [Google Scholar]
- 38. Kindgren P, Ard R, Ivanov M, Marquardt S (2018) Transcriptional read‐through of the long non‐coding RNA SVALKA governs plant cold acclimation. Nat Commun 9: 4561 [DOI] [PMC free article] [PubMed] [Google Scholar]
- 39. Bomblies K, Lempe J, Epple P, Warthmann N, Lanz C, Dangl JL, Weigel D (2007) Autoimmune response as a mechanism for a Dobzhansky‐Muller‐type incompatibility syndrome in plants. PLoS Biol 5: 1962–1972 [DOI] [PMC free article] [PubMed] [Google Scholar]
- 40. Sano S, Aoyama M, Nakai K, Shimotani K, Yamasaki K, Sato MH, Tojo D, Suwastika IN, Nomura H, Shiina T (2014) Light‐dependent expression of flg22‐induced defense genes in Arabidopsis . Front Plant Sci 5: 531 [DOI] [PMC free article] [PubMed] [Google Scholar]
- 41. Zhang T, Zhang WL, Jiang JM (2015) Genome‐wide nucleosome occupancy and positioning and their impact on gene expression and evolution in plants. Plant Physiol 168: 1406–1416 [DOI] [PMC free article] [PubMed] [Google Scholar]
- 42. Nojima T, Rebelo K, Gomes T, Grosso AR, Proudfoot NJ, Carmo‐Fonseca M (2018) RNA polymerase II phosphorylated on CTD serine 5 interacts with the spliceosome during co‐transcriptional splicing. Mol Cell 72: 369–379e4 [DOI] [PMC free article] [PubMed] [Google Scholar]
- 43. Maslon MM, Braunschweig U, Aitken S, Mann AR, Kilanowski F, Hunter CJ, Blencowe BJ, Kornblihtt AR, Adams IR, Caceres JF (2019) A slow transcription rate causes embryonic lethality and perturbs kinetic coupling of neuronal genes. EMBO J 38: e101244 [DOI] [PMC free article] [PubMed] [Google Scholar]
- 44. Schmidt A, Schmid MW, Grossniklaus U (2015) Plant germline formation: common concepts and developmental flexibility in sexual and asexual reproduction. Development 142: 229–241 [DOI] [PubMed] [Google Scholar]
- 45. Gross‐Hardt R, Kagi C, Baumann N, Moore JM, Baskar R, Gagliano WB, Jurgens G, Grossniklaus U (2007) LACHESIS restricts gametic cell fate in the female gametophyte of Arabidopsis . PLoS Biol 5: e47 [DOI] [PMC free article] [PubMed] [Google Scholar]
- 46. Mayer A, Landry HM, Churchman LS (2017) Pause & go: from the discovery of RNA polymerase pausing to its functional implications. Curr Opin Cell Biol 46: 72–80 [DOI] [PMC free article] [PubMed] [Google Scholar]
- 47. Ehrensberger AH, Kelly GP, Svejstrup JQ (2013) Mechanistic interpretation of promoter‐proximal peaks and RNAPII density maps. Cell 154: 713–715 [DOI] [PubMed] [Google Scholar]
- 48. Uknes S, Mauch‐Mani B, Moyer M, Potter S, Williams S, Dincher S, Chandler D, Slusarenko A, Ward E, Ryals J (1992) Acquired resistance in Arabidopsis . Plant Cell 4: 645–656 [DOI] [PMC free article] [PubMed] [Google Scholar]
- 49. Vilborg A, Passarelli MC, Yario TA, Tycowski KT, Steitz JA (2015) Widespread inducible transcription downstream of human genes. Mol Cell 59: 449–461 [DOI] [PMC free article] [PubMed] [Google Scholar]
- 50. Nielsen M, Ard R, Leng X, Ivanov M, Kindgren P, Pelechano V, Marquardt S (2019) Transcription‐driven chromatin repression of intragenic transcription start sites. PLoS Genet 15: e1007969 [DOI] [PMC free article] [PubMed] [Google Scholar]
- 51. Proudfoot NJ (1986) Transcriptional interference and termination between duplicated alpha‐globin gene constructs suggests a novel mechanism for gene‐regulation. Nature 322: 562–565 [DOI] [PubMed] [Google Scholar]
- 52. Clough SJ, Bent AF (1998) Floral dip: a simplified method for Agrobacterium‐mediated transformation of Arabidopsis thaliana . Plant J 16: 735–743 [DOI] [PubMed] [Google Scholar]
- 53. Thodberg M, Thieffry A, Bornholdt J, Boyd M, Holmberg C, Azad A, Workman CT, Chen Y, Ekwall K, Nielsen O et al (2019) Comprehensive profiling of the fission yeast transcription start site activity during stress and media response. Nucleic Acids Res 47: 1671–1691 [DOI] [PMC free article] [PubMed] [Google Scholar]
- 54. Sherstnev A, Duc C, Cole C, Zacharaki V, Hornyik C, Ozsolak F, Milos PM, Barton GJ, Simpson GG (2012) Direct sequencing of Arabidopsis thaliana RNA reveals patterns of cleavage and polyadenylation. Nat Struct Mol Biol 19: 845–852 [DOI] [PMC free article] [PubMed] [Google Scholar]
- 55. Schurch NJ, Cole C, Sherstnev A, Song J, Duc C, Storey KG, McLean WH, Brown SJ, Simpson GG, Barton GJ (2014) Improved annotation of 3′ untranslated regions and complex loci by combination of strand‐specific direct RNA sequencing, RNA‐Seq and ESTs. PLoS ONE 9: e94270 [DOI] [PMC free article] [PubMed] [Google Scholar]
- 56. Zhang T, Marand AP, Jiang J (2016) PlantDHS: a database for DNase I hypersensitive sites in plants. Nucleic Acids Res 44: D1148–D1153 [DOI] [PMC free article] [PubMed] [Google Scholar]
- 57. Love MI, Huber W, Anders S (2014) Moderated estimation of fold change and dispersion for RNA‐seq data with DESeq2. Genome Biol 15: 550 [DOI] [PMC free article] [PubMed] [Google Scholar]
- 58. Anders S, Reyes A, Huber W (2012) Detecting differential usage of exons from RNA‐seq data. Genome Res 22: 2008–2017 [DOI] [PMC free article] [PubMed] [Google Scholar]
- 59. Trapnell C, Williams BA, Pertea G, Mortazavi A, Kwan G, van Baren MJ, Salzberg SL, Wold BJ, Pachter L (2010) Transcript assembly and quantification by RNA‐Seq reveals unannotated transcripts and isoform switching during cell differentiation. Nat Biotechnol 28: 511–515 [DOI] [PMC free article] [PubMed] [Google Scholar]
- 60. Zhang R, Calixto CPG, Marquez Y, Venhuizen P, Tzioutziou NA, Guo W, Spensley M, Entizne JC, Lewandowska D, Ten Have S et al (2017) A high quality Arabidopsis transcriptome for accurate transcript‐level analysis of alternative splicing. Nucleic Acids Res 45: 5061–5073 [DOI] [PMC free article] [PubMed] [Google Scholar]
- 61. Trincado JL, Entizne JC, Hysenaj G, Singh B, Skalic M, Elliott DJ, Eyras E (2018) SUPPA2: fast, accurate, and uncertainty‐aware differential splicing analysis across multiple conditions. Genome Biol 19: 40 [DOI] [PMC free article] [PubMed] [Google Scholar]
Associated Data
This section collects any data citations, data availability statements, or supplementary materials included in this article.
Supplementary Materials
Expanded View Figures PDF
Table EV1
Table EV2
Source Data for Expanded View
Review Process File
Source Data for Figure 1
Source Data for Figure 2
Source Data for Figure 4
Data Availability Statement
The raw and processed plaNET‐seq and RNA‐seq data were deposited in Gene Expression Omnibus (https://www.ncbi.nlm.nih.gov/geo/) under accession number GSE133143.