Abstract
N6‐methyladenosine (m6A) mRNA methylation has emerged as an important player in many biological processes by regulating gene expression. However, its roles in intestinal stem cell (ISC) homeostasis remain largely unknown. Here, we report that YTHDF1, an m6A reader, is highly expressed in ISCs and its expression is upregulated by Wnt signaling at the translational level. Whereas YTHDF1 is dispensable for normal intestinal development in mice, genetic ablation of Ythdf1 dramatically blocks Wnt‐driven regeneration and tumorigenesis with reduced ISC stemness. Mechanistically, YTHDF1 facilitates the translation of Wnt signaling effectors including TCF7L2/TCF4, while this process is enhanced during Wnt activation to augment β‐catenin activity. Targeting YTHDF1 in ISCs of established tumors leads to tumor shrinkage and prolonged survival. Collectively, our studies unveil YTHDF1 as an amplifier of Wnt/β‐catenin signaling at the translational level, which is required for the maintenance of ISCs during regeneration and tumorigenesis.
Keywords: intestinal stem cell, m6A, tumorigenesis, Wnt signaling, YTHDF1
Subject Categories: Cancer, Signal Transduction, Protein Biosynthesis & Quality Control
YTHDF1, an m6A reader, is dispensable for normal intestinal development but required for Wnt‐driven regeneration and tumorigenesis. YTHDF1 facilitates the translation of Wnt signaling effectors to regulate intestinal stem cell activity.

Introduction
The intestinal epithelium harbors remarkable self‐renewal capacity driven by the intestinal stem cells (ISCs) at the intestinal crypts 1. The canonical Wnt/β‐catenin (CTNNB1) signaling pathway is one of the key regulators of intestinal stemness, which is responsible for the control of intestinal homeostasis, regeneration, and tumorigenesis 2. Under physiological condition, Wnt activity is tightly regulated to form a gradient in the intestinal crypt, which is essential for the undifferentiated state of ISCs and epithelium homeostasis 2. In response to intestine damage, this signaling is activated to drive tissue regeneration 3. The aberrant activation of Wnt/β‐catenin signaling, frequently observed in colorectal cancer (CRC) patient samples, leads to the development of CRC 4, 5. As the central signal transducer of Wnt pathway, β‐catenin protein is tightly regulated. In the absence of a Wnt signal, the cytosolic levels of β‐catenin are kept low by the destruction complex including axin, adenomatous polyposis coli (APC), and glycogen synthase kinase 3β (GSK3β). Wnt activation disrupts this complex, resulting in the translocation of β‐catenin to the nucleus, where it associates with the T‐cell factor/lymphoid enhancer factor (TCF/LEF) family of transcription factors to activate transcription of downstream target genes 2. Although stabilization and localization of β‐catenin contribute to its activation, other layers of Wnt/β‐catenin signaling regulation remain to be characterized.
Recent studies point to a role of the mRNA methylation in the regulation of gene expression. In eukaryotic cells, one abundant and conserved mRNA modification is adenosine methylation at the nitrogen‐6 position, N6‐methyladenosine (m6A). The biological effects of m6A methylation are mediated by “writer”, “eraser”, and “reader” proteins. The RNA methyltransferase complex, mainly consisting of METTL3, METTL14, and WTAP, catalyzes the m6A methylation of mRNA 6, 7, 8. FTO and ALKBH5 have been identified to mediate the reversible removal of this methylation 9, 10. In addition, the YTH domain family proteins serve as the major m6A‐binding proteins to regulate RNA metabolism, including mRNA splicing, degradation, and translation 11, 12, 13, 14. Through regulating gene expression, m6A methylation plays important roles in a diverse array of biological processes 15.
m6A mRNA methylation is emerging as a crucial modulator in regulating the pluripotency of stem cells, while the overall impact of this modification in stem cell biology is complex. For instance, knockout of Mettl3 impairs the differentiation of mouse embryonic stem cells (ESCs) as well as hematopoietic stem cells (HSCs), indicating that m6A promotes stem cell differentiation 16, 17, 18. However, m6A modification was also reported to be required for the pluripotency maintenance of human ESCs and HSCs 19, 20. These inconsistent results could be attributed to the cell‐type‐specific expression of the “writers”, “erasers”, and “readers”. Moreover, the effects of m6A reader proteins are pleiotropic as YTHDF1 promotes the translation whereas YTHDF2 facilitates the degradation of methylated mRNAs, making the outcome more complicated 11, 12, 13, 14. To date, the roles of various m6A reader proteins in the maintenance of stem cell features remain largely unexplored.
In this study, we systematically investigated the function of YTHDF1 in the gut. Our results indicated that YTHDF1 plays an indispensable role in the activation of β‐catenin to sustain ISC characteristics during regeneration and tumorigenesis.
Results
Wnt signaling promotes YTHDF1 expression at the translational level
m6A‐dependent gene expression regulation plays critical roles in a variety of biological processes 15. To investigate the possible function of m6A modification in Wnt‐regulated intestinal homeostasis, we activated Wnt signaling in mouse intestinal crypt and examined the expression of m6A machinery. Wnt3a treatment slightly increased METTL3 expression, implying the involvement of m6A in Wnt signaling. Focusing on m6A reader proteins, we found that YTHDF1 protein level was dramatically induced by Wnt3a (Fig 1A). Ythdf1 mRNA level was not affected by Wnt3a stimulation (Fig EV1A). Polysome profiling revealed that Ythdf1 mRNA distribution in polysome fractions dramatically increased after Wnt3a treatment (Fig 1B), indicating the activated translation. Inactivating mutations in APC causes constitutive activation of β‐catenin. To examine the regulation of YTHDF1 expression by APC mutation, we re‐introduced wild‐type full‐length APC using the lentivirus system in SW620 human CRC cells, which express a non‐functional truncated APC protein 4. Overexpression of APC caused a significant reduction in YTHDF1 protein without affecting its mRNA level (Figs 1C and EV1B). YTHDF1 protein was relatively stable even after 12 h of translation inhibition with cycloheximide (CHX), excluding the possibility of protein degradation (Fig EV1C). Polysome profiling confirmed that APC perturbation mainly affected YTHDF1 mRNA translation (Fig 1D). The 5′ untranslated regions (5′UTRs) play essential roles in mRNA translation 21. Luciferase assay demonstrated that APC expression in SW620 cells dramatically decreased the translation mediated by the 5′UTR of YTHDF1 mRNA (Fig 1E). To test whether YTHDF1 was regulated by β‐catenin, we silenced β‐catenin expression in SW620 cells using siRNAs and detected no obvious change in YTHDF1 expression (Fig EV1D and E). Reciprocally, expression of a non‐degradable β‐catenin mutant (N90) into RKO cells, whose APC/β‐catenin pathway is intact, did not affect YTHDF1 expression (Fig EV1F and G), indicating that YTHDF1 is not regulated by β‐catenin. Collectively, our data demonstrated that Wnt ligand treatment or APC mutation but not β‐catenin promotes YTHDF1 expression.
Figure 1. Wnt signaling promotes YTHDF1 expression at the translational level.
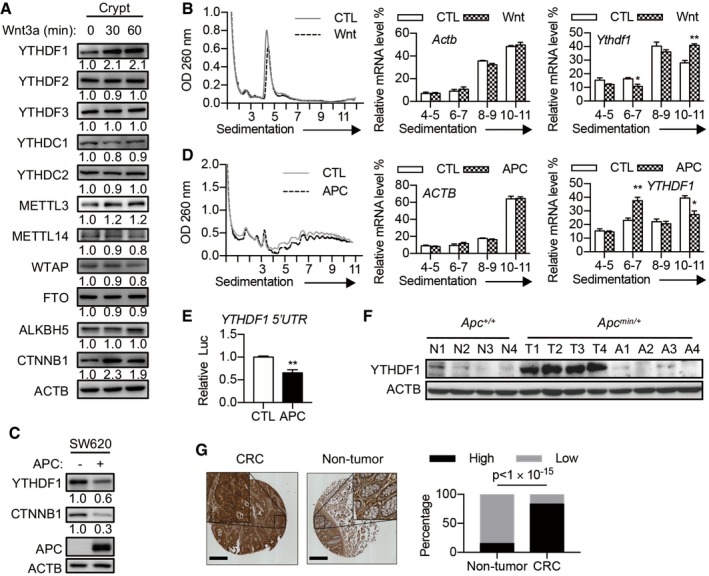
- Immunoblot analysis of mouse intestinal crypts treated with Wnt3a (60 ng/ml) for indicated time. The relative protein level was quantified and shown under each band.
- Polysome profiles of mouse intestinal crypt treated with or without Wnt3a for 30 min. The right panels show the distributions of Ythdf1 and Actb in polysome fractions. Data are represented as mean ± SEM. *P < 0.05, **P < 0.01 (3 biological replicates, t‐test).
- Immunoblot analysis of SW620 cells with or without APC overexpression. The relative protein level was quantified and shown under each band.
- Polysome profiles of SW620 cells with or without APC overexpression. The right panels show the distributions of YTHDF1 and ACTB in polysome fractions. Data are represented as mean ± SEM. *P < 0.05, **P < 0.01 (3 biological replicates, t‐test).
- Dual‐Luciferase Assay with a construct bearing the 5′UTR of YTHDF1 in SW620 cells with or without APC overexpression. Data are represented as mean ± SEM. *P < 0.05, **P < 0.01 (3 biological replicates, t‐test).
- YTHDF1 protein expression in intestinal tissue from 4 pairs of Apc +/+ and Apc min/+ mice. N, normal tissue. T, tumor tissue. A, tumor‐adjacent tissue.
- YTHDF1 staining in matched samples of human CRC tissue and adjacent non‐tumor tissue. Scale bar, 450 μm. The right panel shows the statistics of IHC scores. Chi‐square test; n = 75 for each group.
Source data are available online for this figure.
Figure EV1. Wnt signaling promotes YTHDF1 expression.
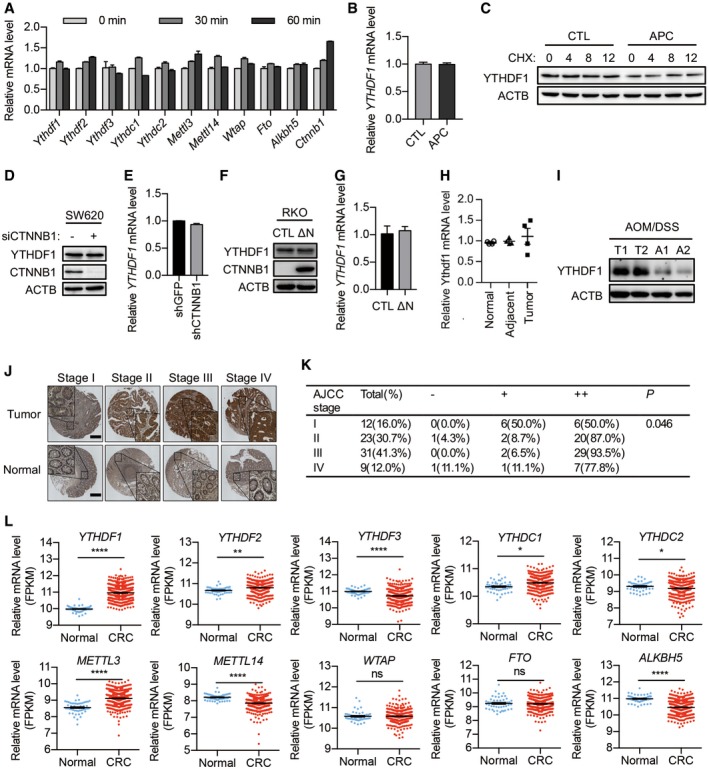
- RT–qPCR analysis of mouse intestinal crypt treated with Wnt3a (60 ng/ml) for the indicated time. Data are represented as mean ± SEM. Three biological replicates.
- RT–qPCR analysis of SW620 cells with or without APC overexpression. Data are represented as mean ± SEM. Three biological replicates.
- Immunoblot analysis of SW620 cells with or without APC overexpression treated with CHX for the indicated time.
- Immunoblot analysis of SW620 cells with or without β‐catenin (CTNNB1) knockdown.
- RT–qPCR analysis of SW620 cells with or without β‐catenin (CTNNB1) knockdown. Data are represented as mean ± SEM. Three biological replicates.
- Immunoblot analysis of RKO cells expressing a non‐degradable β‐catenin mutant (N90).
- RT–qPCR analysis of RKO cells expressing a non‐degradable β‐catenin mutant (N90). Data are represented as mean ± SEM. Three biological replicates.
- Ythdf1 mRNA expression in intestinal tissue from 4 pairs of Apc +/+ (Normal), Apc min/+ tumor (Tumor), and Apc min/+ tumor‐adjacent tissues (Adjacent). Data are represented as mean ± SEM. Three biological replicates.
- YTHDF1 protein expression in intestinal tissue from 2 pairs of AOM/DSS‐treated mice. T: tumor tissue; A: adjacent non‐tumor tissue.
- YTHDF1 staining in matched samples of human CRC tissue at different stages and adjacent non‐tumor tissues. Scale bar, 450 μm.
- IHC scoring and analysis of YTHDF1 expression in (J). Chi‐square was used for analysis.
- Analysis of mRNA level of m6A‐related genes from The Cancer Genome Atlas (TCGA) datasets. *P < 0.05, **P < 0.01, ***P < 0.001, ****P < 0.0001 (t‐test).
Source data are available online for this figure.
Since mutations in APC are frequently observed in CRC 5, 22, we examined whether YTHDF1 expression was altered in mouse and human intestinal tumors. We found that YTHDF1 protein was weakly expressed in the mouse intestinal tissue while sharply upregulated following Apc mutation (Apc min/+). High YTHDF1 expression was maintained in intestinal adenomas from the Apc min/+ mice but not in adjacent non‐tumor tissue (Figs 1F and EV1H). Immunohistochemical staining revealed that YTHDF1 protein level is ubiquitously higher in CRC tissues than that in adjacent non‐tumor tissues (Figs 1G and EV1J and K). TCGA datasets revealed upregulation of YTHDF1 expression in CRC (Fig EV1L). These results suggested that an increase in YTHDF1 might play an oncogenic role in intestinal tumorigenesis.
YTHDF1 is required for intestinal epithelial regeneration
In order to assess the function of intestinal epithelial YTHDF1, we generated a Ythdf1 conditional knockout mouse strain under the villin promoter (Villin Cre/+:Ythdf1 fl/fl, termed as Ythdf1 cKO) by targeting exon 4 (Fig EV2A–C). To determine the in vivo implications of YTHDF1 in normal intestinal homeostasis, intestinal architecture and body weight were evaluated in wild‐type (Ythdf1 CTL) and Ythdf1 cKO mice at 8 weeks of age. The ablation of Ythdf1 in intestinal epithelium did not affect body mass (Fig EV2D), crypt–villus architecture, and epithelial cell proliferation (Figs 2A and EV2E–H). Alkaline phosphatase staining (enterocytes) and Alcian blue staining (goblet cells) did not show significant difference between Ythdf1 CTL and Ythdf1 cKO intestine (Fig EV2I). Thus, YTHDF1 is largely dispensable for intestinal homeostasis under physiological condition.
Figure EV2. YTHDF1 is dispensable for intestinal development.
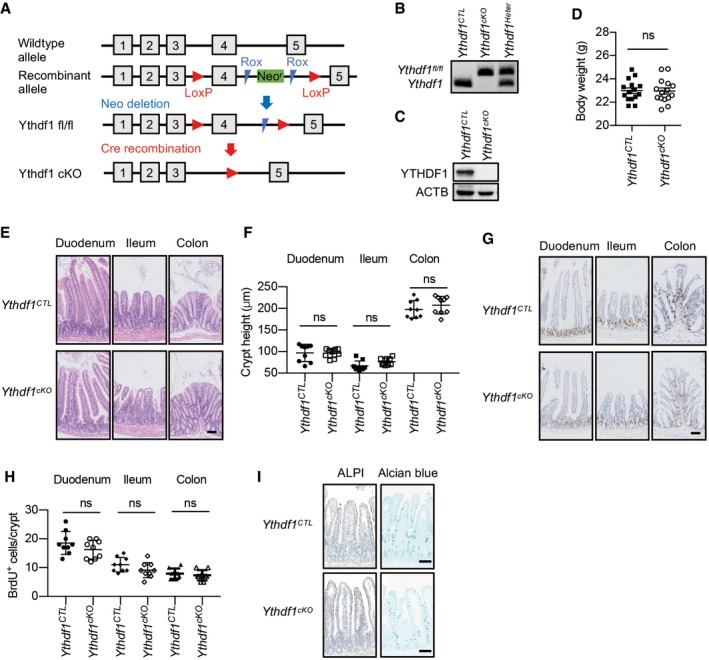
- Generation of Ythdf1 conditional knockout (Ythdf1 cKO) mouse.
- Genotyping of wild‐type (Ythdf1 CTL), heterogeneous (Ythdf1 Heter), and Ythdf1 cKO mice.
- Immunoblot analysis of intestinal epithelia from Ythdf1 CTL and Ythdf1 cKO mice.
- Bodyweight of Ythdf1 CTL and Ythdf1 cKO mice at the age of 2 months. Data are represented as mean ± SEM. (15 mice for each group, t‐test)
- H&E staining of duodenum, ileum, and colon from wild‐type (Ythdf1 CTL) and Ythdf1 cKO mice.
- The quantification of crypt height in (E). Scale bar, 50 μm. Data are represented as mean ± SEM. (9 mice for each group, t‐test)
- BrdU staining of duodenum, ileum, and colon from wild‐type (Ythdf1 CTL) and Ythdf1 cKO mice.
- The quantification of BrdU+ cells per crypt in (G). Scale bar, 50 μm. Data are represented as mean ± SEM. (9 mice for each group, t‐test)
- Alkaline phosphatase staining (ALPI) and Alcian blue staining (Alcian blue) of small intestine from wild‐type (Ythdf1 CTL) and Ythdf1 cKO mice. Scale bar, 50 μm.
Source data are available online for this figure.
Figure 2. YTHDF1 is required for efficient intestinal regeneration.
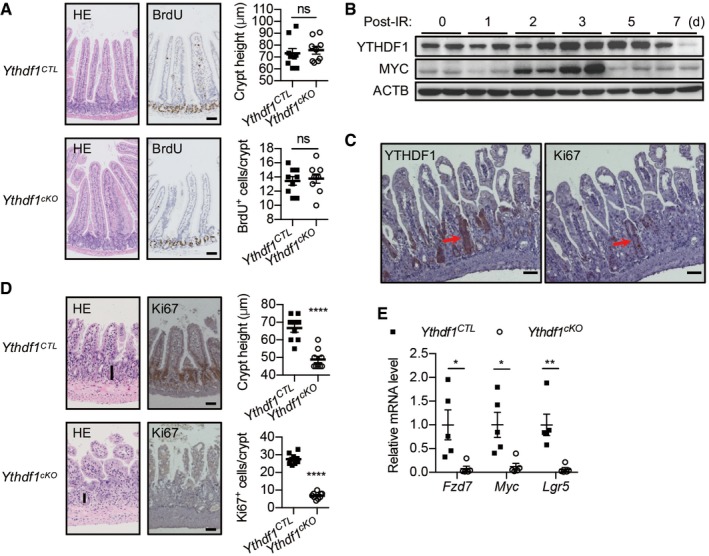
- The representative jejunum from wild‐type (Ythdf1 CTL) and Ythdf1 cKO mice. Left: hematoxylin and eosin staining (H&E); middle: BrdU staining; right: quantification of crypt height and BrdU+ cells. Scale bar, 50 μm. Data are represented as mean ± SEM. (9 biological replicates, t‐test).
- Immunoblot analysis of small intestines from Ythdf1 CTL and Ythdf1 cKO mice after 12 Gy IR.
- YTHDF1 (left) and Ki67 (right) staining of small intestine from wild‐type mice 72 h after 12 Gy IR. Scale bar, 50 μm. Red arrows indicate the proliferating cells.
- Small intestines from Ythdf1 CTL and Ythdf1 cKO mice 72 h after 12 Gy IR. Left: H&E staining; middle: Ki67 staining; right: quantification of crypt height and Ki67+ cells. Scale bar, 50 μm. Vertical bars indicate the length of the crypts. Data are represented as mean ± SEM. ****P < 0.0001 (9 biological replicates, t‐test).
- RT–qPCR analysis of small intestines from Ythdf1 CTL and Ythdf1 cKO mice 72 h after 12 Gy IR. Data are represented as mean ± SEM. *P < 0.05, **P < 0.01 (5 biological replicates, t‐test).
Source data are available online for this figure.
The ability of the intestinal epithelium to regenerate after challenge is a Wnt‐driven process that mimics the proliferation observed after Apc deletion 22, 23. We, therefore, examined YTHDF1 expression in response to intestinal injury. Mice were exposed to 12 Gy whole‐body γ‐irradiation (IR), and then, YTHDF1 expression was examined at various time points during the recovery phase. YTHDF1 protein level was markedly upregulated 3 days post‐IR during which regenerative proliferation from the radio‐resistant ISCs initiated, and then returned to baseline levels within 1 week (Fig 2B). The expression pattern of YTHDF1 was much similar to c‐Myc, a proliferation marker (Fig 2B). Immunohistochemistry revealed that YTHDF1‐expressing cells were located in the regenerative foci known to exhibit high Ki67 expression (Fig 2C). Together, these data suggested the induction of YTHDF1 during regeneration.
Given the dynamic changes of YTHDF1 expression in response to irradiation, we considered that YTHDF1 may play a role during intestinal regeneration. In Ythdf1 CTL mice, small intestine regeneration was characterized by a rapid renewal of intestinal crypts, which could be seen 72 h following 12 Gy whole‐body IR (Fig 2D). By comparison, Ythdf1 cKO mice showed a clear defect in recovery capability which was highlighted by a significant reduction in both the amount and size of regenerating crypts (Fig 2D). Moreover, a remarkably reduced amount of Ki67‐positive cells was manifested within the Ythdf1 cKO intestinal crypts (Fig 2D). Knockout of Ythdf1 significantly reduced the expression of Wnt target genes including Lgr5, Fzd7, and Myc (Fig 2E) 24, 25. Taken together, these data suggested that YTHDF1 within the intestinal epithelium is critical for Wnt‐driven intestinal regeneration.
Ythdf1 deletion reduces Wnt‐driven tumorigenesis in vivo
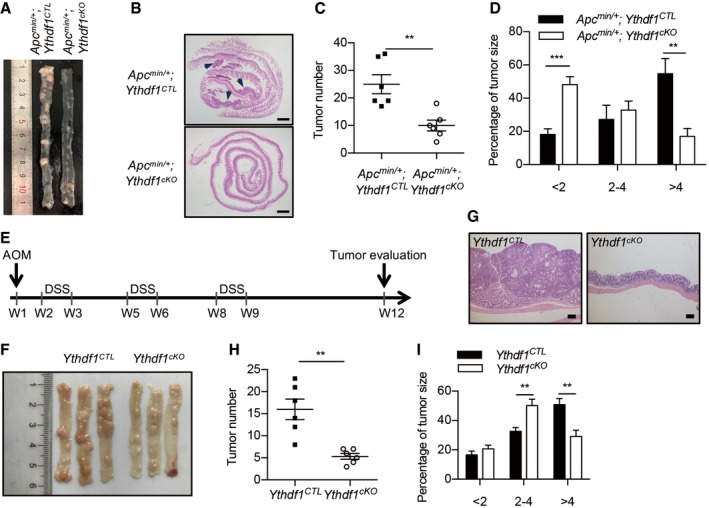
Given that YTHDF1 was upregulated in intestinal tumors, we examined the function of YTHDF1 in Wnt‐driven tumorigenesis using the Apc min/+ mouse model. Deficiency of YTHDF1 dramatically reduced intestinal tumor formation (Fig 3A). Both tumor number and tumor load were significantly diminished in Ythdf1‐deleted mice (Fig 3B and C). Furthermore, analysis of tumor‐size distribution showed that most of the tumors in Ythdf1‐deleted mice were smaller in size (Fig 3D).
Figure 3. Ythdf1 deletion reduces Wnt‐driven tumorigenesis in vivo .
-
ASmall intestines from 24‐week‐old Apc min/+ ; Ythdf1 CTL and Apc min/+ ; Ythdf1 cKO mice.
-
BH&E staining of small intestines from 24‐week‐old Apc min/+ ; Ythdf1 CTL and Apc min/+ ; Ythdf1 cKO mice. Scale bar, 1 mm. The black arrows indicate the tumors.
-
C, DTumor number (C) and size distribution (D) from the small intestines of 24‐week‐old Apc min/+ ; Ythdf1 CTL and Apc min/+ ; Ythdf1 cKO mice. Data are shown as mean ± SEM (6 mice for each group). **P < 0.01, ***P < 0.001 (t‐test).
-
EWorkflow of the AOM/DSS‐induced colitis‐associated cancer model.
-
FColons from Ythdf1 CTL and Ythdf1 cKO mice on day 84 of AOM/DSS induction.
-
GH&E staining of colons from Apc min/+ ; Ythdf1 CTL and Apc min/+ ; Ythdf1 cKO mice after AOM/DSS induction. Scale bar, 200 μm.
-
H, IColon tumor number (H) and size distribution (I) from Ythdf1 CTL and Ythdf1 cKO mice on day 84 of induction. Data are shown as mean ± SEM (6 mice for each group). **P < 0.01 (t‐test).
To further confirm the results in Apc min/+ mouse model, we employed another CRC model induced by azoxymethane (AOM)/dextran sulfate sodium (DSS) (Fig 3E). In this model, mice develop CRC as the result of mutations in several genes including β‐catenin pathways 26. In AOM/DSS‐induced tumor, YTHDF1 expression is upregulated (Fig EV1I). Similar to the Apc min/+ model, decreased tumor number, tumor load, and size were observed in Ythdf1 cKO mice compared to the wild‐type group (Fig 3F–I). These data highlighted the necessity of YTHDF1 in Wnt‐driven intestinal tumor development.
YTHDF1 is required for maintenance of mouse intestinal stem cells
To start exploring the mechanism of YTHDF1‐promoted intestinal tumorigenesis, we examined the YTHDF1 expression pattern in the intestine. In situ hybridization revealed that Ythdf1 mRNA was predominantly localized in crypts, where the ISCs reside (Fig 4A). Consistently, fractionating primary intestinal tissue into villus‐enriched and crypt‐enriched populations also revealed gradient expression of YTHDF1 from intestinal stem cell localized crypts to the differentiated villi (Fig 4B). Lineage tracing has identified the Wnt target gene leucine‐rich repeat‐containing G protein‐coupled receptor 5 (LGR5) as an ISC marker 27. Taken advantage of the Lgr5‐EGFP‐IRES‐creERT2 mouse, we examined the expression of YTHDF1 in epithelial cells with various degrees of stemness. The YTHDF1 expression level was high in the Lgr5‐GFPhigh stem cells, intermediate in the Lgr5‐GFPlow transit‐amplifying cell population, and low in the Lgr5‐GFPneg population (Fig 4C).
Figure 4. YTHDF1 is required for maintenance of intestinal stem cells.
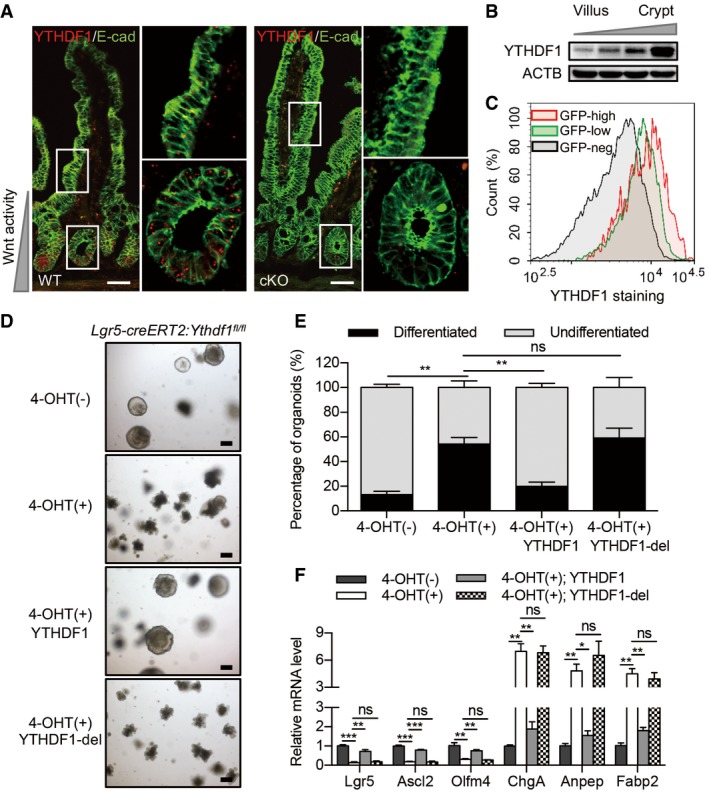
- Fluorescent in situ hybridization for Ythdf1 mRNA in Ythdf1 CTL and Ythdf1 cKO small intestines. Scale bar, 50 μm.
- Immunoblot analysis of fractionated murine intestine enriched for villus cells and crypt cells.
- Flow cytometry analysis of YTHDF1 protein expression in GFPhigh/low/neg populations from Lgr5‐GFP‐IRES‐creERT2 mice.
- Morphology of organoids from Lgr5‐creERT2:Ythdf1 fl/fl mice in Wnt3a‐conditioned medium without or with 4‐OHT induction and infected with lentivirus expressing YTHDF1 or YTHDF1 mutant. Scale bar, 250 μm.
- Quantification of differentiated versus undifferentiated organoids from (D). Data are represented as mean ± SEM. **P < 0.01 (4 biological replicates, t‐test).
- Relative mRNA levels of intestinal stem cell and differentiation marker genes in organoids described in (D). Data are represented as mean ± SEM. 4 biological replicates. *P < 0.05, **P < 0.01, ***P < 0.001 (t‐test).
Source data are available online for this figure.
Given the high expression of YTHDF1 in ISCs, we asked whether Ythdf1 deletion‐induced intestinal defects are related to the dysfunction of ISCs. To this end, we deleted Ythdf1 in Lgr5+ ISCs using tamoxifen‐inducible Lgr5‐creERT (Lgr5‐creERT2:Ythdf1 fl/fl) and performed organoid culture. Ythdf1‐deficient organoids grew comparably to the control organoids but only with less budding (Fig EV3A and B). Next, we cultured organoids with Wnt3a‐conditioned medium. Wnt‐treated organoids formed fast‐growing “spheroids” displaying a cyst‐like morphology lacking the budding crypts (Fig 4D and E). Surprisingly, Ythdf1 deletion induced extensive budding by day 5, implying the loss of stemness (Fig 4D and E). Consistently, Ythdf1 deletion in ISCs dramatically reduced the expression of stem cell markers Lgr5, Ascl2, and Olfm4, while increased the expression of differentiation markers ChgA, Anpep, and Fabp2 (Fig 4F).
Figure EV3. The role of m6A in the maintenance of intestinal stemness.
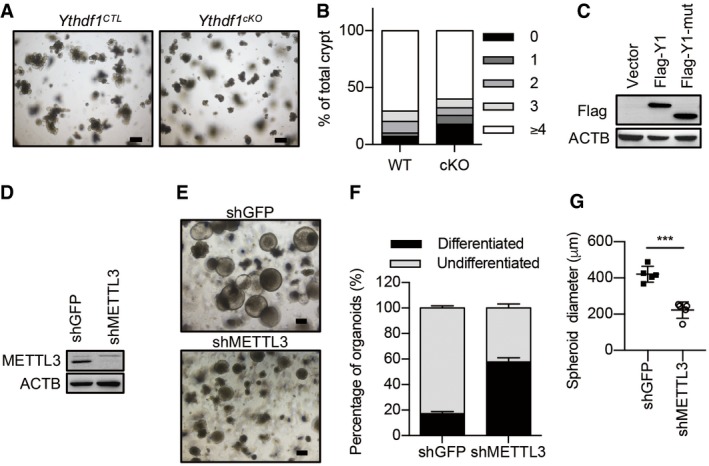
- Morphology of organoids from wild‐type (Ythdf1 CTL) and Ythdf1 cKO mice at day 6. Scale bar, 250 μm.
- Quantification of percentage of organoid budding in (A) (3 independent replicates).
- Immunoblot analysis of organoids infected with lentivirus expression Flag‐tagged YTHDF1 (Flag‐Y1) and YTH domain‐deleted mutant (Flag‐Y1‐mut).
- Immunoblot analysis of organoids with or without METTL3 knockdown.
- Morphology of organoids in Wnt3a‐conditioned medium with or without METTL3 knockdown. Scale bar, 200 μm.
- Quantification of differentiated versus undifferentiated organoids from (E). Data are represented as mean ± SEM. Three biological replicates.
- Spheroid diameter analysis from (E). Data are represented as mean ± SEM. ***P < 0.001 (3 biological replicates, t‐test).
Source data are available online for this figure.
To confirm that the observed defects resulted from loss of YTHDF1, we performed rescue experiments. We delivered lentivirus expressing either YTHDF1, YTH domain‐deleted mutant, or a control vector (Fig EV3C). Re‐expression of YTHDF1 in Ythdf1‐deleted organoids substantially enhanced the spheroid features and restored the expressions of stem cell markers. However, the YTH domain‐deleted YTHDF1 mutant could not rescue the phenotypes by Ythdf1 deletion (Fig 4D–F). To substantiate the role of m6A in the maintenance of stemness, METTL3 was silenced. Knockdown of METTL3 dramatically inhibited the growth of organoids and induced differentiation of organoids under Wnt3a treatment (Fig EV3D–G).
Transcriptome‐wide identification of YTHDF1‐regulated mRNAs
To identify potential targets regulated by YTHDF1, we performed antibody‐based m6A profiling and RNA sequencing (m6A‐seq) as well as RNA immunoprecipitation and sequencing (RIP‐seq) in colorectal cancer cell line HCT116, harboring a constitutively activating mutation of β‐catenin. m6A‐seq revealed the expected distribution of m6A within the transcriptome and enrichment around the stop codon within transcripts (Fig EV4A). The analysis yielded 17,707 m6A peaks within 8,076 transcripts (Fig EV4B and C, Dataset EV1). By combining with the RIP‐seq data, we identified 3,388 m6A‐containing transcripts that are bound by YTHDF1 (referred to YTHDF1 targets, Fig EV4C and Dataset EV2). Given that YTHDF1 is known to affect mRNA translation 12, we assessed the changes in translational efficiency by ribosome profiling (Ribo‐seq) after YTHDF1 knockdown using two shRNAs 12, 28 (Fig EV4D and E, Dataset EV3). Data revealed 1015 decreased mRNAs and 387 increased mRNAs in translational efficiency after YTHDF1 knockdown, with slight changes in transcription (Fig 5A). As expected, we observed an elevated m6A methylation level in the translational downregulated genes after YTHDF1 knockdown (Fig 5B). Reciprocally, we analyzed the translational changes based on m6A modification. Data revealed a notable decrease in translational efficiency for m6A‐marked transcripts as well as YTHDF1 targets in YTHDF1 knockdown cells compared with control cells (Figs 5C and D, and EV4F and G).
Figure EV4. Analysis of YTHDF1‐regulated mRNA translation.
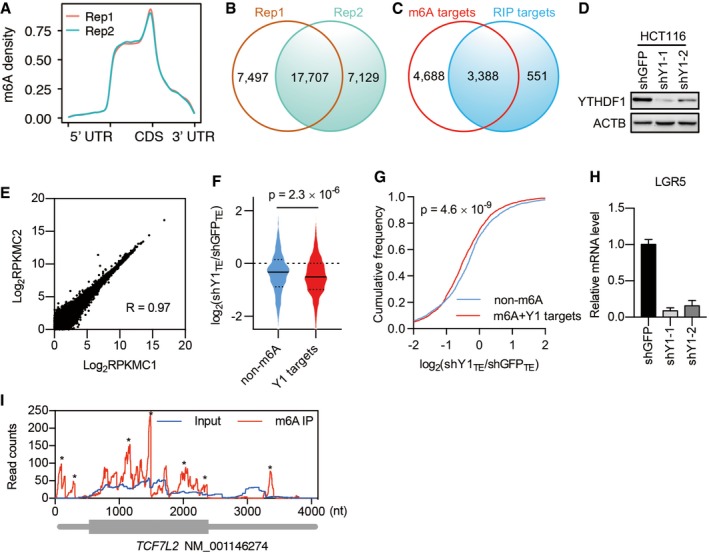
- Metagene plot of m6A peak distribution from two biological replicates.
- m6A peaks identified from two biological replicates.
- Overlap of m6A‐containing transcripts (m6A targets) with YTHDF1‐binding transcripts (RIP targets).
- YTHDF1 knockdown efficiency in HCT116 cells.
- Correlation of ribosome density between two control biological replicates.
- Violin plots showing translational efficiency (TE) change after YTHDF1 knockdown for non‐methylated (non‐m6A) transcripts and YTHDF1 targets. The upper and lower quartiles and the median are indicated for each group. Mann–Whitney test.
- Cumulative distributions of TE change after YTHDF1 knockdown for non‐m6A transcripts and YTHDF1 targets as in (E). Kolmogorov–Smirnov test.
- RT–qPCR analysis of LGR5 expression in HCT116 cells after YTHDF1 knockdown. Data are represented as mean ± SEM. 3 biological replicates.
- m6A peak distribution within TCF7L2 transcript. * indicates the predicted m6A peak.
Source data are available online for this figure.
Figure 5. Transcriptome‐wide identification of YTHDF1‐regulated mRNAs.
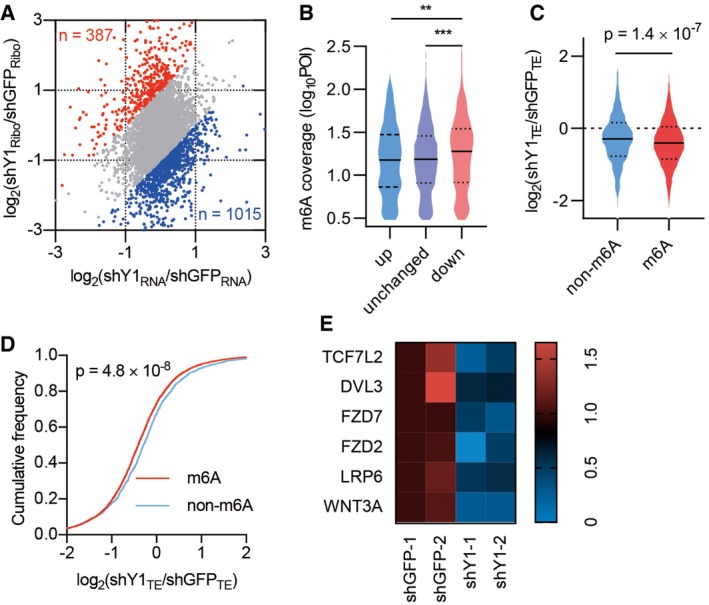
- Scatterplot of mRNA expression and ribosome profiling data from control and YTHDF1 knockdown cells. The upregulated (red) and downregulated (blue) genes in translational efficiency (TE) are highlighted.
- The relative m6A peak coverage in control cells for transcripts grouped according to TE changes after YTHDF1 knockdown. POI: peak over input. Down, genes significantly downregulated in YTHDF1 knockdown cells (< 0.5 fold). Unchanged, genes not significantly changed. Up, genes significantly upregulated (> 2 fold). The upper and lower quartiles and the median are shown for each group. Mann–Whitney test. **P < 0.01. ***P < 0.001.
- Violin plots showing TE change between control and YTHDF1 knockdown cells for non‐methylated (non‐m6A) and methylated (m6A) transcripts. The upper and lower quartiles and the median are indicated for each group. Mann–Whitney test.
- Cumulative distributions of TE change for non‐m6A and m6A transcripts as in (C). Kolmogorov–Smirnov test.
- Heatmap showing the TE of Wnt signaling components in control and YTHDF1 knockdown cells. The values show the fold change of the indicated color of the heatmap.
To identify the functional pathways that are associated with YTHDF1‐targeted mRNAs, we analyzed YTHDF1 targets that are translationally downregulated after YTHDF1 knockdown. Kyoto Encyclopedia of Genes and Genomes (KEGG) pathway enrichment analysis showed that the top enriched pathway was associated with the pluripotency of stem cells (Table EV1). Intriguingly, a subset of transcripts in this group were Wnt/β‐catenin signaling components (Fig 5E and Table EV1), suggesting that Wnt signaling components are the main YTHDF1 targets during Wnt hyperactivation. qPCR analysis revealed that LGR5 expression was dramatically reduced in YTHDF1‐silenced HCT116 cells (Fig EV4H). As LGR5 is a direct target of β‐catenin 24, our data indicated the reduced β‐catenin activity after YTHDF1 knockdown.
TCF7L2/TCF4 is a key functional target of YTHDF1
Focusing on the potential candidates implicated in Wnt signaling, we noticed that T‐cell factor 7‐like 2/T‐cell factor 4 (TCF7L2/TCF4) was listed as the top candidate, showing reduced translation upon YTHDF1 deletion (Figs 5E and EV4I). TCF7L2 belongs to the LEF/TCF family, which are the key nuclear effectors of the canonical β‐catenin transcription. YTHDF1 knockdown in HCT116 cells dramatically reduced the protein level but not the mRNA level of TCF7L2 (Figs 6A and EV5A). Polysome profiling revealed reduced translation of TCF7L2 in YTHDF1‐silencing cells (Fig 6B). In addition, inhibited expression of TCF7L2 was also observed in the Ythdf1‐depleted crypt (Figs 6C and EV5B). Next, we investigated the regulation of TCF7L2 by YTHDF1 through m6A in the 3′UTR using luciferase assay. Erasing m6A by silencing METTL3 decreased luciferase activity, suggesting the involvement of m6A in TCF7L2 3′UTR translation (Fig EV5C). YTHDF1 knockdown decreased luciferase activity, suggesting that YTHDF1 mediates the translation of TCF7L2 3′UTR (Fig EV5D). Collectively, these results indicated that the translation of TCF7L2 is directly regulated by YTHDF1.
Figure 6. TCF7L2 is a key functional target of YTHDF1.
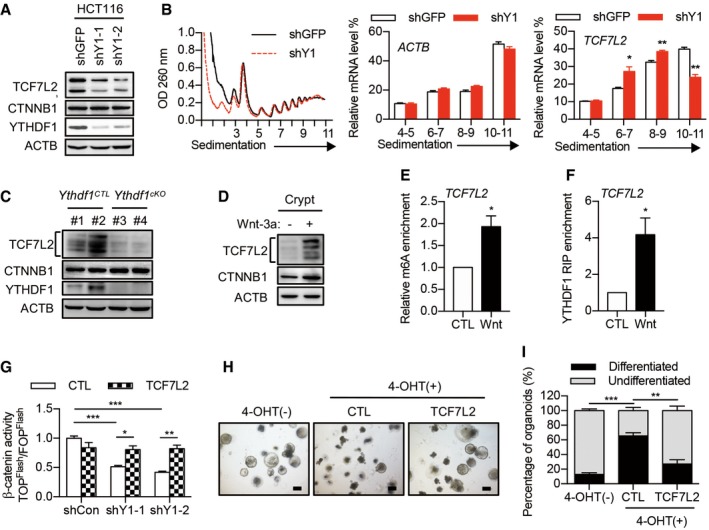
- Immunoblot analysis of HCT116 cells with YTHDF1 knockdown. Two major bands were detected for human TCF7L2 due to alternative splicing.
- Polysome profiles of HCT116 cells with or without YTHDF1 knockdown. The right panels show the distributions of TCF7L2 and ACTB in polysome fractions. Data are represented as mean ± SEM. *P < 0.05, **P < 0.01 (3 biological replicates, t‐test).
- Immunoblot analysis of crypts from Ythdf1 CTL and Ythdf1 cKO mice. Multiple bands were detected for mouse TCF7L2 representing different isoforms.
- Immunoblot analysis of mouse intestinal crypts treated with Wnt3a for 60 min.
- MeRIP‐qPCR analysis of m6A levels of TCF7L2 in crypts treated with or without Wnt3a. Data are represented as mean ± SEM. *P < 0.05 (3 biological replicates, t‐test).
- RIP analysis of the interaction of YTHDF1 with TCF7L2 mRNA. The enrichment was measured by qPCR and normalized to input. Data are represented as mean ± SEM. *P < 0.05 (3 biological replicates, t‐test).
- β‐catenin/TCF4 reporter activity in YTHDF1 knockdown cells infected with lentivirus expressing TCF7L2. Data are represented as mean ± SEM. *P < 0.05, **P < 0.01, ***P < 0.001 (3 biological replicates, t‐test).
- Morphology of organoids from Lgr5‐creERT2:Ythdf1 fl/fl mice in Wnt3a‐conditioned medium without or with 4‐OHT induction and infected with lentivirus expressing TCF7L2. Scale bar, 250 μm.
- Quantification of differentiated versus undifferentiated organoids from (H). Data are represented as mean ± SEM. **P < 0.01, ***P < 0.001 (3 biological replicates, t‐test).
Source data are available online for this figure.
Figure EV5. YTHDF1 regulates the translation of TCF7L2 during Wnt activation.
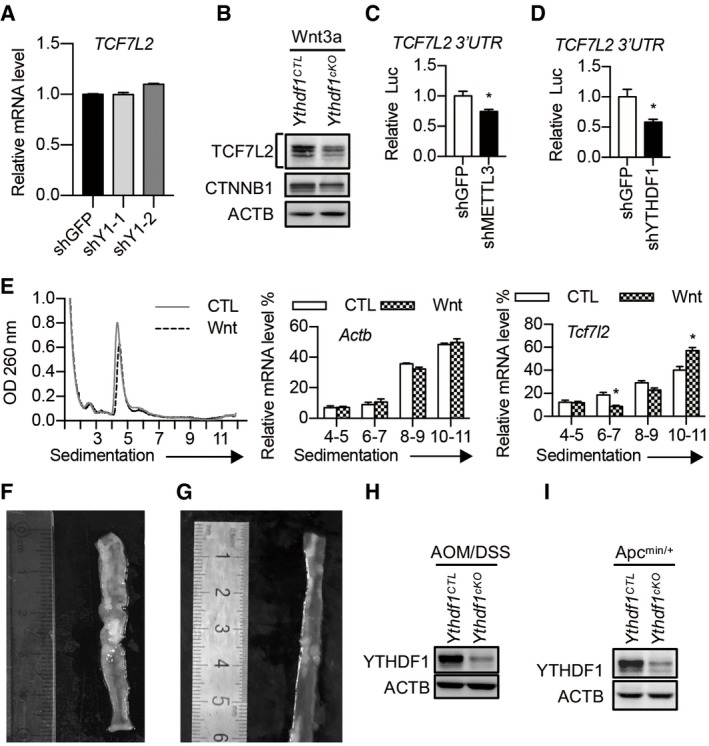
- TCF7L2 mRNA level in control and YTHDF1 knockdown HCT116 cells. Data are represented as mean ± SEM. 3 biological replicates.
- Immunoblot analysis of intestinal crypts from WT or Ythdf1 cKO mice treated with Wnt3a (60 ng/ml) for 30 min.
- Dual‐Luciferase Assay with a construct bearing the 3′UTR of TCF7L2 in HCT116 cells with or without METTL3 knockdown. Data are represented as mean ± SEM. *P < 0.05 (3 biological replicates, t‐test).
- Dual‐Luciferase Assay with a construct bearing the 3′UTR of TCF7L2 in HCT116 cells with or without YTHDF1 knockdown. Data are represented as mean ± SEM. *P < 0.05 (3 biological replicates, t‐test).
- Polysome profiles of mouse intestinal crypt treated with or without Wnt3a treatment for 30 min. The left panel is the same experiment as Fig 1B. The right panels show the distributions of Tcf7l2 and Actb in polysome fractions. Data are represented as mean ± SEM. *P < 0.05 (3 biological replicates, t‐test).
- Mouse colon after 6 weeks of AOM/DSS induction.
- Small intestine from a 3‐month‐old Apc min/+ mouse.
- Western blot showing YTHDF1 knockout efficiency in AOM/DSS‐induced tumors.
- Western blot showing YTHDF1 knockout efficiency in Apc min/+ tumors.
Source data are available online for this figure.
Next, we asked whether YTHDF1‐mediated TCF7L2 translation is regulated by Wnt signaling. Indeed, Wnt3a treatment dramatically promoted the translation of TCF7L2, as revealed by immunoblot and polysome profiling (Figs 6D and EV5E). Methylated RNA immunoprecipitation showed increased m6A levels on TCF7L2 in Wnt3a‐treated crypt (Fig 6E). In agreement, RNA immunoprecipitation demonstrated that Wnt3a treatment increased the binding between YTHDF1 and TCF7L2 mRNA (Fig 6F). Together, these results indicated that Wnt signaling regulates the translation of TCF7L2 in an m6A‐dependent manner.
Finally, we asked whether the deficient translation of TCF7L2 could explain the disrupted Wnt signaling in the absence of YTHDF1. As such, β‐catenin‐driven transcription activity was measured by the TOPFlash/FOPFlash luciferase reporter assay. Indeed, overexpression of TCF7L2 rescued the decreased β‐catenin activity in YTHDF1 knockdown cells (Fig 6G). To ascertain the contribution of TCF7L2 in YTHDF1‐mediated intestinal stem cell maintenance, we performed rescue experiments in Wnt3a‐treated organoids. As reflected by the undifferentiated organoid percentage, overexpression of TCF7L2 reversed the stemness loss elicited by Ythdf1 deletion (Fig 6H and I). Collectively, our results indicated that YTHDF1 deletion reduces the translation of TCF7L2, leading to the inactivation of Wnt signaling and loss of stemness.
Targeting YTHDF1 in ISCs of established tumors leads to tumor shrinkage and prolonged survival
YTHDF1 is dispensable for physiological intestinal development but is essential for tumorigenesis, making it an ideal potential target for CRC treatment. We, therefore, depleted Ythdf1 in ISCs after AOM/DSS or Apc mutation‐induced tumor formation using the tamoxifen‐inducible Lgr5‐creERT2 line (Fig 7A and E). We observed tumor formation in normal mice after 6 weeks of AOM/DSS treatment or Apc min/+ mice after 3 months of high‐fat diet (Fig EV5F and G). Successful Ythdf1 depletion in the intestinal epithelial cells was confirmed by immunoblot (Fig EV5H and I). Ythdf1 deletion dramatically reduced both tumor number and tumor load in AOM/DSS‐induced tumors (Fig 7B and C). Moreover, the expression of TCF7L2, FZD7, and MYC was decreased in tumors from Ythdf1 knockout mice compared with WT mice (Fig 7D). Kaplan–Meier survival plots revealed that the life span was much longer in Ythdf1‐deleted Apc min/+ mice (Fig 7F). Together, these results demonstrated that YTHDF1 inhibition indeed has the therapeutic benefit. Additionally, these results further supported the notion that YTHDF1 in ISCs plays a major role during CRC development.
Figure 7. Targeting YTHDF1 in ISCs of established tumors leads to tumor shrinkage and prolonged survival.
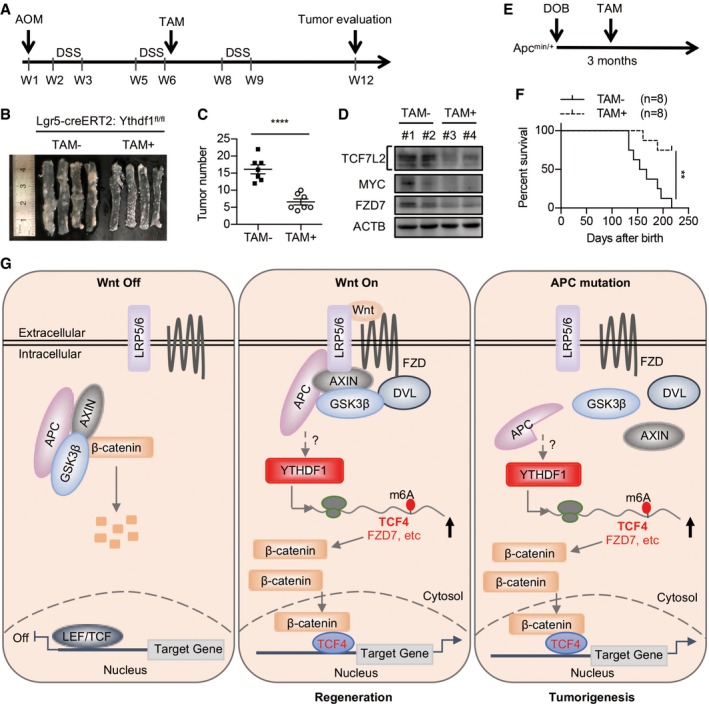
- Workflow of tamoxifen (TAM)‐induced Ythdf1 deletion in AOM/DSS‐induced Lgr5‐creERT2:Ythdf1 fl/fl mice.
- Colons from mice in (A) treated with or without TAM on day 80 of AOM/DSS induction.
- Colon tumor number from mice treated with or without TAM on day 80 of AOM/DSS induction. Data are shown as mean ± SEM (7 mice for each group). ****P < 0.0001 (t‐test).
- Immunoblot analysis of 2 pairs of colon tumors from mice treated with or without TAM.
- Workflow of tamoxifen (TAM)‐induced Ythdf1 deletion in Apc min/+ mice.
- Kaplan–Meier survival plots for Apc min/+ ; Lgr5‐creERT2:Ythdf1 fl/fl mice (8 mice for each group) treated with or without TAM. Log‐rank (Mantel–Cox) test. **P < 0.01 (t‐test).
- A proposed model of amplified β‐catenin activity by m6A‐YTHDF1‐mediated translation.
Source data are available online for this figure.
Discussion
It has generally been accepted that Wnt/β‐catenin signaling drives the self‐renewal of ISCs, which is essential for intestinal homeostasis, regeneration, and tumorigenesis. Due to its critical role, the activity of β‐catenin is under the control of several highly regulated processes, including ligand–receptor interactions, β‐catenin stability, β‐catenin nuclear translocation, and β‐catenin transcriptional activity. Here, we report an additional checkpoint for β‐catenin activation that involves m6A modification‐dependent and YTHDF1‐mediated translation of β‐catenin mediator TCF7L2/TCF4. The coordination between β‐catenin stabilization and translational induction of TCF7L2 promotes the final production of β‐catenin targets, which is co‐opted by ISCs to maintain their stemness (Fig 7G).
The biological function of m6A is regulated at multiple layers by the methyltransferases, demethylases, and reader proteins 29. The impact of m6A modification in stem cell biology is still complex due to the context‐dependent function of the “writers”, “erasers”, and “readers” 16, 17, 18, 19, 20. Taken advantage of the conditional knockout mice model and cultured organoids, we demonstrated that YTHDF1 is required for the maintenance of ISC features during Wnt‐driven intestinal regeneration and tumorigenesis. The function of YTHDF1 relies on its m6A‐binding activity as wild‐type YTHDF1 rescues the phenotype of Ythdf1 cKO organoid growth while an m6A‐binding domain‐deleted mutant cannot. Moreover, knockdown of METTL3 inhibits organoid growth, highlighting an essential role of m6A in the maintenance of intestinal stem cells. Intriguingly, our study strongly indicated that the function of YTHDF1 relies on Wnt activation, as YTHDF1 is dispensable for normal intestinal development. It should be noted that whole‐body Ythdf1 knockout mice are viable but have learning and memory defects 30, further indicating the context‐dependent function of YTHDF1. Taken together, our findings supported the notion that YTHDF1 is the major effector of m6A in the intestines to maintain stem cell traits during regeneration and tumorigenesis.
In agreement with the previous reports that YTHDF1 is a translation regulator 12, 30, 31, our data demonstrated that YTHDF1 exerts its function through regulating the translation of a subset of mRNAs. By combining RIP‐seq, m6A‐seq, and Ribo‐seq, we have identified TCF4, DVL3, and FZD7 as the direct targets of YTHDF1, three key Wnt signaling components. Importantly, our rescue experiments have confirmed TCF7L2 as a key functional target of YTHDF1. As the major transcriptional effector for β‐catenin in mouse intestine and human colorectal cancer cells, TCF7L2 is essential for both intestinal homeostasis and tumorigenesis 32. In our study, expression of TCF7L2 largely rescues the reduced β‐catenin activity and stem cell features by YTHDF1 deletion, emphasizing the importance of this protein for intestinal stem cell maintenance. Among the ten mammalian FZD receptors, FZD7 is enriched in Lgr5+ stem cells and functions as the major FZD receptor responsible for mediating Wnt activity in intestinal stem cells 33. In addition, FZD7 was reported to control intestinal regeneration via MYC 33. Indeed, as a direct Wnt target, MYC is critical for intestinal regeneration 34. Our data clearly demonstrated that knockout of Ythdf1 reduces the expression of FZD7 and MYC in both irradiation model and AOM/DSS model, highlighting the essential role of YTHDF1‐promoted expression of these factors in Wnt‐driven regeneration and tumorigenesis. Of note, our Ribo‐seq data showed that the translation of β‐catenin did not change. However, the protein level of β‐catenin decreased in Ythdf1‐deleted crypt under Wnt treatment. This might be due to the degradation of β‐catenin, as FZD7 and DVL3 are regulators of β‐catenin protein stability.
Studies have shown that YTHDF1 regulates translation in a stimulation‐induced manner 35. For instance, in the dorsal root ganglion (DRG) model of injury‐induced axon regeneration, YTHDF1 is required for robust global de novo protein synthesis only during this recovery process but has little effect on translation before the injury 36. Another study showed that YTHDF1‐dependent translation was enhanced only by potassium chloride depolarization in cultured neurons 30. In line with these reports, we found that YTHDF1‐mediated translation of TCF7L2 largely depends on Wnt activation. Based on our data, Wnt signaling triggers YTHDF1‐mediated translation through two coordinated aspects. On the one hand, Wnt increases m6A methylation on TCF7L2 (cis‐element), due to the upregulated expression of METTL3 (Fig 1A). On the other hand, Wnt promotes the expression of YTHDF1 (trans‐factor). These results account for the Wnt‐dependent phenotype of YTHDF1 observed in mice at the molecular level.
YTHDF1 upregulation is consistently observed in human and mouse intestinal cancer (Figs 1G and EV1I–L) 37, 38, making this protein a robust and reproducible biomarker for CRC. The expression of YTHDF1 is regulated at multiple levels. Both upregulated transcription and amplified DNA copy number might contribute to the high expression of YTHDF1 in CRC 37, 38. This is supported by the upregulated YTHDF1 mRNA level in TCGA datasets (Fig EV1L). Mutations in APC gene are observed in more than 80% of CRC patient samples 5, 22, prompting the search for vulnerabilities specific to APC mutation. Using in vitro and in vivo models, we defined that APC mutation induces YTHDF1 expression mainly at the translational level, which provides an additional layer of YTHDF1 expression regulation. Our data indicated that YTHDF1 expression is regulated by Wnt and APC but not β‐catenin. This could be explained by the fact that Wnt/APC could regulate gene expression independent of β‐catenin. For instance, Wnt was reported to regulate mRNA translation through mTOR 39. Moreover, APC could regulate the activity of transcription factor YAP, potentially regulating gene expression 40. The mechanism of Wnt/APC‐regulated YTHDF1 expression needs further investigation.
YTHDF1 is dispensable for physiological intestinal development while essential for Wnt‐driven tumorigenesis, making it an ideal therapeutic target for CRC. Indeed, our mouse data demonstrated that deletion of Ythdf1 in the established tumors using genetic methods leads to tumor shrinkage and prolonged survival. Of note, a recent study has demonstrated that YTHDF1 regulates durable neoantigen‐specific immunity. Loss of YTHDF1 in classical dendritic cells enhanced cross‐presentation of tumor antigens and the cross‐priming of CD8+ T cells, implicating YTHDF1 as a potential therapeutic target in anticancer immunotherapy 31. We envision that compounds targeting YTHDF1 may increase the efficacy of the current CRC therapy regime by inhibiting cancer stem cell activity as well as increasing anticancer immune response.
In summary, our findings highlighted an essential role of YTHDF1 in Wnt signaling activation, intestinal stem cell trait maintenance, and CRC, with potential implications for disease intervention. In addition, our results established a model for m6A‐dependent and YTHDF1‐mediated translation in signaling amplification, which may guide the understanding of the development and progression of other human disorders associated with m6A/YTHDF1 dysregulation.
Materials and Methods
Mouse experiments
Mice were maintained and bred in specific pathogen‐free conditions at the Animal Center of Zhejiang University. All animal studies were performed in compliance with the Guide for the Care and Use of Laboratory Animals by the Medical Experimental Animal Care Commission of Zhejiang University. All animal studies used the protocol that has been approved by the Medical Experimental Animal Care Commission of Zhejiang University. For each experiment, about 6–10 mice were used for each group. Randomization and blinding were used for animal studies.
Conditional Ythdf1 KO allele (Ythdf1 fl/fl) was generated at C57BL/6 strain by Cyagen Biosciences (China). The fourth exon of Ythdf1 was targeted with flanking LoxP sites. Villin‐Cre, Lgr5‐EGFP‐IRES‐creERT2, and Apc min/+ mice were obtained from the Jackson Laboratory.
Irradiation injury
For irradiation, 2‐month‐old mice were subjected to 12 Gy gamma irradiation in a Rad Source (RS2000Pro, Rad Source Technologies) and executed at the appointed time.
Apc min/+ spontaneous mouse tumor model
For the detection of Apc mutation‐induced tumorigenesis, Apc min/+ mice were allowed to develop tumors spontaneously for 6 months and then sacrificed for tumor and tissue analysis. For survival analysis, Apc min/+; Lgr5‐EGFP‐IRES‐creERT2:Ythdf1 fl/fl mice were fed with a high‐fat diet. At the age of 3 months, mice were injected intraperitoneally with tamoxifen at 2 mg/day for 5 days to induce Ythdf1 deletion and survival is monitored.
The AOM/DSS‐induced mouse colorectal cancer model
Two‐month‐old female Ythdf1 fl/fl (Ythdf1 CTL) and Villin‐Cre:Ythdf1 fl/fl (Ythdf1 cKO) littermates were intraperitoneally injected once with AOM (Sigma) at 10 mg/kg body weight. One week after AOM injection, mice were subjected to DSS cycle, in which mice were fed with 2.5% (w/v) DSS (molecular weight 36,000–50,000, MP Biomedicals) for 7 days followed by 14 days of normal water feeding. After three cycles of DSS treatment, mice were sacrificed on week 12 and colon tissues were collected for tumor number and volume evaluation. To investigate the effect of Ythdf1 deletion in intestinal stem cells on tumor development, Lgr5‐EGFP‐IRES‐creERT2:Ythdf1 fl/fl mice were subjected to AOM/DSS treatment. In the second cycle of DSS treatment, mice were injected intraperitoneally with tamoxifen at 2 mg/day for 5 days to induce Ythdf1 deletion.
Histology and immunohistochemistry
Intestines were rinsed with DPBS, fixed in 10% formalin, paraffin‐embedded, and sectioned at 5 mm. Sections were stained with hematoxylin and eosin (H&E). For immunohistochemistry, antigen retrieval was performed by heating slides in 0.01 M citrate buffer (pH 6.0) in a microwave. Antibodies used for immunohistochemistry are listed in Table EV2. Diaminobenzidine (DAB) was used as the enzyme substrate for staining, and hematoxylin was used as the counterstain.
RNA fluorescent in situ hybridization (FISH)
Mouse intestinal tissue was excised and fixed in 4% paraformaldehyde for 24 h at 4°C. Fixed tissues were dehydrated in a graded series of sucrose and embedded in OCT compound (Sakura Finetek) and frozen on dry ice. Cryostat sections (7 μm) were cut and dried for 20 min. RNA fluorescent in situ hybridization was then performed according to the RNAScope Multiplex Fluorescent Assay (ACD, Inc) following the manufacturer's protocol.
Plasmid construction
Flag‐tagged YTHDF1 was generated from HEK293T cell line cDNA and cloned into vector pCDH‐CMV‐MCS‐EF1‐Puro at EcoRI/BamHI. Flag‐tagged TCF7L2 was generated from HCT116 cell line cDNA and cloned into vector pCDH‐CMV‐MCS‐EF1‐Puro using recombinational cloning kit (Vazyme, China). YTHDF1‐5′UTR was generated from HCT116 cell line cDNA and cloned into vector pGL3‐control (Promega) at HindIII/NcoI. The primers used for the cloning are listed in Table EV3.
For shRNA knockdown experiments, specific shRNA oligos (Table EV3) were annealed and cloned to the lentiviral vector pLKO.1.
Crypt isolation, treatment, and culture
Small intestinal crypt from normal intestinal tissues and adenoma were isolated using EDTA as described previously 41, 42. The isolated crypts resuspended in DMEM/F12 (Invitrogen) were treated with or without Wnt3a (60 ng/ml) for 30 or 60 min. The crypts were then subjected to further analysis. For organoid culture, crypts were embedded in Matrigel (BD) and cultured in advanced DMEM/F12 (Invitrogen) supplemented with 2 mM GlutaMAX (Invitrogen), penicillin/streptomycin, 1 μM N‐acetyl cysteine (Sigma), 1×B27 supplement (Invitrogen), 1×N2 supplement (Invitrogen), 50 ng/ml EGF (PeproTech), 100 ng/ml Noggin (PeproTech), and 500 ng/ml R‐spondin (PeproTech).
Human colorectal cancer tissue samples
The colorectal cancer tissue arrays were purchased from Shanghai Outdo Biotech Company (OD‐CT‐DgCol01‐006 and HcolA030PG06). Ethical consent was granted from the Ethical Committee Review Board of Shanghai Outdo Biotech Company. The informed consent was obtained from all subjects and that the experiments conformed to the principles set out in the WMA Declaration of Helsinki and the Department of Health and Human Services Belmont Report.
Cell culture
Human colorectal cancer cell lines SW620, HCT116, and RKO are obtained from ATCC and cultured in DMEM (HyClone) supplemented with 10% fetal bovine serum (Thermo Fisher Scientific). Cells were maintained at 37°C in an atmosphere containing 5% CO2.
Quantitative RT–PCR
Total RNA was isolated from total mouse small intestinal epithelial cells using TRIzol reagent (Life Technologies). Each RNA sample was reverse‐transcribed with the M‐MLV Reverse Transcriptase (Takara) using random primers. Real‐time PCR was performed using the SYBR Green I Master Mix on a LightCycler 480 Real‐Time PCR System (Roche). Relative gene expression was normalized to the expression of ACTB or GAPDH and was calculated using the 2(−ΔΔCT) method. RT–qPCR primers are listed in Table EV3.
Immunoblotting
Cells or intestinal epithelial tissues were lysed in RIPA lysis buffer (Beyotime, China). 40 μg of total protein was separated by sodium dodecyl sulfate–polyacrylamide gel (SDS–PAGE) under denaturing conditions and transferred to PVDF membranes (Millipore). Membranes were blocked in 5% non‐fat dry milk in TBST and incubated with primary antibodies, followed by incubation with the secondary antibody and chemiluminescent detection system (Bio‐Rad). The primary antibodies used are listed in Table EV2.
Polysome profiling
SW620 cells or HCT116 cells were treated with cycloheximide (CHX) at 100 μg/ml for 3 min to freeze the translating ribosomes. Cells were pelleted, lysed with lysis buffer (10 mM HEPES, pH 7.4, 100 mM KCl, 5 mM MgCl2, 100 μg/ml CHX, 5 mM DTT, and 1% Triton X‐100) on ice, and centrifuged. The supernatant was collected and loaded onto a 10–50% w/v sucrose gradient prepared in the polysome buffer (10 mM HEPES, pH 7.4, 100 mM KCl, 5 mM MgCl2, and 100 μg/ml CHX). The gradients were centrifuged at 4°C for 2.5 h at 178,305 g (Beckman, rotor SW41Ti). The sample was then fractioned by Gradient Station (BioCamp) equipped with a UV monitor and collected with a fraction collector (FC203B, Gilson). Total RNA from the indicated fractions was isolated by TRIzol reagent for RT–qPCR analysis.
Luciferase reporter assay
To study the regulation of β‐catenin activity by YTHDF1, SW620 cells infected with shYTHDF1 virus were co‐transfected with TOPFlash or FOPFlash firefly luciferase reporter plasmid and Renilla luciferase reporter (Promega) as an internal control. Cells were harvested at 24 h post‐transfection. Firefly and Renilla luciferase activities were measured using the Dual‐Luciferase Assay Kit (Promega). The activities of the TOPFlash and the FOPFlash reporter constructs were expressed as normalized relative light units to the Renilla internal control. For β‐catenin/TCF‐4 induction experiments, results were presented as fold induction. Fold induction was determined by normalizing TOPFlash value to FOPFlash value.
To study the regulation of YTHDF1 5′UTR translation, SW620 cells with or without APC expression were transfected with YTHDF1‐5′UTR‐Luc construct together with Renilla luciferase reporter. Firefly and Renilla luciferase activities were measured using the Dual‐Luciferase Assay Kit (Promega). Firefly luciferase activity was normalized by Renilla luciferase activity.
To study the regulation of TCF7L2 3′UTR translation, HCT116 cells with or without APC expression were transfected with Luc‐TCF7L2‐3′UTR construct together with Renilla luciferase reporter. Firefly and Renilla luciferase activities were measured using the Dual‐Luciferase Assay Kit (Promega). Firefly luciferase activity was normalized by Renilla luciferase activity.
m6A RIP qPCR
Total RNA was isolated from SW620 cells using TRIzol, and polyadenylated RNA was further enriched using the Dynabeads Oligo(dT)25 (Invitrogen). Dynabeads™ Protein G beads (Invitrogen) were coated with 3 μg m6A antibody (Synaptic Systems) and washed 2 times with 1×IP buffer (10 mM Tris–HCl pH 7.6, 150 mM NaCl, 0.1% Igepal CA‐630, and 200 U/ml RNase inhibitor). Purified mRNA was then incubated with m6A‐coated beads for 6 h at 4°C. The beads were washed three times with 1 ml ice‐cold washing buffer (10 mM Tris–HCl pH 7.6, 0.15 M LiCl, and 1 mM EDTA). The immunoprecipitation complex was digested with proteinase K at 55°C for 1 h. RNA was then extracted using TRIzol reagent (Life Technologies), followed by quantitative RT–PCR.
RNA‐seq
Total RNA was isolated from control cells or YTHDF1 knockdown cells using TRIzol reagent. Polyadenylated RNA was further enriched from total RNA using the Dynabeads Oligo(dT)25 (Invitrogen). mRNA samples were fragmented into ~100‐nucleotide‐long fragments using RNA Fragmentation Reagents (Ambion, AM8740) and used for library construction and high‐throughput sequencing. The sequencing was performed by Hangzhou KaiTai Biotechnology Co., Ltd.
m6A‐seq
Dynabeads™ Protein G beads (Invitrogen) were coated with 5 μg anti‐m6A antibody in 1×IP buffer (10 mM Tris–HCl, pH 7.4, 150 mM NaCl, and 0.1% NP‐40) for 0.5 h. 3 μg of fragmented mRNA was incubated with antibody‐coated Protein G beads at 4°C for 4 h. After washing three times with IP buffer, bound RNA was eluted using 100 μl elution buffer (6.7 mM N6‐methyladenosine 5′‐monophosphate sodium salt in 1×IP buffer), followed by ethanol precipitation. Precipitated RNA was used for library construction and high‐throughput sequencing.
Ribo‐seq
Control cells or YTHDF1 knockdown cells were treated with CHX (100 μg/ml) for 3 min at 37°C to freeze the translating ribosomes. Cells were then harvested by polysome lysis buffer (10 mM HEPES, pH 7.4, 100 mM KCl, 5 mM MgCl2, 100 μg/ml CHX, 5 mM DTT, and 1% Triton X‐100). After centrifugation at 4°C and 12,000× g for 10 min, the supernatant was digested with E. coli RNase I (Ambion) at 4°C for 1 h. Ribosome‐protected fragments were collected by centrifugation for 134 min at 449,165 g using an MLA150 rotor in 1 M sucrose cushion. Total RNA was extracted using TRIzol reagent. The end structures of the RNA fragments of ribosome profiling were repaired by T4 PNK as described previously 11. The library was constructed by TruSeq Small RNA Sample Preparation Kit (Illumina).
Sequencing data analysis
The 3′ adaptors and low‐quality bases were trimmed by Cutadapt3. The trimmed reads with length < 15 nucleotides were excluded. The remaining reads were mapped to the human transcriptome using Bowtie. For read alignment, a maximum of two mismatches was permitted. m6A coverages at individual sites were normalized by the mean coverage of the transcript. For Ribo‐seq, the reads mapped to CDS were used to calculate the RPKM values for translation levels. For RNA‐seq, the reads mapped to the entire transcript were used to calculate RPKM. Translational efficiency (TE) was defined as the ratio of FPKM of Ribo‐seq over FPKM of RNA‐seq.
Statistical analysis
Statistical analysis was performed using GraphPad Prism 9 software (GraphPad Software, Inc.). P values were calculated using a two‐tailed t‐test unless stated otherwise. Asterisks denote statistical significance (*P < 0.05; **P < 0.01; ***P < 0.001).
Author contributions
BH, SW, and SY performed the majority of experiments. JX assisted with the molecular experiments. KL performed the analysis. ZC, RB, and JS assisted with the mice experiments. ZX and XG designed the experiments. XG conceived the project and wrote the manuscript. All authors discussed the results and edited the manuscript.
Conflict of interest
The authors declare that they have no conflict of interest.
Supporting information
Expanded View Figures PDF
Table EV1
Table EV2
Table EV3
Dataset EV1
Dataset EV2
Dataset EV3
Source Data for Expanded View
Review Process File
Source Data for Figure 1
Source Data for Figure 2
Source Data for Figure 4
Source Data for Figure 6
Source Data for Figure 7
Acknowledgements
We would like to thank Dr. Yuanhui Mao and Dr. Ji Wan (Shenzhen NeoCura Biotechnology Corporation) for the assistance in sequencing data analysis and Dr. Chi Luo for the critical reading. This work was supported by grants from National Natural Science Foundation of China (81672847 to X.G. and 81971886 to Z.C.) and Zhejiang Provincial Natural Science Foundation of China (LQ19C050004 to S.W.). We thank Dr. Jinfeng Su for her technical support in molecular cloning (Postdoctoral foundation 2018M633283).
EMBO Reports (2020) 21: e49229
See also: https://doi/org/10.15252/embr.202050097 (April 2020)
Data availability
The datasets produced in this study are available in the following databases: m6A‐seq, Ribo‐seq, and RNA‐seq data: Gene Expression Omnibus GSE136664 (https://www.ncbi.nlm.nih.gov/geo/query/acc.cgi?acc=GSE136664).
References
- 1. Barker N (2014) Adult intestinal stem cells: critical drivers of epithelial homeostasis and regeneration. Nat Rev Mol Cell Biol 15: 19–33 [DOI] [PubMed] [Google Scholar]
- 2. Nusse R, Clevers H (2017) Wnt/beta‐catenin signaling, disease, and emerging therapeutic modalities. Cell 169: 985–999 [DOI] [PubMed] [Google Scholar]
- 3. Miyoshi H, Ajima R, Luo CT, Yamaguchi TP, Stappenbeck TS (2012) Wnt5a potentiates TGF‐beta signaling to promote colonic crypt regeneration after tissue injury. Science 338: 108–113 [DOI] [PMC free article] [PubMed] [Google Scholar]
- 4. Morin PJ, Sparks AB, Korinek V, Barker N, Clevers H, Vogelstein B, Kinzler KW (1997) Activation of beta‐catenin‐Tcf signaling in colon cancer by mutations in beta‐catenin or APC. Science 275: 1787–1790 [DOI] [PubMed] [Google Scholar]
- 5. Korinek V, Barker N, Morin PJ, van Wichen D, de Weger R, Kinzler KW, Vogelstein B, Clevers H (1997) Constitutive transcriptional activation by a beta‐catenin‐Tcf complex in APC‐/‐ colon carcinoma. Science 275: 1784–1787 [DOI] [PubMed] [Google Scholar]
- 6. Bokar JA, Shambaugh ME, Polayes D, Matera AG, Rottman FM (1997) Purification and cDNA cloning of the AdoMet‐binding subunit of the human mRNA (N6‐adenosine)‐methyltransferase. RNA 3: 1233–1247 [PMC free article] [PubMed] [Google Scholar]
- 7. Liu J, Yue Y, Han D, Wang X, Fu Y, Zhang L, Jia G, Yu M, Lu Z, Deng X et al (2014) A METTL3‐METTL14 complex mediates mammalian nuclear RNA N6‐adenosine methylation. Nat Chem Biol 10: 93–95 [DOI] [PMC free article] [PubMed] [Google Scholar]
- 8. Ping XL, Sun BF, Wang L, Xiao W, Yang X, Wang WJ, Adhikari S, Shi Y, Lv Y, Chen YS et al (2014) Mammalian WTAP is a regulatory subunit of the RNA N6‐methyladenosine methyltransferase. Cell Res 24: 177–189 [DOI] [PMC free article] [PubMed] [Google Scholar]
- 9. Jia G, Fu Y, Zhao X, Dai Q, Zheng G, Yang Y, Yi C, Lindahl T, Pan T, Yang YG et al (2011) N6‐methyladenosine in nuclear RNA is a major substrate of the obesity‐associated FTO. Nat Chem Biol 7: 885–887 [DOI] [PMC free article] [PubMed] [Google Scholar]
- 10. Zheng G, Dahl JA, Niu Y, Fedorcsak P, Huang CM, Li CJ, Vagbo CB, Shi Y, Wang WL, Song SH et al (2013) ALKBH5 is a mammalian RNA demethylase that impacts RNA metabolism and mouse fertility. Mol Cell 49: 18–29 [DOI] [PMC free article] [PubMed] [Google Scholar]
- 11. Wang X, Lu Z, Gomez A, Hon GC, Yue Y, Han D, Fu Y, Parisien M, Dai Q, Jia G et al (2014) N6‐methyladenosine‐dependent regulation of messenger RNA stability. Nature 505: 117–120 [DOI] [PMC free article] [PubMed] [Google Scholar]
- 12. Wang X, Zhao BS, Roundtree IA, Lu Z, Han D, Ma H, Weng X, Chen K, Shi H, He C (2015) N(6)‐methyladenosine modulates messenger RNA translation efficiency. Cell 161: 1388–1399 [DOI] [PMC free article] [PubMed] [Google Scholar]
- 13. Zhou J, Wan J, Gao X, Zhang X, Jaffrey SR, Qian SB (2015) Dynamic m(6)A mRNA methylation directs translational control of heat shock response. Nature 526: 591–594 [DOI] [PMC free article] [PubMed] [Google Scholar]
- 14. Meyer KD, Patil DP, Zhou J, Zinoviev A, Skabkin MA, Elemento O, Pestova TV, Qian SB, Jaffrey SR (2015) 5′ UTR m(6)A promotes cap‐independent translation. Cell 163: 999–1010 [DOI] [PMC free article] [PubMed] [Google Scholar]
- 15. Zhao BS, Roundtree IA, He C (2017) Post‐transcriptional gene regulation by mRNA modifications. Nat Rev Mol Cell Biol 18: 31–42 [DOI] [PMC free article] [PubMed] [Google Scholar]
- 16. Geula S, Moshitch‐Moshkovitz S, Dominissini D, Mansour AA, Kol N, Salmon‐Divon M, Hershkovitz V, Peer E, Mor N, Manor YS et al (2015) Stem cells m6A mRNA methylation facilitates resolution of naive pluripotency toward differentiation. Science 347: 1002–1006 [DOI] [PubMed] [Google Scholar]
- 17. Batista PJ, Molinie B, Wang J, Qu K, Zhang J, Li L, Bouley DM, Lujan E, Haddad B, Daneshvar K et al (2014) m(6)A RNA modification controls cell fate transition in mammalian embryonic stem cells. Cell Stem Cell 15: 707–719 [DOI] [PMC free article] [PubMed] [Google Scholar]
- 18. Lee H, Bao S, Qian Y, Geula S, Leslie J, Zhang C, Hanna JH, Ding L (2019) Stage‐specific requirement for Mettl3‐dependent m(6)A mRNA methylation during haematopoietic stem cell differentiation. Nat Cell Biol 21: 700–709 [DOI] [PMC free article] [PubMed] [Google Scholar]
- 19. Bertero A, Brown S, Madrigal P, Osnato A, Ortmann D, Yiangou L, Kadiwala J, Hubner NC, de Los Mozos IR, Sadee C et al (2018) The SMAD2/3 interactome reveals that TGFbeta controls m(6)A mRNA methylation in pluripotency. Nature 555: 256–259 [DOI] [PMC free article] [PubMed] [Google Scholar]
- 20. Vu LP, Pickering BF, Cheng Y, Zaccara S, Nguyen D, Minuesa G, Chou T, Chow A, Saletore Y, MacKay M et al (2017) The N(6)‐methyladenosine (m(6)A)‐forming enzyme METTL3 controls myeloid differentiation of normal hematopoietic and leukemia cells. Nat Med 23: 1369–1376 [DOI] [PMC free article] [PubMed] [Google Scholar]
- 21. Leppek K, Das R, Barna M (2018) Functional 5′ UTR mRNA structures in eukaryotic translation regulation and how to find them. Nat Rev Mol Cell Biol 19: 158–174 [DOI] [PMC free article] [PubMed] [Google Scholar]
- 22. Faller WJ, Jackson TJ, Knight JR, Ridgway RA, Jamieson T, Karim SA, Jones C, Radulescu S, Huels DJ, Myant KB et al (2015) mTORC1‐mediated translational elongation limits intestinal tumour initiation and growth. Nature 517: 497–500 [DOI] [PMC free article] [PubMed] [Google Scholar]
- 23. Ireland H, Kemp R, Houghton C, Howard L, Clarke AR, Sansom OJ, Winton DJ (2004) Inducible Cre‐mediated control of gene expression in the murine gastrointestinal tract: effect of loss of beta‐catenin. Gastroenterology 126: 1236–1246 [DOI] [PubMed] [Google Scholar]
- 24. van de Wetering M, Sancho E, Verweij C, de Lau W, Oving I, Hurlstone A, van der Horn K, Batlle E, Coudreuse D, Haramis AP et al (2002) The beta‐catenin/TCF‐4 complex imposes a crypt progenitor phenotype on colorectal cancer cells. Cell 111: 241–250 [DOI] [PubMed] [Google Scholar]
- 25. Willert J, Epping M, Pollack JR, Brown PO, Nusse R (2002) A transcriptional response to Wnt protein in human embryonic carcinoma cells. BMC Dev Biol 2: 8 [DOI] [PMC free article] [PubMed] [Google Scholar]
- 26. Chen J, Huang XF (2009) The signal pathways in azoxymethane‐induced colon cancer and preventive implications. Cancer Biol Ther 8: 1313–1317 [DOI] [PubMed] [Google Scholar]
- 27. Schepers AG, Snippert HJ, Stange DE, van den Born M, van Es JH, van de Wetering M, Clevers H (2012) Lineage tracing reveals Lgr5+ stem cell activity in mouse intestinal adenomas. Science 337: 730–735 [DOI] [PubMed] [Google Scholar]
- 28. Tirumuru N, Zhao BS, Lu W, Lu Z, He C, Wu L (2016) N(6)‐methyladenosine of HIV‐1 RNA regulates viral infection and HIV‐1 Gag protein expression. Elife 5: e15528 [DOI] [PMC free article] [PubMed] [Google Scholar]
- 29. Hsu PJ, Shi H, He C (2017) Epitranscriptomic influences on development and disease. Genome Biol 18: 197 [DOI] [PMC free article] [PubMed] [Google Scholar]
- 30. Shi H, Zhang X, Weng YL, Lu Z, Liu Y, Li J, Hao P, Zhang Y, Zhang F, Wu Y et al (2018) m(6)A facilitates hippocampus‐dependent learning and memory through YTHDF1. Nature 563: 249–253 [DOI] [PMC free article] [PubMed] [Google Scholar]
- 31. Han D, Liu J, Chen C, Dong L, Liu Y, Chang R, Huang X, Wang J, Dougherty U, Bissonnette MB et al (2019) Anti‐tumour immunity controlled through mRNA m(6)A methylation and YTHDF1 in dendritic cells. Nature 566: 270–274 [DOI] [PMC free article] [PubMed] [Google Scholar]
- 32. van Es JH, Haegebarth A, Kujala P, Itzkovitz S, Koo BK, Boj SF, Korving J, van den Born M, van Oudenaarden A, Robine S et al (2012) A critical role for the Wnt effector Tcf4 in adult intestinal homeostatic self‐renewal. Mol Cell Biol 32: 1918–1927 [DOI] [PMC free article] [PubMed] [Google Scholar]
- 33. Flanagan DJ, Phesse TJ, Barker N, Schwab RH, Amin N, Malaterre J, Stange DE, Nowell CJ, Currie SA, Saw JT et al (2015) Frizzled7 functions as a Wnt receptor in intestinal epithelial Lgr5(+) stem cells. Stem Cell Rep 4: 759–767 [DOI] [PMC free article] [PubMed] [Google Scholar]
- 34. Ashton GH, Morton JP, Myant K, Phesse TJ, Ridgway RA, Marsh V, Wilkins JA, Athineos D, Muncan V, Kemp R et al (2010) Focal adhesion kinase is required for intestinal regeneration and tumorigenesis downstream of Wnt/c‐Myc signaling. Dev Cell 19: 259–269 [DOI] [PMC free article] [PubMed] [Google Scholar]
- 35. Shi H, Wei J, He C (2019) Where, when, and how: context‐dependent functions of RNA methylation writers, readers, and erasers. Mol Cell 74: 640–650 [DOI] [PMC free article] [PubMed] [Google Scholar]
- 36. Weng YL, Wang X, An R, Cassin J, Vissers C, Liu Y, Liu Y, Xu T, Wang X, Wong SZH et al (2018) Epitranscriptomic m(6)A regulation of axon regeneration in the adult mammalian nervous system. Neuron 97: 313–325 e6 [DOI] [PMC free article] [PubMed] [Google Scholar]
- 37. Nishizawa Y, Konno M, Asai A, Koseki J, Kawamoto K, Miyoshi N, Takahashi H, Nishida N, Haraguchi N, Sakai D et al (2018) Oncogene c‐Myc promotes epitranscriptome m(6)A reader YTHDF1 expression in colorectal cancer. Oncotarget 9: 7476–7486 [DOI] [PMC free article] [PubMed] [Google Scholar]
- 38. Bai Y, Yang C, Wu R, Huang L, Song S, Li W, Yan P, Lin C, Li D, Zhang Y (2019) YTHDF1 regulates tumorigenicity and cancer stem cell‐like activity in human colorectal carcinoma. Front Oncol 9: 332 [DOI] [PMC free article] [PubMed] [Google Scholar]
- 39. Inoki K, Ouyang H, Zhu T, Lindvall C, Wang Y, Zhang X, Yang Q, Bennett C, Harada Y, Stankunas K et al (2006) TSC2 integrates Wnt and energy signals via a coordinated phosphorylation by AMPK and GSK3 to regulate cell growth. Cell 126: 955–968 [DOI] [PubMed] [Google Scholar]
- 40. Cai J, Maitra A, Anders RA, Taketo MM, Pan D (2015) beta‐Catenin destruction complex‐independent regulation of Hippo‐YAP signaling by APC in intestinal tumorigenesis. Genes Dev 29: 1493–1506 [DOI] [PMC free article] [PubMed] [Google Scholar]
- 41. Sato T, Vries RG, Snippert HJ, van de Wetering M, Barker N, Stange DE, van Es JH, Abo A, Kujala P, Peters PJ et al (2009) Single Lgr5 stem cells build crypt‐villus structures in vitro without a mesenchymal niche. Nature 459: 262–265 [DOI] [PubMed] [Google Scholar]
- 42. Sato T, van Es JH, Snippert HJ, Stange DE, Vries RG, van den Born M, Barker N, Shroyer NF, van de Wetering M, Clevers H (2011) Paneth cells constitute the niche for Lgr5 stem cells in intestinal crypts. Nature 469: 415–418 [DOI] [PMC free article] [PubMed] [Google Scholar]
Associated Data
This section collects any data citations, data availability statements, or supplementary materials included in this article.
Supplementary Materials
Expanded View Figures PDF
Table EV1
Table EV2
Table EV3
Dataset EV1
Dataset EV2
Dataset EV3
Source Data for Expanded View
Review Process File
Source Data for Figure 1
Source Data for Figure 2
Source Data for Figure 4
Source Data for Figure 6
Source Data for Figure 7
Data Availability Statement
The datasets produced in this study are available in the following databases: m6A‐seq, Ribo‐seq, and RNA‐seq data: Gene Expression Omnibus GSE136664 (https://www.ncbi.nlm.nih.gov/geo/query/acc.cgi?acc=GSE136664).


