Significance
Social scientists have documented dramatic change in gender inequality in the last half century, sometimes called a “gender revolution.” We show dramatic progress in movement toward gender equality between 1970 and 2018, but also that in recent decades, change has slowed or stalled. The slowdown on some indicators and stall on others suggests that further progress requires substantial institutional and cultural change. Progress may require increases in men’s participation in household and care work, governmental provision of child care, and adoption by employers of policies that reduce gender discrimination and help both men and women combine jobs with family care responsibilities.
Keywords: gender inequality, gender pay gap, occupational gender segregation, gender, education
Abstract
We examine change in multiple indicators of gender inequality for the period of 1970 to 2018. The percentage of women (age 25 to 54) who are employed rose continuously until ∼2000 when it reached its highest point to date of 75%; it was slightly lower at 73% in 2018. Women have surpassed men in receipt of baccalaureate and doctoral degrees. The degree of segregation of fields of study declined dramatically in the 1970s and 1980s, but little since then. The desegregation of occupations continues but has slowed its pace. Examining the hourly pay of those aged 25 to 54 who are employed full-time, we found that the ratio of women’s to men’s pay increased from 0.61 to 0.83 between 1970 and 2018, rising especially fast in the 1980s, but much slower since 1990. In sum, there has been dramatic progress in movement toward gender equality, but, in recent decades, change has slowed and on some indicators stalled entirely.
Social scientists have documented a dramatic change in gender inequality in the last half century, sometimes called a “gender revolution.” Women’s employment increased and became the norm, even for mothers of young children (1). Birth control became available to most (2, 3). The proportion of women receiving baccalaureate or doctoral degrees increased dramatically (4, 5). Women rose as a proportion of those getting degrees in fields of study that have traditionally been dominated by men, such as management, accounting, and science, technology, engineering, and mathematics fields (6). A new women’s movement emerged. Equal opportunity in employment, which had been the law since the 1960s, became somewhat institutionalized in the personnel policies of organizations (7). Because of new opportunities and aspirations, many women entered professional and managerial jobs filled previously almost exclusively by men, thus lessening the segregation of occupations (8–10). The gender gap in pay fell significantly after 1980 (11, 12). Attitudes about the proper roles for men and women became more gender egalitarian (13, 14). However, much of this research, as well as additional recent research (e.g., refs. 15 and 16), also shows a slowdown or even stall in movement toward gender equality.
Our contribution is to update and broaden the scope of past descriptions of trends in US gender inequality. To do this, we document changes between 1970 and 2018 on multiple quantitative indicators: employment, educational attainment, segregation of fields of study, segregation of occupations, and pay. Our updated and broadened analysis strongly reinforces a conclusion a number of scholars have reached recently: that progress toward gender inequality has slowed in recent decades, and on some indicators has stalled completely. We end by suggesting what may be necessary for further reductions in gender inequality to occur.
Results
Employment.
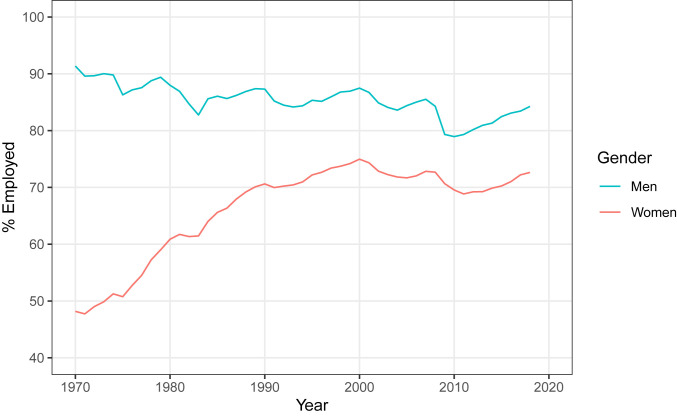
Fig. 1 shows trends in employment for men and women, giving the percentage of those aged 25 to 54 who were employed in the week of the survey in each year from 1970 to 2018. Women’s employment rose almost steadily from 1970 to 2000, moving from 48% employed in 1970 to 75% employed in 2000. It then declined, plateaued, and declined more in the Great Recession, reaching a bottom of 69% and rebounding to 73% in 2018. Despite the rebound after the recession, in 2018 it was no higher than its level in 1996.
Fig. 1.
Percentage of women and men, age 25 to 54, employed in the last week, 1970 to 2018. Source: Authors’ computations from IPUMS CPS ASEC samples for 1970 to 2018.
Men have a higher level of employment than women at each year, and their employment has gone up and down more than women’s with business cycles, including the Great Recession. Unlike for women, the long-term trend for men has been slowly downward, from 91% in 1970 to 84% in 2018 (Fig. 1). The percent employed fell more dramatically for men than for women in the Great Recession, from 84 to 79% between 2008 and 2009, with a larger rebound as well, back to 84% after 2010.
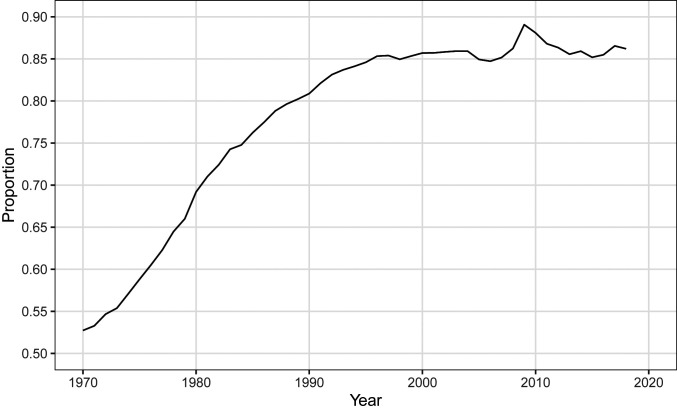
To assess the trend in the gender gap in employment, Fig. 2 shows the ratio of women’s percent employed to men’s percent employed. The ratio rises continuously from 0.53 in 1970 to 0.85 in 1995. The progress toward equality was steepest from 1970 to 1995 as women’s employment went up dramatically and men’s employment went down some. Thereafter, the ratio was quite flat except for a rise and then decline of several points, reflecting, as discussed, that the recession and recovery both affected men more than women. The ratio was 0.86 in 2018.
Fig. 2.
Ratio of percentage of women to men employed in the last week, age 25 to 54, 1970 to 2018. Source: Authors’ computations from IPUMS CPS ASEC samples for 1970 to 2018.
Examining men’s and women’s employment within groups defined by educational attainment, shown in SI Appendix, Fig. S1, reveals that men with a baccalaureate degree or more have seen almost no reduction in their employment, from 92 to 91% between 1970 and 2018. The drop has been much greater among those who are high school graduates but do not have a college degree, from 93 to 82%, and even steeper among men who did not complete high school, from 89 to 74%.* SI Appendix, Fig. S1 further shows that while women’s employment is always much higher for women with more education, it rose in all education groups until ∼2000, and thereafter stalled or went down. In SI Appendix, Fig. S2, the ratio of women’s to men’s employment is disaggregated by education. We see that the ratio of women’s employment to men’s goes up in all education groups until the mid-1990s but has not risen much since then at any education level. Thus, the stall in progress in gender equality on employment is seen at all educational levels.
Educational Attainment.
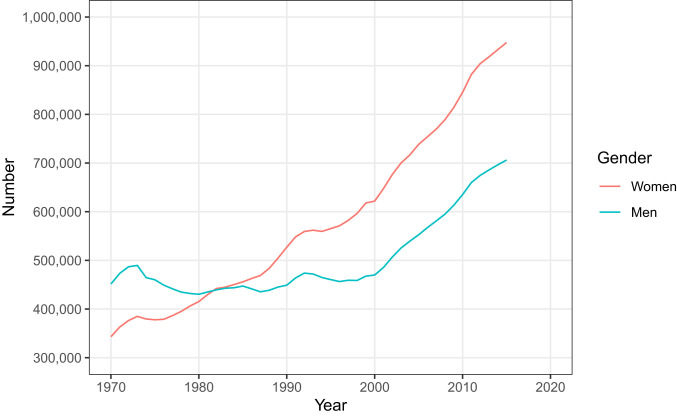
Because educational attainment strongly affects earnings, it is important for gender equality in earnings. As Fig. 3 shows, in 1970, fewer women than men obtained baccalaureate degrees. The next 20 y, men’s numbers remained relatively flat while women’s rose, with the number of women recipients passing men in the mid-1980s. Since 2000, the number getting degrees has risen for both women and men, but more steeply for women.
Fig. 3.
Number of men and women receiving baccalaureate degrees, 1970 to 2015. Source: Authors’ calculation using data from NCES.
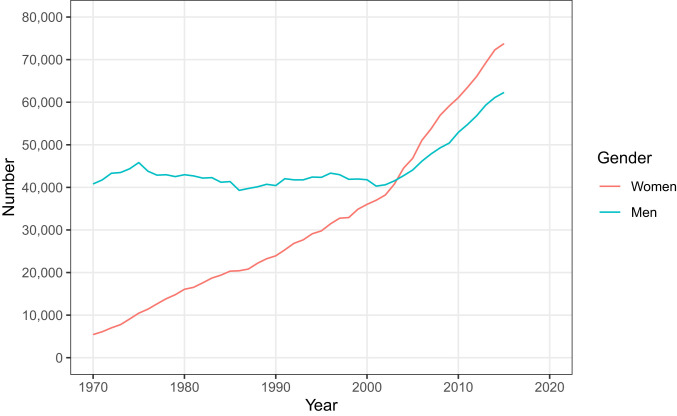
Fig. 4 shows the analogous numbers receiving doctoral degrees, in which we include PhDs, MDs, DDSs, JDs (law degrees), and other doctoral degrees. Men’s numbers were relatively flat between 1970 and 2000, then rose; by contrast, the number of women getting doctoral degrees started way below men’s numbers but rose steeply and continuously, passing men in the early 2000s. Fig. 5 shows the ratio of women’s to men’s baccalaureate and doctoral degrees; both ratios began below 1 and now exceed 1. The ratios have stabilized at above 1 recently.
Fig. 4.
Number of men and women receiving doctoral degrees, 1970 to 2015. Source: Authors’ calculation using data from NCES.
Fig. 5.
Ratio of women to men receiving baccalaureate and doctoral degrees, 1970 to 2015. Source: Authors’ calculation using data from NCES.
Segregation of Fields of Study.
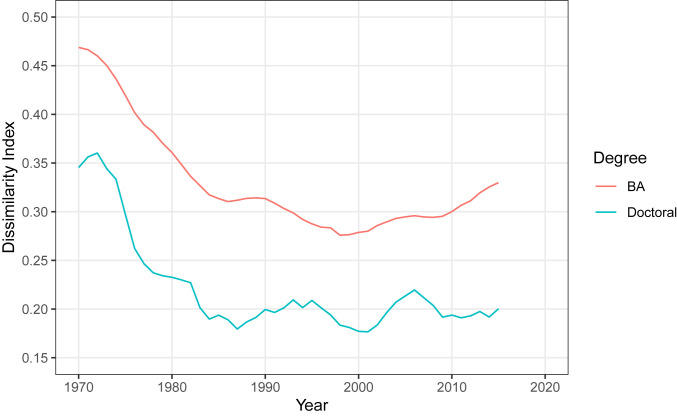
We turn now to gender differences in the fields of study in which women and men get degrees. To examine how segregation changed among those being awarded baccalaureate and doctoral degrees, Fig. 4 presents trends in D, the index of dissimilarity, which can take on values between 0 (no segregation) and 1 (total segregation). For baccalaureate degrees, D was 0.47 in 1970 and a much lower 0.33 in 2015. (For brevity, we refer to the academic year 1970–1971 as 1970, to 2015–2016 as 2015, and so forth.) However, the drop was not continuous; segregation declined until it reached 0.28 in 1998, and has come up again slightly since. For doctoral degrees, D moved from 0.35 in 1970 to a low of 0.18 in 1987 and has not gone lower since, but has risen slightly. Thus, desegregation of both levels of degrees has been substantial but has stalled for 20 or more years. The remaining segregation is important because, for the approximately one-third of adult Americans who have a baccalaureate degree or more, occupation and earnings are strongly affected, although by no means entirely determined, by their field of study (17) (Fig. 6).†
Fig. 6.
Segregation index (D) for baccalaureate and doctoral degree recipients’ fields of study, 1970 to 2015. Source: Authors’ calculation of D (index of dissimilarity) using data from NCES.
Occupational Segregation.
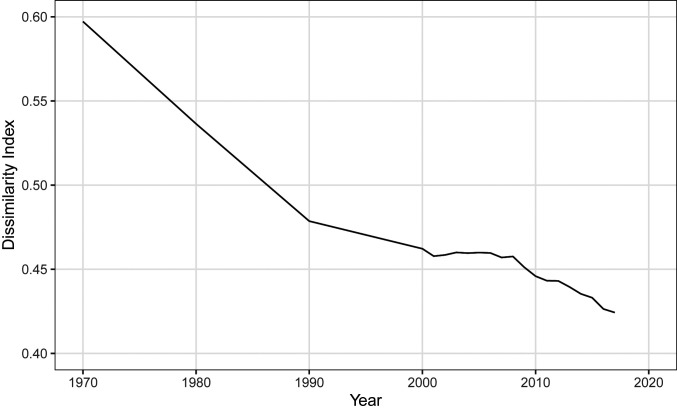
Next, we examine trends in how segregated occupations are, using D, the same measure used above to assess the segregation of fields of study. As Fig. 7 shows, segregation of occupations has fallen steadily since 1970, with D moving from 0.60 to 0.42. However, it moved much faster in the 1970s and 1980s than it has since 1990; segregation dropped by 0.12 in the 20-y period after 1970, but by a much smaller 0.05 in the longer 26-y period after 1990.‡ Occupational segregation is important in part because it is a large contributor to the gender gap in pay (ref. 8, p. 21, and refs. 12 and 19).
Fig. 7.
Segregation index (D) for occupations, 1970 to 2017. Source: Authors’ calculation of D (index of dissimilarity) from IPUMS decennial Census samples for 1970 to 2000 and ACS samples for 2001 to 2017. Uses three-digit occupations collapsed to 77 categories.
Earnings.
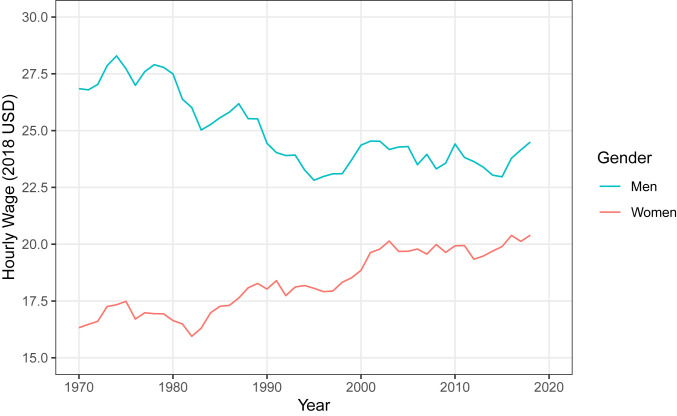
A key indicator of gender inequality is the pay gap. We focus here on the hourly earnings of full-time workers. First, we show trends separately for men’s and women’s median hourly earnings in Fig. 8. Earnings are in constant 2018 dollars, adjusted by the Consumer Price Index (CPI). Men’s median hourly earnings were approximately $27 to $28/h in the 1970s, then fell to below $23/h by the mid-1990s, rising again in the late 1990s boom, declining in the Great Recession, and rising some since; despite the fluctuations, the median has always been between $22 and $25/h in 2018 dollars since the mid-1990s.§,¶ Women’s median earnings have always been lower than men’s. During the 1970s, they were approximately $17/h. They began to rise in the early 1980s for the rest of the decade, flattened, then rose again in the late 1990s and early 2000s, and since have been relatively flat. Women’s earnings fell less than men’s in the Great Recession.
Fig. 8.
Median hourly wage of full-time working women and men, age 25 to 54, employed in the last week, 1970 to 2018. Source: Authors’ computations from IPUMS CPS ASEC samples for 1970 to 2018.
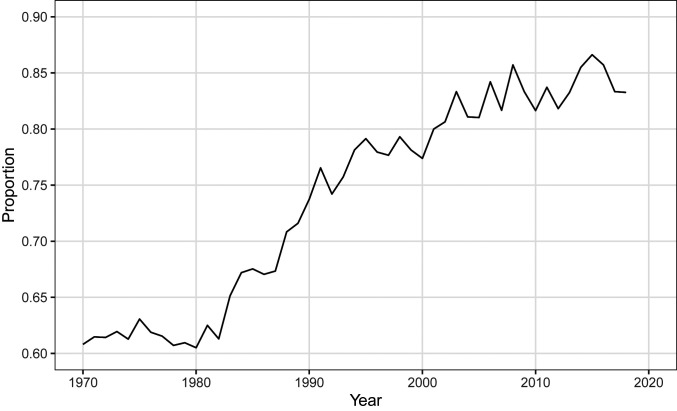
To examine gender inequality in pay, Fig. 9 shows the trend in the ratio of women’s to men’s median hourly earnings among full-time workers, which was fairly stable at slightly above 0.60 in the 1970s, then rose dramatically to 0.74 by 1990. The ratio has shown a net rise in each decade since 1990 but at a much slower rate than was observed in the 1980s. By 2018, women earned 83% what men did at the median. In percentage point increase, the rise was less in the 28 y of 1990 to 2018 than it was in the single decade of the 1980s.
Fig. 9.
Ratio of women’s to men’s median hourly wage among full-time workers employed in the last week, age 25 to 54, 1970 to 2018. Source: Authors’ computations from IPUMS CPS ASEC samples for 1970 to 2018.
The analyses of median hourly earnings above include only those working full-time, defined as at least 35 h/wk. If instead we examine all workers, full- and part-time, as shown in SI Appendix, Fig. S3, the results are very similar, mainly because a large majority of US women and men work full-time. If we further limit the sample, not just to full-time workers, but to those who are full-time and worked all of the last year, and examine annual rather than hourly earnings, we also see a slowdown in earnings convergence, as SI Appendix, Fig. S4 shows. This measure too went up much more in the 1980s than any other subsequent decade, moving from 0.58 to 0.70 in the one decade of the 1980s, a larger percentage point increase than the increase from 0.70 to 0.81 that occurred across the almost three decades between 1990 and 2018. Thus, the conclusion of continuing but slowed progress is reached across measures and across samples.
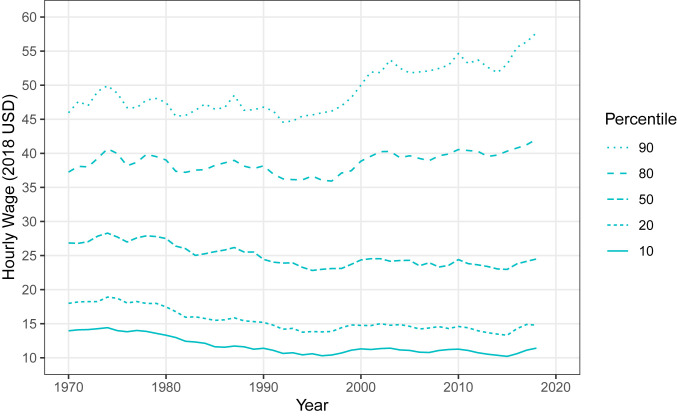
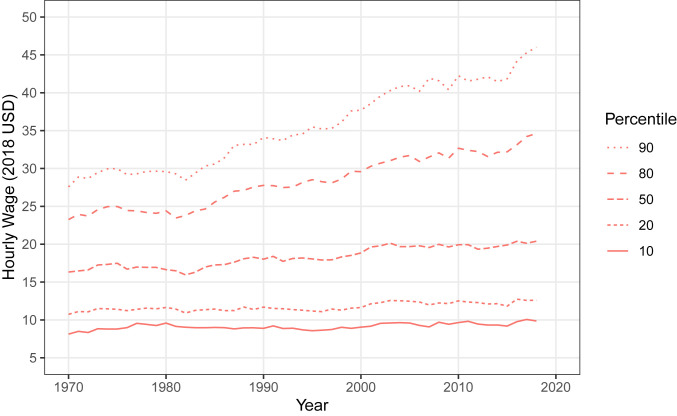
We next examine earnings at various percentiles of each gender’s distribution. Fig. 10 shows that men’s earnings at the 10th and 20th all declined a few dollars an hour, and after the CPI adjustment, at the 50th percentile there was a slight decline. Men at the 80th percentile gained about $5/h in net across the nearly 50-y period. However, men at the 90th percentile gained nearly $12/h across the same period. The rise at the top and decline at the bottom created substantially increased inequality among men, a focus of much recent research (20, 21). Fig. 11 shows increasing inequality among women as well, as past research has shown (20, 22). By comparing men and women at the same percentile of their respective distributions, Figs. 10 and 11 show that, unlike men at the bottom percentiles, women at the 10th and 20th percentiles of their distribution gained slightly. Women at the median gained more, about $4/h across the almost 50-y period. Women at the 80th percentile gained approximately $11/h, while women at the 90th percentile gained $18/h. As was true for men, women’s earnings toward the top of the distribution got farther and farther away from the earnings of those at the bottom, and even those at the median. However, unlike men, women at the bottom did not see a net decline.
Fig. 10.
Hourly wage of full-time working men, age 25 to 54, employed in the last week, at 10th, 20th, 50th, 80th, and 90th percentile of distribution, 1970 to 2018. Source: Authors’ computations from IPUMS CPS ASEC samples for 1970 to 2018.
Fig. 11.
Hourly wage of full-time working women, age 25 to 54, employed in the last week, at 10th, 20th, 50th, 80th, and 90th percentile of distribution, 1970 to 2018. Source: Authors’ computations from IPUMS CPS ASEC samples for 1970 to 2018.
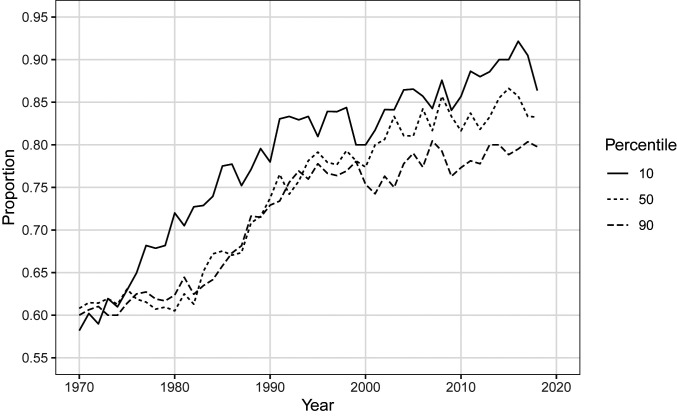
We next examine whether gender inequality in pay is more extreme toward the top, middle, or bottom of men’s and women’s respective distributions, showing the ratio of the earnings at the 10th percentile of women’s distribution to the earnings of men at their 10th percentile, and analogously for the median (50th) and 90th percentile. As Fig. 12 shows, in 1970, women earned ∼60% what men did regardless of the percentile of the distribution examined. However, in all years since the middle 1970s, the most gender equality (indicated by a higher ratio of women’s pay to men’s pay) was found at the 10th percentile, toward the bottom of the distribution.
Fig. 12.
Ratio of women’s to men’s hourly wage at the 10th, 50th, and 90th percentile of their distributions, for full-time workers employed in the last week, age 25 to 54, 1970 to 2018. Source: Authors’ computations from IPUMS CPS ASEC samples for 1970 to 2018.
As regards how trends in the ratio of women’s to men’s wages differ between top, middle, and bottom of the distribution, Fig. 12 shows the highest increase in the ratio at the bottom, an intermediate amount at the middle, and the least at the top. This is not because men at the top gained more in pay than women at the top—computations from Figs. 10 and 11 actually show that women’s wages at their 90th percentile have gone up more (in either dollars or percentage change) than men’s wages at their 90th percentile went up. However, the extent to which women’s wage increase exceeded men’s was even greater at each gender’s respective 10th percentile than at the 90th percentile, and this accounts for the increasing distance between the ratios for the 90th and 10th percentiles across most of the years in Fig. 12. In sum, the female-to-male wage ratio, our measure of gender inequality, rose more for those at the bottom than the top (with intermediate change for those in the middle). (See ref. 12 for a similar finding using a different dataset.)
A final conclusion from Fig. 12 regards whether our conclusion that progress toward gender equality has slowed holds at the top, middle, and bottom. The figure shows that it does; at each percentile shown, the increase in the women’s to men’s earnings ratio has not been as steep since 1990 as it was in the 1980s. The slowdown in progress occurred at the top, middle, and bottom. In a related analysis, SI Appendix, Fig. S6 shows a slowdown or stall in progress toward gender equality in earnings among full-time workers at each education level.
Discussion
Our analysis has shown substantial reductions in gender inequality on all indicators. However, on every indicator considered, women’s progress relative to men has slowed, and in some cases progress has stalled entirely. In every case except educational attainment, where women are now ahead of men, a slowdown or stall has occurred at a time when there was still substantial gender inequality favoring men. Here, we review our findings and use past research on causes of gender inequality to speculate about what would need to change to hasten the reduction of inequality.
Women’s employment has stalled out at 70 to 75% for decades. The ratio of women’s to men’s employment rose dramatically from 0.53 in 1970 to 0.85 in 1995 but has changed little since. The long-term increase in the ratio reflects women’s increasing and men’s declining employment, and the stall in the ratio mainly reflects a stall in the growth of women’s employment.
Women’s attainment of college and advanced degrees has increased absolutely and relative to men’s. The ratio of women to men getting degrees went from 0.76 to 1.34 for baccalaureate degrees and from 0.13 to 1.18 in for doctoral degrees between 1970 and 2015. The ratios have been approximately flat since 2000 for baccalaureate and since 2008 for doctoral degrees, but women had already achieved more than equality before the ratios stabilized.
While women have surpassed men in amount of education attained, there has been nothing like convergence in the fields of study in which men and women get degrees. For baccalaureate degrees, D, the measure of segregation, which ranges from 0 (complete integration) to 1 (complete segregation), fell from 0.47 in 1970 to 0.28 in 1998, and has not gone down since, but rather, segregation has risen slightly. For doctoral degrees, segregation went from 0.35 in 1970 to a low of 0.18 in 1987 and has hovered slightly higher since. In neither case has there been any net reduction in segregation for over 20 y.
Segregated fields of study contribute to occupational gender segregation. The segregation of occupations has fallen substantially since 1970, moving from 0.60 to 0.42. However, it moved much faster in the 1970s and 1980s than it has since 1990. Thus, there has been a slowdown, but not a complete stall of occupational desegregation.
All of the trends we have considered affect the gender gap in pay; individuals’ pay is affected by their amount of education, field of study, occupation, and years of employment experience. The gap is also affected by various forms of gender discrimination by employers—in hiring, pay differences within jobs, and the relative pay levels set in predominantly female versus predominantly male jobs. Reflecting changes in all these factors, our main measure of gender earnings inequality, the ratio of women’s to men’s median hourly earnings among full-time workers, went up strongly from 0.61 in 1980 to 0.83 in 2018, with much faster progress in the 1980s than in decades since 1990. We compared results using other measures (hourly earnings for all workers, or annual earnings for those working full-time year-round). Whatever the measure, the closing of the gender gap in pay, assessed by upward movement in the ratio of women’s to men’s pay at the median, has slowed since 1990, although progress continues. Moreover, the slowdown of progress toward equality in earnings was also seen toward the bottom and top of the earnings distribution and at all educational levels.
We have shown a slowing of progress toward equality and for some indicators a complete stall of progress in women’s relative status. Discovering why progress has slowed or stalled is beyond the scope of our analysis, but we offer a few speculations, based on past research on causes of gender equality, about what would be necessary for further progress. Further change will require deeper changes in both cultural attitudes and institutional practices.
Change in the gender system has been deeply asymmetric; women’s entrance to careers came more readily than changes in men’s roles at home (15). This can be seen in our analysis that shows a much larger increase in women’s employment than decrease in men’s employment, implying that there was nothing close to an increase of one stay-at-home husband for every one increased woman employed. The asymmetry is also seen in other research showing a much larger increase in women’s paid work hours than increase in men’s family work (housework, child care, and shopping) (ref. 23, tables 5A.1 and 5A.2, data on married mothers and fathers).
This asymmetry in behavioral change by women and men is reflected in cultural attitudes as well. There is still a strong norm eschewing anything but full-time paid work for husbands (24); this creates pressure on women to do more family work than men, and adjust their careers accordingly. Given that most women form families with men, it may be difficult to close the remaining gender gap in pay without increases in men’s domestic work or public provision of child care. Public provision of child care could strongly impact the employment of working-class women, as their jobs often pay less than or little more than the costs of child care for their children. Institutional change in employer policies that eased both men’s and women’s ability to combine family with work would also help close the gender gap in pay, provided that such policies are not used only by women, perpetuating the expectation that women will carry most of the responsibility of care. Although an increasing proportion of marriages feature a woman earning more than her husband, there is substantial evidence that many couples try to avoid this (25); gender inequality within couples would be eased by cultural change that led people to accept change in men’s as well as women’s roles, and to accept marriages in which women earn more than their husbands as unremarkable.
Cultural change may also be required to tackle the strong level of sex segregation in fields of study and in occupations. For several decades, girls’ high school math coursework and scores have been as good as boys’ so they are unlikely to explain gender differences in baccalaureate majors (26). Nor does women’s anticipation of more family work explain gender differences in choice of major (ref. 4, chapter 8). However, this does not mean the explanation lies entirely with policies of universities; indeed, most universities allow any student to declare a major in any field (sometimes with grade point average requirements, which if anything advantages women). Gender differences in fields of study may arise from lingering essentialist beliefs about differences in men and women’s natures (27). These beliefs create external social pressures on men and women to choose gender-typical fields of studies and careers that may also be internalized as norms. Whether the force is external or internal, the result is a different (although overlapping) distribution of choices by men and women. Gender differences in job choices may also reflect differences in preferences (finding gender-typical activities more interesting and meaningful) that originate in gendered socialization. Such beliefs and preferences also incline men and women who do not complete college degrees in favor of gender-typical jobs. Changes in these beliefs or preferences would enhance equality from the supply-side of labor markets. However, culture does not only affect the supply side of labor markets. Such beliefs about what men and women should do or, are better at, or prefer, when held by employers and managers, lead to discriminatory hiring, placement, and promotion. Thus, changing these beliefs would lessen discrimination by gender as well as reduce supply-side forces promoting segregation.
Institutional change is necessary as well. Policy changes that reduce gender bias by employers would also help further reduce occupational segregation and the gender gap in pay. At the time that gender discrimination in hiring and pay was outlawed in the 1960s, many firms had explicit policies of not hiring women in certain jobs, and sex preferences were stated in advertisements. Such overt policies are largely gone. However, more subtle hiring discrimination probably persists, although it is hard to measure. Also, policies that reduced employer discrimination against mothers would help shrink the gender pay gap; research has documented hiring discrimination against mothers (but not fathers) (28). Gender biases may affect pay differences within jobs as well despite how simple “equal pay for equal work” sounds; one study showed men getting higher raises than women in the same company even when they received the same quantitative evaluations by their supervisors (29).
A substantial part of the gender gap in pay is between occupations (9, 12, 19). This portion could be reduced by supply or demand-side changes that reduced segregation. This between-occupation portion of the pay gap could also be reduced by policies that successfully remove gender bias from decisions about the relative pay levels of predominantly male and predominantly female jobs. There is strong suggestive evidence that employers take the sex composition of jobs into account when setting their pay levels; studies find lower relative pay in predominantly female occupations than can be explained by their skill requirements or working conditions (30, 31). This issue, called “comparable worth” or “pay equity” in the 1990s, never led to legislation, so it is a type of discrimination that is generally not illegal in the United States.
In sum, without deliberate efforts to promote both cultural and institutional change along the lines we have discussed, progress toward gender equality may remain slow or stalled.
Materials and Methods
We provide trend data from 1970 to circa 2018 on several important indicators with which social scientists have gauged gender inequality: employment, pay, educational attainment, gender segregation of fields of study for baccalaureate and doctoral degrees, occupational gender segregation, and hourly and annual earnings.
For employment and earnings, we use data for each year from 1970 to 2018 from the Current Population Surveys (CPSs). For occupational sex segregation, where a large sample is crucial, we use Census data for 1970, 1980, 1990, 2000, and thereafter every year through 2017 from the American Community Study (ACS).# For the number of women and men (and ratio of number of women to men) getting baccalaureate and doctoral degrees in all fields combined, and the extent of segregation by gender in the fields in which these baccalaureate and doctoral degrees were awarded, we use data from the National Center for Education Statistics (NCES), for every academic year from 1970–1971 to 2015–2016, the latest year available.
Analyses of Employment and Earnings.
Data source and sample.
These analyses use data from Integrated Public Use Microdata Series (IPUMS) samples of the Annual Social and Economic Supplement (ASEC) of the CPS, 1970 to 2018.
For our analyses of employment and earnings, we included individuals between 25 and 54 y old (n = 3,371,391); these are ages when few individuals are still in school and few have retired yet. Thus, most people at these ages are employed, unless they cannot find a job (whether they are still looking or have given up) or are not seeking paid work because they are taking care of children or elders.
When presenting median or other percentiles of hourly earnings, we limit the sample to individuals employed full-time in the past week and further exclude individuals who are self-employed, in the armed forces, or who reported 0 wage and salary earnings (resulting n = 1,979,268). Medians are preferred to means because the latter are strongly affected by the strong and increasing rightward skew of earnings.
SI Appendix compares results from the analyses on earnings just described to those from a more comprehensive sample of all those employed least week, whether full-time or not. SI Appendix also compares these analyses to trends for median annual earnings among full-time year-round workers; the analysis of annual earnings limits the sample to individuals between 25 and 54 y old who are full-time, year-round workers (i.e., working 35 or more hours per week, and 50 or more weeks per year) and excludes individuals who are self-employed, in the armed forces, or reported 0 wage and salary earnings (n = 1,763,891).
Measures of employment and earnings.
For employment, we use the CPS variable providing information on whether the individual reported being employed in the last week (whether full- or part-time).
For all of our measures of earnings, we begin from annual earnings from wages or salaries reported by respondents. The Census Bureau top-codes annual earnings to provide confidentiality for extremely high earners. Because CPS top-coding procedures vary from 1970 to 2018, we recoded any earnings above a given year’s top-code threshold to the appropriate top-code threshold value. We then multiplied these top-coded income values for each sample by 1.5.|| We converted the resulting measure of annual earnings to constant 2018 dollars using the CPI.**
Our main analyses of the pay gap use hourly wage among full-time workers, constructed from the annual earnings measure described above and information on weeks and hours of employment. Due to data availability, our construction of hourly wage is different for 1970 to 1975 and 1976 onward. For 1970 to 1975, we construct hourly wage by dividing annual earnings by the number of weeks worked in the last year and dividing the product by the total hours worked in the last week; since hours worked was presented in intervals, we used the midpoint of the interval. For 1976 onward, the data on hours worked were in number of hours, not intervals, so we did not have to estimate with a midpoint, and, more important, the question on hours worked asked about usual hours worked per week in the last year, rather than hours worked last week. Thus, changes in the earnings or the gender ratio of earnings around 1975 should be interpreted with caution as they may be an artifact of this change in measurement.
Descriptive analyses.
For each year, we show the percentage of men and women (age 25 to 54) employed for pay the week before the survey, as well as the ratio of women’s to men’s percent employed. For hourly wage, we present the median, as well as the 10th, 20th, 80th, and 90th percentiles of the wage distribution, separately for each gender at each year among those 25 to 54. We then examine the ratio of women’s to men’s earnings at each year for the 10th, 50th, and 90th percentiles. All descriptive analyses employ CPS sample weights.††
SI Appendix shows supplementary analyses examining trends in employment and wages when dividing respondents by education. For these, we used the CPS measure of educational attainment, assuming completion of grade 12 implies a high school degree and completion of 4 y of higher education implies a baccalaureate degree. We thus use three categories: less than a high school degree, a high school degree,‡‡ and a baccalaureate degree or more.
Regression adjustment for demographic composition.
Analyses in SI Appendix supplement our descriptive analyses by performing adjustments that remove effects of compositional change across the years examined. With separate analyses for men and women, we regression-adjust for changes in age (treated as continuous), age squared, race (white, black, Asian, Native American, other), and Hispanic ethnicity. To produce adjusted versions of the percentages or percentiles described above, we used logistic regressions predicting employment, and quantile regressions predicting wages at the various percentiles. These regressions were pooled across years and contained indicator variables for each year, as well as the factors for which we were adjusting, listed above. Regression analyses were weighted by CPS sample weights. Using parameters from these regressions, and (via the margins command in STATA) an average-marginal-effects approach, we produced predicted, compositionally adjusted values for each of the dependent variables for each year and each gender. We then computed female-to-male ratios of these adjusted estimates to assess gender gaps. SI Appendix, Figs. S7 and S8 show adjusted and unadjusted employment trends and the trend in the ratio of percentage of women to men employed; adjusted and unadjusted trends are virtually identical. SI Appendix, Figs. S9 and S10 show how the demographic adjustment affects estimated trends in median wages for full-time men and women, and estimated trends in the gender pay gap at the median. The regression-adjusted results also show a slowdown in the convergence of women’s and men’s wages. SI Appendix, Figs. S11 and S12 show the adjusted results for trends in men’s and women’s wages at the 10th, 20th, 50th, 80th, and 90th percentiles of the distributions, and SI Appendix, Fig. S13 shows the gender gap at the 10th, 50th, and 90th. (These are analogous to the unadjusted Figs. 10 and 11 above.) They do not change our basic conclusion of a slowdown in convergence of women’s and men’s pay.
Analysis of Educational Attainment and Segregation of Fields of Study.
We use data from the NCES on the number of men and women getting baccalaureate and doctoral degrees in each academic year from 1970–1971 to 2015–2016 (32) Doctoral degrees include PhD, MD, DDS, JD, and a few other doctoral-level professionally oriented degrees. We show the number of men and women getting such degrees. Then, to show the trend in women’s and men’s relative educational attainment, we calculate the ratio of the number of women to men among those receiving baccalaureate and doctoral degrees in all fields combined for each year.
To assess the level of segregation by gender in fields of study, we use data from NCES that report the total number of men and women who received each of baccalaureate and doctoral degrees in each academic year from 1970–1971 to 2015–2016 in the following 17 fields: agriculture and natural resources; architecture and related services; biological and biomedical sciences; business; communication, journalism, and related programs and in communications technologies; computer and information sciences; education; engineering technologies; English language and literature/letters; foreign languages and literatures; health professions and related programs; mathematics and statistics; physical sciences and science technologies; psychology; public administration and social services; social sciences and history; and visual and performing arts (ref. 33, tables 325.10 to 325.95). While more detailed fields would be preferred, this is the most detailed categorization of fields for which NCES provides data on consistent categories for years 1970 to 2016.
For both baccalaureate and doctoral degrees, we compute the index of dissimilarity (D) (34) for each year. It is the mostly commonly used measure of segregation of two groups across multiple units (here fields of study). The scale can take on values from 0 (no segregation, meaning women are the same proportion of every field that they are of all fields combined for that year) to 1 (perfect segregation, with no field having both men and women in it). D is often explained in a shorthand way as the percentage of women (men) who would have to “trade” fields with a man (woman) to achieve perfect integration, the state in which women’s representation in each field is the same as their representation in all fields combined. This shorthand describes only the numerator of D, which is then divided by the maximum number of such integrative trades possible starting from perfect segregation. The denominator depends on the relative number of men and women in all fields combined; it is maximized when men and women are each 50% of the population of those getting degrees across all fields combined. D is implicitly weighted; big fields count more, thus telling us how segregated the experience of the average person is.
As a supplemental analysis, in SI Appendix, we also calculate A, an alternative measure of segregation devised by Grusky and Charles (36), which is based upon log linear models. (SI Appendix, Figs. S14 and S15 compare results using D and A for baccalaureate and doctoral degrees, respectively.) Our broad conclusion that desegregation has stalled holds with this measure as well.
Analysis of Segregation of Occupations.
To examine trends in occupational gender segregation, we use data from IPUMS decennial Census samples for 1970, 1980, 1990, and 2000, and American Community Survey (ACS) samples for 2001 through 2016. For Census and ACS samples, IPUMS provides a harmonized occupation variable, OCC1990, which reflects a modified version of the Census Bureau’s 1990 three-digit (detailed) occupational classification scheme. Because some occupations in this scheme did not exist as classification possibilities for some particular years, and we wanted to compute indices of segregation over consistent categories for each year, we collapsed OCC1990 into Weeden and Grusky’s 82-category occupational microclass scheme (ref. 35, specifically table A2). Using all employed respondents who report an occupation (n = 25,369,733), and detailed occupations collapsed into the 82 categories described above, we deleted 5 categories, leaving 77 of Weeden and Grusky’s 82 microclasses, because only these 77 have at least one observation in each sample year. Using these constant 77 occupational categories, we calculate the index of dissimilarity, the same measure we use to examine segregation of fields of study and described above, to assess change in occupational sex segregation. In SI Appendix, Fig. S16, we also calculate A, an alternate measure of segregation (36), and it shows a similar trend of reduced segregation, but at a slower rate in later than earlier decades.
Data Deposition.
The data are publicly available. Code for data analysis is archived on Open Science Framework (https://osf.io/kx94e/).
Supplementary Material
Footnotes
The authors declare no competing interest.
Data deposition: Code and links to data (which are publicly available) have been deposited at Open Science Framework (https://osf.io/kx94e/).
*Men’s falling employment rebounded slightly after 2010 in all education groups, due probably to the postrecession recovery.
†For the percentage of American adults with a baccalaureate degree, see ref. 18.
‡Blau et al. (10) use a different, gender-specific, method for harmonizing occupational categories across decades, and do it so as to preserve hundreds of detailed occupational categories, whereas we collapse all occupations to just 77 categories. Our use of less detailed categories yields a lower D in any one year. For example, if we use the 320 detailed Census categories in our data for 2017, D is 0.48, compared to the 0.42 we report here when collapsing those 320–77 broader categories. However, despite differences in categorization method, our conclusion of a slowdown in desegregation across decades is consistent with what Blau et al. (10) report for 1970 to 2009.
§Thus, Fig. 8 implies that the man at the middle of the distribution in 2018 earned less, after adjusting for inflation, than the man at the middle in 1970. However, some argue that the CPI overstates inflation, and suggest alternative indices (37, 38). Fortunately for our conclusions about gender inequality in pay, how inflation is (or is not) adjusted for has no effect on the trend in the ratio of women’s to men’s pay.
¶While we showed that the proportion of men who are not employed has gone up, especially among the less educated, most scholars believe that this is not primarily a result of more couples deciding that men would become stay-at-home dads, but rather reflects the deterioration of the pay of jobs available to men without a college degree (39); for a dissenting view, but one that also does not see acceptance of stay-at-home dads as the source, see ref. 38.
#Specifically, we use the IPUMS 1% state form 1 sample for 1970, 5% state samples for 1980 and 1990, 5% sample for 2000, and 1% samples for 2001 through 2017.
||We follow Autor et al. (20) in using the convention of multiplying by 1.5, which approximates what is achieved by assuming a Pareto distribution for values in high percentiles.
**See https://data.bls.gov/cgi-bin/cpicalc.pl. For a discussion of limitations of the CPI, and how it may overstate inflation and thus lead to understating wage growth, see refs. 37 and 40.
††A small number of CPS weights are negative. We recoded any negative weights to 0.
‡‡Anyone with 12, 13, 14, or 15 y of education is classified as “high school,” so some of these individuals have attended some college.
See QnAs on page 6963.
This article contains supporting information online at https://www.pnas.org/lookup/suppl/doi:10.1073/pnas.1918891117/-/DCSupplemental.
Change History
June 29, 2021: The labels of the Y axes and color keys of Figures 3 and 4 have been updated.
References
- 1.Cotter D., England P., Hermsen J., Moms and jobs: Trends in mothers’ employment and which mothers stay home. Council on Contemporary Families Briefing Paper (2008). https://contemporaryfamilies.org/wp-content/uploads/2013/10/2007_Briefing_Cotter_Moms-and-jobs.pdf. Accessed 27 December 2019.
- 2.Goldin C., Katz L., The power of the pill: Oral contraceptives and women’s career and marriage decisions. J. Polit. Econ. 110, 730–770 (2002). [Google Scholar]
- 3.Bailey M. J., More power to the pill: The impact of contraceptive freedom on women’s labor supply. Q. J. Econ. 121, 289–320 (2006). [Google Scholar]
- 4.DiPrete T. A., Buchmann C., The Rise of Women: The Growing Gender Gap in Education and What It Means for American Schools (Russell Sage Foundation, New York, NY, 2013). [Google Scholar]
- 5.England P., et al., Why are some academic fields tipping toward female? The sex composition of U.S. fields of doctoral degree receipt, 1971–2002. Sociol. Educ. 80, 23–42 (2007). [Google Scholar]
- 6.England P., Li S., Desegregation stalled: The changing gender composition of college majors, 1971–2002. Gend. Soc. 20, 657–677 (2006). [Google Scholar]
- 7.Dobbin F., Inventing Equal Opportunity (Princeton University Press, Princeton, NJ, 2009). [Google Scholar]
- 8.Cotter D. A., Hermsen J. M., Vanneman R., Gender Inequality at Work (Russell Sage Foundation, New York, NY, 2004). [Google Scholar]
- 9.Weeden K. A., Newhart M., Gelbgiser D., Occupational Segregation, Pathways Magazine, State of the Union 2018 Issue (Stanford Inequality and Poverty Center, 2018). [Google Scholar]
- 10.Blau F. D., Brummund P., Liu A. Y., Trends in occupational segregation by gender 1970–2009: Adjusting for the impact of changes in the occupational coding system. Demography 50, 471–492 (2013). [DOI] [PubMed] [Google Scholar]
- 11.Institute for Women’s Policy Research , The gender wage gap: 2017. IWPR Fact Sheet C473 (2018). https://iwpr.org/wp-content/uploads/2018/09/C473.pdf. Accessed 27 December 2019.
- 12.Blau F., Kahn L., The gender wage gap: Extent, trends, and explanations. J. Econ. Lit. 55, 789–865 (2017). [Google Scholar]
- 13.Cotter D., Hermsen J. M., Vanneman R., The end of the gender revolution? Gender role attitudes from 1977 to 2008. Am. J. Sociol. 117, 259–289 (2011). [DOI] [PubMed] [Google Scholar]
- 14.Scarborough W. J., Sin R., Risman B., Attitudes and the stalled gender revolution: Egalitarianism, traditionalism, and ambivalence from 1977 through 2016. Gend. Soc. 33, 173–200 (2019). [Google Scholar]
- 15.England P., The gender revolution: Uneven and stalled. Gend. Soc. 24, 149–166 (2010). [Google Scholar]
- 16.England P., Reassessing the uneven gender revolution and its slowdown. Gend. Soc. 25, 113–123 (2011). [Google Scholar]
- 17.Kim C., Tamborini C. R., Sakamoto A., Field of study in college and lifetime earnings in the United States. Sociol. Educ. 88, 320–339 (2015). [DOI] [PMC free article] [PubMed] [Google Scholar]
- 18.US Census Bureau , Highest educational levels reached by adults in the U.S. since 1940. https://www.census.gov/newsroom/press-releases/2017/cb17-51.html. Accessed 10 December 2018.
- 19.Petersen T., Morgan L. A., Separate and unequal: Occupation-establishment sex segregation and the gender wage gap. Am. J. Sociol. 101, 329–365 (1995). [Google Scholar]
- 20.Autor D. H., Katz L. F., Kearney M. S., Trends in US wage inequality: Revising the revisionists. Rev. Econ. Stat. 90, 300–323 (2008). [Google Scholar]
- 21.Western B., Rosenfeld J., Unions, norms, and the rise in U.S. wage inequality. Am. Sociol. Rev. 76, 513–537 (2011). [Google Scholar]
- 22.Morris M., Western B., Inequality in earnings at the close of the twentieth century. Annu. Rev. Sociol. 25, 623–657 (1999). [Google Scholar]
- 23.Bianchi S., Robinson J. P., Milkie M. A., Changing Rhythms of American Family Life (Russell Sage Foundation, New York, NY, 2006). [Google Scholar]
- 24.Killewald A., García-Manglano J., Tethered lives: A couple-based perspective on the consequences of parenthood for time use, occupation, and wages. Soc. Sci. Res. 60, 266–282 (2016). [DOI] [PubMed] [Google Scholar]
- 25.Bertrand M., Kamenica E., Pan J., Gender identity and relative income within households. Q. J. Econ. 130, 571–614 (2015). [Google Scholar]
- 26.Xie Y., Shauman K. A., Women in Science: Career Processes and Outcomes (Harvard University Press, Cambridge, MA, 2003). [Google Scholar]
- 27.Charles M., Bradley K., Indulging our gendered selves? Sex segregation by field of study in 44 countries. Am. J. Sociol. 114, 924–976 (2009). [DOI] [PubMed] [Google Scholar]
- 28.Correll S. J., Benard S., Paik I., Getting a job: Is there a motherhood penalty? Am. J. Sociol. 112, 1297–1338 (2007). [Google Scholar]
- 29.Castilla E. J., Gender, race, and meritocracy in organizational careers. Am. J. Sociol. 113, 1479–1526 (2008). [DOI] [PubMed] [Google Scholar]
- 30.Kilbourne B., England P., Farkas G., Beron K., Weir D., Returns to skills, compensating differentials, and gender bias: Effects of occupational characteristics on the wages of white women and men. Am. J. Sociol. 100, 689–719 (1994). [Google Scholar]
- 31.Levanon A., England P., Allison P., Occupational feminization and pay: Assessing causal dynamics using 1950-2000 Census data. Soc. Forces 88, 865–892 (2009). [Google Scholar]
- 32.National Center for Education Statistics , Table 318.10. Degrees conferred by postsecondary institutions, by level of degree and sex of student: Selected years, 1869-70 through 2028-29. https://nces.ed.gov/programs/digest/d18/tables/dt18_318.10.asp?current=yes. Accessed 10 November 2018.
- 33.National Center for Education Statistics , Section 325: Trends in degrees by field. https://nces.ed.gov/programs/digest/current_tables.asp. Accessed 10 November 2018.
- 34.Duncan O. D., Duncan B. D., A methodological analysis of segregation indexes. Am. Sociol. Rev. 20, 210–217 (1955). [Google Scholar]
- 35.Jonsson J. O., Di Carlo M., Brinton M. C., Grusky D. B., Pollak R., Microclass mobility: Social reproduction in four countries. Am. J. Sociol. 114, 977–1036 (2009). [DOI] [PubMed] [Google Scholar]
- 36.Grusky D. B., Charles M., The past, present, and future of sex segregation methodology. Demography 35, 497–504 (1998). [PubMed] [Google Scholar]
- 37.Abraham K. G., Greenlees J. S., Moulton B. R., Working to improve the consumer price index. J. Econ. Perspect. 12, 27–36 (1998). [Google Scholar]
- 38.Winship S., Declining prime-age male labor force participation: Why demand- and health-based explanations are inadequate. Mercatus Research Paper (2017). 10.2139/ssrn.3046868. Accessed 27 December 2019. [DOI]
- 39.White House , The long-term decline in prime-age male labor force participation (2016). https://obamawhitehouse.archives.gov/sites/default/files/page/files/20160620_cea_primeage_male_lfp.pdf. Accessed 28 December 2019.
- 40.Winship S., Debunking disagreement over cost of living adjustment. Forbes, 15 June 2015. https://www.forbes.com/sites/scottwinship/2015/06/15/debunking-disagreement-over-cost-of-living-adjustment/#1ff3b2672eb4. Accessed 28 December 2019.
Associated Data
This section collects any data citations, data availability statements, or supplementary materials included in this article.


