

Abstract
PI3K‐Akt‐FoxO‐mTOR signaling is the central pathway controlling growth and metabolism in all cells. Ubiquitination of the protein kinase Akt prior to its phosphorylation is required for PI3K‐Akt activity. Here, we found that the deubiquitinating (DUB) enzyme USP1 removes K63‐linked polyubiquitin chains on Akt to restrict PI3K‐Akt‐FoxO signaling in mouse muscle during prolonged starvation. DUB screening platform identified USP1 as a direct DUB for Akt, and USP1 depletion in mouse muscle increased Akt ubiquitination, PI3K‐Akt‐FoxO signaling, and glucose uptake during fasting. Co‐immunoprecipitation and mass spectrometry identified disabled homolog‐2 (Dab2), the tuberous sclerosis complex TSC1/TSC2, and PHLPP1 as USP1 bound proteins. During starvation, Dab2 is essential for Akt recruitment to USP1‐TSC1‐PHLPP1 complex, and for PI3K‐Akt‐FoxO inhibition. Surprisingly, USP1 limits TSC1 levels to sustain mTOR‐mediated basal protein synthesis rates and maintain its own protein levels. We propose that Dab2 recruits Akt to USP1‐TSC1‐PHLPP1 complex to efficiently terminate the transmission of growth signals when cellular energy level is low.
Keywords: Dab2, fasting, muscle atrophy, PI3K‐Akt signaling, USP1
Subject Categories: Metabolism, Musculoskeletal System, Signal Transduction
USP1 regulates PI3K‐Akt‐FoxO and mTOR signalling in the muscle during prolonged starvation to maintain homeostasis under low energy conditions.
Introduction
Phosphoinositide 3‐kinase (PI3K)–Akt–mammalian target of rapamycin (mTOR) signaling is the central pathway controlling cell growth, proliferation, and metabolism 1, 2. Activation of this pathway by IGF‐I or insulin promotes cell division, and in non‐dividing muscle cells, it promotes growth by stimulating overall protein synthesis and inhibiting protein degradation 3, 4, 5. Conversely, inhibition of this pathway reduces cell survival and, in muscle, causes atrophy. A critical player at the core of PI3K‐Akt signaling is the serine/threonine kinase Akt, which serves as an indispensable conduit for transmission of growth and survival signals from cell surface receptors. Because dysregulation of Akt results in various pathologies including cancer, insulin resistance (as occurs in type‐2 diabetes or obesity), neurological disorders, and muscle atrophy, its activity must be tightly regulated in all cells.
Akt1 (referred to as Akt in this study) is a member of the protein kinase B (PKB) family of kinases, which comprises three isoforms in mammalian cells, Akt1/PKBα, Akt2/PKBβ, and Akt3/PKBγ. These isoforms are composed of an N‐terminal pleckstrin homology (PH) domain, a central catalytic domain containing a T308 phosphorylation site, and a C‐terminal regulatory domain containing a S473 phosphorylation site 6. The kinases PDK‐1 and mTORC2 phosphorylate Akt at T308 and S473, respectively 7, downstream of PI3K. Phosphorylation of Akt at these residues is considered rate limiting and obligatory for maximal activation of Akt. Once activated, Akt inhibits the transcription factor FoxO by phosphorylation, preventing its nuclear translocation and stimulation of expression of atrophy‐related genes (“atrogenes”) 3, 8. Akt also inhibits the negative regulator of mTORC1, the tuberous sclerosis complex 1 and 2 (TSC1/2) 9, consequently leading to mTORC1‐mediated phosphorylation of Ribosomal protein 6 Kinase β‐1 (S6K1) 10, 11 and activation of protein synthesis and cell growth 12. In addition, Akt activates glycogen synthesis by phosphorylating and inactivating glycogen synthase kinase β (GSK3‐β), which under low insulin conditions inhibits glycogen synthesis 13. When blood glucose and insulin levels rise, insulin promotes glucose uptake by enhancing trafficking of the glucose transporter GLUT4 to the plasma membrane 14. However, during fasting and catabolic diseases, PI3K–Akt–mTOR signaling decreases, and consequently, glucose uptake and protein synthesis fall; simultaneously, proteolysis increases largely through the FoxO‐mediated expression of the atrogene program 1. In fact, activation of FoxO3 alone is sufficient to trigger proteolysis via the ubiquitin proteasome system 15 and autophagy 5, 16, and to cause substantial atrophy 15. Overproduction of insulin‐like growth factor 1 (IGF1) or Akt in mice, either through transgenic expression or by electroporation into muscles, was sufficient to reduce muscle weight loss, and induce systemic hypertrophy 17, 18. These anabolic effects are mediated by Akt; however, the aberrant activation of this kinase and PI3K‐Akt signaling may relay proliferative and pro‐survival signals that are often associated with solid and hematological malignancies in humans. Therefore, many new anticancer treatments currently in use or in clinical trials are potent suppressors of Akt signaling and can efficiently inhibit growth of various tumors 19. Because Akt controls diverse biological processes, from cell growth and proliferation to survival and migration, its activity must be tightly regulated in normal cells. Previous studies in mouse embryonic fibroblasts proposed a new mode of regulation of Akt by ubiquitination, which appears to be required for Akt phosphorylation at T308 and S473 and activation 20. The present studies were undertaken to identify the enzyme that deubiquitinates Akt and suppresses PI3K‐Akt signaling.
These studies have identified a novel regulator of Akt activity, the ubiquitin‐specific protease 1 (USP1). USP1 is a member of the USP family of cysteine proteases, which process ubiquitin chains to reverse protein modification by ubiquitination. Mammalian cells contain over 50 members of this family, all of which have a catalytic core composed of conserved N‐terminal Cys box motif and C‐terminal His box motif 21. USP1 is best characterized functions are in the nucleus as a regulator of DNA damage response, mainly in the Fanconi anemia pathway 22, and as a negative regulator of certain transcription factors to prevent cell differentiation 23. Recent evidence indicates an additional role for this enzyme in diabetes by promoting apoptosis of insulin‐secreting pancreatic β‐cells 24. Previously, a USP1 knockout mouse has been described that exhibits multiple developmental defects including osteopenia 23, perinatal lethality, male infertility, chromosome instability, and a Fanconi anemia phenotype 25. Although USP1's important roles in DNA repair mechanisms are well documented, its precise functions in regulating metabolism and growth are not yet known. We demonstrate here that during fasting, USP1 suppresses the major anabolic pathway in all cells, PI3K‐Akt signaling, through effects on the key component in this pathway, Akt.
Activation of USP1 requires association with the WD40 repeat‐containing protein USP1‐associated factor 1 (UAF1) 26, and its inhibition is mediated by phosphorylation 27, by decreasing its protein levels via reduced gene expression 23, or by autocleavage at an internal diglycine motif (Gly670‐Gly671) that promotes USP1 degradation by the proteasome 28. USP1 levels are elevated in several human cancers 23, where it seems to sustain DNA repair mechanisms; thus, inhibition of this enzyme may help hypersensitize cancer cells to chemotherapy‐induced DNA damage 29. Interestingly, mutations in USP1 have also been identified in certain human cancers 30, but the functional consequences of these mutations on USP1 activity remain elusive.
We demonstrate here a new role for USP1 in the inhibition of signaling by the PI3K‐Akt cascade. Surprisingly, we show that although ubiquitination of Akt is important for phosphorylation at both T308 and S473 20, the direct deubiquitination of Akt by USP1 results in suppression of Akt phosphorylation only at T308. Loss of Akt phosphorylation at S473, however, requires the function of PHLPP1, which is found within an intact complex with USP1 to completely inhibit Akt during fasting. Recruitment of Akt to USP1‐PHLPP1 complex is mediated by the tumor suppressor disabled homolog 2 (Dab2), whose ectopic expression in cancer cell lines is sufficient to inhibit cell proliferation 31, 32, 33. During fasting, protein synthesis rates are low. However, we surprisingly show that USP1 maintains its own protein levels high by limiting the protein content of TSC1 and sustaining basal rates of protein synthesis. Thus, USP1 is a novel inhibitor of Akt, and by binding to PHLPP1 and TSC1, this DUB ensures a complete inhibition of Akt. Recruitment of Akt to USP1‐TSC1‐PHLPP1 complex by Dab2 appears critical for regulation of PI3K‐Akt signaling and maintenance of cellular homeostasis.
Results
USP1 is a deubiquitinating enzyme for Akt
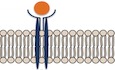
Because PI3K‐Akt‐FoxO‐mTOR pathway is the primary regulator of cell growth and metabolism, and given the importance of Akt ubiquitination for its activity 20, we set out to identify the specific DUB that reduces Akt ubiquitination and consequently inhibits PI3K‐Akt signaling. To initially confirm that Akt is actually deubiquitinated when PI3K‐Akt‐FoxO‐mTOR falls, we studied mouse muscles under the physiological condition of fasting, when blood glucose and insulin levels are low and PI3K‐Akt‐FoxO‐mTOR signaling in all cells is inhibited. Analysis of skeletal muscle extracts from fed and fasted (2d) mice by SDS–PAGE and immunoblotting showed that Akt is ubiquitinated under normal conditions, but its ubiquitination levels are reduced during fasting, while the unmodified form of Akt accumulates (Fig 1A). Furthermore, Akt immunoprecipitation from muscles from fed or fasted mice and immunoblotting with anti‐ubiquitin also indicated that during fasting Akt ubiquitination is reduced (Fig 1B). Interestingly, upon fasting, high molecular weight ubiquitinated species of all three Akt isoforms, Akt1, Akt2, and Akt3, were reduced (Fig EV1A). These findings suggested that Akt is deubiquitinated in vivo during fasting.
Figure 1. USP1 is a deubiquitinating enzyme for Akt.

- Akt is deubiquitinated during fasting. Left: Soluble fractions of TA muscles from fed and fasted mice were analyzed by SDS–PAGE and immunoblot using Akt antibody. Right: densitometric measurement of presented blots (n = 3). *P < 0.05 versus fed by one‐tailed t‐test. Data are represented as mean ± SEM.
- Akt was immunoprecipitated from the soluble fraction of muscles from fed or fasted (2 days) mice. Precipitated were analyzed by immunoblotting using an anti‐ubiquitin conjugates. Mouse IgG was used as a control for non‐specific binding.
- Scheme for DUBs screening experiment to identify the enzyme that directly deubiquitinates Akt in vitro.
- Ubiquitinated Akt is a substrate for USP1 in vitro. Top: Akt was immunoprecipitated from the soluble fraction of TA muscle from fed mice and was subjected to an in vitro deubiquitination by a panel of purified DUBs arrayed in a multi‐well plate. The dividing line indicates the removal of an intervening lane for presentation purposes. Bottom: Densitometric measurements of presented blots. Data are presented as the ratio between ubiquitinated Akt to total Akt in each well.
- shRNA‐mediated knockdown of USP1 in HeLa cells. Soluble extracts were analyzed by immunoblotting.
- USP1 deubiquitinates Akt during fasting in vivo. Left: Soluble fractions of TA muscles transfected with shLacz control or shUSP1 from fed and fasted mice were analyzed by SDS–PAGE and immunoblotting using anti‐Akt. The actin blot serves as a loading control. Right: densitometric measurements of presented blots (n = 3). Data are presented as ratio of ubiquitinated Akt to total Akt normalized to actin. *P < 0.05 versus fed by one‐tailed t‐test. Data are represented as mean ± SEM.
- USP1 removes K63‐linked polyubiquitin chains on Akt in vivo. Akt was immunoprecipitated from the soluble fraction of muscles expressing USP1(C90S) or control plasmids. Mouse IgG was used as a control for non‐specific binding. Protein precipitates were subjected to immunoblotting with an antibody against K63‐linked polyubiquitin conjugates.
- USP1 removes polyubiquitin chains linked to K8 on Akt. Akt was immunoprecipitated from the soluble fraction of TA muscles transfected with USP1(C90S), HA‐Akt(K8R), or control from fasted mice, and protein precipitates were analyzed by immunoblotting with anti‐Akt antibody. Mouse IgG was used as a control for non‐specific binding. Right: Densitometric measurements of presented blots. Data are presented as the ratio between ubiquitinated Akt to total Akt in each lane (n = 2).
Source data are available online for this figure.
Figure EV1. USP1 promotes deubiquitination of all three Akt isoforms in fasting.
- Akt was immunoprecipitated from the soluble fraction of muscles from fed or fasted (2d) mice. Precipitates were analyzed by immunoblotting using specific antibodies against Akt1, Akt2, Akt3, and anti‐ubiquitin conjugates. Mouse IgG was used as a control for non‐specific binding.
- Akt was immunoprecipitated from the soluble fraction of muscles expressing shUSP1 or shLacz from fasted (2d) mice. Protein precipitates were subjected to immunoblotting with an antibody against K63‐linked polyubiquitin conjugates. Mouse IgG was used as a control for non‐specific binding.
- shRNA‐mediated knockdown of USP11 in HEK293 cells. mRNA preparations from transfected cells were analyzed by RT–PCR using primers for USP11. Data are plotted as the mean fold change relative to control ± SEM. n = 5. *P < 0.005 by one‐tailed t‐test. Data are represented as mean ± SEM.
- shRNA‐mediated knockdown of OTUB2 in mouse muscle during fasting. Soluble extracts were analyzed by immunoblotting. The actin blot serves as a loading control.
- USP11 and OTUB2 deubiquitinate Akt during fasting in vivo. Soluble fractions of TA muscles transfected with shLacz control, shUSP11, or shOTUB2 from fed and fasted mice were analyzed by SDS–PAGE and immunoblotting using anti‐Akt1. Akt1 is known to control skeletal muscle homeostasis 17. The actin blot serves as a loading control.
Source data are available online for this figure.
To identify the DUB that can directly deubiquitinate Akt in vitro, we immunoprecipitated Akt from normal muscle homogenate and added the precipitates to a DUB screening plate containing an array of pure active DUBs (Fig 1C). Five DUBs, USP1/UAF1, USP11, OTUB2, OTUD5 (p177S), and OTUD6A, cleaved the polyubiquitin chain on Akt and reduced its ubiquitination levels compared with ubiquitinated Akt in reactions that did not contain a DUB (Fig 1D). Among these DUBs, we decided to focus on USP1 because it preferentially removes K63‐linked chains 34, the type of polyubiquitination that is essential for Akt activation 20, and it is the only DUB among the five that has been linked to diabetes, a pathological condition associated with dysregulated insulin‐PI3K‐Akt signaling 24.
To determine whether USP1 can deubiquitinate Akt in vivo, we downregulated this enzyme in mouse muscle by the electroporation of a specific shRNA (shUSP1) (Fig EV2), which can efficiently reduce USP1 content (Fig 1E), and analyzed the effects on Akt ubiquitination levels during fasting. As shown above (Figs 1A and B), analysis of the soluble fraction from muscles expressing control plasmid (shLacz) from fed and fasted mice indicated that upon fasting there was a decrease in high molecular weight ubiquitinated species of Akt (Fig 1F). However, downregulation of USP1 blocked this decrease in Akt ubiquitination levels, and instead, Akt accumulated as ubiquitinated species (Figs 1F and EV1B). It is noteworthy that downregulation of two other representative enzymes from our screen, USP11 and OTUB2, in mouse muscles also blocked Akt deubiquitination in vivo, further exemplifying the validity of our DUB scan approach and the physiological relevance of our findings (Fig EV1C–E). Similar results were obtained when we inhibited USP1 by the electroporation of a GFP‐tagged USP1 dominant‐negative encoding plasmid (USP1(C90S)) 35, which lacks the catalytic cysteine and thus can bind substrates but cannot deubiquitinate them (Fig 1G). Immunoprecipitation of Akt from USP1(C90S)‐expressing muscles from fasted mice, and analysis of protein precipitates by SDS–PAGE and immunoblotting using anti‐K63‐linked ubiquitin chains antibody revealed that in the muscles lacking functional USP1 (expressing USP1(C90S)) Akt accumulated as K63‐ubiquitinated protein (Fig 1G). In fact, the content of K63‐ubiquitinated Akt in these muscles exceeded the amounts observed in muscles of fed mice (P < 0.05), suggesting that K63 polyubiquitination of Akt may increase during fasting, and USP1 catalyzes the deubiquitination of this protein.
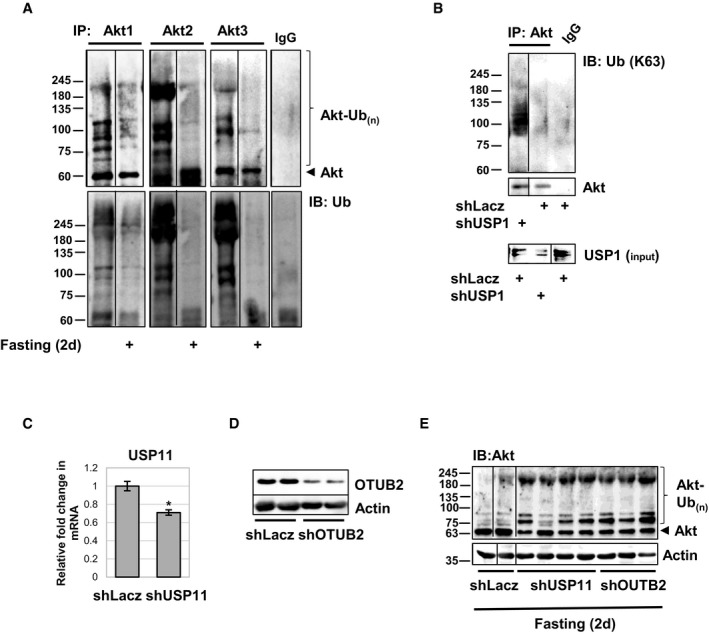
Figure EV2. In vivo electroporation of skeletal muscle.
Paraffin‐embedded cross sections of TA muscle from mice deprived of food (2 d) were stained with H&E or by immunofluorescence using the indicated antibodies. Scale bar, 150 μm for H&E and 50 μm for immunofluorescence.
Akt ubiquitination on K8 within the PH domain is essential for its activation 20. To learn whether USP1 cleaves the ubiquitin chain that is linked to K8 on Akt, we co‐electroporated muscles with USP1(C90S) to cause accumulation of ubiquitinated Akt, and either shLacz or a plasmid encoding HA‐tagged Akt carrying a K8‐to‐R mutation (HA‐Akt(K8R)) (Fig 1H). By 2d of fasting, HA‐Akt(K8R) immunoprecipitated from transfected muscles showed limited ubiquitination, i.e., much less than the endogenous Akt immunoprecipitated from muscles expressing USP1(C90S) alone (Fig 1H, compare lanes 1–2 with 3–4). These findings indicate that on inhibition of USP1 during fasting, Akt is ubiquitinated on K8. Thus, USP1 is essential for Akt deubiquitination in vivo, which most likely leads to inhibition of PI3K‐Akt signaling.
Deubiquitination by USP1 reduces Akt phosphorylation at T308 and PI3K‐Akt‐FoxO signaling
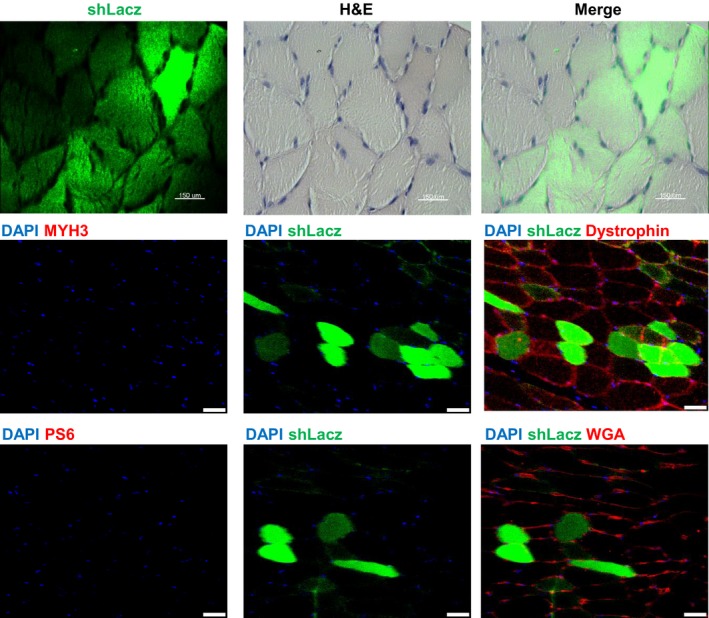
To determine whether USP1‐mediated Akt deubiquitination in fact influences PI3K‐Akt‐FoxO signaling, we inhibited USP1 by electroporation of USP1(C90S) into mouse muscle during fasting. By 2 days of fasting, phosphorylation of insulin receptor, Akt, and its targets, FoxO3 and GSK3β, was markedly reduced (Fig 2A) 15, 36. However, inhibition of USP1 almost completely blocked this response to fasting. In fact, the levels of phosphorylated Akt (T308), FoxO3, and GSK3β were similar to those in muscles from fed mice, even though the levels of phosphorylated insulin receptor remained low. Surprisingly, although Akt ubiquitination facilitates phosphorylation on both T308 and S473 20, in the muscles where USP1 was inhibited and ubiquitinated Akt accumulated (Figs 1F and G), phosphorylated Akt (S473) was low (Fig 2A). Thus, during fasting, deubiquitination by USP1 is required to prevent Akt phosphorylation at T308, but is dispensable for Akt phosphorylation at S473. It is noteworthy that USP1 overexpression in muscles from fasted mice does not further reduce Akt phosphorylation at T308 (Fig EV3A), which is already low when blood glucose and insulin levels are low and endogenous USP1 is functional.
Figure 2. Deubiquitination by USP1 reduces Akt phosphorylation at T308 and PI3K‐Akt‐FoxO signaling.
- Inhibition of USP1 increases PI3K‐Akt‐FoxO signaling during fasting. Soluble fractions of normal and atrophying muscles expressing shLacz or USP1(C90S) were analyzed by SDS–PAGE and immunoblot. The black line indicates the removal of intervening lanes for presentation purposes. Right: densitometric measurements of presented pAkt (T308), pAkt (S473), and Akt blots. Data are presented as ratio of phosphorylated Akt to total Akt (n = 3). *P < 0.05 versus fed by one‐tailed t‐test. Data are represented as mean ± SEM.
- Downregulation of USP1 reduces MuRF1 and Atrogin1 expression during fasting. Quantitative RT–PCR of mRNA preparations from atrophying and control muscles expressing shLacz or shUSP1 (80% transfection efficiency) using primers for MuRF1 and Atrogin1. Data are plotted as the mean fold change relative to fed control. n = 4. *P < 0.05 versus shLacz in fed. # P < 0.05 versus shLacz in fasting by one‐tailed t‐test. Data are represented as mean ± SEM.
- Downregulation of USP1 markedly reduces muscle fiber atrophy. Cross‐sectional areas of 500 fibers transfected with shUSP1 (that express GFP, green bars) versus 500 non‐transfected fibers (black bars) in the same muscle. n = 5 mice. A representative image is shown; laminin staining is in red; scale bar, 50 μm.
- Downregulation of USP1 attenuates the loss of muscle mass during fasting. shUSP1 was delivered to more than 60% of muscle fibers. Mean weights of electroporated muscles are plotted as the percent weight loss. n = 6. # P < 0.05 versus shLacz in fed; *P < 0.05 versus shLacz in fasting by one‐tailed t‐test. Data are represented as mean ± SEM.
- USP1 inhibition significantly increases glucose tolerance in mice during fasting. Left: mice injected i.p. with specific USP1 inhibitor (12 μg/g body weight) or saline during fasting (2 days) were subjected to glucose tolerance test. Blood glucose levels were measured at the indicated time points following glucose injection (1 mg/g body weight). Data are depicted in a graph as mg/dl glucose (n = 3). *P < 0.05, **P < 0.005, ***P < 0.0005 versus mice injected with saline by one‐tailed t‐test. Data are represented as mean ± SEM. Right: Soluble fractions of muscles from injected mice were analyzed by SDS–PAGE and immunoblot.
Source data are available online for this figure.
Figure EV3. During fasting, downregulation of USP1 in mouse muscles or cultured myotubes enhances PI3K‐Akt signaling and TSC1 stability.
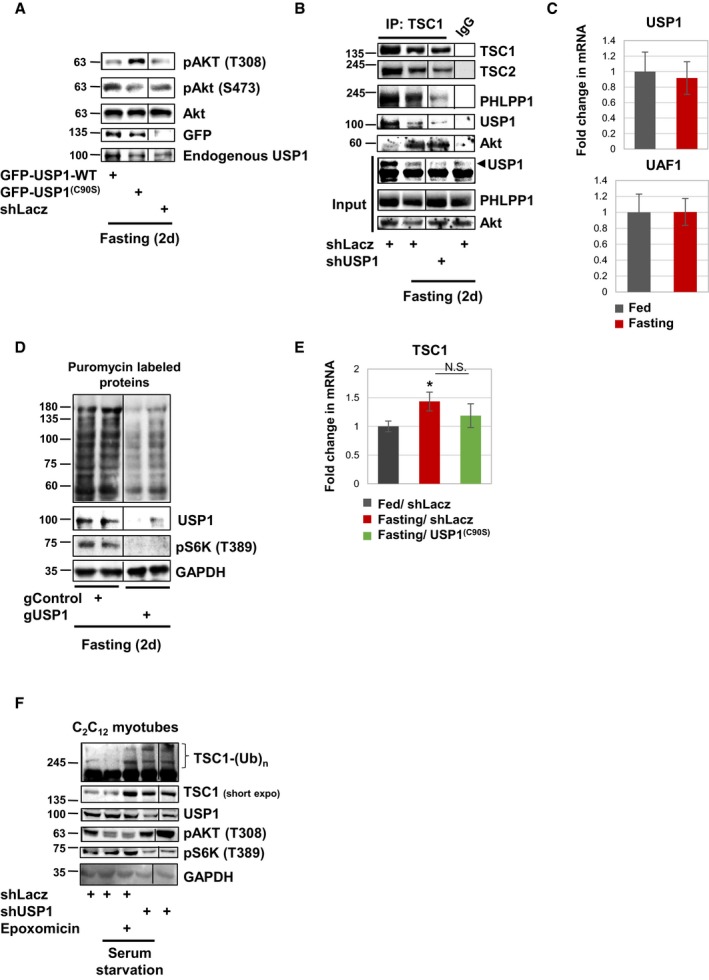
- Overexpression of USP1 in mouse muscles does not further reduce phosphorylated‐Akt (T308) levels in fasting. Soluble fractions of atrophying muscles expressing shLacz, GFP‐USP1(C90S), or GFP‐USP1‐WT were analyzed by SDS–PAGE and immunoblot.
- TSC1 was immunoprecipitated from the soluble fraction of muscles expressing shLacz or shUSP1 from fed or fasted mice. Mouse IgG was used as a control for non‐specific binding. Precipitates were analyzed by immunoblotting.
- Quantitative RT–PCR of mRNA preparations from muscles from fed and fasted mice using primers for USP1 and UAF1. Data are plotted as the mean fold change relative to fed control. n = 6 by one‐tailed t‐test. Data are represented as mean ± SEM.
- During fasting, downregulation of USP1 reduces rates of protein synthesis. Mice were injected with puromycin, and soluble fractions of muscles expressing shLacz or gUSP1 (in vivo CRISPR) were analyzed by immunoblotting using puromycin antibody.
- Inhibition of USP1 does not affect TSC1 expression during fasting. Quantitative RT–PCR of mRNA preparations from atrophying and control muscles expressing shLacz or USP1(C90S) using primers for TSC1. Data are plotted as the mean fold change relative to fed control. n = 4. *P < 0.05 versus shLacz in fed by one‐tailed t‐test. Data are represented as mean ± SEM.
- USP1 downregulation or proteasome inhibition causes accumulation of ubiquitinated TSC1 in cultured myotubes. Myotubes were infected with control or shUSP1 viruses for 48 h and then serum‐starved for 4 h in the presence or absence of Epoxomicin (100 nM). Right lane: Cells infected with shUSP1 and are not starved. Cell extracts were analyzed by SDS–PAGE and immunoblot.
Source data are available online for this figure.
Normally during fasting, FoxO is activated (dephosphorylated) and stimulates the expression of atrogenes, including the muscle‐specific ubiquitin ligases MuRF1 and Atrogin1, which are essential for rapid fiber atrophy (Fig 2B) 37, 38. However, USP1 downregulation with shRNA (shUSP1) resulted in a marked decrease in MuRF1 and Atrogin1 expression in the tibialis anterior (TA) muscles during fasting (Fig 2B). This inhibition of atrogene expression during fasting together with the maintenance of normal PI3K–Akt–mTOR signaling should block muscle wasting 39, 40. Accordingly, the mean cross‐sectional area of 500 fibers expressing shUSP1 (and GFP to identify transfected fibers) was bigger than that of 500 non‐transfected fibers (Fig 2C). Moreover, by 2 days of fasting, there was a 31% decrease in the mean weight of the control TA muscles below levels in fed mice (Fig 2D), but USP1 downregulation clearly attenuated this wasting, even though ~30% of the fibers were not transfected with the shUSP1 (Fig 2D). In addition to regulating cell size and protein balance, the PI3K‐Akt‐FoxO pathway also mediates insulin's stimulation of glucose uptake into muscle and adipose tissue. As predicted, inhibition of USP1 by the injection of mice with the USP1‐specific inhibitor ML323 41 significantly improved glucose tolerance and stimulated PI3K‐Akt‐FoxO signaling in muscle during fasting (Fig 2E). Thus, USP1 function is critical in causing the reduction in PI3K‐Akt‐FoxO signaling during fasting that triggers the decrease in glucose uptake and protein synthesis, the FoxO‐mediated expression of the atrogene program, and muscle wasting 39, 40.
The Ser/Thr phosphatase PHLPP1 reduces Akt phosphorylation at S473 in fasting
Although Akt ubiquitination is required for phosphorylation at both T308 and S473 20, the deubiquitination of this kinase by USP1 in fasting reduces Akt phosphorylation at T308 but not at S473 (Figs 2A and EV3A). Prior studies indicated that the Ser/Thr protein phosphatase PHLPP1 can dephosphorylate Akt at S473 to promote apoptosis and suppress tumor growth 42. To investigate whether Akt phosphorylation at S473 is affected by the levels of PHLPP1 during fasting, we downregulated PHLPP1 by electroporation of a specific shRNA (shPHLPP1) into mouse TA muscle. The resulting fall in PHLPP1 caused an increase in phosphorylated Akt (S473) and S6K (T389), while the levels of phosphorylated Akt (T308) remained low (Fig 3A) because in these muscles USP1 was functional. Consistent with the increase in Akt and S6K phosphorylation, PHLPP1 downregulation also enhanced protein synthesis because puromycin incorporation into newly translated proteins was higher than in shLacz‐expressing muscles (Fig 3B). This enhanced protein synthesis can account for the dramatic blockage of muscle wasting observed in fibers expressing shPHLPP1 compared with adjacent non‐transfected fibers (Fig 3C). Thus, PHLPP1 is required for Akt dephosphorylation at S473 during fasting, and probably functions in parallel to USP1 to efficiently suppress Akt and PI3K‐Akt‐mTOR signaling (see below).
Figure 3. The phosphatase PHLPP1 reduces Akt phosphorylation at S473 in fasting.

- During fasting, downregulation of PHLPP1 enhances Akt phosphorylation at S473. Soluble fractions of muscles transfected with shLacz or shPHLPP1 from fasted mice (2d) were analyzed by immunoblotting. Right: densitometric measurements of presented blots. Data are presented as ratio of shPHLPP1 to shLacz (n = 3 for shLacz and n = 4 for shPHLPP1). *P < 0.05 versus shLacz in fasting by one‐tailed t‐test. Data are represented as mean ± SEM.
- PHLPP1 downregulation increases rates of protein synthesis during fasting. Mice were injected with puromycin, and soluble fractions of electroporated muscles were analyzed by immunoblotting using puromycin antibody. Analysis of right (R) and left (L) limbs for each mouse is shown.
- Downregulation of PHLPP1 markedly reduces muscle fiber atrophy. Cross‐sectional areas of 500 fibers transfected with shPHLPP1 (that express GFP, green bars) versus 500 non‐transfected fibers (black bars) in the same muscle. n = 4 mice. A representative image is shown; laminin staining is in red; scale bar, 50 μm.
- USP1/UAF1 interact with PHLPP1 in normal muscle. USP1 was immunoprecipitated from the soluble fraction of normal muscles. Mouse IgG was used as a control for non‐specific binding. Precipitates were analyzed by immunoblotting.
Source data are available online for this figure.
Akt is recruited to USP1‐PHLPP1 complex in fasting
PHLPP1 and UAF1 could be coprecipitated with USP1 from muscles of fed mice (Fig 3D). To learn whether USP1 and PHLPP1 form an intact complex to efficiently inhibit Akt during fasting, and to identify the growth regulatory factor that recruits Akt to these enzymes, we performed in parallel immunoprecipitation of components that interact with Akt, i.e., PHLPP1, USP1, and its cofactor UAF1, and FoxO3, and identified the bound proteins by mass spectrometry. Muscle homogenates from fasted mice, where Akt is dephosphorylated and inactivated, were incubated with specific antibodies against PHLPP1, USP1, UAF1, or FoxO3, or with a non‐specific IgG, and protein precipitates were washed extensively with buffer containing 500 mM NaCl to remove non‐specific or weakly associated proteins (Fig 4A). Mass spectrometry analysis identified only 29 as common binding partners of all four components (Fig 4B and Table EV1), which were at least 100 times more abundant in the immunoprecipitation samples than in IgG control. These common proteins included TSC1/TSC2 complex, which lies downstream of PI3K‐Akt signaling 43, 44, and Dab2 that can reduce cell proliferation in epithelia 31, 32. Akt was not identified by mass spectrometry even though it is clearly a substrate for USP1 and PHLPP1 (Figs 1 and 2 and see below).
Figure 4. Akt is recruited to USP1‐PHLPP1‐TSC1 complex in fasting.
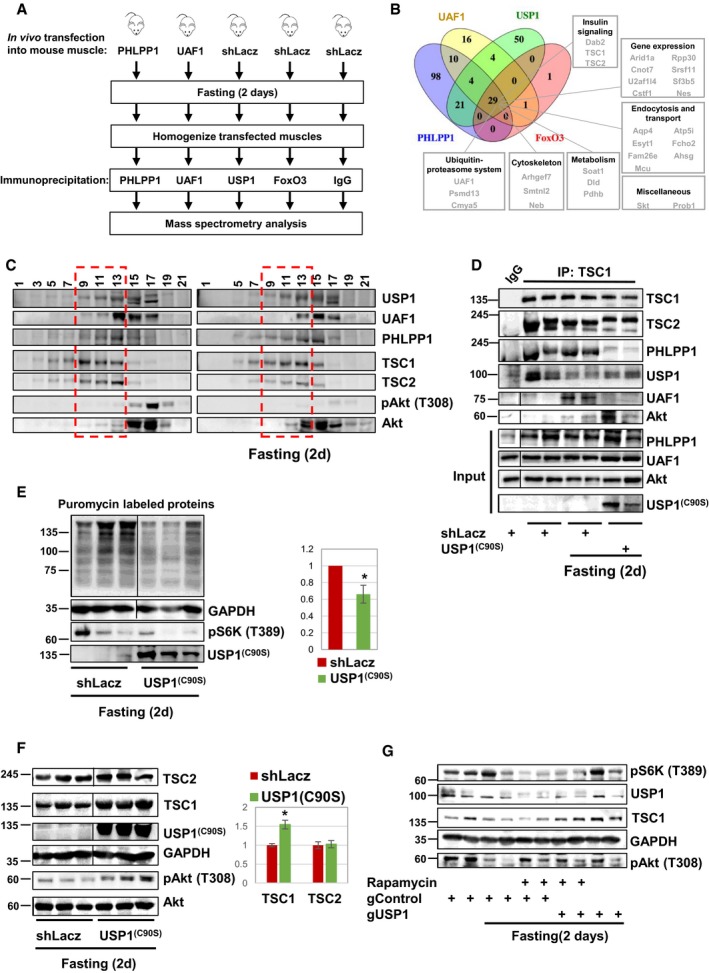
- Scheme of affinity purification technique to isolate components that bind Akt. Four immunoprecipitation experiments of USP1, PHLPP1, UAF1, and FoxO from muscle homogenates during fasting were performed in parallel to non‐specific mouse IgG control, and protein precipitates were analyzed by mass spectrometry.
- Mass spectrometry data obtained in (A) are presented using Venny diagram tool. Only proteins that were at least threefold more abundant in the immunoprecipitation samples than in IgG control are listed.
- In fasting, Akt sediments to glycerol gradient fractions containing USP1/UAF1, PHLPP1, and TSC1/TSC2. Muscle homogenates from fed or fasted mice were separated on 10–40% glycerol gradient, and alternate fractions were analyzed by SDS–PAGE and immunoblot. Red rectangle marks fractions containing USP1/UAF1, PHLPP1, TSC1, and TSC2 in fed conditions.
- During fasting, Akt is recruited to USP1‐PHLPP1‐TSC1 complex. TSC1 was immunoprecipitated from the soluble fraction of muscles expressing shLacz or USP1(C90S) from fed or fasted mice. Mouse IgG was used as a control for non‐specific binding. Precipitates were analyzed by immunoblotting. Black lines indicate the removal of intervening lanes for presentation purposes.
- During fasting, inhibition of USP1 reduces rates of protein synthesis. Mice were injected with puromycin, and soluble fractions of electroporated muscles were analyzed by immunoblotting using puromycin antibody. Right: densitometric measurement of the presented blot. n = 3. *P < 0.05 versus shLacz by one‐tailed t‐test. Data are represented as mean ± SEM.
- Inhibition of USP1 results in TSC1 accumulation. Soluble fraction of muscles expressing shLacz or USP1(C90S) from fasted mice was analyzed by SDS–PAGE and immunoblotting. Right: densitometric measurement of the presented blot. n = 3. *P < 0.05 versus shLacz. Data are presented as protein content (AU) in USP1(C90S) versus shLacz by one‐tailed t‐test. Data are represented as mean ± SEM.
- mTOR inhibition with rapamycin results in reduced USP1 protein content and enhanced Akt phosphorylation at T308. However, a simultaneous downregulation of USP1 is required to promote TSC1 accumulation. Soluble fraction of muscles expressing shLacz or gUSP1 (in vivo CRISPR) from fed and fasted mice injected i.p. with rapamycin (6 mg/kg body weight) or saline were analyzed by SDS–PAGE and immunoblot.
Source data are available online for this figure.
Although TSC1/TSC2 complex is a direct substrate of Akt 44, here we determined whether this complex can influence Akt activity during fasting, and the role of USP1. Glycerol gradient fractionation of muscle homogenates from fed mice indicated that TSC1, TSC2, USP1/UAF1, and PHLPP1 sedimented to the same fractions, as determined by the distribution of these proteins across the gradient (Fig 4C). Interestingly, Akt was virtually absent in these fractions and mainly sedimented to lighter fractions containing UAF1 and truncated mostly likely inactive USP1 45 (Fig 4C). In these lighter fractions, where USP1 is cleaved and is probably inactive, Akt was present in its phosphorylated active form (T308), which is consistent with USP1 playing an important role in reducing Akt phosphorylation (Fig 2A). During fasting, however, Akt moved to heavier fractions containing USP1/UAF1, TSC1/TSC2, and PHLPP1, and its phosphorylation at T308 was reduced (Fig 4C).
These proteins may physically interact in vivo during fasting to promote the complete inhibition of Akt. In fact, immunoprecipitation experiments from muscles expressing USP1(C90S), shUSP1, or control, from fed or fasted mice indicated that TSC2, USP1, and PHLPP1 could be coprecipitated with TSC1 from muscles of fed or fasted mice (Figs 4D and EV3B). However, association of UAF1 and Akt with this protein assembly was evident only during fasting (Fig 4D), suggesting that in fasting USP1 is activated by association with UAF1, and Akt is recruited to this active enzyme. Consistently, neither USP1 nor UAF1 mRNA increased during fasting (Fig EV3C), and USP1 function probably increases via the enhanced association with UAF1 (Fig 4D) 26. Interestingly, USP1/UAF1 association does not seem to be required for Akt recruitment to USP1 because Akt remained bound to this protein even in muscles expressing USP1(C90S) where USP1/UAF1 association was perturbed (Fig 4D). Thus, Akt recruitment to USP1 is probably mediated by an additional factor, such as Dab2 (see below).
Further studies determined whether USP1‐TSC1 association shown above is important for Akt inactivation in fasting. Perhaps, USP1 by deubiquitinating and inhibiting Akt promotes activation of TSC1/TSC2 and consequently reduces rates of protein synthesis, as reported 43, 44. Alternatively, during fasting, USP1 may rather limit TSC1 accumulation (not through effects on Akt) in order to sustain basal rates of mTOR‐mediated protein synthesis and maintain its own protein levels high. To test this idea, we initially inhibited USP1 in mouse muscle or downregulated it with shUSP1, and analyzed the effects on rates of protein synthesis. After electroporation of USP1(C90S) or shUSP1 into TA muscle, puromycin incorporation into newly translated proteins was surprisingly lower than in shLacz‐expressing muscles (Figs 4E and EV3D) and TSC1 protein levels were increased (Fig 4F), indicating that during fasting, when Akt is inhibited (Fig 2A), USP1 enhances rates of protein synthesis through effects on TSC1. This accumulation in TSC1 did not result from increased gene expression because the mRNA levels of TSC1 were similar in atrophying muscles expressing shLacz or USP1(C90S) (Fig EV3E), suggesting that during fasting USP1 limits TSC1 content by promoting its degradation. In fact, infecting C2C12 myotubes with a lentivirus expressing shUSP1, which efficiently decreased USP1 levels (Fig EV3F), blocked TSC1 degradation on serum starvation and high molecular weight ubiquitinated species of TSC1 accumulated (Fig EV3F). This stabilization of TSC1 probably results from reduced degradation by the proteasome because treatment of serum‐starved myotubes with the specific proteasome inhibitor Epoxomicin caused a similar accumulation of TSC1 and its ubiquitinated species (Fig EV3F). As expected from our findings above on mouse muscle (Figs 2A and 4F and G), the downregulation of USP1 in the serum‐starved myotubes also caused an increase in phosphorylated Akt (T308) and a decrease in phosphorylated S6K (T389) (Fig EV3F). Thus, viral expression of shUSP1 in myotubes mimics the effects of shUSP1 expression in adult muscle. Furthermore, in non‐starved myotubes, USP1 downregulation led to stabilization of ubiquitinated TSC1, increased levels of phosphorylated Akt (T308), and decreased levels of phosphorylated S6K (T389) (Fig EV3F), suggesting that USP1 regulates PI3K‐Akt signaling and TSC1 stability also under normal conditions.
These findings suggested that USP1 sustains basal rates of protein synthesis by limiting TSC1 accumulation in fasting. Accordingly, inhibition of mTOR in fasting by the injection of mice with rapamycin, as shown by lower amounts of phosphorylated S6K (mTOR‐downstream target) (Fig 4G), caused a decrease in USP1 protein levels and an increase in phosphorylated Akt (T308) in muscle (Fig 4G). Similarly, downregulation of USP1 by the co‐electroporation of Cas9‐encoding plasmid and USP1‐guiding RNAs (gUSP1) resulted in increased Akt phosphorylation (T308) and caused accumulation of TSC1, with or without a simultaneous treatment with rapamycin (Fig 4G). Similar results were obtained by the downregulation of USP1 with shUSP1 (Fig EV4A), or by the treatment of serum‐starved C2C12 myotubes with rapamycin (Fig EV4B). Possibly, a reduction in USP1 protein levels below a critical threshold is necessary to cause TSC1 accumulation in fasting. Thus, when PI3K‐Akt signaling is low, USP1 limits TSC1 protein levels to promote basal rates of mTOR‐mediated protein synthesis and sustain its own protein levels high. A similar accumulation of TSC1 can be observed already at 24 and 36 h of food deprivation when USP1 is downregulated, and even before any effects on Akt phosphorylation could be observed (Fig EV4C), suggesting that USP1 function toward TSC1 is independent from its role in reducing Akt activity.
Figure EV4. During fasting, downregulation of USP1 stabilizes TSC1 and Akt phosphorylation at T308.
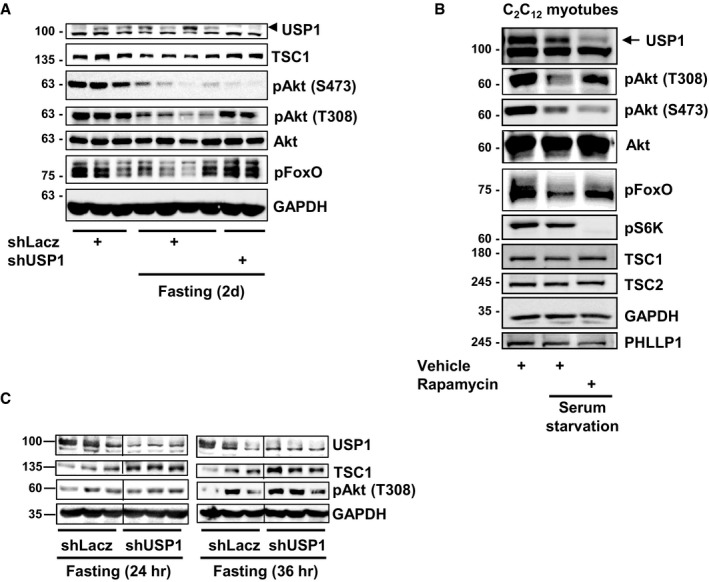
- Soluble fraction of TA muscles expressing shLacz or shUSP1 from fed and fasted (2d) mice were analyzed by SDS–PAGE and immunoblotting.
- mTOR inhibition with rapamycin in cultured myotubes results in reduced USP1 protein content and enhanced Akt phosphorylation at T308. Myotubes were serum‐starved for 4 h in the presence or absence of rapamycin (20 nM), and cell extracts were analyzed by SDS–PAGE and immunoblot.
- Soluble fraction of TA muscles expressing shLacz or shUSP1 from fasted mice (for 24 or 36 h) were analyzed by SDS–PAGE and immunoblotting.
Dab2 facilitates Akt recruitment to USP1‐PHLPP1‐TSC1 complex
Together, these observations suggested that Akt is recruited to USP1‐PHLPP1‐TSC1 complex by an additional factor. In kidney cells, the C‐terminal proline‐rich domain of Dab2 has been suggested to bind Akt to regulate albumin endocytosis 32. Because Dab2 in muscle extracts was bound to USP1/UAF1, and other Akt interacting partners including PHLPP1 and FoxO (Fig 4B and Table EV1), we determined whether it influences PI3K‐Akt activity during fasting. For this purpose, we used a vector encoding the C‐terminal proline‐rich domain of Dab2 (Dab2‐DN), which functions as a dominant‐negative inhibitor of Dab2‐Akt association to inhibit albumin endocytosis in the kidney 32. We electroporated TA muscles from fed or fasted mice with control plasmid or the Dab2‐DN, and analyzed the transfected muscles by immunoprecipitation. As shown in Fig 4D, Akt association with USP1 and TSC1 was greater during fasting than in muscles of fed mice (Fig 5A). Similarly, Dab2 association with this protein assembly increased during fasting (Fig 5A), when Akt is deubiquitinated (Fig 1) and PI3K‐Akt signaling falls (Fig 2A). This change in Akt association in fasting seemed to require Dab2 because inhibition of Dab2‐Akt association by the expression of Dab2‐DN blocked this recruitment of Akt and Dab2 to USP1‐containing complex (Fig 5A). By competing with the endogenous Dab2 for association with Akt, this truncated mutant seems to also capture the endogenous Dab2 and prevent its association with the functional USP1‐PHLPP1‐TSC1 complex (Fig 5A). Thus, during fasting, Dab2 enhances the association between Akt and USP1‐PHLPP1‐TSC1 complex.
Figure 5. Dab2 facilitates Akt recruitment to USP1‐PHLPP1‐TSC1 complex.
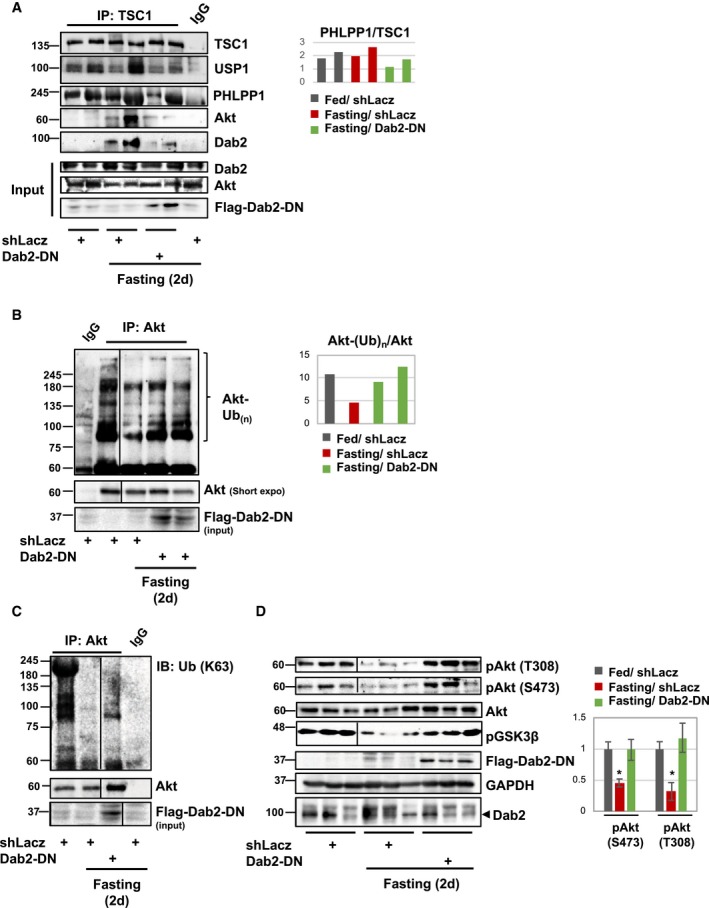
- During fasting, inhibition of Dab2‐Akt association reduces the interaction of Akt with USP1‐PHLPP1‐TSC1 complex. Left: TSC1 was immunoprecipitated from the soluble fraction of muscles expressing shLacz or Dab2‐DN from fed or fasted mice. Mouse IgG was used as a control for non‐specific binding. Precipitates were analyzed by immunoblotting. Right: densitometric measurement of PHLPP1 and TSC1 blots, and data are presented as PHLPP1/TSC1 ratio.
- Dab2 promotes Akt deubiquitination in vivo. Left: Akt was immunoprecipitated from the soluble fraction of muscles expressing shLacz or Dab2‐DN from fed and fasted mice using a specific antibody. Mouse IgG was used as a control for non‐specific binding. Protein precipitates were analyzed by Western blot analysis using Akt antibody. Right: densitometric measurements of presented blots. Data are presented as the ratio between ubiquitinated Akt to total Akt in each lane (n = 2).
- Dab2 promotes cleavage of K63‐linked polyubiquitin chains on Akt in vivo. Akt was immunoprecipitated from the soluble fraction of muscles expressing shLacz or Dab2‐DN from fed and fasted mice using a specific antibody. Mouse IgG was used as a control for non‐specific binding. Protein precipitates were subjected to immunoblotting with an antibody against K63‐linked polyubiquitin conjugates.
- Inhibition of Dab2‐Akt association enhances Akt phosphorylation in fasting. Soluble fraction of TA muscles transfected with shLacz or Dab2‐DN from fed and fasted mice were analyzed by SDS–PAGE and immunoblotting using the indicated antibodies. Right: densitometric measurement of presented blots. Data are mean ± SEM, n = 3. *P < 0.05. versus shLacz in fed conditions, by one‐tailed t‐test.
Source data are available online for this figure.
Because Dab2 mediates Akt recruitment to USP1 during fasting, reducing its association with Akt by the expression of Dab2‐DN should prevent Akt deubiquitination and activate PI3K‐Akt‐FoxO signaling. To determine whether Dab2 facilitates Akt deubiquitination, we immunoprecipitated Akt from muscles from fed and fasted mice, and analyzed by SDS–PAGE and immunoblotting using anti‐Akt (Fig 5B) or anti‐K63‐linked ubiquitin chains antibodies (Fig 5C). As shown above, the high molecular weight ubiquitinated species of Akt were reduced in fasting (Figs 5B and C), where Dab2 is functional and facilitates the recruitment of Akt to USP1 (Fig 5A). This deubiquitination of Akt is dependent on Dab2 because reducing Dab2 function by the expression of Dab2‐DN resulted in accumulation of high molecular weight K63‐linked ubiquitin conjugates on Akt (Figs 5B and C). In fact, this accumulation of ubiquitinated Akt by Dab2‐DN must underestimate the protective effects of Dab2 inhibition because only about half the fibers were transfected. In addition, Akt phosphorylation at T308 or S473 decreased by 2 days fasting (Fig 5D), when its association with USP1 and PHLPP1 increased (Fig 4D); however, this effect was markedly attenuated in muscles expressing Dab2‐DN (Fig 5D) because in these muscles Akt recruitment to USP1‐PHLPP1‐TSC1 complex was reduced (Fig 5A). It is noteworthy that neither Dab2 protein nor mRNA increased upon fasting (Figs 5D and EV5), and its activity toward Akt when blood insulin levels are low probably increases when Akt SH3 domain is liberated from signaling components that bind and activate it. Thus, Dab2 appears critical for the USP1‐induced reduction in Akt ubiquitination in fasting, and for the resulting inhibition of Akt and PI3K‐Akt‐FoxO signaling.
Figure EV5. Dab2 is not induced during fasting.
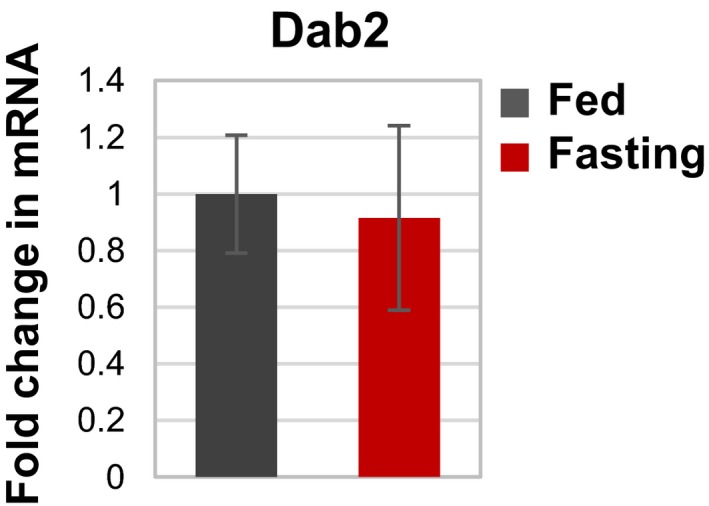
Quantitative RT–PCR of mRNA preparations from muscles from fed and fasted mice using primers for Dab2. Data are plotted as the mean fold change relative to fed control. n = 4 by one‐tailed t‐test. Data are represented as mean ± SEM.
Discussion
We uncovered a novel mechanism that suppresses PI3K‐Akt signaling, and involves the deubiquitination of Akt by USP1. Because USP1 inhibition during fasting increased PI3K‐Akt‐FoxO signaling, enhanced glucose uptake, and blocked muscle atrophy (Fig 2), USP1‐mediated inhibition of Akt function may also contribute to insulin resistance and muscle wasting in various catabolic states (e.g., diabetes, metabolic syndrome, or sepsis), and perhaps to the malignancies seen with USP1 mutations. Recent evidence suggested a role for this enzyme in diabetes by promoting apoptosis of insulin‐secreting pancreatic β‐cells 24, and we demonstrate here a metabolic role for USP1 by reducing tissue sensitivity to insulin. Consequently, USP1 may represent a new therapeutic target to block muscle wasting and the insulin resistance characteristic of many disease states (e.g., cancer cachexia, sepsis, and renal failure), and stimulating USP1 actions toward Akt in order to inhibit PI3K‐Akt‐FoxO signaling may have therapeutic benefits in the treatment of cancer.
Under normal conditions, Akt is ubiquitinated by K63‐linked polyubiquitin chains, which is required for its activation and for PI3K‐Akt signaling (Figs 1 and 2) 20. In MEF cells, this ubiquitination is catalyzed by the ubiquitin ligase TRAF6 and appears to be required for Akt phosphorylation at both T308 and S473 20. In muscle, however, TRAF6 seems to induce the atrophy program and promote loss of mass 46. We surprisingly show that USP1‐mediated deubiquitination of Akt reduces Akt phosphorylation only at T308, but Akt phosphorylation at S473 is not affected by this deubiquitination (Figs 2A and EV3A, and EV4A). By deubiquitinating Akt, USP1 probably prevents Akt phosphorylation at T308 by PDK1 or enhances Akt dephosphorylation at this site by certain phosphatases. Loss of Akt phosphorylation at S473 requires the protein phosphatase PHLPP1 (Fig 3A), which binds USP1 and together with TSC1/TSC2 forms one intact complex with Akt most probably to efficiently inhibit Akt activity and suppress PI3K‐Akt signaling when cellular energy charge is low (see below).
The systemic atrophy of muscle upon fasting is signaled by the low levels of insulin and IGF‐1 and increased levels of glucocorticoids, which cause inhibition of PI3K‐Akt signaling and accelerated proteolysis via FoxO‐mediated expression of the atrogene program 15. We show here that in addition to the fall in blood insulin, PI3K‐Akt activity is suppressed in prolonged starvation by USP1 to efficiently terminate the transmission of growth signals when cellular energy charge is low. Accordingly, loss of USP1 function alone is sufficient to enhance PI3K‐Akt activity and prevent atrogenes expression, protein degradation, and atrophy (Fig 2). Under these conditions, protein synthesis rates are low due to the inhibition of mTOR by TSC1/TSC2 complex 47. However, we surprisingly demonstrate that TSC1 protein levels are in fact restricted in fasting by USP1 in order to maintain basal rates of mTOR‐mediated protein synthesis and sustain USP1 protein levels high enough to exert its effects. Accordingly, loss of USP1 function resulted in accumulation of TSC1 in muscles from fasted mice (Figs 4F and EV3F), and reduced rates of protein synthesis (Figs 4E and EV3D). In addition, treatment of mice with the mTOR inhibitor, rapamycin, reduced USP1 protein levels and consequently Akt phosphorylation at T308 increased (Figs 4G and Fig EV4B). Therefore, USP1‐mediated loss of Akt phosphorylation at T308 does not involve the function of mTOR and occurs upstream, i.e., by the direct action of USP1 on Akt (Fig 1D). Interestingly, in addition to rapamycin treatment, a simultaneous downregulation of USP1 by an in vivo gene manipulation was required to cause TSC1 accumulation, probably because the low USP1 protein levels in mice treated with rapamycin were sufficient to limit TSC1 protein levels. These effects appear to involve USP1‐mediated regulation of TSC1 stability because TSC1 expression did not increase in muscle lacking functional USP1 (Fig EV3E), and in cultured myotubes transfected with shUSP1 or treated with the specific proteasome inhibitor Epoxomicin, TSC1 was stabilized as ubiquitinated species (Fig EV3F). Maintenance of basal rates of protein synthesis in times of scarcity is crucial for survival, because the induction of enzymes that promote proteolysis is required to facilitate muscle protein degradation, and the amino acids produced are converted to glucose in the liver to nurture the brain.
We previously identified the ubiquitin ligase Trim32 as a novel negative regulator of PI3K‐Akt signaling in fasting 39, and the present studies demonstrate a critical role for the deubiquitinating enzyme USP1 in the inhibition of this pathway. Whether these proteins function together in regulating PI3K‐Akt activity is an important question for future research. Trim32 influences PI3K‐Akt activity by perturbing PI3K association with the desmosomal component plakoglobin 39, while USP1 acts directly on Akt to inhibit its activity by deubiquitination. Because USP1 is not induced during fasting (Fig EV3C), its activity most likely increases on binding to UAF1 (Fig 4D). This heterodimerization represents the most critical event in activation of USP1 26 and appears to require USP1 catalytic activity (Fig 4D). Interestingly, these proteins together with TSC1/TSC2 and PHLPP1 form one intact complex probably to efficiently exert the inhibitory effects on Akt to maintain PI3K‐Akt signaling low. UAF1 and PHLPP1 failed to bind USP1‐PHLPP1‐TSC1 complex in muscles overexpressing USP1(C90S) (Fig 4D) probably because the catalytically dead USP1 enzyme captures these proteins away from the native functional complex. Surprisingly, however, Akt remained bound to TSC1/TSC2 and USP1/UAF1 even when UAF1 failed to bind USP1 in muscles lacking functional USP1 (i.e., overexpressing USP1 catalytically dead mutant), indicating that Akt association with USP1 is not dependent on USP1 activity, and is most likely mediated by additional associated proteins. In fact, we identified Dab2 as essential for Akt recruitment to USP1‐PHLPP1‐TSC1 complex, most likely to facilitate the complete inhibition of Akt. Dab2 can bind Akt also in kidney cells, where it regulates albumin endocytosis 32. Moreover, in epithelia, Dab2 regulates signaling pathways (e.g., by Wnt, TGF‐β) that control differentiation, cell proliferation, and motility 31, 33, 48, 49, 50, and as shown here, it can also regulate the PI3K‐Akt cascade by binding to Akt. Activation of this pathway by IGF‐I or insulin promotes muscle growth by enhancing overall protein synthesis and inhibiting protein degradation 3, 18, and impaired signaling through this pathway in untreated diabetes, sepsis, and cancer cachexia 51 can cause severe muscle wasting, which can be inhibited by the activation of PI3K‐Akt‐FoxO signaling 52. Conversely, inhibition of this pathway has a major therapeutic benefit in treating cancer by blocking cell proliferation. Interestingly, Dab2 can regulate cell proliferation because its loss causes cancer 31, 53, and its ectopic expression blocks cancer cells proliferation 33. These growth‐suppressive effects by Dab2 activity can now be explained based upon our findings that this protein can suppress PI3K‐Akt signaling by promoting the recruitment of Akt to USP1‐PHLPP1‐TSC1 complex. Clearly, the exact mode of regulation of this association and the specific domains in each protein that constitute these interactions merit further study. In fasting, Dab2‐Akt association is mediated by Dab2's C‐terminal proline‐rich domain (Fig 5A), and similar proline‐rich domains can bind SH3‐containing proteins 54 including Akt as shown here (Fig 5A) 32. Inhibition of Dab2‐Akt association in vivo by the electroporation of a Dab2 dominant negative markedly reduced Akt association with USP1‐PHLPP1‐TSC1 complex and deubiquitination (Figs 5A–C), and enhanced Akt phosphorylation at T308 and S473 during fasting (Fig 5D). Therefore, Dab2 proline‐rich domain appears to be essential for Akt inactivation in the absence of insulin or growth factors. Under such physiological and pathological conditions where PI3K‐Akt signaling is low (e.g., fasting, type‐2 diabetes), liberation of Akt SH3 domain from signaling components that bind and activate it may be essential for Akt association with Dab2 and USP1‐PHLPP1‐TSC1 complex.
Mice lacking USP1 are small, tend to die early, and exhibit multiple defects, including osteopenia 23, infertility, and genome instability 25. These observations differ from the present findings on the effects of selective downregulation of USP1 in adult wild‐type mouse muscle. Presumably, the complete deficiency of USP1 during development causes multiple systemic defects that are probably related to dysregulation of DNA repair mechanisms. Because USP1 is an important regulator of PI3K‐Akt signaling in adult wild‐type mice muscles, mice lacking USP1 throughout development seem an inappropriate system to explore the physiological adaptation to prolonged starvation and regulation of PI3K‐Akt signaling under normal conditions. Here, we addressed such questions using transient electroporation to reduce USP1 levels or function in normal adult muscles to avoid possible developmental effects.
The expression of USP1 rises in several types of cancer 23, where this enzyme probably enhances cell survival by regulating DNA repair processes. However, mutations in USP1 have also been reported in certain human cancers 30, although the functional consequences of these mutations remain elusive. Perhaps these pathological sequelae may be due in part to altered signaling through the PI3K‐Akt‐FoxO pathway. If these mutations in USP1 cause a gain or loss of enzymatic function, then they might cause dysregulation of PI3K‐Akt signaling, which represents a common event in many cancers. The present findings would predict that a deficiency of USP1 could lead to excessive tissue growth and possibly inappropriate activation of PI3K‐Akt‐FoxO signaling. However, the cellular alterations in these cancers and the effects of the different mutations on USP1 activity are unclear 30, and require in‐depth study based upon the present identification of Akt as a new substrate and physiological roles. Because USP1 is a critical regulator of PI3K‐Akt signaling, it should also affect cell polarity, cell division, cell adhesion, mobility, metastasis, and neuronal function and therefore is likely to have important physiological or pathological effects in addition to the ones described herein.
Materials and Methods
In vivo transfection
All animal experiments were consistent with the ethical guidelines of the Israel Council on Animal Experiments, and the Technion Inspection Committee on the Constitution of the Animal Experimentation. Specialized personnel provided animal care in the Institutional Animal facility. In vivo electroporation experiments were performed in adult CD‐1 male mice (~30 g) (Envigo) as described previously 40, 55. In brief, 20 μg of DNA plasmid was injected into adult mouse TA muscles, and a mild electric pulse was applied using two electrodes, which were place underneath and on top of the muscle (12V, 5 pulses, 200‐ms intervals). The plasmids also encoded GFP to detect transfected muscle fibers. For in vivo CRISPR experiment (Figs 4G and EV3D), Cas9‐encoding plasmid and three guide RNAs against USP1 (Table EV2) were co‐electroporated into mouse muscle. In fasting experiments, food was removed from cages 5 d after electroporation.
Fiber size analysis and immunofluorescence
For fiber size analysis, cross sections of transfected muscles were fixed in 4% PFA, and the fiber membrane stained with laminin antibody. Cross‐sectional area of at least 500 transfected fibers (express GFP) and 500 adjacent non‐transfected ones in the same muscle section was measured using Imaris 8.2 software (Bitplane), and data were collected from at least 4 mice. Individual fiber size was determined in the entire muscle cross section by laminin staining (#L9393, Sigma) (using a 1:50 dilution of laminin antibody and a 1:1,000 dilution of Alexa Fluor 568‐conjugated secondary antibody). Images were collected using a Nikon Ni‐U upright fluorescence microscope with Plan Fluor 20× 0.5‐NA objective lens and a Hamamatsu C8484‐03 cooled CCD camera, at room temperature.
Representative images of electroporated mouse muscles were obtained by performing H&E staining and immunofluorescence on paraffin‐embedded cross sections of TA from fasted mice (2 days). Muscles were cut at 10 μm, and paraffin was removed with xylene for 5 min. Then, sections were gradually rehydrated in 100, 75, 50, 25, and 0% ethanol/PBS. Immunofluorescence analysis on the rehydrated sections was performed using a 1:30 dilution of MYH3 antibody, 1:100 dilution of wheat germ agglutinin, 1:50 dilution of phospho S6 antibody, 1:50 dilution of Dystrophin antibody, and a 1:1,000 dilution of Alexa Fluor 568 or 647‐conjugated secondary antibodies, all diluted in blocking solution (50 mg/ml BSA/TBS‐T).
Plasmid DNA and generation of shRNA
The shRNA oligo against USP1, USP11, OTUB2 (Table EV2), and Lacz was designed using Invitrogen's RNAi designer tool and was cloned into pcDNA 6.2‐GW/EmGFP‐miR vector using Invitrogen's BLOCK‐iT RNAi expression vector kit. The GFP‐tagged USP1(C90S) dominant‐negative encoding construct has been described previously 35. The mammalian expression vector encoding the C‐terminal proline‐rich domain of Dab2 was obtained from Dr. Philip Howe (Cleveland Clinic Lerner College of Medicine, Ohio, USA) 50, and the ones encoding HA‐tagged PHLPP1 and SFB‐tagged UAF1 were from Dr. Maddika Subbareddy (CDFD, India) 56. The plasmid encoding Akt(K8R) has been described previously 20. The Cas9‐encoding plasmid was obtained from IDT (1072566), and the three USP1 guide RNAs were purchased from Transomic.
Generation of shUSP1‐expressing lentivirus and cell culture work
Lentivirus expressing shUSP1 was generated by Gateway recombination of five plasmids from MuLe (Multiple Lentiviral Expression) system: #62175 R1‐R2 Destination expressing EGFP under the control of a PGK promoter, three Entry vectors each expressing different USP1 shRNA under the control of a 7SK RNA polymerase III promoter: #62106 L1‐R5, #62107 L5‐L4, #62109 R4‐R3, and additional empty #62088 L3‐L2 vector. The USP1 shRNAs were cloned into the entry vectors by ligation into BglII and SacI cloning sites using the primers: 5′‐GATCGTTATGAGCTTATATGTAGACTCGA GACTACATATAAGCTCATAACTTTTGAGCT and 5′‐CAAAAGTTAT GAGCTTATATGTAGTCTCGAGTCTACATATAAGCTCATAAC for #62106 vector, 5′‐GATCGCACAGTGGCATTACTATTAACTCGAGATAATAGTAATGCCACTGTGCTTTTGAGCT and 5′‐CAAAAGCACAGTGG CATTACTATTATCTCGAGTTAATAGTAATGCCACTGTGC for #62107 vector, and 5′‐GATCGATTATGAGCTGTACAACAAACTCGAGATTGTTGTACAGCTCATAATCTTTTGAGCT and 5’‐CAAAAGATTATGAGCTGTACAACAATCTCGAGTTTGTTGTACAGCTCATAATC for #62109 vector. The control Transfer plasmid was constructed by combining the following MuLe plasmids: #62175 R1‐R2, #62135 L1‐R5, #62138 L5‐L4, #62137 R4‐R3, and #62088 L3‐L2. The entry plasmids #62135, #62137, and #62138 contain scrambled shRNA module. Lentivirus particles were produced by transfecting 80% confluent HEK293FT cells grown on polylysine coated 100‐mm plates with 5 μg of the Transfer plasmid encoding shUSP1, 3 μg of MD2.G plasmid (#12259 Addgene), and 6 μg of PAX2 plasmid (#12260, Addgene). DNA was mixed with 0.42 ml of OPTIMEM medium and 42 μl of Linear Polyethylenimine (MW 25000, Polysciences), incubated for 20 min at RT, and added to the cells grown in DMEM supplemented with 10% fetal bovine serum, 1% sodium pyruvate, 1% l‐Glutamine, and 1% sodium bicarbonate. On the next day, growth medium was replaced, and 24 h later collected, filtrated through 0.45 filter, and stored at −80°C.
For lentiviral infection of C2C12 cells (Fig EV3F), 3 ml of medium containing lentiviruses was centrifuged for 90 min at 90,000× g and 4°C, the pellet was resuspended in 100 μl of DMEM and used for infection of 70% confluent C2C12 myoblasts. To enhance cell infection, 8μg/μl of Polybrene was added to cell growth medium (DMEM supplemented with 10% fetal bovine serum, 1% l‐Glutamine, and Pen/Strep). Two days later, the medium was replaced to differentiation medium (DMEM supplemented with 2% Horse Serum, 1% l‐Glutamine, and Pen/Strep), and cells were left to differentiate for 4–5 days (differentiation medium was replaced every other day). Serum starvation was induced by exposing myotubes to DMEM supplemented with 0.1% BSA for 6 h, and then, cells were collected and analyzed by SDS–PAGE and immunoblotting. To inhibit proteasome activity, 100 nM Epoxomicin was added to starvation medium for 4 h. To inhibit protein synthesis, C2C12 myotubes were treated with rapamycin (20 nM) for 6 h.
Antibodies and materials
Anti‐actin (#A2066), GAPDH (#G8975), FLAG (#F1804), and Laminin (#L9393) were purchased from Sigma‐Aldrich. Anti‐phospho Insulin receptor (Y1361)(#60946), Dystrophin (#ab15277), and GFP (#ab290) were from Abcam; anti‐USP1 (#14346‐1‐AP) and anti‐PHLPP1 (#22789‐1‐AP) were from Proteintech; anti‐UAF1 (#514473), Akt2 (#sc‐5270), and Dab2 (#136964) were from Santa Cruz; anti‐Akt (#9272), Akt1 (#2938S), Akt3 (#14982S), FoxO (#2497), Insulin receptor (#5025), phospho Akt S473 (#9271), phospho Akt T308 (#9275), phospho FoxO (#9464), phospho GSK3 (#8566), phospho S6K (#9205), phospho S6 (#2215), TSC1 (#6935), and TSC2 (#3990S) were from Cell Signaling Technology. Anti‐puromycin (#MABE343) and anti‐polyubiquitin K63‐linked chains (#051308) were from Millipore, and anti‐mono and polyubiquitin conjugates from Enzo (#BML‐PW1210). MYH3 (F1.652) and OTUB2 antibodies were obtained from Developmental Studies Hybridoma Bank under the auspices of the National Institute of Child Health and Human Development (University of Iowa, Iowa City, IA): OTUB2 was deposited by “Clinical Proteomics Technologies for Cancer” (National Cancer Institute, USA), and MYH3 was deposited by Dr. Blau H.M. (Stanford Univ, USA). The secondary antibodies anti‐rabbit IgG‐HRP (#111‐035‐144) and anti‐mouse IgG‐HRP (#115‐035‐003) were from Jackson ImmunoResearch, and Alexa Flour 568 goat anti‐rabbit IgG was from Thermo Fisher (#A‐11011). The DUB scan kit was from Ubiquigent (#67‐0006‐001).
Skeletal muscle homogenization
Skeletal muscles were homogenized in cold Homogenization Buffer (20 mM Tris pH 7.2, 5 mM EGTA, 100 mM KCl, 1% Triton X‐100, 10 mM Sodium Pyrophosphate, 50 mM NaF, 2 mM Sodium Orthovanadate, 10 μg/ml Aprotinin, 10 μg/ml Leupeptin, 3 mM Benzamidine, 1 mM PMSF). Following incubation for 1 h at 4°C, and centrifugation at 6,000× g for 20 min at 4°C, the supernatant (soluble fraction) was stored at −80°C.
Protein analysis
For immunoblotting, soluble fractions from TA muscles, as well as the in vitro deubiquitination reactions, were resolved by SDS–PAGE, transferred onto Nitrocellulose or PVDF membranes, and immunoblotted with specific antibodies and secondary antibodies conjugated to HRP. Immunoprecipitation experiments from muscle homogenates (1:50 dilution of primary antibody) were performed overnight at 4°C, and then, protein A/G agarose beads was added for 3‐h incubation at 4°C. To remove non‐specific or weakly associated proteins, tubes were centrifuged at 4,500 g for 5 min at 4°C, supernatant was discarded, and precipitates were washed extensively with 10 bed volumes of high (50 mM Tris–HCl pH 8, 500 mM NaCl, 0.1% SDS, 0.1% Triton, 5 mM EDTA), medium (50 mM Tris–HCl pH 8, 150 mM NaCl, 0.1% SDS, 0.1% Triton, 5 mM EDTA), and low (50 mM Tris–HCl pH 8, 0.1% Triton, 5 mM EDTA) salt buffers. Protein precipitates were then analyzed by SDS–PAGE and immunoblotting.
For glycerol gradient fractionation, two glycerol stocks of 10 and 40% were prepared in buffer G (20 mM Tris pH 7.6, 0.46 mM EDTA/NaOH pH 8, 100 mM KCl, 1 mM DTT, 0.25% sodium deoxycholate, 1 mM Sodium Orthovanadate), layered one on top of the other, and the gradient was left to form overnight at 4°C. Muscle homogenates from fed and fasted mice (300 μg) were loaded on the top of the gradient, and following centrifugation for 24 h at 130,000 g (SW 55Ti rotor) and 4°C, equal volumes of protein fractions were collected from the bottom of the tube. Proteins were precipitated using 10% trichloroacetic acid at 4°C overnight, centrifuged at 11,500 g for 10 min at 4°C, and washed twice with acetone, and alternate fractions analyzed by SDS–PAGE and immunoblotting.
Mass spectrometry analysis
To identify the proteins mediating USP1‐Akt association during fasting, four immunoprecipitation experiments from mouse muscle homogenates during fasting were subjected to in‐solution tryptic digest followed by mass spectrometry analysis. An IgG antibody was used as a control for non‐specific binding. The data were processed using the Genedata Expressionist system and searched using Mascot against the mouse sequences in UniprotKB appended with 125 common laboratory proteins (like keratins, albumin, etc.). Data were filtered for 1% FDR at the peptide and protein level. The ratios of protein intensities in each sample versus IgG control were calculated, and proteins that were at least three times more abundant in the immunoprecipitation reaction than in IgG control were considered. Among identified proteins, 29 proteins were enriched in all four samples and were at least 1,000 times more abundant in the immunoprecipitation samples than in IgG control.
Glucose tolerance test
D‐glucose (1 mg/g body weight) was administered to mice by intraperitoneally injection. Blood glucose levels were measured before the injection, and 5, 15, 30, 45, 60, 75, and 120 min later by blood glucose monitor device.
In vivo measurement of protein synthesis rates
Five days after muscle electroporation, mice were deprived of food for 2 days, and 30 min before euthanasia, they were anesthetized and injected with puromycin (0.04 μmol/g body weight, i.p.). Exactly 25 min after puromycin injection, mice were sacrificed, and dissected TA muscles were snap‐frozen in liquid nitrogen. Effects on protein synthesis rates were measured by SDS–PAGE and immunoblotting using puromycin antibody (Millipore, #MABE343).
Quantitative real‐time PCR
Total RNA was isolated from muscle using TRI‐reagent (Sigma, #T9424) and served as a template for synthesis of cDNA by reverse transcription (Quanta script cDNA synthesis kit, #84005, #84002). Real‐time qPCR was performed on mouse target genes using specific primers (Table EV2) and PerfecTa SYBR Green FastMix (Quanta 84071) according to manufacturer's protocol.
Statistical analysis and image acquisition
Data are presented as means ± SEM. The statistical significance was determined with one‐tailed paired Student's t‐test. Alpha level was set to 0.05. Black and white images were processed with Adobe Photoshop CS5, version 12.1. Quantity One algorithm (Bio‐Rad Laboratories version 29.0) was used for densitometric measurements of protein bands intensity. Muscle sections were imaged at room temperature using a Nikon Ni‐U upright fluorescence microscope with Plan Fluor 20× 0.5‐NA objective lens and a Hamamatsu C8484‐03 cooled CCD camera. Image acquisition and processing was performed using Imaris software (Bitplane).
Author contributions
DG and DN performed all experiments. YE‐M performed the experiment presented in Fig 2E. IL performed experiments presented in Figs 1F and 2A. JEG performed experiments presented in Figs 5D and EV2 and EV3D. AP performed experiments presented in Figs EV3F and EV4E. DG, DN, and SC designed experiments and analyzed data. SC conceived the project and wrote the paper.
Conflict of interest
The authors declare that they have no conflict of interest.
Supporting information
Expanded View Figures PDF
Table EV1
Table EV2
Source Data for Expanded View
Review Process File
Source Data for Figure 1
Source Data for Figure 2
Source Data for Figure 3
Source Data for Figure 4
Source Data for Figure 5
Acknowledgements
This project was supported by grants from the Israel Science Foundation (grant no. 623/15), the Israel Ministry of Science, Technology and Space (grant no. 2015‐3‐74), and the Niedersachsen‐Deutsche (grant no. ZN3008) to S. Cohen. Additional funds were received from the Russell Berrie Nanotechnology Institute, Technion, and Dr. Bernard and Bobbie Lublin Cancer Research award to S. Cohen, and Zuckerman STEM Postdoctoral Fellowship to J.E. Gilda. We acknowledge the de Botton Institute for Protein Profiling at Weizmann Institute of Science for the mass spectrometry analysis.
EMBO Reports (2020) 21: e48791
References
- 1. Latres E, Amini AR, Amini AA, Griffiths J, Martin FJ, Wei Y, Lin HC, Yancopoulos GD, Glass DJ (2005) Insulin‐like growth factor‐1 (IGF‐1) inversely regulates atrophy‐induced genes via the phosphatidylinositol 3‐kinase/Akt/mammalian target of rapamycin (PI3K/Akt/mTOR) pathway. J Biol Chem 280: 2737–2744 [DOI] [PubMed] [Google Scholar]
- 2. Bonaldo P, Sandri M (2013) Cellular and molecular mechanisms of muscle atrophy. Dis Model Mech 6: 25–39 [DOI] [PMC free article] [PubMed] [Google Scholar]
- 3. Glass DJ (2005) Skeletal muscle hypertrophy and atrophy signaling pathways. Int J Biochem Cell Biol 37: 1974–1984 [DOI] [PubMed] [Google Scholar]
- 4. Zhao J, Brault JJ, Schild A, Goldberg AL (2008) Coordinate activation of autophagy and the proteasome pathway by FoxO transcription factor. Autophagy 4: 378–380 [DOI] [PubMed] [Google Scholar]
- 5. Mammucari C, Milan G, Romanello V, Masiero E, Rudolf R, Del Piccolo P, Burden SJ, Di Lisi R, Sandri C, Zhao J et al (2007) FoxO3 controls autophagy in skeletal muscle in vivo . Cell Metab 6: 458–471 [DOI] [PubMed] [Google Scholar]
- 6. Hanada M, Feng J, Hemmings BA (2004) Structure, regulation and function of PKB/AKT ‐ A major therapeutic target. Biochim Biophys Acta 1697: 3–16 [DOI] [PubMed] [Google Scholar]
- 7. Boucher J, Kleinridders A, Kahn CR (2014) Insulin receptor signaling in normal and insulin‐resistant states. Cold Spring Harb Perspect Biol 6: a009191 [DOI] [PMC free article] [PubMed] [Google Scholar]
- 8. Lecker SH, Jagoe RT, Gilbert A, Gomes M, Baracos V, Bailey J, Price SR, Mitch WE, Goldberg AL (2004) Multiple types of skeletal muscle atrophy involve a common program of changes in gene expression. FASEB J 18: 39–51 [DOI] [PubMed] [Google Scholar]
- 9. DeYoung MP, Horak P, Sofer A, Sgroi D, Ellisen LW (2008) Hypoxia regulates TSC1/2‐mTOR signaling and tumor suppression through REDD1‐mediated 14‐3‐3 shuttling. Genes Dev 22: 239–251 [DOI] [PMC free article] [PubMed] [Google Scholar]
- 10. Magnuson B, Ekim B, Fingar DC (2012) Regulation and function of ribosomal protein S6 kinase (S6K) within mTOR signalling networks. Biochem J 441: 1–21 [DOI] [PubMed] [Google Scholar]
- 11. Thoreen CC, Chantranupong L, Keys HR, Wang T, Gray NS, Sabatini DM (2012) A unifying model for mTORC1‐mediated regulation of mRNA translation. Nature 485: 109–113 [DOI] [PMC free article] [PubMed] [Google Scholar]
- 12. Amirouche A, Durieux A‐C, Banzet S, Koulmann N, Bonnefoy R, Mouret C, Bigard X, Peinnequin A, Freyssenet D (2009) Down‐regulation of Akt/Mammalian target of rapamycin signaling pathway in response to myostatin overexpression in skeletal muscle. Endocrinology 150: 286–294 [DOI] [PubMed] [Google Scholar]
- 13. Eskelinen E‐L (2006) Roles of LAMP‐1 and LAMP‐2 in lysosome biogenesis and autophagy. Mol Aspects Med 27: 495–502 [DOI] [PubMed] [Google Scholar]
- 14. Ploug T, van Deurs B, Ai H, Cushman SW, Ralston E (1998) Analysis of GLUT4 distribution in whole skeletal muscle fibers: identification of distinct storage compartments that are recruited by insulin and muscle contractions. J Cell Biol 142: 1429–1446 [DOI] [PMC free article] [PubMed] [Google Scholar]
- 15. Sandri M, Sandri C, Gilbert A, Skurk C, Calabria E, Picard A, Walsh K, Schiaffino S, Lecker SH, Goldberg AL (2004) Foxo transcription factors induce the atrophy‐related ubiquitin ligase atrogin‐1 and cause skeletal muscle atrophy. Cell 117: 399–412 [DOI] [PMC free article] [PubMed] [Google Scholar]
- 16. Zhao J, Brault JJ, Schild A, Cao P, Sandri M, Schiaffino S, Lecker SH, Goldberg AL (2007) FoxO3 coordinately activates protein degradation by the autophagic/lysosomal and proteasomal pathways in atrophying muscle cells. Cell Metab 6: 472–483 [DOI] [PubMed] [Google Scholar]
- 17. Lai KM, Gonzalez M, Poueymirou WT, Kline WO, Na E, Zlotchenko E, Stitt TN, Economides AN, Yancopoulos GD, Glass DJ (2004) Conditional activation of akt in adult skeletal muscle induces rapid hypertrophy. Mol Cell Biol 24: 9295–9304 [DOI] [PMC free article] [PubMed] [Google Scholar]
- 18. Sacheck JM, Ohtsuka A, McLary SC, Goldberg AL (2004) IGF‐I stimulates muscle growth by suppressing protein breakdown and expression of atrophy‐related ubiquitin ligases, atrogin‐1 and MuRF1. Am J Physiol Endocrinol Metab 287: E591–E601 [DOI] [PubMed] [Google Scholar]
- 19. Burke JE, Vadas O, Berndt A, Finegan T, Perisic O, Williams RL (2011) Dynamics of the phosphoinositide 3‐kinase p110δ interaction with p85α and membranes reveals aspects of regulation distinct from p110α. Structure 19: 1127–1137 [DOI] [PMC free article] [PubMed] [Google Scholar]
- 20. Yang WL, Wang J, Chan CH, Lee SW, Campos AD, Lamothe B, Hur L, Grabiner BC, Lin X, Darnay BG et al (2009) The E3 ligase TRAF6 regulates akt ubiquitination and activation. Science 325: 1134–1138 [DOI] [PMC free article] [PubMed] [Google Scholar]
- 21. Hu M, Li P, Li M, Li W, Yao T, Wu JW, Gu W, Cohen RE, Shi Y (2002) Crystal structure of a UBP‐family deubiquitinating enzyme in isolation and in complex with ubiquitin aldehyde. Cell 111: 1041–1054 [DOI] [PubMed] [Google Scholar]
- 22. Nijman SMB, Huang TT, Dirac AMG, Brummelkamp TR, Kerkhoven RM, D'Andrea AD, Bernards R (2005) The deubiquitinating enzyme USP1 regulates the fanconi anemia pathway. Mol Cell 17: 331–339 [DOI] [PubMed] [Google Scholar]
- 23. Williams SA, Maecker HL, French DM, Liu J, Gregg A, Silverstein LB, Cao TC, Carano RAD, Dixit VM (2011) USP1 deubiquitinates ID proteins to preserve a mesenchymal stem cell program in osteosarcoma. Cell 146: 918–930 [DOI] [PubMed] [Google Scholar]
- 24. Maedler K, Yuan T, Lupse B, Gorrepati KDD, Annamalai K, Ardestani A (2018) Loss of deubiquitinase USP1 blocks pancreatic β‐cell apoptosis by inhibiting DNA damage response. iScience 1: 72–86 [DOI] [PMC free article] [PubMed] [Google Scholar]
- 25. Kim JM, Parmar K, Huang M, Weinstock DM, Ruit CA, Kutok JL, D'Andrea AD (2009) Inactivation of murine Usp1 results in genomic instability and a fanconi anemia phenotype. Dev Cell 16: 314–320 [DOI] [PMC free article] [PubMed] [Google Scholar]
- 26. Cohn MA, Kowal P, Yang K, Haas W, Huang TT, Gygi SP, D'Andrea AD (2007) A UAF1‐containing multisubunit protein complex regulates the Fanconi anemia pathway. Mol Cell 28: 786–797 [DOI] [PubMed] [Google Scholar]
- 27. Cotto‐Rios XM, Jones MJK, Huang TT (2011) Insights into phosphorylation‐dependent mechanisms regulating USP1 protein stability during the cell cycle. Cell Cycle 10: 4009–4016 [DOI] [PMC free article] [PubMed] [Google Scholar]
- 28. Piatkov KI, Colnaghi L, Békés M, Varshavsky A, Huang TT (2012) The auto‐generated fragment of the Usp1 deubiquitylase is a physiological substrate of the N‐end rule pathway. Mol Cell 48: 926–933 [DOI] [PMC free article] [PubMed] [Google Scholar]
- 29. Mistry H, Hsieh G, Buhrlage SJ, Huang M, Park E, Cuny GD, Galinsky I, Stone RM, Gray NS, D'Andrea AD et al (2013) Small‐molecule inhibitors of USP1 target ID1 degradation in leukemic cells. Mol Cancer Ther 12: 2651–2662 [DOI] [PMC free article] [PubMed] [Google Scholar]
- 30. García‐Santisteban I, Peters GJ, Giovannetti E, Rodríguez JA (2013) USP1 deubiquitinase: cellular functions, regulatory mechanisms and emerging potential as target in cancer therapy. Mol Cancer 12: 91 [DOI] [PMC free article] [PubMed] [Google Scholar]
- 31. Yang K, Li YW, Gao ZY, Xiao W, Li TQ, Song W, Zheng J, Chen H, Chen GH, Zou HY (2019) MiR‐93 functions as a tumor promoter in prostate cancer by targeting disabled homolog 2 (DAB2) and an antitumor polysaccharide from green tea (Camellia sinensis) on their expression. Int J Biol Macromol 125: 557–565 [DOI] [PubMed] [Google Scholar]
- 32. Koral K, Erkan E (2012) PKB/Akt partners with Dab2 in albumin endocytosis. Am J Physiol Renal Physiol 302: F1013–F1024 [DOI] [PMC free article] [PubMed] [Google Scholar]
- 33. Zhoul J, Hernandez G, Tu SW, Huang CL, Tseng CP, Hsieh JT (2005) The role of DOC‐2/DAB2 in modulating androgen receptor‐mediated cell growth via the nongenomic c‐Src‐mediated pathway in normal prostatic epithelium and cancer. Cancer Res 65: 9906–9913 [DOI] [PubMed] [Google Scholar]
- 34. Chen J, Dexheimer TS, Ai Y, Liang Q, Villamil MA, Inglese J, Maloney DJ, Jadhav A, Simeonov A, Zhuang Z (2011) Selective and cell‐active inhibitors of the USP1/UAF1 deubiquitinase complex reverse cisplatin resistance in non‐small cell lung cancer cells. Chem Biol 18: 1390–1400 [DOI] [PMC free article] [PubMed] [Google Scholar]
- 35. Olazabal‐Herrero A, García‐Santisteban I, Rodríguez JA (2016) Mutations in the “Fingers” subdomain of the deubiquitinase USP1 modulate its function and activity. FEBS J 283: 929–946 [DOI] [PubMed] [Google Scholar]
- 36. Stitt TN, Drujan D, Clarke BA, Panaro F, Timofeyva Y, Kline WO, Gonzalez M, Yancopoulos GD, Glass DJ (2004) The IGF‐1/PI3K/Akt pathway prevents expression of muscle atrophy‐induced ubiquitin ligases by inhibiting FOXO transcription factors. Mol Cell 14: 395–403 [DOI] [PubMed] [Google Scholar]
- 37. Bodine SC, Latres E, Baumhueter S, Lai VK, Nunez L, Clarke BA, Poueymirou WT, Panaro FJ, Na E, Dharmarajan K et al (2001) Identification of ubiquitin ligases required for skeletal muscle atrophy. Science 294: 1704–1708 [DOI] [PubMed] [Google Scholar]
- 38. Gomes MD, Lecker SH, Jagoe RT, Navon A, Goldberg AL (2001) Atrogin‐1, a muscle‐specific F‐box protein highly expressed during muscle atrophy. Proc Natl Acad Sci USA 98: 14440–14445 [DOI] [PMC free article] [PubMed] [Google Scholar]
- 39. Cohen S, Lee D, Zhai B, Gygi SP, Goldberg AL (2014) Trim32 reduces PI3K‐Akt‐FoxO signaling in muscle atrophy by promoting plakoglobin‐PI3K dissociation. J Cell Biol 204: 747–758 [DOI] [PMC free article] [PubMed] [Google Scholar]
- 40. Aweida D, Rudesky I, Volodin A, Shimko E, Cohen S (2018) GSK3‐β promotes calpain‐1‐mediated desmin filament depolymerization and myofibril loss in atrophy. J Cell Biol 217: 3698–3714 [DOI] [PMC free article] [PubMed] [Google Scholar]
- 41. Liang Q, Dexheimer TS, Zhang P, Rosenthal AS, Villamil MA, You C, Zhang Q, Chen J, Ott CA, Sun H et al (2014) A selective USP1–UAF1 inhibitor links deubiquitination to DNA damage responses. Nat Chem Biol 10: 298–304 [DOI] [PMC free article] [PubMed] [Google Scholar]
- 42. Gao T, Furnari F, Newton AC (2005) PHLPP: a phosphatase that directly dephosphorylates Akt, promotes apoptosis, and suppresses tumor growth. Mol Cell 18: 13–24 [DOI] [PubMed] [Google Scholar]
- 43. Wullschleger S, Loewith R, Hall MN (2006) TOR signaling in growth and metabolism. Cell 124: 471–484 [DOI] [PubMed] [Google Scholar]
- 44. Inoki K, Li Y, Zhu T, Wu J, Guan KL (2002) TSC2 is phosphorylated and inhibited by Akt and suppresses mTOR signalling. Nat Cell Biol 4: 648–657 [DOI] [PubMed] [Google Scholar]
- 45. Huang TT, Nijman SMB, Mirchandani KD, Galardy PJ, Cohn MA, Haas W, Gygi SP, Ploegh HL, Bernards R, D'Andrea AD (2006) Regulation of monoubiquitinated PCNA by DUB autocleavage. Nat Cell Biol 8: 339–347 [DOI] [PubMed] [Google Scholar]
- 46. Kumar A, Bhatnagar S, Paul PK (2012) TWEAK and TRAF6 regulate skeletal muscle atrophy. Curr Opin Clin Nutr Metab Care 15: 233–239 [DOI] [PMC free article] [PubMed] [Google Scholar]
- 47. Sandri M (2008) Signaling in muscle atrophy and hypertrophy. Physiology 23: 160–170 [DOI] [PubMed] [Google Scholar]
- 48. Hocevar BA, Smine A, Xu XX, Howe PH (2001) The adaptor molecule disabled‐2 links the transforming growth factor β receptors to the Smad pathway. EMBO J 20: 2789–2801 [DOI] [PMC free article] [PubMed] [Google Scholar]
- 49. Jiang Y, He X, Howe PH (2012) Disabled‐2 (Dab2) inhibits Wnt/β2‐catenin signalling by binding LRP6 and promoting its internalization through clathrin. EMBO J 31: 2336–2349 [DOI] [PMC free article] [PubMed] [Google Scholar]
- 50. Hocevar BA, Prunier C, Howe PH (2005) Disabled‐2 (Dab2) mediates transforming growth factor β (TGFβ)‐stimulated fibronectin synthesis through TGFβ‐activated kinase 1 and activation of the JNK pathway. J Biol Chem 280: 25920–25927 [DOI] [PubMed] [Google Scholar]
- 51. Zhou X, Wang JL, Lu J, Song Y, Kwak KS, Jiao Q, Rosenfeld R, Chen Q, Boone T, Simonet WS et al (2010) Reversal of cancer cachexia and muscle wasting by ActRIIB antagonism leads to prolonged survival. Cell 142: 531–543 [DOI] [PubMed] [Google Scholar]
- 52. Wang X, Hu Z, Hu J, Du J, Mitch WE (2006) Insulin resistance accelerates muscle protein degradation: activation of the ubiquitin‐proteasome pathway by defects in muscle cell signaling. Endocrinology 147: 4160–4168 [DOI] [PubMed] [Google Scholar]
- 53. Sheng Z, Sun W, Smith E, Cohen C, Sheng Z, Xu XX (2000) Restoration of positioning control following Disabled‐2 expression in ovarian and breast tumor cells. Oncogene 19: 4847–4854 [DOI] [PubMed] [Google Scholar]
- 54. Yu H, Chen JK, Feng S, Dalgarno DC, Brauer AW, Schrelber SL (1994) Structural basis for the binding of proline‐rich peptides to SH3 domains. Cell 76: 933–945 [DOI] [PubMed] [Google Scholar]
- 55. Volodin A, Kosti I, Goldberg AL, Cohen S (2017) Myofibril breakdown during atrophy is a delayed response requiring the transcription factor PAX4 and desmin depolymerization. Proc Natl Acad Sci USA 114: E1375–E1384 [DOI] [PMC free article] [PubMed] [Google Scholar]
- 56. Gangula NR, Maddika S (2013) WD repeat protein WDR48 in complex with deubiquitinase USP12 suppresses Akt‐dependent cell survival signaling by stabilizing PH domain leucine‐rich repeat protein phosphatase 1 (PHLPP1). J Biol Chem 288: 34545–34554 [DOI] [PMC free article] [PubMed] [Google Scholar]
Associated Data
This section collects any data citations, data availability statements, or supplementary materials included in this article.
Supplementary Materials
Expanded View Figures PDF
Table EV1
Table EV2
Source Data for Expanded View
Review Process File
Source Data for Figure 1
Source Data for Figure 2
Source Data for Figure 3
Source Data for Figure 4
Source Data for Figure 5