

Abstract
At present, little research has been done on the metabolic phenotype of the differentiation of mesenchymal stem cells (MSCs) into osteoblasts. In this study, the effect of astaxanthin on improving osteogenic differentiation potential of mesenchymal stem cells was studied by metabolomics. Results showed that L-methionine, L-tyrosine, and 2-hydroxycinnamic acid were upregulated in MSCs treated with astaxanthin, while L-lysine, L-pipecolic acid, L-histidine, L-arginine, D-fructose, and L-aspartic acid were downregulated in samples treated with astaxanthin. In addition, astaxanthin exhibited a significant dose-dependent relationship with these markers. Metabolic pathway enrichment analysis revealed that AST mainly regulated phenylalanine metabolism; phenylalanine, tyrosine, and tryptophan biosynthesis; and pantothenate and CoA biosynthesis during the process of osteogenic differentiation of MSCs. Furthermore, the staining results showed that astaxanthin could actively promote the osteogenic differentiation of mesenchymal stem cells. These findings clearly indicate that astaxanthin plays an important role in inducing osteogenic differentiation of mesenchymal stem cells. In addition, the changed metabolites can be used to monitor the differentiation process.
1. Introduction
Mesenchymal stem cells (MSCs) are multifunctional cells widely used in muscle and skeletal tissue regeneration and currently account for the largest share of the global tissue engineering market [1, 2]. MSCs derived from fetal tissues have become an attractive alternative to adult mesenchymal stem cells. Because of their high proliferation potential, they have become a promising source of cells for personalized bone transplantation [3, 4]. Mesenchymal stem cells undergo unique metabolic changes during their differentiation into osteoblasts. At present, there is little information about the metabolic phenotype of the process of osteogenesis. Astaxanthin (AST), a lipid-soluble red-orange carotenoid pigment discovered in 1938, was originally used as the sole pigmentation in aquaculture. Then, AST was used as a food supplement due to its antioxidant physiological properties as the precursor of vitamin A [5]. At present, AST research is increasing due to its promotion of human health [6]. AST exhibits several of the common physiological and metabolic activities assigned to carotenoids [7, 8]. AST can be employed in the treatment of OA [9]. AST reduces the expression of MMP-1, MMP-3, and MMP-13 in osteoarthritis, rheumatoid arthritis, and osteoporosis and the phosphorylation of chondrocytes induced by MAPK p38, ERK1/2, and IL-1beta [10]. AST can also enhance the proliferation and differentiation of osteoblasts in neural stem cells [11].
Metabolomics provides a global analysis of cell metabolism and has been proven to be a useful tool for monitoring cell culture [12]. Metabolomics can be used for the study of the physiology of stem cell metabolism to clarify the metabolic network state [13], by use of multivariate analysis to explain the correlation between pathways, which is neglected by traditional enzyme activity tests that focus on a limited number of enzymes and the analysis of specific metabolites, and it also has been used to identify small molecules secreted by ESCs when exposed to sodium valproate [14] and steroid hormones [15] and to monitor cartilage formation in MSCs [16]. Recent studies on the metabolism of MSCs, mainly based on extracellular metabolites, have shown that differentiated MSCs exhibit a specific metabolic phenotype. However, a specific marker of osteogenic differentiation of mesenchymal stem cells was not identified.
In our study, LCMS was used to detect the metabolite changes of mesenchymal stem cells (MSCs) during the differentiation of osteoblasts induced by AST. The results showed that mesenchymal stem cells exhibited a specific metabolite change related to the differentiation. This study shows that astaxanthin has the ability to induce osteogenic differentiation of mesenchymal stem cells. It is feasible to monitor the differentiation of mesenchymal stem cells by using cell-specific metabolic markers identified by LCMS.
2. Materials and Methods
2.1. Experimental Procedures
DMEM medium, fetal bovine serum, penicillin, and streptomycin were purchased from Gibco (Gibco, Life Technologies, UK). Trypsin, beta-glycerophosphate, 3-isobutyl-1-methylxanthine (IBMX), dexamethasone sodium phosphate, L-ascorbic acid, and insulin were purchased from Sigma-Aldrich Chemicals (St. Louis, MO, USA). CD34, CD44, CD45, and CD90 antibodies were obtained from BD Biosciences. Astaxanthin was purchased from Sigma-Aldrich Chemicals (St. Louis, MO, USA) and was made a stock solution with dimethyl sulfoxide (DMSO) and then was diluted to 1 μg/ml and 10 μg/ml.
2.2. Isolation and Culture of BMSCs
Rats were anesthetized with 2% pentobarbital, and 75% ethanol solution was used for a 5 min whole body disinfection. The femur and tibia were removed under aseptic conditions and cleaned 3 times with PBS. The epiphyses of the femur and tibia were removed to expose the bone marrow cavity. The bone marrow was washed out with DMEM medium supplemented with penicillin and streptomycin, resuspended repeatedly into a single cell suspension, and then centrifuged at 1000 rpm for 5 min. The supernatant was discarded, and the cells were inoculated into a 25 cm [3] culture flask at a concentration of 1 × 10⁹/l.
2.3. Cultivation, Purification, and Passage of BMSCs
After 48 h, the medium was completely replaced and thereafter replaced with fresh medium every 3 days. The cells were digested with 0.25% trypsin and subcultured in a ratio of 1 : 2 when the cells covered the bottom of the flask and fused into a single layer with a density of 70%~80%. Cells were further cultured with the same culture medium at 37°C in an environment of 21% O2 and 5% CO2. The culture medium was changed twice a week, and the cells were passaged before reaching 80% confluence. Cells between passages 4 and 6 were used for subsequent experiments. For osteogenic differentiation, the culture medium was supplemented with 1 μg/ml and 10 μg/ml AST (Sigma-Aldrich, UK).
Bone marrow mesenchymal cells (BMSCs), from SD rats, that were growing well were cultured for 2 generations and inoculated into a 96-well culture plate. When the density of the BMSCs was 5∗103/well, the culture plate was placed in a CO2 incubator. Aliquots were taken daily for the CCK-8 assay. The wavelength of 450 nm was selected, and the optical absorption value of each well was measured by ELISA. The cell growth curve was drawn on the longitudinal axis with the time as the transverse axis and the light absorption value as the longitudinal axis. The cell concentration was adjusted to 1∗109/l. The cell cycle was detected by flow cytometry after a 30 min incubation with 100 μl RNAase and 400 μl PI stain in a water bath at 37°C.
2.4. Identification of BMSCs
The cells were digested by 0.25% trypsin and centrifuged at 4°C at 1000 rpm for 5 min. The cells were washed 3 times with PBS (containing 1% BSA) and then counted. Monoclonal antibodies CD34, CD44, CD45, and CD90 were then added to the tubes. The cells were incubated on dry ice for 45 min and washed with PBS (containing 1% BSA) three times to remove the unbounded antibody. The cells were suspended with 500 μl of PBS (containing 1% BSA) and analyzed by flow cytometry.
2.5. Differentiation of BMSCs In Vitro
When the cell density reached 80%, the following inducers were added to the complete culture medium of each induction well: (1) adipocyte inducers (1 mmol/l dexamethasone, 10 mg/l insulin, 50 mmol/l IBMX, and 0.2 mmol/l indomethacin) and (2) osteoblast inducers (1 mmol/l dexamethasone, 1 mmol/l beta-glycerophosphate, and 50 mmol/l ascorbic acid). The inducting medium in each induction well was changed 2 times a week, and the cell culture wells without inducing medium were used as controls. After 21 days of induction, the effect of AST on BMSC culture mineralization was evaluated using Alizarin Red Staining (ARS). And cells were stained for 15 min with 0.01% ARS (3,4-dihydroxy-9,10-dioxo-2-nthracenesulfonic acid sodium salt, from Sigma-Aldrich, St. Louis, MO) dissolved in 70% ethanol. Acetic acid (10%) (Sigma-Aldrich, UK) was added to the ARS-stained culture, and the suspension was vortexed and heated to 85°C for 10 min. Subsequently, the pH was adjusted between 4.1 and 4.5 with 10% ammonium hydroxide (Sigma-Aldrich, UK), and the absorbance values were read at 405 nm with an ELISA reader (ELx808, BioTek, UK). Cell nuclei were evident due to hematoxylin counterstaining. Images were captured using a digital color camera (Nikon D1) mounted on the microscope. The end results were quantified as described in this paper [17].
For the sample selected for LCMS analysis, the growth medium was removed, cells were washed with sterile 1x PBS and quenched with 1 ml ice-cold methanol, and the mixture was transferred to 5 ml tubes. And the mixture was quickly vortexed and then centrifuged at 12,000 rpm for 10 min at 4°C. The supernatants were transferred to the injection vial for LCMS analysis.
2.6. Metabolomic Analysis
LCMS was performed using a binary high-performance liquid chromatography system (Agilent 1290 series) connected to an electrospray ionization time-of-flight mass spectrometer (Agilent 6545). Chromatographic separation was carried out on a Waters ACQUITY UPLC BEH C18 analytical column (2.1 × 100 mm, 1.7 μm, pore size 130 Å; Waters Co.). Solvent A consisted of water with 0.1% (v/v) formic acid, and solvent B consisted of ACN with 0.1% (v/v) formic acid. The gradient was as follows: 0-2 min, 2% B; 2-15 min, 2-95% B; and 15-20 min, 95% B. The flow rate was 350 μl/min.
2.7. Data Processing and Statistical Analyses
Raw data were converted to a common (mz. data) format by Agilent MassHunter Qualitative Analysis B.08.00 software (Agilent Technologies, USA). The XCMS package in R software was used for peak extraction and peak matching. Then, the data were normalized with an internal standard. A table containing the sample name, m/z-RT pair, and peak area was obtained, and then, the data was analyzed with principal component analysis (PCA) and partial least squares discriminant analysis (PLS-DA) by SIMCA-P 13.0 software (Umetrics, Umea, Sweden). The metabolites were identified based on retention time and accurate mass matching to a standard library or accurate mass matching to the human metabolome database (HMDB). The mass accuracy tolerance window was set at 30 ppm for the database search. Metabolite set enrichment analysis and pathway analysis were based on MetaboAnalyst (http://www.metaboanalyst.ca) using the Homo sapiens pathway library.
3. Results
3.1. Morphological Observation of BMSC Primary Cultures
After inoculating bone marrow cells into culture flasks, the cells suspended in the culture medium were round and varied in size. After 24 h, some cells began to adhere to the wall, exhibiting fusiform or polygonal shapes, as shown in Figure 1. The results of flow cytometry showed that CD44 was uniformly expressed in 3rd-generation BMSCs (96.11%), and the rate of CD90 positivity was 95.14%; however, CD34 and CD45 were negative, with positivity rates of 0.92% and 0.95%, respectively, as shown in Figure 2. Differences in the osteogenic efficacy of AST are associated with distinct metabolic transitions. Flow cytometry analysis showed that 60.73% of BMSCs were in the G0/G1 phase, 17.49% were in the G2/M phase, and 21.78% were in the S-phase, indicating that BMSCs had a strong ability to divide and proliferate, as shown in Figure 3.
Figure 1.
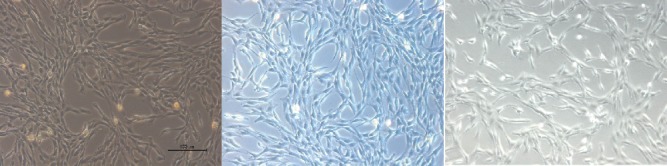
Morphological observation of BMSCs.
Figure 2.
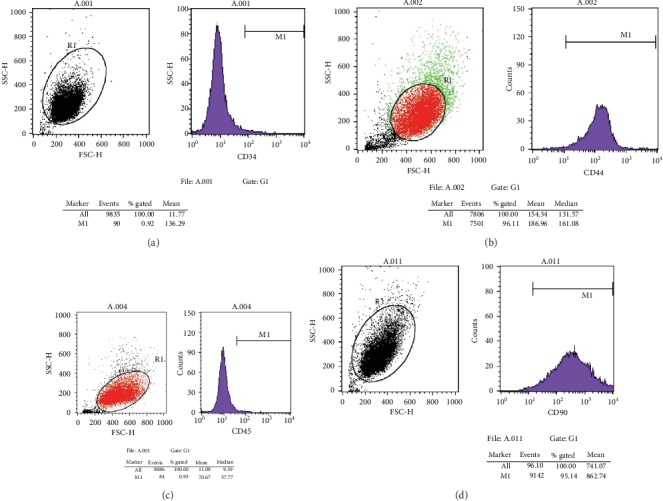
Expression of markers in BMSCs of the third generation. (a) For the expression of CD34, the positive rate was 0.92%; (b) for the expression of CD44, the positive rate was 96.11%; (c) for the expression of CD45, the positive rate was 0.95%; and (d) for the expression of CD90, the positive rate was 95.14%.
Figure 3.
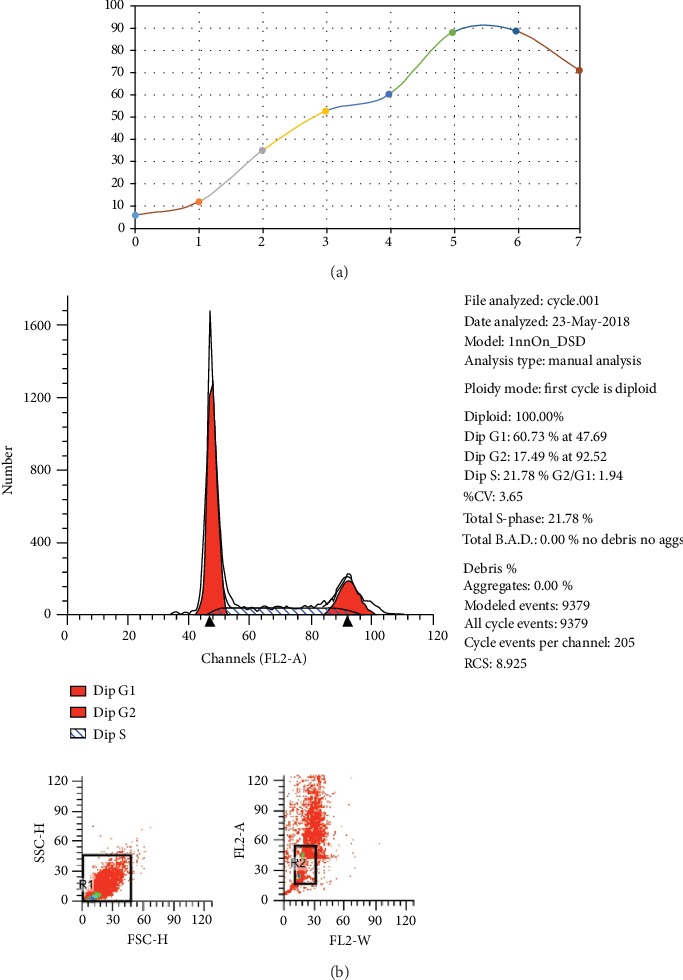
Cell cycle and growth curve of BMSCs. (a) Growth curve of BMSCs: the growth curve of cells on the 3rd to 6th day is basically linear, which indicates that this period is the logarithmic growth period of cells. After 7 days, the curve became smooth and cell proliferation slowed down. (b) Cell cycle: the results of cell cycle analysis by flow cytometry showed that 60.73% of BMSCs were in the G0/G1 phase, 17.49% in the G2/M phase, and 21.78% in the S-phase, indicating that BMSCs had strong ability to divide and proliferate.
3.2. AST-Induced Osteogenesis of MSCs
The ability of AST to induce osteogenic differentiation was evaluated by Alizarin Red Stain. The result showed bright red staining in the AST groups, and the mineralization of the AST groups was higher than that of the control group, as shown in Figure 4.
Figure 4.
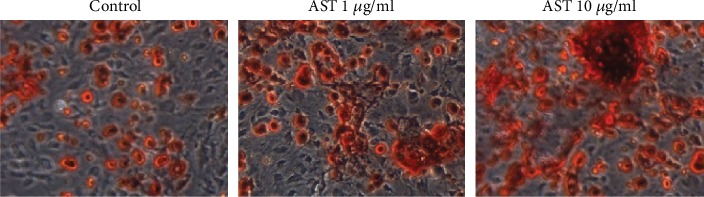
Alizarin Red S over 21 days of differentiation. Con: control group, medium+vehicle; AST: astaxanthin group. The mineralization of the AST groups was higher than that of the control group. The area of red staining in the 10 μg/ml dose group and the 1 mg/ml dose group was larger than that of the control group, and the area of the 10 μg/ml dose group was larger than that of the 1 mg/ml dose group.
3.3. Significant Metabolite Changes and Metabolic Pathway Analysis
The effects of AST on the metabolism of mesenchymal stem cells during osteogenesis were evaluated by metabolic analysis, and the metabolic differences among different doses of AST were compared. The results showed that the metabolism of undifferentiated cells and differentiated cells was significantly different, and different doses of AST-induced differentiation also showed different metabolic profiles. As shown in the score plots of the PCA analysis (Figure 5), the AST1 group, AST10 group, and control group are separated from each other and clustered in different areas. The PLS-DA models (Figure 6) also showed separation between the two experimental groups (AST1/C, AST10/C, and AST10/AST1). Volcano plot analyses, which combined the fold change (FC) and p values from the t-tests, were also used to identify the unique metabolites that separated the two groups (control and AST groups). Metabolites with a p < 0.05 and an FC of either >1.5 or <0.67 (i.e., >±50% change) were considered significant (red dots). Using these thresholds, only 25 correlated markers (Table 1) were significantly changed in response to AST treatment. L-Methionine, L-tyrosine, and 2-hydroxycinnamic acid were upregulated in samples treated with astaxanthin, while L-lysine, L-pipecolic acid, L-histidine, L-arginine, D-fructose, and L-aspartic acid were downregulated in samples treated with astaxanthin. Metabolic pathway enrichment analysis revealed that AST mainly regulated phenylalanine metabolism; phenylalanine, tyrosine, and tryptophan biosynthesis; and pantothenate and CoA biosynthesis during the process of osteogenic differentiation of MSCs (Table 2).
Figure 5.
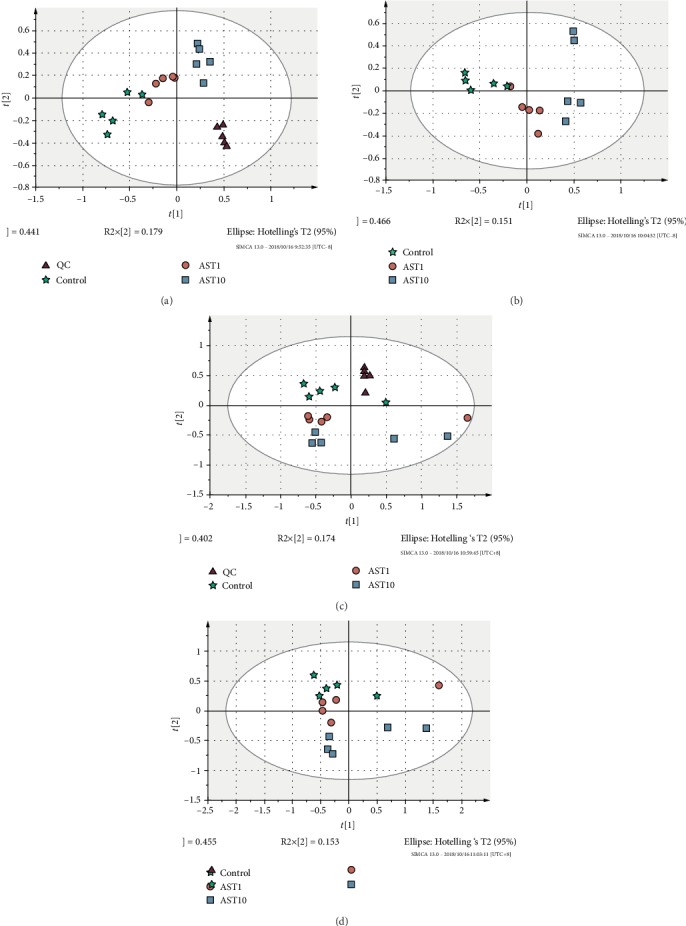
Principal component analyses of AST1, AST10, and control group cells. ▲ represents QC samples, ★ represents control samples, ● represents AST-1 μg/ml samples, and ■ represents AST-10 μg/ml samples.
Figure 6.
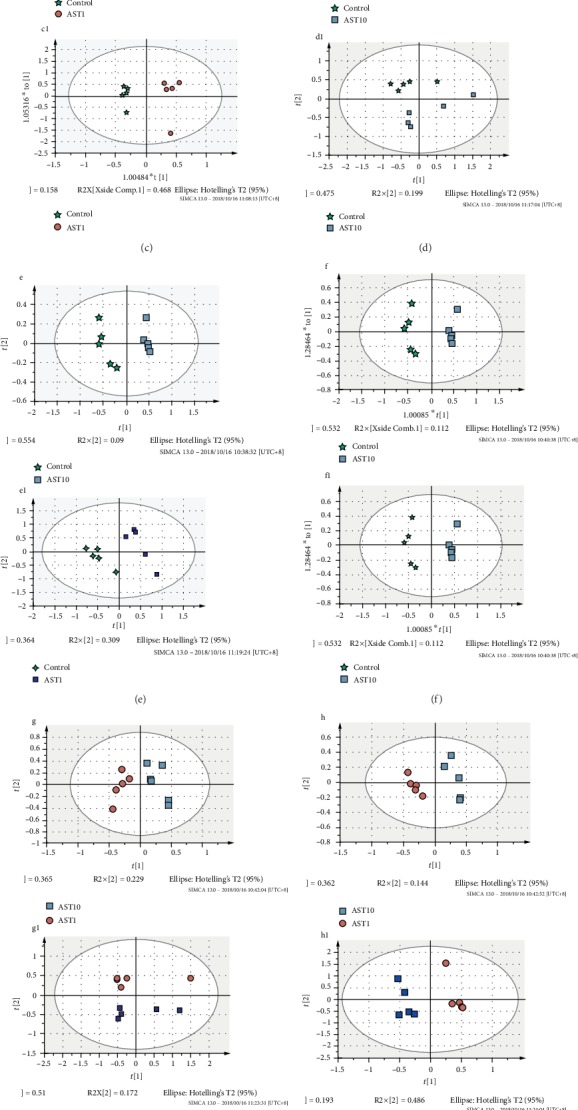
PCA, PLS-DA, and OPLSDA of AST1, AST10, and control group cells. (a–c) Positive ion mode: AST1 vs. control; (a1–c1) negative ion mode: AST1 vs. control; (d–f) positive ion mode: AST10 vs. control; (d1–f1) negative ion mode: AST10 vs. control; (g–i) positive ion mode: AST10 vs. AST1; (g1–i1) negative ion mode: AST10 vs. AST1. ★ represents control samples, ● represents AST-1 μg/ml samples, and ■ represents AST-10 μg/ml samples.
Table 1.
Significant changes in metabolites of AST1 vs. control, AST10 vs. control, and AST10 vs. AST1.
| m/z | RT (min) | FC (AST10/C) | FC (AST1/C) | FC (AST10/AST1) | Name | Formula |
|---|---|---|---|---|---|---|
| 147.1163 | 0.69 | 0.27 | 0.53 | 0.51 | L-Lysine | C6H14N2O2 |
| 130.0839 | 0.72 | 0.22 | 0.61 | 0.36 | L-Pipecolic acid | C6H11NO2 |
| 156.0744 | 0.73 | 0.14 | 0.26 | 0.54 | L-Histidine | C6H9N3O2 |
| 175.1169 | 0.76 | 0.24 | 0.23 | 1.07 | L-Arginine | C6H14N4O2 |
| 179.0581 | 0.78 | 0.12 | 0.27 | 0.44 | D-Fructose | C6H12O6 |
| 132.0328 | 0.79 | 0.11 | 0.15 | 0.74 | L-Aspartic acid | C4H7NO4 |
| 282.2554 | 11.01 | 2.15 | 1.21 | 1.77 | Oleic acid | C5H7NO3 |
| 118.0892 | 0.95 | 0.36 | 0.56 | 0.65 | L-Valine | C5H11NO2 |
| 148.0455 | 1.08 | 75.49 | 3.39 | 22.27 | L-Methionine | C5H11NO2S |
| 182.0824 | 1.17 | 82.51 | 1.87 | 44.18 | L-Tyrosine | C9H11NO3 |
| 165.0541 | 1.18 | 15.82 | 1.47 | 10.76 | 2-Hydroxycinnamic acid | C9H8O3 |
| 130.0882 | 1.26 | 0.15 | 0.63 | 0.24 | L-Leucine | C6H13NO2 |
| 256.2399 | 10.82 | 0.11 | 0.59 | 0.18 | Palmitic acid | C9H7NO |
| 557.3051 | 7.57 | 2.10 | 1.55 | 1.35 | PC(P-17:0/0:0) | C25H52NO6P |
| 136.0766 | 1.85 | 0.12 | 0.46 | 0.26 | 2-Phenylacetamide | C8H9NO |
| 209.0926 | 2.17 | 0.28 | 0.49 | 0.59 | Kynurenine | C10H12N2O3 |
| 149.0601 | 2.19 | 0.19 | 0.52 | 0.36 | trans-Cinnamic acid | C9H8O2 |
| 166.0915 | 2.19 | 0.23 | 0.45 | 0.52 | L-Phenylalanine | C9H11NO2 |
| 218.1052 | 2.78 | 0.15 | 0.39 | 0.40 | Pantothenic acid | C9H17NO5 |
| 279.1355 | 3.51 | 0.10 | 0.35 | 0.28 | Prolyl-tyrosine | C14H18N2O4 |
| 146.0628 | 4.09 | 0.17 | 0.34 | 0.50 | 4-Formyl indole | C9H7NO |
| 205.1034 | 4.09 | 0.20 | 0.29 | 0.71 | L-Tryptophan | C11H12N2O2 |
| 118.0676 | 4.09 | 0.23 | 0.28 | 0.83 | Indole | C8H7N |
| 493.3525 | 8.78 | 2.33 | 1.50 | 1.56 | PC(21:4(6Z,9Z,12Z,15Z)/0:0) | C29H52NO7P |
Table 2.
Pathway analysis of different significant changes in metabolites of AST1 vs. control, AST10 vs. control, and AST10 vs. AST1.
| Pathway name | Match status | p | -Log(p) | Holm p | FDR | Impact |
|---|---|---|---|---|---|---|
| Aminoacyl-tRNA biosynthesis | 10/75 | 1.2581E‐10 | 22.796 | 1.0065E‐8 | 1.0065E‐8 | 0.11268 |
| Nitrogen metabolism | 5/39 | 1.4452E‐5 | 11.145 | 0.0011417 | 5.7808E‐4 | 6.7E‐4 |
| Phenylalanine metabolism | 5/45 | 2.9653E‐5 | 10.426 | 0.0023129 | 7.9075E‐4 | 0.32518 |
| Phenylalanine, tyrosine, and tryptophan biosynthesis | 4/27 | 6.6065E‐5 | 9.6249 | 0.005087 | 0.0013213 | 0.008 |
| Pantothenate and CoA biosynthesis | 3/27 | 0.0014641 | 6.5265 | 0.11127 | 0.021742 | 0.18014 |
| Beta-alanine metabolism | 3/28 | 0.0016306 | 6.4188 | 0.1223 | 0.021742 | 0.0 |
| Biotin metabolism | 2/11 | 0.0038039 | 5.5717 | 0.28149 | 0.043473 | 0.20325 |
| Valine, leucine, and isoleucine biosynthesis | 2/27 | 0.02232 | 3.8023 | 1.0 | 0.2232 | 0.0265 |
| Tryptophan metabolism | 3/79 | 0.029564 | 3.5212 | 1.0 | 0.24582 | 0.16587 |
| Lysine biosynthesis | 2/32 | 0.030727 | 3.4826 | 1.0 | 0.24582 | 0.09993 |
| Valine, leucine, and isoleucine degradation | 2/40 | 0.046347 | 3.0716 | 1.0 | 0.33707 | 0.02232 |
4. Discussion
It is recommended that metabolic profiles be used to monitor the differentiation of stem cells and to establish quality control standards for biotechnology processes and products. The study of metabolomics has shown the success of osteogenic differentiation of bone marrow mesenchymal stem cells stimulated by dexamethasone [18]. Surrati et al. monitored the osteogenesis of mouse mesenchymal stem cells treated with dexamethasone. It was found that the TCA cycle and glycerol derivatives were increased in the medium [19]. However, these studies were limited by the detection of extracellular metabolites that provided only an approximation of intracellular metabolism [20].
In the present study, MSC differentiation induced by AST was characterized by cellular metabolomics. L-Methionine, L-tyrosine, PC(P-17:0/0:0), and oleic acid were upregulated in samples treated with astaxanthin, while L-lysine, L-pipecolic acid, L-histidine, L-arginine, D-fructose, and palmitic acid were downregulated in samples treated with astaxanthin. In addition, there was a significant dose-dependent relationship with these markers. The activation of pathways is related to amino acid metabolism, fatty acid biosynthesis, and lipid metabolism during the osteogenic differentiation. These observations emphasize the fact that metabolism changes significantly during (osteogenic) differentiation. These amino acids are fundamental factors in nutrition as building blocks for biomass components, such as DNA, RNA, and proteins [21]. Our results indicated that BMSCs consumed L-lysine, L-histidine, L-arginine, L-valine, L-leucine, and L-phenylalanine. The observed metabolic pattern is proposed to be representative of the basic nutritional requirements for BMSCs in culture.
In addition, fatty acids have previously been reported to affect cell survival. Saturated fatty acids have specifically been reported to induce death in many cell types, including BMSCs [22, 23]. In the present study, palmitic acid was decreased in the AST-treated group, while the level of oleic acid was higher in the AST-treated group. Fatty acids can regulate flux through energy metabolic pathways and may thereby regulate cell survival. A previous study showed that oleic acid could prevent palmitic acid-induced BMSC death [24]. These results indicate that the AST treatment may increase the level of unsaturated fatty acids for the proliferation and differentiation of BMSCs. Interestingly, in our study, phosphocholine was increased in the AST-induced group, and the increased phosphocholine level during chondrogenesis was also found in the process of differentiation of hMSCs into chondrocytes [25, 26]. The above results show that the phospholipid level in osteoblasts is higher than that in nonproliferation bone marrow mesenchymal stem cells, so it may be a marker of cell differentiation and proliferation.
Acknowledgments
This work was supported by grants from the Basic Public Welfare Research Project of Zhejiang Province (LGD19H150003). We also thank the Emergency Department of the Second Affiliated Hospital of the Medical College of Zhejiang University for undertaking this study.
Data Availability
The datasets used and analyzed during the current study are available from the corresponding author upon reasonable request.
Ethical Approval
The study protocol was approved by the Institutional Review Board of the Second Affiliated Hospital of the Medical College of Zhejiang University.
Consent
Written informed consent was obtained from all patients.
Conflicts of Interest
The authors declare that they have no conflicts of interest.
Authors' Contributions
Guangfeng Zhao and Huiming Zhong contributed equally to this work.
References
- 1.Schachter B. Therapies of the state. Nature Biotechnology. 2014;32(8):736–741. doi: 10.1038/nbt.2984. [DOI] [PubMed] [Google Scholar]
- 2.Barry F. P., Murphy J. M. Mesenchymal stem cells: clinical applications and biological characterization. International Journal of Biochemistry & Cell Biology. 2004;36(4):568–584. doi: 10.1016/j.biocel.2003.11.001. [DOI] [PubMed] [Google Scholar]
- 3.Klontzas M. E., Kenanidis E. I., Heliotis M., Tsiridis E., Mantalaris A. Bone and cartilage regeneration with the use of umbilical cord mesenchymal stem cells. Expert Opinion on Biological Therapy. 2015;15(11):1541–1552. doi: 10.1517/14712598.2015.1068755. [DOI] [PubMed] [Google Scholar]
- 4.Flynn A., Barry F., O'Brien T. UC blood-derived mesenchymal stromal cells: an overview. Cytotherapy. 2007;9(8):717–726. doi: 10.1080/14653240701584578. [DOI] [PubMed] [Google Scholar]
- 5.Baralic I., Andjelkovic M., Djordjevic B., et al. Effect of astaxanthin supplementation on salivary IgA, oxidative stress, and inflammation in young soccer players. Evidence-based Complementary and Alternative Medicine. 2015;2015:9. doi: 10.1155/2015/783761. [DOI] [PMC free article] [PubMed] [Google Scholar]
- 6.Yamashita E. Astaxanthin as a medical Food. Functional Foods in Health and Disease. 2013;3(7):p. 254. doi: 10.31989/ffhd.v3i7.49. [DOI] [Google Scholar]
- 7.Majeed A. Development and stability evaluation of astaxanthin nanoemulsion. Asian Journal of Pharmaceutical & Clinical Research. 2011;4(1):143–148. [Google Scholar]
- 8.Boussiba S. Carotenogenesis in the green alga Haematococcus pluvialis: cellular physiology and stress response. Physiologia Plantarum. 2000;108(2):111–117. doi: 10.1034/j.1399-3054.2000.108002111.x. [DOI] [Google Scholar]
- 9.Rahmati M., Mobasheri A., Mozafari M. Inflammatory mediators in osteoarthritis: A critical review of the state-of- the-art, current prospects, and future challenges. Bone. 2016;85:81–90. doi: 10.1016/j.bone.2016.01.019. [DOI] [PubMed] [Google Scholar]
- 10.Chen W. P., Xiong Y., Shi Y. X., Hu P. F., Bao J. P., Wu L. D. Astaxanthin reduces matrix metalloproteinase expression in human chondrocytes. International Immunopharmacology. 2014;19(1):174–177. doi: 10.1016/j.intimp.2013.12.007. [DOI] [PubMed] [Google Scholar]
- 11.Kim J. H., Nam S. W., Kim B. W., Kim W. J., Choi Y. H. Astaxanthin improves the proliferative capacity as well as the osteogenic and adipogenic differentiation potential in neural stem cells. Food and Chemical Toxicology. 2010;48(6):1741–1745. doi: 10.1016/j.fct.2010.04.002. [DOI] [PubMed] [Google Scholar]
- 12.Vernardis S. I., Goudar C. T., Klapa M. I. Metabolic profiling reveals that time related physiological changes in mammalian cell perfusion cultures are bioreactor scale independent. Metabolic Engineering. 2013;19(9):1–9. doi: 10.1016/j.ymben.2013.04.005. [DOI] [PubMed] [Google Scholar]
- 13.McNamara L. E., Sjöström T., Meek R. M. D., et al. Metabolomics: a valuable tool for stem cell monitoring in regenerative medicine. Journal of the Royal Society Interface. 2012;9(73):1713–1724. doi: 10.1098/rsif.2012.0169. [DOI] [PMC free article] [PubMed] [Google Scholar]
- 14.Cezar G. G., Quam J. A., Smith A. M., et al. Identification of small molecules from human embryonic stem cells using metabolomics. Stem Cells and Development. 2007;16(6):869–882. doi: 10.1089/scd.2007.0022. [DOI] [PubMed] [Google Scholar]
- 15.West F. D., Henderson W. M., Yu P., Yang J. Y., Stice S. L., Smith M. A. Metabolomic response of human embryonic stem cell-derived germ-like cells after exposure to steroid hormones. Toxicological Sciences. 2012;129(1):9–20. doi: 10.1093/toxsci/kfs185. [DOI] [PubMed] [Google Scholar]
- 16.Jang M.-Y., Chun S.-I., Mun C.-W., Hong K. S., Shin J.-W. Evaluation of metabolomic changes as a biomarker of chondrogenic differentiation in 3D-cultured human mesenchymal stem cells using proton (1H) nuclear magnetic resonance spectroscopy. PloS One. 2013;8(10, article e78325) doi: 10.1371/journal.pone.0078325. [DOI] [PMC free article] [PubMed] [Google Scholar]
- 17.Gregory C. A., Gunn W. G., Peister A., Prockop D. J. An Alizarin red-based assay of mineralization by adherent cells in culture: comparison with cetylpyridinium chloride extraction. Analytical Biochemistry. 2004;329(1):77–84. doi: 10.1016/j.ab.2004.02.002. [DOI] [PubMed] [Google Scholar]
- 18.Meissen J. K., Yuen B. T. K., Kind T., et al. Induced pluripotent stem cells show metabolomic differences to embryonic stem cells in polyunsaturated phosphatidylcholines and primary metabolism. PloS One. 2012;7(10, article e46770) doi: 10.1371/journal.pone.0046770. [DOI] [PMC free article] [PubMed] [Google Scholar]
- 19.Surrati A., Linforth R., Fisk I. D., Sottile V., Kim D. H. Non-destructive characterisation of mesenchymal stem cell differentiation using LC-MS-based metabolite footprinting. Analyst. 2016;141(12):3776–3787. doi: 10.1039/c6an00170j. [DOI] [PubMed] [Google Scholar]
- 20.Villas-Bôas S. G., Moxley J. F., Åkesson M., Stephanopoulos G., Nielsen J. High-throughput metabolic state analysis: the missing link in integrated functional genomics of yeasts. Biochemical Journal. 2005;388(2):669–677. doi: 10.1042/bj20041162. [DOI] [PMC free article] [PubMed] [Google Scholar]
- 21.Chaffey N. Alberts, B., Johnson, A., Lewis, J., Raff, M., Roberts, K. and Walter, P. Molecular biology of the cell. 4th edn. Annals of Botany. 2003;91(3):401–401. doi: 10.1093/aob/mcg023. [DOI] [Google Scholar]
- 22.Lu J., Wang Q., Huang L., et al. Palmitate causes endoplasmic reticulum stress and apoptosis in human mesenchymal stem cells: prevention by AMPK activator. Endocrinology. 2012;153(11):5275–5284. doi: 10.1210/en.2012-1418. [DOI] [PubMed] [Google Scholar]
- 23.Suzuki J., Akahane K., Nakamura J., et al. Palmitate induces apoptosis in Schwann cells via both ceramide-dependent and independent pathways. Neuroscience. 2011;176(1):188–198. doi: 10.1016/j.neuroscience.2010.11.035. [DOI] [PubMed] [Google Scholar]
- 24.Fillmore N., Huqi A., Jaswal J. S., et al. Effect of fatty acids on human bone marrow mesenchymal stem cell energy metabolism and survival. PloS One. 2015;10(3, article e0120257) doi: 10.1371/journal.pone.0120257. [DOI] [PMC free article] [PubMed] [Google Scholar]
- 25.Yeagle P. L. Lipid regulation of cell membrane structure and function. FASEB Journal. 1989;3(7):1833–1842. doi: 10.1096/fasebj.3.7.2469614. [DOI] [PubMed] [Google Scholar]
- 26.Jackowski S. Cell cycle regulation of membrane phospholipid metabolism. Journal of Biological Chemistry. 1996;271(34):20219–20222. doi: 10.1074/jbc.271.34.20219. [DOI] [PubMed] [Google Scholar]
Associated Data
This section collects any data citations, data availability statements, or supplementary materials included in this article.
Data Availability Statement
The datasets used and analyzed during the current study are available from the corresponding author upon reasonable request.