

Abstract
RNA-binding proteins (RBPs) play fundamental roles in cancer; however, we still lack knowledge about to what extent RBPs are dysregulated, as well as about perturbed signaling pathways in cancer. In this study, we integrated analysis of multidimensional data across >10,000 cancer patients and >1,000 cell lines. We identified a top candidate RBP: eukaryotic translation initiation factor 2 subunit beta (EIF2S2). EIF2S2 is highly expressed in tumors and is associated with malignant features as well as patient prognosis. Functional assays performed in cancer cells revealed that EIF2S2 promotes cancer cell proliferation, migration, and invasion in vitro as well as tumor growth and metastasis in vivo. Mechanistic investigations further demonstrated that EIF2S2 promotes tumorigenesis and progression by directly binding to a long non-coding RNA, LINC01600, which physically interacts with the MYC protein and increases its stability. Interestingly, we revealed that the EIF2S2-LINC01600-MYC axis can activate the Wnt/β-catenin pathway by inhibiting the activity of FHIT-related enhancers and FHIT expression. Finally, EIF2S2 knockdown combined with oxaliplatin treatment could be a potential combination therapy in cancer. Our integrated analysis provided detailed knowledge of the function of the EIF2S2-LINC01600-MYC axis, which will facilitate the development of rational combination therapies for cancer.
Keywords: RNA-binding protein, EIF2S2, long non-coding RNA, Wnt pathway, gastrointestinal cancer
Graphical Abstract
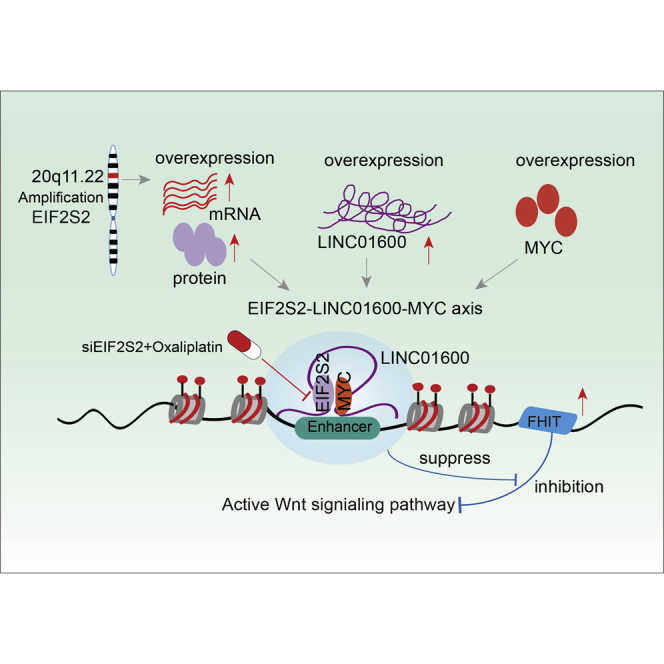
RNA-binding proteins play important roles in cancer. Li et al. integrated multiple omics data that identified a potential oncogene, EIF2S2. Functional analyses provided detail knowledge of the function of the EIF2S2-LINC01600-MYC axis in gastrointestinal cancer, which will help the development of combination therapies for cancer.
Introduction
Gastrointestinal (GI) cancers are among the most common invasive, lethal tumors.1,2 Despite tremendous advancements in therapeutic strategies, the overall survival rate has not yet been improved.3 The initiation and maintenance of tumors are centered on the concept of cancer hallmarks via genetic and epigenetic mechanisms.4 Although a number of oncogenes and tumor suppressor genes have been identified in GI cancers,5,6 we still lack knowledge about the landscape of transcriptome perturbations and the regulators that contribute to cancer development.
Compelling evidence has shown that RNA-binding proteins (RBPs) play important roles in regulating gene expression and have a pivotal role in many human diseases, especially cancers.7,8 Currently, an increasing number of RBPs have been curated,9,10 and some have been demonstrated to drive tumorigenicity and progression. Dang et al.11 demonstrated that NELFE functions as an oncogenic protein and contributes to transcriptome imbalance in hepatocellular carcinoma (HCC) via MYC signaling. In addition, the RBP quaking (QKI) was shown to function as a principal regulator in the differentiation of colonic epithelium, the deregulation of which is involved in the onset and progression of colon cancer.12 Epithelial splicing regulatory protein 1 (ESRP1) has been reported to act as a pro-oncogenic RBP in colorectal cancer (CRC) by modulating tumor growth.13 These observations suggest that RBPs are key mediators of oncogenic transcriptomic changes.
Moreover, the biggest problems in anticancer drug development are acquired multidrug resistance and relapse.14 Oxaliplatin (1,2‐diaminocyclohexane‐oxalate platinum) is a third‐generation platinum compound with anti-cancer activity in CRC,15 gastric cancer (GC), and many other tumors. However, cancer patients treated with these drugs often develop drug resistance. Studies have reported possible mechanisms of oxaliplatin resistance, including increased drug detoxification,16 changes in apoptosis-regulating genes,17 and enhancement of the DNA damage repair capacity.18 These studies revealed the complicity of oxaliplatin resistance, but the detailed underlying mechanisms are still poorly understood. One popular solution to the enduring challenge of drug resistance is rational combinatorial targeted therapy.19 Thus, it is critical to identify regulators that can result in impressive therapeutic effects of oxaliplatin in GI cancers.
In this study, we integrated multiple omics data from >10,000 tumor samples and >1,000 cell lines and found that RBPs are more likely than other proteins to be perturbed in cancer. Specifically, we identified a critical RBP regulator, eukaryotic translation initiation factor 2 subunit beta (EIF2S2), in GI cancer. EIF2F2 is upregulated in CRC, GC, and HCC, and its upregulation is significantly associated with the malignant features and poor outcomes of patients. Systematic investigation showed that the EIF2S2-LINC01600-MYC axis can bind to the enhancer region of FHIT, further inhibiting the regulatory effect of FHIT on the Wnt signaling pathway. Finally, our results suggested that EIF2S2 silencing combined with oxaliplatin is a potential therapeutic strategy for GI cancers.
Results
Global Analyses of RBPs Identify Aberrant EIF2S2 Expression in GI Cancers
To characterize the transcriptional alterations in RBPs across cancer types, we first assembled 860 RBPs from the literature.9 Next, we identified differentially expressed RBPs in 18 cancer types (Figure 1A). Interestingly, we observed that transcriptional perturbations in RBPs were common events in almost all cancer types (Figure 1B, p < 0.05 for all cancer types). For instance, more than 60% of RBPs were differentially expressed in colon adenocarcinoma (COAD; p < 0.01) and HCC (p < 0.01). These results reveal the widespread transcriptional perturbations in RBPs across cancer types, particularly GI cancer.
Figure 1.

Integrative Analyses of Multidimensional Omics Data Revealed Candidate RBPs in Human Cancers
(A) Flowchart for identifying critical RBPs in cancer. (B) Heatmap showing the proportion of differentially expressed RBPs and other genes. The bar plots on the right show the results for four types of gastrointestinal cancer. Fisher’s exact test. (C) The top bar plot shows the number of publications reporting RBPs, and the bottom bar plot shows the number of cancer types in which the RBPs were dysregulated. (D) Venn diagram shows the overlap of pan-cancer RBPs and less frequently reported RBPs. (E) Relative RNA levels of EIF2S2 in CRC, GC, and HCC patients. Red indicates tumor patients; cyan indicates normal controls. Wilcoxon signed-rank test. (F) Relative RNA level of EIF2S2 in normal controls and patients with CRC and liver metastasis. Wilcoxon signed-rank test. (G) Kaplan-Meier survival analysis of CRC and HCC patients stratified by the EIF2S2 gene expression level. p = 0.023, log-rank test. *p < 0.05, **p < 0.01, ***p < 0.001.
To further screen key RBPs in human cancers, we first identified 87 RBPs that were differentially expressed in more than 80% of cancer types (Figure 1C; Table S1). By querying the PubMed database, we concluded that most of these RBPs were involved in tumorigenesis and progression (Figure 1C). To identify novel cancer-related RBPs, we focused on 20 RBPs that were reported in fewer than three publications (Figure 1D; Table S1). In addition, we integrated the genomic alteration data from 1,019 cell lines and found that four RBPs (EIF2S2, DDX56, DCAF13, and UTP18) showed genomic alterations in more than 5% of cell lines. DDX56 was identified as an oncogene in CRC by promoting the splicing of WEE1.20 DCAF13 was associated with the survival of HCC and breast cancer.21,22 UTP18 is a component of the small subunit processome and is frequently gained and overexpressed in cancer.23 Of these RBPs, EIF2S2 was more significantly aberrantly expressed than the other three RBPs and was selected for further study.
EIF2S2 catalyzes the exchange of GDP (guanosine 5′-diphosphate) for GTP (guanosine 5′-triphosphate) during the translation initiation steps of protein synthesis, and little is known about its role in tumorigenesis. Moreover, we collected independent gene expression data across CRC, GC, and liver cancer patients. We found that EIF2S2 also exhibited significantly higher expression in cancer (Figure S1A). We also evaluated the expression of EIF2S2 in 317 paired tumor tissues and corresponding noncancerous tissues (NCTs), including 165 CRCs, 80 GCs, and 72 HCCs (Table 1). We found that EIF2S2 was more highly expressed in tissues from these the three types of cancers than in the corresponding NCTs (Figure 1E, all p values <0.001). Moreover, higher EIF2S2 expression was observed in liver metastasis samples than in primary CRC tumors (Figure 1F). To investigate the determinants of higher expression of EIF2S2, we first analyzed the copy number of EIF2S2 across patients in TCGA. We found that EIF2S2 was amplified across the majority of cancer types, particular in CRC (Figure S1B). Next, we also performed quantitative polymerase chain reaction (qPCR) to investigate copy number variations in EIF2S2 in 70 CRCs, 30 GCs, and 30 HCCs. Higher copy number amplification of EIF2S2 was observed in these cancer samples than in their corresponding NCTs (Figures S2A–S2C). Finally, we explored the effects of EIF2S2 on prognosis in GI cancer patients and revealed that high expression of EIF2S2 is associated with poor survival of CRC (Figure 1G, p = 0.023) and HCC patients (Figure S2D, p = 9.1E−6 and 0.012). Taken together, these results suggested that EIF2S2 plays oncogenic roles in GI cancers.
Table 1.
Relationships between EIF2S2 Expression and Clinical Pathological Features of Patients with CRC
| Parameter | No. of Patients | EIF2S2 (Low) | EIF2S2 (High) | p Value |
|---|---|---|---|---|
| Sex | ||||
| Male | 92 | 44 | 48 | 0.288 |
| Female | 73 | 33 | 40 | |
| Age (years) | ||||
| <60 | 69 | 28 | 41 | 0.176 |
| ≥60 | 96 | 54 | 42 | |
| Distant Metastasis | ||||
| Absent | 62 | 23 | 39 | 0.062 |
| Present | 103 | 30 | 73 | |
| Tumor Size (cm) | ||||
| ≤5 | 80 | 36 | 28 | 0.214 |
| >5 | 85 | 28 | 29 | |
| Location | ||||
| Colon | 102 | 34 | 58 | 0.056 |
| Rectum | 63 | 18 | 45 | |
| Depth of Tumor | ||||
| T1+T2 | 57 | 18 | 39 | 0.036 |
| T3+T4 | 98 | 32 | 66 | |
| Vascular Invasion | ||||
| Absent | 72 | 42 | 30 | 0.218 |
| Present | 93 | 32 | 61 | |
| Nervous Invasion | ||||
| Absent | 70 | 32 | 68 | 0.469 |
| Present | 95 | 10 | 11 | |
| Lymphatic Metastasis | ||||
| Absent | 92 | 57 | 35 | 0.018 |
| Present | 73 | 33 | 40 | |
| Differentiation Grade | ||||
| I–II | 65 | 32 | 33 | 0.025 |
| III–IV | 100 | 28 | 72 | |
EIF2S2 Promotes Tumor Growth and Progression in GI Cancers
To further analyze the effects of EIF2S2 on GI cancers, we knocked down or overexpressed EIF2S2 in CRC, GC, and HCC cell lines (Figures S3A–S3C) and then performed colony and cell proliferation assays. We found that EIF2S2 is highly expressed in HCT-116 cells and lowly expressed in LoVo cells. Thus, we performed functional experiments in LoVo and HCT-116 cell lines. We demonstrated that silencing EIF2S2 expression significantly inhibited CRC, GC, and HCC cell colony formation (Figures 2A–2C; Figure S3D) and proliferation (Figure 2D). In contrast, EIF2S2 overexpression significantly promoted the colony formation and proliferation abilities of cancer cells (Figures 2A–2D; Figure S3D). We next explored the roles of EIF2S2 in cell invasion and metastasis. The results of the Matrigel invasion assay showed that EIF2S2 knockdown significantly decreased migration and invasion (Figures 2F–2H; Figures S3E and S3F), whereas ectopic EIF2S2 expression significantly enhanced the migration and invasion of GI cancer cells (Figures 2F–2H; Figures S3E and S3F). Taken together, these results demonstrated that EIF2S2 significantly promotes the in vitro migration and invasion of GI cancer cells.
Figure 2.

EIF2S2 Increases GI Cancer Cell Proliferation, Invasion, and Metastasis In Vitro and In Vivo
(A–C) Colony formation assays of the effects of siEIF2S2 or pWPXL-EIF2S2 treatment in CRC, GC, and HCC cell lines. (A) HCT-116 and LoVo; (B) MGC-803 and SGC-7901; and (C) Huh-7 and SNU-449. (D) Cell Counting Kit-8 (CCK-8) assays showing the growth of CRC, GC, and HCC cells treated with siEIF2S2 (left) or pWPXL-EIF2S2 (right). (E) Tumor weights were measured in the pWPXL-EIF2S2 and negative control groups in the xenograft mouse models. (F–H) Transwell migration and invasion assays in CRC (F), GC (G), and HCC (H) cell lines treated with siEIF2S2 or pWPXL-EIF2S2. (I–K) The number of metastatic foci in the intestine (I), liver (J), and lungs (K) of nude mice at 6 weeks after injection with stable pWPXL-EIF2S2 LoVo cells. The values are presented as means ± standard error of the mean (SEM), n = 3. ***p < 0.001, Wilcoxon signed-rank test.
To confirm the effects of EIF2S2 on the tumorigenicity of GI cancer cells, EIF2S2-overexpressing cells and control cells, derived from the LoVo, SGC-7901, and SNU-449 cell lines, were subcutaneously injected into nude mice. After 8 weeks, the volume and weight of tumors were dramatically increased in the EIF2S2 group compared with the control groups (Figure 2E; Figures S3G–S3I), suggesting that overexpression of EIF2S2 markedly promoted the tumorigenic ability of GI cancers. Next, EIF2S2-overexpressing cells and control cells derived from SNU-449 cells were transplanted into the intestine, liver, and tail vein of nude mice. After 6 weeks, the mice were sacrificed and the nodules were examined. We observed that 90% (9/10) of mice implanted EIF2S2-overexpressing cells had colorectal metastatic nodules, whereas only 10% of mice in the control group did (Figure 2I; Figure S3J; p = 0.0007). Moreover, 70% (7/10) of mice implanted with EIF2S2-overexpressing cells had distal lung metastases, whereas 20% of mice in the control group did (Figure 2J; Figure S3J; p = 0.0011). Regarding lung metastasis, 60% (6/10) of mice in the EIF2S2 group and no mice in the vector group developed metastatic nodules (Figure 2K; Figure S3J; p = 0.0032). These findings demonstrate that EIF2S2 significantly promotes GI cancer metastasis.
EIF2S2 Preferentially Promotes Wnt Signaling
To further investigate the oncogenic roles of EIF2S2, we performed gene set enrichment analysis (GSEA)24 based on the genome-wide expression profiles of CRC from The Cancer Genome Atlas (TCGA) project. We first calculated the Spearman correlation between the expression of EIF2S2 and that of all other genes. Next, genes were ranked based on the correlation and were then subjected to GSEA analysis. In this study, we focused on the signaling pathways in Reactome.25 We found that genes positively coexpressed with EIF2S2 were significantly enriched in the “signaling by WNT” pathway in both COAD and rectal adenocarcinoma (READ) datasets (Figures S4A–S4C, p < 0.001), suggesting that Wnt signaling is a key downstream pathway regulated by EIF2S2.
Next, we investigated the expression levels of several representative genes in the WNT signaling pathway in EIF2S2-depleted or EIFS2S-overexpressing CRC cells. Most of the genes in the WNT pathway showed expression perturbations in EIF2S2-overexpressing or EIF2S2 knockdown tumor cells (Figure S4D). Particularly, we found that the protein levels of ROCK2 and c-Myc were increased or decreased in EIF2S2-overexpressing or EIF2S2-depleted CRC cells, respectively (Figure S4E). Moreover, the activity of the luciferase reporter-containing response element of the core WNT signaling pathway component β-catenin was augmented in EIF2S2-overexpressing CRC cells (Figure S4F, p < 0.001). In contrast, the reporter activity was diminished after EIF2S2 knockdown (Figure S4F, p < 0.001). These results suggest that EIF2S2 might exert its tumor-promoting functions by modulating the WNT signaling pathway.
EIF2S2 Coordinately Regulates with MYC through Binding to LINC01600
Although EIF2S2 has been previously identified as an RBP,9 its targets are largely unknown. Genetic studies have proven that a significant number of non-coding RNAs (ncRNAs) are associated with GI cancers,26 and the expressions of long ncRNAs (lncRNAs) are tightly regulated by RBPs.27 Thus, we hypothesized that EIF2S2 may bind to specific ncRNAs to exert its carcinogenic functions in cancer cells. We measured the expression of ncRNAs using RNA sequencing (RNA-seq) and found that one lncRNA (LINC01600) showed significant downregulation after knockdown of EIF2S2 (Figure S5A). LINC01600 has been reported to be upregulated in lung cancer and associated with poor prognosis.28 However, little is known about its roles in human cancers. The primary LINC01600 transcript of 2,434 bp was identified by 5′ and 3′ RACE and northern blot assays in LoVo and HCT-116 cells (Figures S5B and S5C). Next, we measured the expression of LINC01600 and found that it was variable in CRC cell lines (Figure S5D), with a nuclear distribution of approximately 54% (Figure S5E). Importantly, there was a strong positive correlation between the expression of LINC01600 and EIF2S2 in CRC tissues (correlation coefficient [r] = 0.84, p < 0.0001; Figure S5F). In addition, overexpression of EIF2S2 significantly increased LINC01600 expression, while knockdown of EIF2S2 significantly reduced the expression of LINC01600 (Figure S5G). Furthermore, we observed that LINC01600 was significantly upregulated in CRC tissues compared with NCTs (n = 165, Figure S5H). In the 21 CRCs with liver metastasis, we found higher LINC01600 expression in metastatic samples than in primary tumors (Figure S5I, all p values < 0.05). Importantly, patients with higher LINC01600 levels exhibited poorer overall survival than did those with lower levels (Figure S5J, p = 0.018). In particular, significantly shorter survival times were observed in patients with high expression of both EIF2S2 and LINC01600 (Figure S5K, p = 0.0004). These results suggest that LINC01600 plays critical roles associated with EIF2S2 in GI cancers.
To further explore the molecular mechanism by which EIF2S2 regulates LINC01600 in CRC cells, we performed biotin-labeled RNA pull-down accompanied by mass spectrometry to identify LINC01600-interacting proteins. The results of three independent experiments consistently showed two specific proteins of approximately 60 and 45 kDa in the LINC01600 pull-down samples (Figure 3A). We obtained seven potential interacting proteins based on a confidence score cutoff of >50 in mass spectrometry (Figure 3A). Notably, we found that c-MYC, a key signaling molecule in the WNT pathway,29 was confirmed as a specific binding protein of LINC01600. In addition, EIF2S2 was associated with LINC01600 (Figure 3A). The results of a western blotting assay using the retrieved protein samples in the RNA pull-down assay further confirmed the binding of EIF2S2 and c-MYC to LINC01600 (Figure 3B, top panels). These interactions were further confirmed through RNA immunoprecipitation (RIP) assays (Figure 3B, bottom panels). These results suggest that LINC01600 can bind to EIF2S2 and c-MYC in CRC. Furthermore, we found that the 5′ fragment (nucleotides 1–379) of LINC01600 was responsible for the interaction with EIF2S2 (Figure 3C), and the 3′ fragment (nucleotides 1,831–2,000) with c-MYC (Figure 3C).
Figure 3.

EIF2S2 Interacts with LINC01600 and MYC
(A) RNA pull-down experiments with biotinylated-sense LINC01600 or biotinylated-antisense LINC01600. Specific bands identified by MS are shown in the right panel. (B) Immunoblotting for the specific association of EIF2S2, and MYC with biotinylated-LINC01600 from three independent streptavidin RNA pull-down assays (top panel). Real-time PCR was used to detect LINC01600 enrichment, using immunoglobulin G (IgG) antibody as a control (middle panel). 18S rRNA was also used as a control (bottom panel). ***p < 0.001, Wilcoxon signed-rank test. (C) Immunoblotting of EIF2S2 and MYC in samples from pulldown assays with full-length biotinylated LINC01600 or truncated biotinylated LINC01600 RNA segments, with GAPDH as a negative control. (D) Immunoprecipitation to detect the association between EIF2S2 and endogenous MYC (top panel) in HCT-116 cells with LINC01600 overexpression or knockdown. (E and F) RNA immunoprecipitation analysis for LINC01600 enrichment in cells transiently transfected with plasmids containing the indicated full-length or truncated constructs. Deletion mapping for domains of EIF2S2 (E) and MYC (F) that bind to LINC01600 is shown.
To explore whether EIF2S2 and c-MYC bind each other through a link with LINC01600, we performed coimmunoprecipitation experiments with EIF2S2 and c-MYC. We found that EIF2S2 can interact with c-MYC (Figure 3D, top panels). However, LINC01600 knockdown significantly blocked the interaction between EIF2S2 and c-MYC (Figure 3D, bottom panels). These results indicate that LINC01600 acts as a scaffold in the interaction between EIF2S2 and c-MYC. Next, we performed RIP assays to determine the interaction region of EIF2S2 and c-MYC. We found that deletion of the domain presented in eIF2B (eiF2B_5, amino acids 199–308), eIF5 of EIF2S2, significantly abolished the association of EIF2S2 with LINC01600 (Figure 3E). In addition, deletion of some helix-loop-helix (HLH) domains (amino acids 370–426) in c-MYC exhibited similar effects (Figure 3F), indicating that LINC01600 binds to EIF2S2 and c-MYC through these regions, respectively. These results indicate that both EIF2S2 and c-MYC specifically bind with LINC01600, and that LINC01600 plays a scaffolding role to link c-MYC to EIF2S2 in CRC cells.
EIF2S2 Enhances the Stability of the MYC Protein by Reducing the Degradation of LINC01600
We next characterized the molecular consequences of the associations among EIF2S2, c-MYC, and LINC01600. Interestingly, the activity of the luciferase reporter containing the c-MYC response element was diminished in EIF2S2-silenced cells, and it was augmented after LINC01600 overexpression (Figure 4A). Particularly, EIF2S2 and LINC01600 double knockdown significantly decreased activity of the c-MYC reporter in CRC cells significantly (Figure 4A). Alternatively, overexpression of EIF2S2 promoted the activity of the c-MYC reporter, while ectopic LINC01600 expression in EIF2S2-overexpressing CRC cells further promoted the activity of the c-MYC reporter (Figure 4A). To investigate the function of LINC01600 in CRC cell lines, cell lines with stable overexpression (pWPXL-LINC01600) and knockdown (shLINC01600) were established (Figure S6A). We found that LINC01600 overexpression significantly enhanced CRC cell proliferation, colony formation, migration, and invasion (Figures S6B–S6E, all p values <0.001). In contrast, LINC01600 knockdown significantly inhibited cell proliferation, colony formation ability, cell migration, and invasion (Figures S6B–S6E, all p values < 0.001). These results suggest that LINC01600 plays a carcinogenic role.
Figure 4.

EIF2S2 Plays Oncogenic Roles by Blocking the Proteasomal Degradation of MYC in a LINC01600-Dependent Manner
(A) Luciferase assays in CRC cells infected with lentivirus expressing EIF2S2 or transfected with EIF2S2 after LINC01600 knockdown or overexpression. Wilcoxon signed-rank test. (B) Densitometric analysis of LINC01600 RNA levels in cells with EIF2S2 knockdown or overexpression. The relative fold changes are expressed compared to the level at 0 h. (C) Immunoblotting to measure the EIF2S2 and MYC protein levels in cancer cells with ectopic expression of LINC01600 or treated with siLINC01600. (D) Immunoblotting to measure the MYC levels in cells with ectopic expression of LINC01600 or treated with siLINC01600 and cycloheximide (CHX, 30 μg/mL) for different durations. (E) Cells with LINC01600 knockdown or overexpression were transfected with pCMV-Flag-c-Myc plasmids for 48 h. Cell lysates were immunoprecipitated (IP) with either control IgG or anti-Flag antibody and immunoblotted with ubiquitin-specific antibody. Flag-tagged c-Myc and GAPDH served as the loading controls. (F) The relative mRNA levels of MYC downstream genes in HCT-116 and LoVo cells infected with lentivirus expressing EIF2S2/LINC01600 or transfected with EIF2S2/LINC01600 small interfering RNAs (siRNAs). (G–I) Proliferation (G), migration (H), and invasion assays (I) in HCT-116 and LoVo cells infected with lentivirus expressing EIF2S2/LINC01600 or transfected with EIF2S2/LINC01600 siRNAs. **p < 0.01, ***p < 0.001, Wilcoxon signed-rank test.
Actinomycin D, which effectively inhibits de novo synthesis of RNA, was used to explore the effects of EIF2S2 on the stability of LINC01600. Overexpression of EIF2S2 increased the half-life and steady-state level of LINC01600, whereas depletion of EIF2S2 resulted in decreases in the half-life and RNA level of LINC01600 (Figure 4B). These results suggest that EIF2S2 specifically regulates the stability of LINC01600 in CRC cells. However, LINC01600 had no effect on the protein levels of EIF2S2 but showed an obvious effect on the c-MYC protein levels (Figure 4C). Moreover, after treatment with the protein-synthesis inhibitor cycloheximide (CHX), LINC01600 knockdown decreased the half-life of c-MYC protein, whereas ectopic LINC01600 expression increased the half-life of the c-MYC protein in CRC cells (Figure 4D). These results indicate that LINC01600 might inhibit the proteasome-dependent degradation of c-MYC in CRC cells. Furthermore, the ubiquitination levels of c-Myc were significantly decreased in LINC01600-OE cells, whereas the ubiquitination levels of c-Myc were increased in LINC01600-knockdown cells (Figure 4E). LINC01600 overexpression rescued the effects of EIF2S2 knockdown on the expression of c-MYC target genes, whereas silencing of LINC01600 expression significantly decreased the expression levels of the genes induced by ectopic expression of EIF2S2 (Figure 4F), suggesting that EIF2S2 might regulate the expression of c-MYC downstream genes through modulation of LINC01600. Moreover, LINC01600 knockdown notably abolished the promotive effects of EIF2S2 on cell proliferation, migration, and invasion, whereas LINC01600 overexpression abrogated the inhibitory effects of EIF2S2 knockdown on cell proliferation, migration, and invasion (Figures 4G–4I; Figure S7). Taken together, these findings demonstrate that EIF2S2 acts as an oncogenic driver by activating c-MYC through LINC01600 in CRC cells.
The EIF2S2-LINC01600-MYC Axis Regulates Enhancers in Cancer
To further investigate the functional consequence of the EIF2S2-LINC01600-MYC complex, we next integrated the DNase-seq and chromatin immunoprecipitation sequencing (ChIP-seq) data to identify its downstream targets. We identified 606 genomic regions that were bound by c-MYC. By determining the intersection of these genomic regions, we identified 29 and 17 noncoding regions for further analyses (Figure 5A). Specifically, we focused on six candidate regions that were defined as super-enhancers in this study (Figure 5B). Two distinct focal regions located ∼1 and ∼97,420 kb far away from the FHIT gene in CRC cells were further investigated (Figures 5C and 5D). Interestingly, the tumor suppressor FHIT was demonstrated to play an unexpected role in the regulation of β-catenin-mediated gene transcription.30 To determine the functions of FHIT-related enhancers, we integrated DNase clusters in 95 cell types and identified five nearby constituent enhancers (E1–E5) and three distant constituent enhancers (E1′–E3′). These candidate enhancers overlapped with H3K27ac signals (Figures 5C and 5D). Next, luciferase reporter assays were performed to investigate the functions of these enhancers. We found that the E4 enhancer showed the strongest activity in LoVo cells (Figures 5E and 5F). However, there was no detectable enhancer activity in HEK293 cells, confirming that this super-enhancer was specific to CRC. Furthermore, duplication of the E4 enhancer in the luciferase reporter construct resulted in a >2-fold increase in luciferase expression relative to that of the construct with a single copy of E4 (Figure 5E). These results indicate that an increase in the copy number of the enhancer region may upregulate the expression of target genes.
Figure 5.

The Activity of FHIT Is Predominantly Driven by the E4 Constituent Enhancer
(A) The workflow for identifying MYC-regulated enhancers and target genes. (B) Candidate genomic regions harboring enhancers and adjacent target genes in the LoVo cell line. (C and D) Genomic overview of the DNase and H3K27ac signals in two representative enhancers of FHIT (C, super-enhancer I; D, super-enhancer II). E1E5 were enhancers. (E and F) Luciferase reporter assays were used to measure the enhancer activity of constituent enhancers in LoVo cells. The pCDH plasmid without the enhancer region (empty) was used as a negative control (E, super-enhancer I; F, super-enhancer II). (G) Relative expression of FHIT in LoVo cells with different treatments. (H) Luciferase reporter assays for β-catenin activity in LoVo cells with different treatments. (I) The effect of the FHIT E4 enhancer on proliferation (left panel), migration (middle panel), and invasion (right panel) in cells was dependent on the EIF2S2-LINC01600-MYC axis. *p < 0.05, **p < 0.01, ***p < 0.001, Wilcoxon signed-rank test.
Interestingly, we found that the expression of FHIT was significantly increased or decreased in E4-overexpressing or E4-depleted CRC cells, respectively (Figure S8A). In addition, we found that FHIT functions as a tumor suppressor in CRC and that dysregulated expression of FHIT is significantly involved in cell proliferation, migration, and invasion (Figures S8B–S8D). Moreover, we found that knockdown of the E4 enhancer significantly promoted cancer cell proliferation, migration, and invasion (Figures S8E and S8F). In contrast, overexpression of E4 produced the opposite effects (Figures S8E and S8F). These results suggest that the enhancer E4 plays critical roles in cancer development and progression by directly regulating the tumor suppressor FHIT. Furthermore, c-MYC knockdown markedly promoted the regulatory effect of the enhancer E4 on FHIT transcription, which was further repressed by overexpression of EIF2S2 and LINC01600 (Figure 5G). Alternatively, E4 restoration significantly restored the expression levels of FHIT, which were decreased by c-MYC, and FHIT expression was further activated by knockdown of EIF2S2 and LINC01600 (Figure 5G). Next, we further investigated the effects of the EIF2S2-LINC01600-MYC axis on the Wnt signaling pathway. We found that FHIT significantly inhibited the activity of the Wnt pathway, which was regulated by the EIF2S2-LINC01600-MYC axis (Figure 5H). Moreover, restoration of c-MYC markedly blocked the inhibitory effects of E4 on cell proliferation, migration, and invasion, which were further restored by overexpression of EIF2S2 and LINC01600 (Figure 5I). Taken together, these findings demonstrate that EIF2S2, LINC01600, and MYC formed a complex to regulate the E4 enhancer region, which further inhibits the regulatory effect of FHIT on the Wnt signaling pathway in CRC cells.
EIF2S2 Is a Candidate Therapeutic Target for GI Cancers
Because EIF2S2 expression was found to be significantly associated with poor patient survival and increased tumor growth in GI cancers, it may be a good candidate therapeutic target. Thus, we next assessed the potential effect of EIF2S2 on sensitivity to oxaliplatin, the most commonly used drug for CRC treatment.31 We first assessed EIF2S2 and c-MYC protein expression levels and LINC01600 RNA levels using immunohistochemistry (IHC) and qPCR, respectively, in 35 paired CRC tissues, and NCTs and the corresponding oxaliplatin-resistant tissue specimens. The expression levels of EIF2S2, c-MYC, and LINC01600 were significantly higher in oxaliplatin-resistant patients (Figures 6A and 6B, p < 0.001). In addition, there was strong positive correlation between the expression of EIF2S2 and LINC01600 in oxaliplatin-resistant tissue specimens (Figure 6C, r = 0.70, p < 0.001).
Figure 6.

Combination Treatment with siEIF2S2 and Oxaliplatin in CRC
(A) IHC images indicating EIF2S2 and MYC expression levels in adjacent normal tissues, CRC tissues, and oxaliplatin-resistant intestinal cancer tissues (original magnification, ×200). (B) LINC01600 RNA expression levels in CRC tissues and oxaliplatin-resistant intestinal cancer tissues. (C) Scatterplot of gene expression correlations between EIF2S2 and LINC01600 in CRC oxaliplatin-resistant intestinal cancer tissues. (D) Distribution of IC50 values in cells transfected with EIF2S2 or the EIF2S2-siLINC01600 mixture, and exposed to oxaliplatin for 3 days. (E) The distribution of the IC50 values in cells transfected with siEIF2S2 or the siEIF2S2-pWPXLLINC01600 mixture and exposed to oxaliplatin for 3 days. (F) Tumor weights and volumes in nude mice bearing subcutaneous tumor xenografts from shNC (control) cells or shEIF2S2 cells injected in situ with oxaliplatin. (G) Number of metastatic loci in the intestines of mice treated with oxaliplatin and shEIF2S2+oxaliplatin. (H) Number of metastatic loci in the livers of mice treated with oxaliplatin and shEIF2S2+oxaliplatin. The values are expressed as the means ± SEM. *p < 0.05, **p < 0.01, ***p < 0.001, Wilcoxon signed-rank test. (I) Proposed model depicting the role of EIF2S2 as an oncogene in CRC.
Next, we investigated the effects of EIF2S2 and LINC01600 on oxaliplatin sensitivity. We demonstrated that ectopic EIF2S2 expression significantly decreased the sensitivity of CRC cells to oxaliplatin compared with that of cells treated with the vector control (50% inhibitory concentration [IC50], 19.5 versus 7.48 nM) (Figure 6D, left panel), whereas LINC01600 knockdown restored the sensitivity of these cells to oxaliplatin (Figure 6D, right panel). Notably, the IC50 of oxaliplatin in EIF2S2-silenced cells was dramatically decreased, by ∼89% relative to that in control cells (Figure 6E, left panel), whereas overexpression of LINC01600 blocked siEIF2S2-induced chemo-sensitization to oxaliplatin (Figure 6E, right panel). These results suggest that EIF2S2 is a key factor accounting for oxaliplatin resistance in CRC. To further assess the effect of EIF2S2 on chemo-resistance to oxaliplatin in vivo, we established a xenograft tumor model in nude mice. We observed that EIF2S2 knockdown significantly reduced the tumor growth compared to that in the control group (Figure 6F). Furthermore, an in situ mouse intestinal perfusion model was used to evaluate the effect of EIF2S2 on oxaliplatin resistance. The results showed that the number of metastatic foci derived from EIF2S2 knockdown tumors was dramatically decreased in the intestinal and liver tissues (Figures 6G and 6H, all p values <0.001). These results suggest that EIF2S2 could be a potential therapeutic target in CRC.
Discussion
Accumulating studies have revealed that RBPs regulate the expression of thousands of transcripts,32 and some have been reported to be involved in various types of cancer.33,34 Discovering the driver RBPs in cancer is critical for precision oncology. In the present study, we integrated multidimensional genomic and transcriptomic data from ∼10,000 tumor patients and ∼1,000 cancer cell lines in the TCGA and Cancer Cell Line Encyclopedia (CCLE) projects. Our integrative analyses revealed a top candidate RBP, EIF2S2, which plays oncogenic roles in GI cancers. Our work provides several lines of evidence to support the model indicating that the oncogenic EIF2S2-LINC01600-MYC axis blocks the inhibitory effect of FHIT on the WNT signaling pathway in cancer (Figure 6I). Specifically, we found that EIF2S2, LINC01600, and MYC are highly expressed in CRC (Figure S9A). These oncogenic molecules form a lncRNA-centered complex and further suppress the regulatory effect of FHIT on the WNT signaling. Specifically, we demonstrated that siEIF2S2 treatment combined with oxaliplatin treatment may be a potential therapeutic approach in CRC.
With the development of high-throughput sequencing, an increasing number of lncRNAs have been identified.35 However, little is known about the functions of these lncRNAs.36,37 lncRNAs are involved in various types of biological functions through diverse mechanisms, often including interactions with protein partners.27,38 In the current study, we identified LINC01600 as a candidate target of EIF2S2 and demonstrated that this lncRNA plays an oncogenic role in GI cancers. Furthermore, we validated that LINC01600 interacts with the MYC protein. The oncogenic role of c-MYC has been thoroughly investigated in cancer development and progression.39,40 MYC can be activated by multiple mechanisms in cancer, and emerging evidence has uncovered the role of lncRNAs, such as CCAT1-L (CRC-associated transcript 1),41 PCGM1 (prostate cancer gene expression marker 1),42 GHET1 (gastric carcinoma highly expressed marker 1),43 and EPIC1 (epigenetically induced lncRNA1),44 in MYC activation. In this study, we reveal that LINC01600 can bind to the HLH domain of MYC and further stabilize the MYC protein. These results suggest that LINC01600 may function as a “guide” RNA to facilitate EIF2S2-MYC regulation on MYC targets, further activating the Wnt signaling pathway. Since MYC amplification is the cancer-driven event, we next explored whether there is an association between EIF2S2 overexpression and MYC amplification. We found that although there was higher expression in the MYC-amplified patients, the difference was not significant (p = 0.215). These results suggest that EIF2S2 overexpression was likely to be an independent cancer-driven event.
Encouraged by the recapitulation of MYC function, we mechanistically validated the hypothesis that the EIF2S2-LINC01600-MYC axis can regulate the function of FHIT-related enhancers. Similar to our findings, focal amplification of different enhancer regions downstream of MYC has been reported in other cancer types.45,46 Interestingly, we found that FHIT is a tumor suppressor that is highly expressed in cancers (Figure S9B). FHIT can inhibit the activity of the Wnt signaling pathway. We demonstrated that the EIF2S2-LINC01600-MYC axis can suppress the inhibitory effect of FHIT on Wnt signaling, providing a potential explanation for the activation of Wnt signaling in cancer. Moreover, oxaliplatin is the first platinum drug with proven activity to treat CRC.47 However, only subsets of patients respond to this treatment. It is important to identify a new therapeutic approach to overcome oxaliplatin resistance.48 Because the dysregulation of RBPs can affect many pathways of cancer, RBPs might be good therapeutic targets.49 There are several clinical trials for targeting RBPs as cancer therapy. Intravenous injection of antisense oligonucleotide (ASO) against eIF4E can suppress tumor growth without any side effect.50 In addition, siHuR has shown dramatic anti-oncogenic activity in cancer.51 In this study, we demonstrated that decreased EIF2SE expression appears to be a major contributor to chemosensitivity to oxaliplatin treatment, suggesting a rational combination of EIF2S2i and oxaliplatin. Moreover, we found that the expression of EIF2S2 is associated with poor prognosis of patients in various types of cancer (Figure S9C). These data suggest that EIF2S2 silencing has the potential to increase the effectiveness of oxaliplatin treatment. Clinical trials are needed to determine whether the combination of siEIF2S2 and oxaliplatin will benefit these patients. All of these results suggest that identification of RBPs can be developed as therapeutic drugs for cancer therapy.
In summary, our results provide a detailed knowledge base for the function of the EIF2S2-LINC01600-MYC axis in cancer. Our integrative analysis reveals a candidate driver RBP, and the mechanistic characterization of EIF2S2 helps to pave the way for the development of cancer therapies.
Materials and Methods
Clinical Samples and Cell Lines
We collected 79 paired human CRC tissues and NCTs at the Affiliated Hospital of Jiangnan University, and 86 paired CRC tissues and NCTs at Fudan University Zhongshan Hospital. The patient information is shown in Table 1. In addition, a total of 80 pairs of human primary GC tissues and adjacent NCTs were collected between 2008 and 2012 at the Affiliated Hospital of Jiangnan University. The tissue samples were immediately snap frozen in liquid nitrogen and were histologically confirmed. Another 72 paired HCC samples and adjacent NT liver tissues from patients with HCC were obtained from the surgical specimen archives of Fudan University Zhongshan Hospital, Shanghai, China. All of these human materials were obtained with informed consent.
Cells were cultured following the instructions recommended by the American Type Culture Collection (ATCC). HEK293T cells were purchased from ATCC, and human GC cell lines (MGC-803 and SGC-7901) were purchased from Shanghai Meixuan. The CRC cell lines LoVo, Caco2, HT29, HCT8, HCT116, CCH-HE-2, DLD1, and SW480 were purchased from ATCC between 2008 and 2014. Huh-7 cells were obtained from the Japanese Collection of Research Bioresources (JCRB, Tokyo, Japan). The SNU-449 cell line was purchased from the Shanghai Cell Bank Type Culture Collection Committee (CBTCCC, Shanghai, China). All media (HyClone, USA) were supplemented with 10% fetal bovine serum (FBS) (Gibco, USA). SGC-7901, MKN45, and HEK293T cells were cultured in DMEM. This study was carried out with the permission of the Clinical Research Ethics Committees of the Affiliated Hospital of Jiangnan University and the Institutional Review Board of the Shanghai Medical College of Fudan University.
Gene Expression Analysis of Human RBPs across Cancer Types
We assembled 860 RBPs from a recent study.9 Next, we obtained genome-wide gene expression data across 10,699 samples of 33 cancer types from the TCGA project.52 Gene expression was measured as fragments per kilobase of transcript per million mapped reads (FPKM). First, we excluded the genes that were not expressed in more than 30% of the samples. Next, the gene expression values were log transformed. To identify the RBPs that are perturbed in cancer, we used the Wilcoxon rank-sum test to identify the RBPs differentially expressed in cancer. Here, only the 18 cancer types with more than five corresponding normal samples were considered. The p values were adjusted by the Benjamini-Hochberg procedure. RBPs with adjusted p values <0.005 were considered differentially expressed in cancer.
Identification of Critical RBPs in GI Cancer
To evaluate whether RBPs were more likely than other proteins to be perturbed in cancer, we first calculated the proportion of RBP-encoding genes that showed transcriptomic perturbations and the proportion of other genes perturbed in cancer. The differences between the two proportions were compared with Fisher’s exact test. Next, to identify the critical RBPs in cancer, we first identified RBPs that show transcriptional perturbations in more than 80% of cancer types. Moreover, we used the corresponding gene symbols and “cancer” as keywords to query the PubMed database for these RBPs. This process was performed with the R package RISmed (https://rdrr.io/cran/RISmed/). We focused on the RBPs reported in fewer than three publications and obtained 20 RBPs. Moreover, we obtained the genomic alterations in 1,019 cell lines from the CCLE project.53 We calculated the genetic alteration frequency (including all types of somatic mutations and copy number variations) for each RBP across the cell lines. We found that four RBPs had a frequency of >5%. These RBPs were identified as critical RBPs in cancer.
GSEA
To identify the pathways potentially regulated by EIF2S2, we first calculated the expression correlation coefficient for each gene with EIF2S2. In this study, we analyzed the gene expression data from the COAD, READ, and LIHC projects in TCGA.54 We next ranked all genes based on the correlation coefficient, and these genes were subjected to GSEA analysis (see details in Supplemental Materials and Methods).24,55 The signaling pathways from Reactome were considered.25
Identification of the Candidate Enhancer Targets of MYC
We obtained the DNase-seq peak files in the LoVo cell line from the Encyclopedia of DNA Elements (ENCODE) project. In this study, two replicates were analyzed separately. In addition, we downloaded the MYC binding sites obtained from ChIP-seq data in the LoVo cell line. After mapping the reads to the human genome, we obtained 128,447 and 149,118 regulatory regions in LoVo cells. The peak coordinates were transformed to the hg38 version by liftover.56 Next, we used BEDtools to obtain the overlapped genomic region from the DNase-seq and ChIP-seq data.57 Finally, the genes nearest these peaks were taken as candidate target genes.
Supporting Materials and Methods
For details regarding the RNA pull-down assays and mass spectrometry analyses, RNA immunoprecipitation assay, DNA and RNA isolation, western blotting, Northern blot, 5′ and 3′ RACE assay, subcellular fractionation, cell proliferation and colony formation assays, invasion and migration assays, luciferase assay, in vivo assays, RNA interference and generation of lentivirus particles, immunoblotting analysis, IHC, in vitro cellular IC50 assays, and other related procedures, refer Supplemental Materials and Methods and Table S2. Mixed clone cells of EIF2S2 stable cell lines were used in our current study.
Statistical Analysis
All data are presented as mean ± standard deviation (SD) of at least three independent experiments. The Kaplan-Meier method was used to determine overall survival rates, and the p values were calculated with the log-rank test. A Wilcoxon rank sum test was used to identify the differentially expressed RBPs. All statistical analyses were performed using R 3.5.1 program. A p value of <0.05 was considered to indicate statistical significance.
Author Contributions
J.Z. and Y.L. conceived and performed the experiments and wrote the manuscript. S.L., J.X., and T.S. analyzed the data. Y.S., H.W., and J.Z. collected the patient samples and interpreted the data. L.Z. and M.S. performed the animal and cell line experiments. All authors read and approved the final draft of the manuscript.
Conflicts of Interest
The authors declare no competing interests.
Acknowledgments
This work was supported by the National Natural Science Foundation of China (81602033, 31970646, 81672328, 61502126, 31571331, and 31871338), the Fundamental Research Funds for the Central Universities (NOJUSRP51619), the National First-Class Discipline Program of Food Science and Technology (JUFSTR20180101), the Medical Key Professionals Program of Jiangsu Province (AF052141), and by the Wuxi Medical Innovation Team (CXTP003).
Footnotes
Supplemental Information can be found online at https://doi.org/10.1016/j.ymthe.2020.02.004.
Contributor Information
Jiwei Zhang, Email: joveus1024@gmail.com.
Zhaohui Huang, Email: hzhwxsy@126.com.
Yongsheng Li, Email: liyongsheng@hainmc.edu.cn.
Supplemental Information
References
- 1.Peery A.F., Crockett S.D., Murphy C.C., Lund J.L., Dellon E.S., Williams J.L., Jensen E.T., Shaheen N.J., Barritt A.S., Lieber S.R. Burden and cost of gastrointestinal, liver, and pancreatic diseases in the United States: update 2018. Gastroenterology. 2019;156:254–272.e11. doi: 10.1053/j.gastro.2018.08.063. [DOI] [PMC free article] [PubMed] [Google Scholar]
- 2.Moehler M., Delic M., Goepfert K., Aust D., Grabsch H.I., Halama N., Heinrich B., Julie C., Lordick F., Lutz M.P. Immunotherapy in gastrointestinal cancer: recent results, current studies and future perspectives. Eur. J. Cancer. 2016;59:160–170. doi: 10.1016/j.ejca.2016.02.020. [DOI] [PubMed] [Google Scholar]
- 3.Kemi N., Eskuri M., Ikäläinen J., Karttunen T.J., Kauppila J.H. Tumor budding and prognosis in gastric adenocarcinoma. Am. J. Surg. Pathol. 2019;43:229–234. doi: 10.1097/PAS.0000000000001181. [DOI] [PubMed] [Google Scholar]
- 4.Hanahan D., Weinberg R.A. Hallmarks of cancer: the next generation. Cell. 2011;144:646–674. doi: 10.1016/j.cell.2011.02.013. [DOI] [PubMed] [Google Scholar]
- 5.Forbes S.A., Beare D., Boutselakis H., Bamford S., Bindal N., Tate J., Cole C.G., Ward S., Dawson E., Ponting L. COSMIC: somatic cancer genetics at high-resolution. Nucleic Acids Res. 2017;45(D1):D777–D783. doi: 10.1093/nar/gkw1121. [DOI] [PMC free article] [PubMed] [Google Scholar]
- 6.Forbes S.A., Beare D., Gunasekaran P., Leung K., Bindal N., Boutselakis H., Ding M., Bamford S., Cole C., Ward S. COSMIC: exploring the world’s knowledge of somatic mutations in human cancer. Nucleic Acids Res. 2015;43:D805–D811. doi: 10.1093/nar/gku1075. [DOI] [PMC free article] [PubMed] [Google Scholar]
- 7.Eberhardt W., Doller A., Akool S., Pfeilschifter J. Modulation of mRNA stability as a novel therapeutic approach. Pharmacol. Ther. 2007;114:56–73. doi: 10.1016/j.pharmthera.2007.01.002. [DOI] [PubMed] [Google Scholar]
- 8.Schoenberg D.R., Maquat L.E. Regulation of cytoplasmic mRNA decay. Nat. Rev. Genet. 2012;13:246–259. doi: 10.1038/nrg3160. [DOI] [PMC free article] [PubMed] [Google Scholar]
- 9.Castello A., Fischer B., Eichelbaum K., Horos R., Beckmann B.M., Strein C., Davey N.E., Humphreys D.T., Preiss T., Steinmetz L.M. Insights into RNA biology from an atlas of mammalian mRNA-binding proteins. Cell. 2012;149:1393–1406. doi: 10.1016/j.cell.2012.04.031. [DOI] [PubMed] [Google Scholar]
- 10.Gerstberger S., Hafner M., Tuschl T. A census of human RNA-binding proteins. Nat. Rev. Genet. 2014;15:829–845. doi: 10.1038/nrg3813. [DOI] [PMC free article] [PubMed] [Google Scholar]
- 11.Dang H., Takai A., Forgues M., Pomyen Y., Mou H., Xue W., Ray D., Ha K.C.H., Morris Q.D., Hughes T.R. Oncogenic activation of the RNA binding protein NELFE and MYC signaling in hepatocellular carcinoma. Cancer Cell. 2017;32:101–114.e8. doi: 10.1016/j.ccell.2017.06.002. [DOI] [PMC free article] [PubMed] [Google Scholar]
- 12.Yang G., Fu H., Zhang J., Lu X., Yu F., Jin L., Bai L., Huang B., Shen L., Feng Y. RNA-binding protein quaking, a critical regulator of colon epithelial differentiation and a suppressor of colon cancer. Gastroenterology. 2010;138:231–240.e1–5. doi: 10.1053/j.gastro.2009.08.001. [DOI] [PMC free article] [PubMed] [Google Scholar]
- 13.Fagoonee S., Picco G., Orso F., Arrigoni A., Longo D.L., Forni M., Scarfò I., Cassenti A., Piva R., Cassoni P. The RNA-binding protein ESRP1 promotes human colorectal cancer progression. Oncotarget. 2017;8:10007–10024. doi: 10.18632/oncotarget.14318. [DOI] [PMC free article] [PubMed] [Google Scholar]
- 14.Kumar B., Singh S., Skvortsova I., Kumar V. Promising targets in anti-cancer drug development: recent updates. Curr. Med. Chem. 2017;24:4729–4752. doi: 10.2174/0929867324666170331123648. [DOI] [PubMed] [Google Scholar]
- 15.Rabik C.A., Dolan M.E. Molecular mechanisms of resistance and toxicity associated with platinating agents. Cancer Treat. Rev. 2007;33:9–23. doi: 10.1016/j.ctrv.2006.09.006. [DOI] [PMC free article] [PubMed] [Google Scholar]
- 16.Rivera F., Vega-Villegas M.E., López-Brea M.F. Chemotherapy of advanced gastric cancer. Cancer Treat. Rev. 2007;33:315–324. doi: 10.1016/j.ctrv.2007.01.004. [DOI] [PubMed] [Google Scholar]
- 17.Yang A.D., Fan F., Camp E.R., van Buren G., Liu W., Somcio R., Gray M.J., Cheng H., Hoff P.M., Ellis L.M. Chronic oxaliplatin resistance induces epithelial-to-mesenchymal transition in colorectal cancer cell lines. Clin. Cancer Res. 2006;12:4147–4153. doi: 10.1158/1078-0432.CCR-06-0038. [DOI] [PubMed] [Google Scholar]
- 18.Martin L.P., Hamilton T.C., Schilder R.J. Platinum resistance: the role of DNA repair pathways. Clin. Cancer Res. 2008;14:1291–1295. doi: 10.1158/1078-0432.CCR-07-2238. [DOI] [PubMed] [Google Scholar]
- 19.Al-Lazikani B., Banerji U., Workman P. Combinatorial drug therapy for cancer in the post-genomic era. Nat. Biotechnol. 2012;30:679–692. doi: 10.1038/nbt.2284. [DOI] [PubMed] [Google Scholar]
- 20.Kouyama Y., Masuda T., Fujii A., Ogawa Y., Sato K., Tobo T., Wakiyama H., Yoshikawa Y., Noda M., Tsuruda Y. Oncogenic splicing abnormalities induced by DEAD-Box Helicase 56 amplification in colorectal cancer. Cancer Sci. 2019;110:3132–3144. doi: 10.1111/cas.14163. [DOI] [PMC free article] [PubMed] [Google Scholar]
- 21.Qiao G.J., Chen L., Wu J.C., Li Z.R. Identification of an eight-gene signature for survival prediction for patients with hepatocellular carcinoma based on integrated bioinformatics analysis. PeerJ. 2019;7:e6548. doi: 10.7717/peerj.6548. [DOI] [PMC free article] [PubMed] [Google Scholar]
- 22.Wang K., Li L., Fu L., Yuan Y., Dai H., Zhu T., Zhou Y., Yuan F. Integrated bioinformatics analysis the function of RNA binding proteins (RBPs) and their prognostic value in breast cancer. Front. Pharmacol. 2019;10:140. doi: 10.3389/fphar.2019.00140. [DOI] [PMC free article] [PubMed] [Google Scholar]
- 23.Yang H.W., Kim T.M., Song S.S., Menon L., Jiang X., Huang W., Black P.M., Park P.J., Carroll R.S., Johnson M.D. A small subunit processome protein promotes cancer by altering translation. Oncogene. 2015;34:4471–4481. doi: 10.1038/onc.2014.376. [DOI] [PubMed] [Google Scholar]
- 24.Subramanian A., Tamayo P., Mootha V.K., Mukherjee S., Ebert B.L., Gillette M.A., Paulovich A., Pomeroy S.L., Golub T.R., Lander E.S., Mesirov J.P. Gene set enrichment analysis: a knowledge-based approach for interpreting genome-wide expression profiles. Proc. Natl. Acad. Sci. USA. 2005;102:15545–15550. doi: 10.1073/pnas.0506580102. [DOI] [PMC free article] [PubMed] [Google Scholar]
- 25.Fabregat A., Jupe S., Matthews L., Sidiropoulos K., Gillespie M., Garapati P., Haw R., Jassal B., Korninger F., May B. The Reactome Pathway Knowledgebase. Nucleic Acids Res. 2018;46(D1):D649–D655. doi: 10.1093/nar/gkx1132. [DOI] [PMC free article] [PubMed] [Google Scholar]
- 26.He Y., Meng X.M., Huang C., Wu B.M., Zhang L., Lv X.W., Li J. Long noncoding RNAs: novel insights into hepatocelluar carcinoma. Cancer Lett. 2014;344:20–27. doi: 10.1016/j.canlet.2013.10.021. [DOI] [PubMed] [Google Scholar]
- 27.Li Y., McGrail D.J., Xu J., Li J., Liu N.N., Sun M., Lin R., Pancsa R., Zhang J., Lee J.S. MERIT: systematic analysis and characterization of mutational effect on RNA interactome topology. Hepatology. 2019;70:532–546. doi: 10.1002/hep.30242. [DOI] [PMC free article] [PubMed] [Google Scholar]
- 28.Chen N., Fang W., Lin Z., Peng P., Wang J., Zhan J., Hong S., Huang J., Liu L., Sheng J. KRAS mutation-induced upregulation of PD-L1 mediates immune escape in human lung adenocarcinoma. Cancer Immunol. Immunother. 2017;66:1175–1187. doi: 10.1007/s00262-017-2005-z. [DOI] [PMC free article] [PubMed] [Google Scholar]
- 29.Sherwood V. WNT signaling: an emerging mediator of cancer cell metabolism? Mol. Cell. Biol. 2015;35:2–10. doi: 10.1128/MCB.00992-14. [DOI] [PMC free article] [PubMed] [Google Scholar]
- 30.Weiske J., Albring K.F., Huber O. The tumor suppressor Fhit acts as a repressor of beta-catenin transcriptional activity. Proc. Natl. Acad. Sci. USA. 2007;104:20344–20349. doi: 10.1073/pnas.0703664105. [DOI] [PMC free article] [PubMed] [Google Scholar]
- 31.Rothenberg M.L. Efficacy of oxaliplatin in the treatment of colorectal cancer. Oncology (Williston Park) 2000;14(12, Suppl 11):9–14. [PubMed] [Google Scholar]
- 32.Li Y.E., Xiao M., Shi B., Yang Y.T., Wang D., Wang F., Marcia M., Lu Z.J. Identification of high-confidence RNA regulatory elements by combinatorial classification of RNA-protein binding sites. Genome Biol. 2017;18:169. doi: 10.1186/s13059-017-1298-8. [DOI] [PMC free article] [PubMed] [Google Scholar]
- 33.Yan X., Hu Z., Feng Y., Hu X., Yuan J., Zhao S.D., Zhang Y., Yang L., Shan W., He Q. Comprehensive genomic characterization of long non-coding RNAs across human cancers. Cancer Cell. 2015;28:529–540. doi: 10.1016/j.ccell.2015.09.006. [DOI] [PMC free article] [PubMed] [Google Scholar]
- 34.Neelamraju Y., Gonzalez-Perez A., Bhat-Nakshatri P., Nakshatri H., Janga S.C. Mutational landscape of RNA-binding proteins in human cancers. RNA Biol. 2018;15:115–129. doi: 10.1080/15476286.2017.1391436. [DOI] [PMC free article] [PubMed] [Google Scholar]
- 35.St Laurent G., Wahlestedt C., Kapranov P. The landscape of long noncoding RNA classification. Trends Genet. 2015;31:239–251. doi: 10.1016/j.tig.2015.03.007. [DOI] [PMC free article] [PubMed] [Google Scholar]
- 36.Marchese F.P., Raimondi I., Huarte M. The multidimensional mechanisms of long noncoding RNA function. Genome Biol. 2017;18:206. doi: 10.1186/s13059-017-1348-2. [DOI] [PMC free article] [PubMed] [Google Scholar]
- 37.Quinn J.J., Chang H.Y. Unique features of long non-coding RNA biogenesis and function. Nat. Rev. Genet. 2016;17:47–62. doi: 10.1038/nrg.2015.10. [DOI] [PubMed] [Google Scholar]
- 38.Ferrè F., Colantoni A., Helmer-Citterich M. Revealing protein-lncRNA interaction. Brief. Bioinform. 2016;17:106–116. doi: 10.1093/bib/bbv031. [DOI] [PMC free article] [PubMed] [Google Scholar]
- 39.Dang C.V. MYC on the path to cancer. Cell. 2012;149:22–35. doi: 10.1016/j.cell.2012.03.003. [DOI] [PMC free article] [PubMed] [Google Scholar]
- 40.Kress T.R., Sabò A., Amati B. MYC: connecting selective transcriptional control to global RNA production. Nat. Rev. Cancer. 2015;15:593–607. doi: 10.1038/nrc3984. [DOI] [PubMed] [Google Scholar]
- 41.Xiang J.F., Yin Q.F., Chen T., Zhang Y., Zhang X.O., Wu Z., Zhang S., Wang H.B., Ge J., Lu X. Human colorectal cancer-specific CCAT1-L lncRNA regulates long-range chromatin interactions at the MYC locus. Cell Res. 2014;24:513–531. doi: 10.1038/cr.2014.35. [DOI] [PMC free article] [PubMed] [Google Scholar]
- 42.Hung C.L., Wang L.Y., Yu Y.L., Chen H.W., Srivastava S., Petrovics G., Kung H.J. A long noncoding RNA connects c-Myc to tumor metabolism. Proc. Natl. Acad. Sci. USA. 2014;111:18697–18702. doi: 10.1073/pnas.1415669112. [DOI] [PMC free article] [PubMed] [Google Scholar]
- 43.Yang F., Xue X., Zheng L., Bi J., Zhou Y., Zhi K., Gu Y., Fang G. Long non-coding RNA GHET1 promotes gastric carcinoma cell proliferation by increasing c-Myc mRNA stability. FEBS J. 2014;281:802–813. doi: 10.1111/febs.12625. [DOI] [PubMed] [Google Scholar]
- 44.Wang Z., Yang B., Zhang M., Guo W., Wu Z., Wang Y., Jia L., Li S., Xie W., Yang D., Cancer Genome Atlas Research Network lncRNA epigenetic landscape analysis identifies EPIC1 as an oncogenic lncRNA that interacts with MYC and promotes cell-cycle progression in cancer. Cancer Cell. 2018;33:706–720.e9. doi: 10.1016/j.ccell.2018.03.006. [DOI] [PMC free article] [PubMed] [Google Scholar]
- 45.Herranz D., Ambesi-Impiombato A., Palomero T., Schnell S.A., Belver L., Wendorff A.A., Xu L., Castillo-Martin M., Llobet-Navás D., Cordon-Cardo C. A NOTCH1-driven MYC enhancer promotes T cell development, transformation and acute lymphoblastic leukemia. Nat. Med. 2014;20:1130–1137. doi: 10.1038/nm.3665. [DOI] [PMC free article] [PubMed] [Google Scholar]
- 46.Zhang X., Choi P.S., Francis J.M., Imielinski M., Watanabe H., Cherniack A.D., Meyerson M. Identification of focally amplified lineage-specific super-enhancers in human epithelial cancers. Nat. Genet. 2016;48:176–182. doi: 10.1038/ng.3470. [DOI] [PMC free article] [PubMed] [Google Scholar]
- 47.Martinez-Balibrea E., Martínez-Cardús A., Ginés A., Ruiz de Porras V., Moutinho C., Layos L., Manzano J.L., Bugés C., Bystrup S., Esteller M., Abad A. Tumor-related molecular mechanisms of oxaliplatin resistance. Mol. Cancer Ther. 2015;14:1767–1776. doi: 10.1158/1535-7163.MCT-14-0636. [DOI] [PubMed] [Google Scholar]
- 48.Kelland L. The resurgence of platinum-based cancer chemotherapy. Nat. Rev. Cancer. 2007;7:573–584. doi: 10.1038/nrc2167. [DOI] [PubMed] [Google Scholar]
- 49.Hong S. RNA binding protein as an emerging therapeutic target for cancer prevention and treatment. J. Cancer Prev. 2017;22:203–210. doi: 10.15430/JCP.2017.22.4.203. [DOI] [PMC free article] [PubMed] [Google Scholar]
- 50.Hsieh A.C., Ruggero D. Targeting eukaryotic translation initiation factor 4E (eIF4E) in cancer. Clin. Cancer Res. 2010;16:4914–4920. doi: 10.1158/1078-0432.CCR-10-0433. [DOI] [PMC free article] [PubMed] [Google Scholar]
- 51.Huang Y.H., Peng W., Furuuchi N., Gerhart J., Rhodes K., Mukherjee N., Jimbo M., Gonye G.E., Brody J.R., Getts R.C., Sawicki J.A. Delivery of therapeutics targeting the mRNA-binding protein HuR using 3DNA nanocarriers suppresses ovarian tumor growth. Cancer Res. 2016;76:1549–1559. doi: 10.1158/0008-5472.CAN-15-2073. [DOI] [PubMed] [Google Scholar]
- 52.Weinstein J.N., Collisson E.A., Mills G.B., Shaw K.R., Ozenberger B.A., Ellrott K., Shmulevich I., Sander C., Stuart J.M., Cancer Genome Atlas Research Network The Cancer Genome Atlas Pan-Cancer analysis project. Nat. Genet. 2013;45:1113–1120. doi: 10.1038/ng.2764. [DOI] [PMC free article] [PubMed] [Google Scholar]
- 53.Barretina J., Caponigro G., Stransky N., Venkatesan K., Margolin A.A., Kim S., Wilson C.J., Lehár J., Kryukov G.V., Sonkin D. The Cancer Cell Line Encyclopedia enables predictive modelling of anticancer drug sensitivity. Nature. 2012;483:603–607. doi: 10.1038/nature11003. [DOI] [PMC free article] [PubMed] [Google Scholar]
- 54.Cancer Genome Atlas N., Cancer Genome Atlas Network Comprehensive molecular characterization of human colon and rectal cancer. Nature. 2012;487:330–337. doi: 10.1038/nature11252. [DOI] [PMC free article] [PubMed] [Google Scholar]
- 55.Mootha V.K., Lindgren C.M., Eriksson K.F., Subramanian A., Sihag S., Lehar J., Puigserver P., Carlsson E., Ridderstråle M., Laurila E. PGC-1α-responsive genes involved in oxidative phosphorylation are coordinately downregulated in human diabetes. Nat. Genet. 2003;34:267–273. doi: 10.1038/ng1180. [DOI] [PubMed] [Google Scholar]
- 56.Gao B., Huang Q., Baudis M. segment_liftover : a Python tool to convert segments between genome assemblies. F1000Res. 2018;7:319. doi: 10.12688/f1000research.14148.1. [DOI] [PMC free article] [PubMed] [Google Scholar]
- 57.Quinlan A.R., Hall I.M. BEDTools: a flexible suite of utilities for comparing genomic features. Bioinformatics. 2010;26:841–842. doi: 10.1093/bioinformatics/btq033. [DOI] [PMC free article] [PubMed] [Google Scholar]
Associated Data
This section collects any data citations, data availability statements, or supplementary materials included in this article.