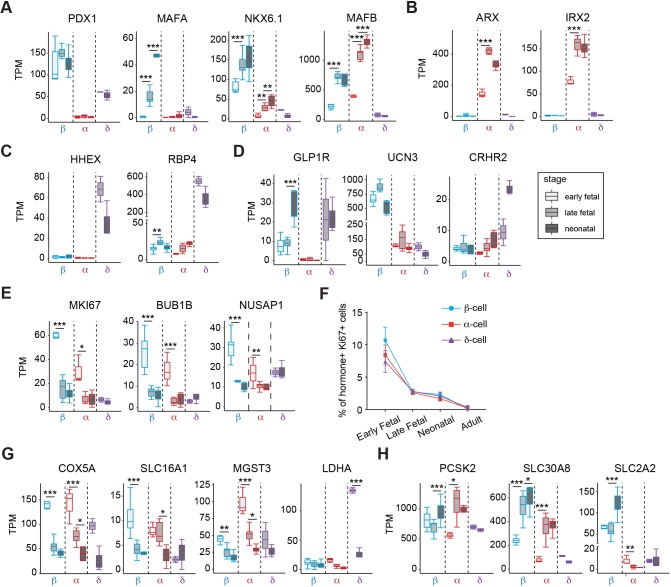
Fig. 2.
Analysis of gene expression in developing pig islet β-, α- and δ-cells. (A-E,G,H) Boxplots displaying normalized TPM counts of β-, α- and δ-cell specific genes (A-D), markers associated with proliferation (E), disallowed genes (G) and β-cell functional regulators (H). Box plots show the median, interquartile range (IQR) and 1.5 times the IQR. (F) Quantification showing average percentage of INS+ (β-cell), GCG+ (α-cell) or SST+ (δ-cell) cells that are Ki67+ in each developmental stage (n=40 images per group, from three pigs per group; error bars show s.d.). Adjusted P-value: *P≤0.05, **P≤0.01, ***P≤0.001 (Benjamini-Hochberg).

