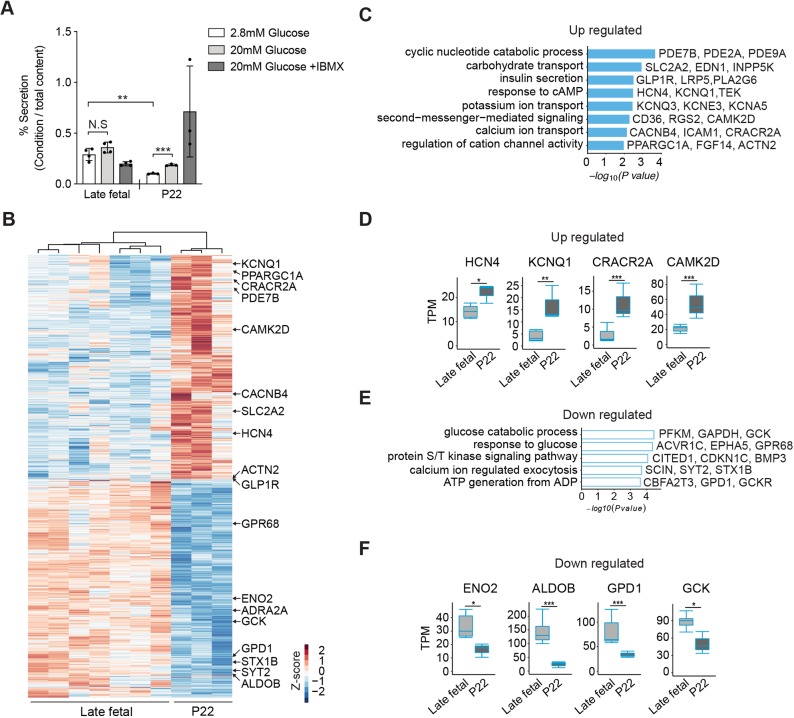
Fig. 6.
Maturation of β-cell function in postnatal pigs. (A) Glucose-stimulated insulin secretion (GSIS) assay measured insulin secretion in response to 2.8 mM (low), 20 mM (high) glucose and 20 mM glucose+IBMX. Data show average secreted insulin as a percentage of insulin content in the isolated islets from late fetal (n=4) and P22 (n=3) piglets (t-test; **P≤0.01, ***P≤0.001; error bars indicate s.d.; N.S., not significant). (B) Heat map of DEGs between late fetal and P22 β-cells. The z-score scale represents log2(X+1) transformed TPM counts. Red and blue color intensity of the z-score indicates upregulation and downregulation, respectively. (C,E) GO term analysis for biological processes with upregulated (C) and downregulated (E) genes between late fetal and P22 β-cells. Adjusted P-value threshold was 0.1. (D,F) Boxplots displaying normalized TPM counts of upregulated (D) or downregulated (F) genes between late fetal and P22. Box plots show the median, interquartile range (IQR) and 1.5 times the IQR. Adjusted P-value: *P≤0.05, **P≤0.01, ***P≤0.001 (Benjamini-Hochberg).

