Short abstract
Objective
This study aimed to investigate whether luteolin delays the progress of diabetic nephropathy (DN) induced by streptozotocin.
Methods
Fifty-three healthy, 8-week-old, male Sprague–Dawley rats were randomly divided into the control (n = 6), model (n = 23), and experimental groups (n = 24). The rat model of diabetic nephropathy was established by intraperitoneal injection of streptozotocin. Rats in the experimental group were administered luteolin suspension of 80 mg/kg daily for 8 weeks. Blood glucose levels and body weight were recorded until the fourth week. After intragastric administration, blood flow and the protective effect of luteolin on diabetic nephropathy were evaluated.
Results
The degree of renal apoptosis and fibrosis in the experimental group was milder, and glomerular structure was more complete compared with the model group. Nphs2 staining suggested that luteolin delayed apoptosis and deletion and fusion of podocytes under high glucose levels, and protected the filtration function of the basement membrane by upregulating Nphs2 protein expression. Time intensity curve results suggested that luteolin delayed deterioration of renal haemodynamics under hyperglycaemia.
Conclusions
This study shows that luteolin delays progression of diabetic nephropathy. This drug has potential wide applicability in future clinical application.
Keywords: Streptozotocin (STZ), diabetic nephropathy (DN), luteolin, contrast-enhanced ultrasound (CEUS), glucose, renal haemodynamics
Abbreviations
A: absolute peak intensity
BUN: blood urea nitrogen
CEUS: contrast-enhanced ultrasound
DN: diabetic nephropathy
GBM: glomerular basement membrane
Grad: gradient from the start frame to the peak frame
VD: end-diastolic velocity
VS: peak systolic velocity
RI: resistance index
STZ: streptozotocin
TC: total cholesterol
TG: triglycerides
TIC: time intensity curve
TTP: time to peak
ROI: region of interest
Scr: serum creatinine
Introduction
Diabetes is a disease that has not yet been completely cured worldwide and diabetic nephropathy (DN) is one of the most common complications. Approximately 30% to 40% of patients with type 1 diabetes mellitus and type 2 diabetes mellitus develop DN, and approximately 50% of them can progress to end-stage renal disease.1 DN has become the leading cause of death of patients with type 1 diabetes, and is second only to macrovascular complications in type 2 diabetes. The pathogenesis of DN is complex, and current research suggests that many factors are involved in its pathogenesis as follows. (1) Metabolic disorder is involved in DN. Renal haemodynamic disorder and abnormal glucose metabolism are caused by long-term hyperglycaemia.2 An increase in the activity of the renin–angiotensin II–aldosterone system leads to renal injury.3 (2) Inflammatory reactions are also involved in the pathogenesis of DN. (3) With regard to genetic factors, micro RNA is overexpressed in DN, which leads to occurrence or development of DN.4,5 DNA hypermethylation can increase renin–angiotensin system activation of fibroblasts, resulting in cell proliferation and fibrosis.6 There are also histone post-transcriptional modifications and non-coding RNA.1,7 (4) Oxidative stress is initiated and magnified8 and endoplasmic reticulum stress also plays an important role in renal tissue damage in diabetes mellitus.9
Luteolin is a natural flavonoid that is extensively present in many fruits and vegetables.10 Luteolin exhibits a wide spectrum of biological and pharmacological actions,11 such as anti-apoptosis,12,13 anti-inflammation,14 anti-oxidative,15 anti-allergy, and anti-cancer activity.16 Additionally, luteolin can activate a lethal endoplasmic reticulum stress response.16 Moreover, luteolin can attenuate hepatic lipid accumulation and insulin resistance in obese mice, and it also improves abnormal glucolipid metabolism in angiotensin II/hypoxia-induced hypertrophic H9c2 cells.17 Therefore, based on the above pharmacological effects, luteolin may have great potential for delaying the progress of DN.
The haemodynamics of ultrasound contrast agent microbubbles is similar to that of red blood cells.18 Studying the perfusion and excretion of contrast agent microbubbles in the kidney and analysing the contrast time intensity curve (TIC) can provide a basis for determining renal blood perfusion. The change in local renal blood flow leads to a change in video density, which is related to blood flow.19 Therefore, contrast-enhanced ultrasound (CEUS) and contrast-enhanced quantitative analysis can be used to monitor blood perfusion of parenchymal organs in real time, specifically and sensitively, and they are sensitive to small blood vessels and low-speed blood flow.20 For patients with DN, CEUS dynamically reflects the changes in renal microcirculatory blood perfusion in each stage and reflects the degree of diabetic renal function damage to a certain extent.
This study aimed to investigate whether luteolin has a protective effect on renal function in DN.
Materials and methods
Materials
Experimental drugs and instruments
Luteolin was purchased from Shanghai Tongtian Co., Ltd. (Shanghai, China), with a purity of more than 98%. A suspension of luteolin powder was prepared with normal saline and the concentration was approximately 20 mg/kg. Streptozotocin (STZ) was purchased from Sigma (Saint Louis, MO, USA). STZ was prepared as a 1% solution in 0.1 M of citrate buffer (pH, 4.0–4.5). Primary antibodies and appropriate secondary antibodies were purchased from Santa Cruz Biotechnology (Santa Cruz, CA, USA). Anti-caspase-3 and anti-Nphs2 antibodies were obtained from Abcam (Abcam, Cambridge, CB, UK). Ultrasound was performed by using the LOGIQ E9 in harmonic-contrast mode with the ML6-15 ultrasound probe (General Electric Company, Fairfield, CT, USA). We used the instrument’s built-in wash in/wash out mode to analyse the contrast results. Contrast agent (SonoVue) was purchased from Bracco Co., Ltd. (Milan, Italy).
Laboratory animals
The experiments were approved by the Institutional Animal Care and Use Committee of Wenzhou Medical University. Male Sprague–Dawley rats, which were 7 to 8 weeks old, were purchased from SLAC Experimental Animal Co., Ltd. (Shanghai, China). The rats were fed in separate cages and ate freely in a well-ventilated environment, which provided suitable temperature and humidity. The rats were adapted to a 12-hour light/dark feeding cycle for 1 week.
Methods
Preparation of the experiment
Fifty-three mice were randomly divided into the control group (n = 6), the model group (diabetic group; n = 23), and the experimental group (LUT + diabetic group; n = 24). The mice were fasted for 12 hours before modelling, and each mouse was intraperitoneally injected with STZ 65 mg/kg. On days 3, 7, and 14 after STZ injection, fasting blood glucose levels were determined from blood collected from the tail vein using an autoanalyser (Surestep, Roche, Germany). Only the rats that survived with fasting blood glucose levels exceeding 16.7 mmol/L, excessive drinking, eating and polyuria, and weight loss were diagnosed with diabetes. Age- and sex-matched control rats were injected with STZ-free citrate buffer. Because of physical problems, 13 rats died, including eight rats in the diabetic group and five rats in the LUT + diabetic group. Two rats failed to achieve the model criteria. The remaining mice were monitored for survival time.
Intragastric administration
One week after successful establishment of the diabetic model, the LUT + diabetic group had intragastric administration of luteolin 20 mg/mL with a dose of 80 mg/kg daily for 8 weeks. The control and diabetic groups were provided a corresponding dose of normal saline. During the treatment period, five rats in the model group died because of fighting, intolerance of the high-glucose state, and a weak physique. Additionally, two rats in the LUT + diabetic group died because of improper intragastric administration.
Blood glucose monitoring
Starting on the fourth week of intragastric administration, the tail vein blood of rats was collected every weekend to measure the random blood glucose level.
Ultrasonic examination
After 8 weeks of treatment, the rats were anaesthetized with 0.3 mL/kg 10% chloral hydrate and fully shaved to exposed the kidney area. The rats were then placed in a prone position. The length, width, and thickness of the maximum coronal sections of the right kidneys were measured, and the renal volume was calculated according to the following formula: kidney volume (cm3) = (π/6) ×length (cm) × width (cm) × thickness (cm). Additionally, the colour Doppler mode was used to observe the distribution of right renal blood flow, and the spectral Doppler mode was used to record haemodynamic parameters, such as peak systolic velocity (VS), end-diastolic velocity (VD), and main artery and interlobar arterial resistance indices (RIs). Contrast agent was injected into the tail vein to obtain a contrast-enhanced ultrasound image. Changes in renal cortical contrast agent echo intensity were then observed in real time for 2 minutes (mechanical index =0.08, 4.5–7.5 MHz, depth = 2–3 cm). All images were stored as digital imaging and communication in medicine format images in the hard disk built into the ultrasound machine. The echo of contrast agent microbubbles in the region of interest (ROI) (superficial peripheral renal cortex) was analysed by quantitative ultrasound analysis software (wash in/wash out) to generate the contrast agent TIC. Some quantitative parameters can be obtained from the real-time CEUS TIC curve, such as the absolute peak intensity, time to peak (TTP), area under the curve, and gradient from the start frame to the peak frame (Grad). The TTP indicates that the contrast medium begins to enter the ROI after reaching the peak intensity. The gradient response indicates the tissue perfusion rate, and absolute peak intensity indicates the cross-sectional area of the contrast medium with the most obvious enhancement of signal intensity. This value reflects the blood volume of local tissue and can reflect perfusion of the kidney. There is a good correlation between local tissue blood flow and area. Each site within the ROI was repeatedly analysed three times and the average was calculated. The TIC curve can sensitively reflect perfusion of small renal vessels.
Renal function test
After the last administration session, the rats were anaesthetized with 0.3 mL/kg 10% chloral hydrate. Blood was taken from the abdominal aorta. Serum was obtained by centrifugation of the blood at 1000 × g at 4°C for 10 minutes before storage at −20°C. Serum creatinine (Scr), blood urea nitrogen (BUN), total cholesterol (TC) and triglyceride (TG) levels were measured.
Haematoxylin–eosin staining of the kidneys
After intragastric administration at the eighth week, the rats in every group were killed by the perfusion method, and both kidneys were removed. Body weight and kidney weight were measured. Right kidney tissue was fixed with 4% paraformaldehyde. After dehydration with graded alcohol solutions and immersion in xylene, the samples were embedded in paraffin. The paraffin blocks were cut into 5-µm-thick sections and kidney slices from the three groups were obtained. Kidney slices were then deparaffinized in xylene and rehydrated through graded alcohol solutions before haematoxylin–eosin staining using a standard protocol. The samples were analysed by optical microscopy (Nikon ECLPSE 80i; Nikon, Tokyo, Japan) to observe mesangial cell proliferation.
Immunohistochemical staining of caspase-3 and Nphs2 protein
After paraffin-embedded sections were deparaffinised and rehydrated, the sections were incubated with 3% H2O2 for 10 minutes at 37°C and then blocked with 5% bovine serum albumin for 30 minutes at 37°C. The sections were covered with rabbit anti-rat polyclonal primary antibody caspase-3 or Nphs2 (1:200) and stored at 4°C overnight. The samples were incubated with the goat anti-rabbit secondary antibody for 1 hour. The samples were then stained with 3,3-diaminobenzidine (1:20) and counterstained with haematoxylin. The positive points were dyed brown and observed using optical microscopy (ECLPSE 80i; Nikon).
Transmission electron microscopy
Tissue blocks of approximately 1 × 1 × 1 mm were removed from the left kidney and fixed with 2.5% glutaraldehyde solution. The tissue was stored at 4°C for preparation of transmission electron microscopy specimens. After preparation of the specimens, the specimens were sliced by an ultra-thin slicer (Hitachi Co., Ltd., Power-town XI, Tokyo, Japan) and observed by a transmission electron microscope (H-7500; Hitachi Co., Ltd.). Proliferation in the glomerular basement membrane (GBM) and mesangial matrix, and the loss of podocytes and other pathological changes were observed under transmission electron microscopy.
Statistical analysis
Data are shown as the mean ± standard deviation. Statistical differences between two or multiple groups were analysed by the Student’s t-test or one-way analysis of variance with SPSS 23.0 software (IBM, Armonk, NY, USA). Survival curves were plotted using the Kaplan–Meier method and the curves were compared between groups using the log-rank test. P < 0.05 was considered statistically significant.
Results
Comparison of physical and biochemical indices
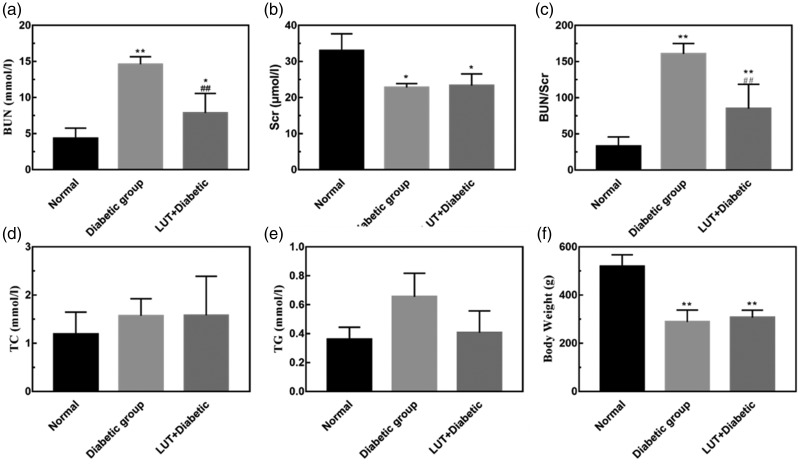
The LUT + diabetic group (53.52 ± 3.915 days) had a significantly prolonged survival time compared with the diabetic group (30.90 ± 4.786 days) (P < 0.001, Figure 1a). Body weight in the diabetic and LUT + diabetic groups was significantly lower than that in the control group (both P < 0.05) (Figure 1b). Additionally, body weight in the control group showed a steady and continuous increase, but there was no significant change between the diabetic and the LUT + diabetic groups. Body weight in the diabetic group showed a slight downward trend. Blood glucose levels in the diabetic and LUT + diabetic groups were maintained at a high level and were not significantly different between these two groups. BUN, Scr, TC, and TG levels are shown in Figure 2. Most of these indices in the diabetic group were higher than those in the control group. BUN levels and BUN/Scr were significantly lower in the LUT + diabetic group than in the diabetic group (both P < 0.01). TG levels also appeared to be lower in the LUT + diabetic group than in the diabetic group, but this was not significant. There were no significant differences in Scr and TC levels between the LUT + diabetic and diabetic groups.
Figure 1.
(a) Survival curves of the diabetic and LUT+diabetic groups. (b) Line chart showing the change in blood glucose levels from the fourth week. (c) Line chart showing the change in body weight from the fourth week. LUT: luteolin.
Figure 2.
Effect of luteolin on physical and biochemical indicators. (a–e) Quantitative analysis of BUN, Scr, BUN/Scr, TC, and TG values in the rats. (f) Body weight. Data are expressed as the mean ± standard deviation. *P < 0.05; **P < 0.01 vs. the control group; ##P < 0.01 vs. the diabetic group. BUN: blood urea nitrogen; Scr: serum creatinine; TC: total cholesterol; TG: triglycerides.
Ultrasonic results
Two-dimensional ultrasound and Doppler ultrasound
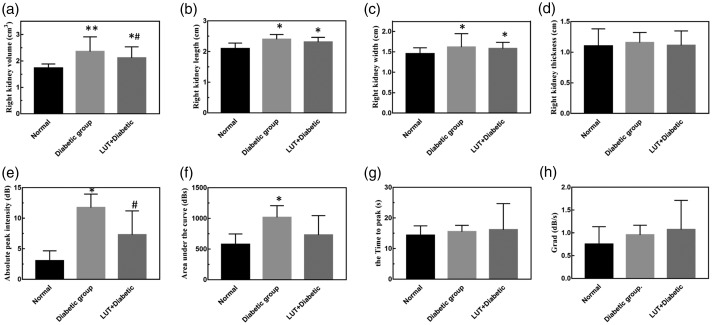
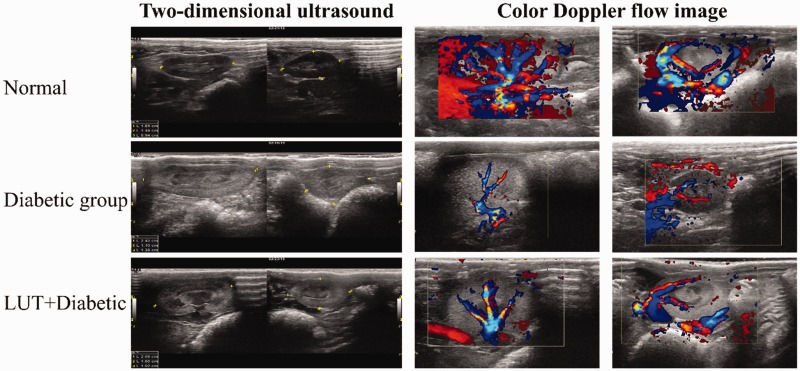
Two-dimensional ultrasound showed that right renal volume in the diabetic group (2.593 ± 0.205) was significantly larger than that in the control group (1.734 ± 0.152, P < 0.01), but renal volume in the LUT + diabetic group (2.116 ± 0.416) was significantly lower than that in the diabetic group (P < 0.05, Figure 3). Moreover, the ultrasonic echo intensity of the renal cortex in the diabetic group was significantly higher than that in the control group (P < 0.05), and that in the LUT + diabetic group appeared to be higher (not significant) than that in the control group. However, the junction of the cortex and medulla was still clear in the LUT + diabetic group. VS and VD appeared to be lower in the diabetic group (not significant), while the RI was significantly higher (P < 0.01), compared with those in the control group. These parameters were better in the LUT + diabetic group than in the diabetic group, but only the RI was significant (P < 0.01).
Figure 3.
Effect of luteolin on two-dimensional ultrasound and time intensity curve parameters. (a–d) Quantitative analysis of the volume, length, width, and thickness of the right kidney. (e–h) Quantitative analysis of the absolute peak intensity, area under the curve, time to peak, and Grad of the time intensity curve. Data are expressed as the mean ± standard deviation. *P < 0.05; **P < 0.01 vs. the control group; #P < 0.05 vs. the diabetic group. Grad: gradient from the start frame to the peak frame; LUT: luteolin.
Doppler ultrasound showed that the distribution of blood flow in the diabetic group was lower than that in the control group. Additionally, the distribution of blood flow in the LUT + diabetic group was more abundant than that in the diabetic group (Figure 4).
Figure 4.
Right kidney size shown by two-dimensional ultrasound and renal blood signals from Doppler ultrasound.
Parameters of the TIC in contrast-enhanced ultrasound
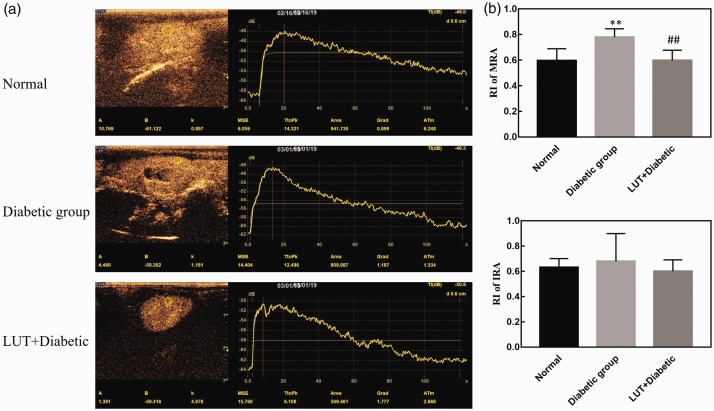
Asymmetric single-peak TICs are shown in Figure 5a. The TIC curve in the control group showed a rapid upward trend and slowly decreased after rising to a peak. The rising branch of the TIC in the diabetic group was slower than that in the control group, and it slowly decreased after a few seconds of plateauing after the peak. The quantitative perfusion parameters from the TIC in the three groups of rats are shown in Figure 3e–h. The absolute peak intensity, area under the curve, Grad, and TTP values in the diabetic group were greater than those in the control group, but only the absolute peak intensity and area under the curve values were significantly different (both P < 0.05). This finding suggests that the absolute peak intensity and area under the curve are sensitive indicators reflecting haemodynamic changes that were characteristic of diabetes induced under hyperglycaemic conditions. Moreover, the absolute peak intensity and area under the curve values in the LUT + diabetic group were lower than those in the diabetic group, but only absolute peak intensity values were significantly different (P < 0.05). This finding suggests that absolute peak intensity values may be more sensitive than area under the curve values to haemodynamic changes.
Figure 5.
(a) Contrast-enhanced ultrasound images and time intensity curves. (b) RI of the renal artery. Data are expressed as the mean ± standard deviation. **P < 0.01 vs. the control group; ##P < 0.01 vs. the diabetic group. RI: resistance index; LUT: luteolin.
Pathology
Haematoxylin–eosin staining
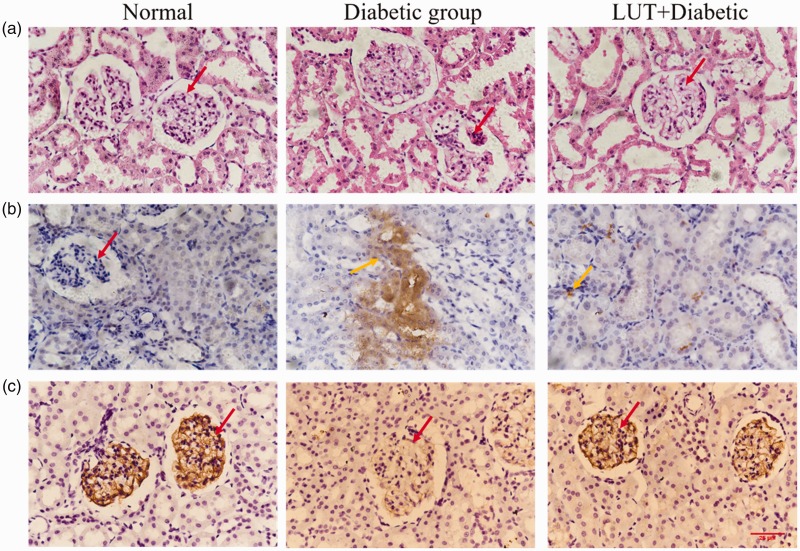
In the control group, the renal glomerulus was clear in structure and normal in shape, with no enlargement or atrophy, a smooth glomerular capsule, and no infiltration (Figure 6a). There was no thickening of the basement membrane, normal distribution of mesangial cells and extracellular matrix, and clear tubular structure of renal tubules. Glomeruli in the diabetic group were significantly atrophied and the lumen was enlarged compared with those in the control group. Additionally, mesangial cells were proliferated and the GBM was thickened. In some stained sections, dilatation of the renal tubular lumen, inflammatory cell infiltration, and vacuolar degeneration of renal tubular epithelial cells were also observed. Nevertheless, these pathological renal lesions were alleviated after treatment with luteolin.
Figure 6.
Effect of luteolin treatment on renal structural changes, caspase-3 expression levels, and Nphs2 protein levels in the three groups. Red arrows indicate a glomerulus and orange arrows indicate caspase-3 expression. Brown areas are positive for caspase-3 expression in renal tissue. (a) Representative microphotographs of kidney sections from all three groups with haematoxylin and eosin staining (× 400). (b, c) Representative microphotographs of caspase-3 and Nphs2 expression with immunohistochemical staining (× 400).
Immunohistochemical staining
In the control group, there was little staining for caspase-3 in renal tissue (Figure 6b). Caspase-3 expression was higher in the glomeruli and the adjacent cortical tubule interstitium in the diabetic group compared with the control group. After luteolin treatment, caspase-3 levels were decreased. Figure 6c shows Nphs2 protein immunofluorescence staining. Nphs2 protein expression was distributed along the GBM. There was high Nphs2 protein expression in the control group, and a small amount of Nphs2 protein expression was found in the diabetic group. However, Nphs2 protein expression levels in the LUT + diabetic group were higher than those in the diabetic group. This result indicates that luteolin may preserve podocytes and reduce apoptosis to protect kidney function.
Pathological changes under electron microscopy
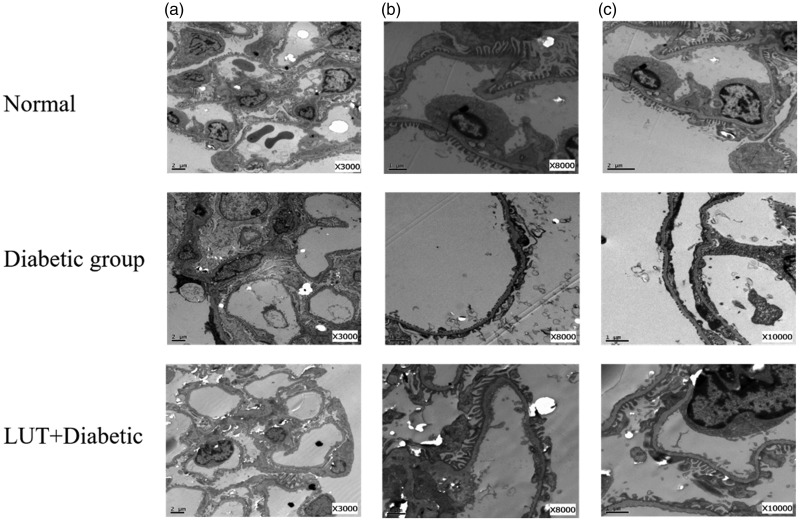
In the control group, the foot process in the mesangial area was long and distinct. In the diabetic group, we observed a high volume of glomeruli, thickness of a diffusely homogeneous GBM, and severe hyperplasia of the mesangial matrix in the mesangial area (Figure 7). Additionally, because of stimulation of podocytes by long-term glycoprotein, the structure of the foot process was unclear, and there was extensive fusion. The podocytes had changed from branch bifurcation to fusiform, and the bifurcation was obviously smaller, with some of them showing similarity to pebbles. A large number of glycogen deposits were also observed in other cells in the kidneys in the diabetic group. Vacuolization in the renal tubule was obvious. In the LUT + diabetic group, there was less GBM thickening, milder mesangial hyperplasia, and more scattered and focal foot process fusion compared with the diabetic group.
Figure 7.
Representative renal sections of each group as shown by transmission electron microscopy with different magnifications. Red arrows indicate podocyte foot processes. Yellow arrows indicate the glomerular basement membrane (a: × 3000; b: × 8000; c: × 10,000). LUT: luteolin.
Discussion
At present, with the abundance of high-sugar and high-calorie diets, the prevalence of diabetes is increasing yearly. Although most people with diabetes strictly control their blood sugar levels and metabolic abnormalities, DN will exceed 5.2 billion by 2030, of which 48% of cases will be from China and India. In recent years, the main cause of end-stage renal disease in China has changed from glomerulonephritis to DN.
The main pathological changes of DN are gradual thickening of the GBM and tubular basement membranes, expansion of the mesangial matrix, and glomerular hypertrophy.21,22 In later stages of this disease, glomerulosclerosis and interstitial fibrosis are prominent, with thickening, narrowing, or even complete occlusion of the capillary cavity.23 Because of the haemodynamic changes caused by renal tubule-renal interstitial injury, forward flow resistance increases and changes in renal arterial blood flow mechanics at all levels occur as the disease progresses. Therefore, by measuring changes in renal arterial blood flow mechanics at all levels, the extent of blood perfusion in renal parenchyma and the progress of renal parenchymal injury can be determined. Colour Doppler ultrasound can be used to obtain blood flow parameters of the renal artery non-invasively and repeatedly. Further, this method can be used to measure renal length and diameter and other two-dimensional parameters reflecting change in renal structure, which is a unique advantage compared with other examination methods. In our study, renal volume in the diabetic group was lower, VS and VD were lower, and the RI value was significantly higher compared with the control group. Therefore, the kidneys were in a state of high resistance and low flow rate, which indicated obvious renal injury under the condition of long-term hyperglycaemia. Renal volume and the RI value in the LUT + diabetic group were better than those in the diabetic group, which suggested that luteolin delayed the progress of diabetic renal injury.
Nuclear medicine, computed tomography, magnetic resonance imaging, digital subtraction angiography, and other examinations have limitations in evaluating renal function because of their radioactivity, high cost, and nephrotoxicity of contrast media. Renal puncture is an invasive procedure, which should not be repeatedly performed and cannot capture dynamic changes in renal function. CEUS has unique advantages over traditional modes.18,24 CEUS does not cause nephrotoxicity or require ionizing radiation, but it does have good tolerance by patients. CEUS also provides the ability to evaluate the enhancement pattern of renal lesions quickly and in real time by using multiplanar imaging capability. This allows for prompt diagnosis and thus provides broader clinical application value. The TIC of renal cortex perfusion is obtained after the CEUS image is analysed by software. The shape of the curve is an asymmetric single-peak curve with obvious ascending branches, peaking branches, and descending branches. The ascending branch is steep and rapidly reaches peak strength. After descending, all traces are formed, and the descending branch is relatively flat. As renal function decreases, the shape of the curve described above gradually disappears.25,26 In our study, the TIC curve in the control group showed a rapid upward trend and slowly decreased after rising to a peak (Figure 5). The rising branch of the TIC in the diabetic group was slower than that in the control group, and it slowly decreased after a few seconds of plateauing after the peak.
In the early stage of diabetes, glomeruli are enlarged and perfusion is increased, which leads to hyperfiltration of glomeruli in the early stage of diabetic renal damage. With prolongation of the course of this disease, glomerulosclerosis increases, the microvascular cavity is occluded, and renal microvessel density is decreased. The resistance of blood perfusion is increased, the slope of the ascending branch of the TIC curve is decreased, and the peak time is prolonged. The area under the TIC curve is increased in the early stage of diabetes.27 In our study, values for the absolute peak intensity, area under the curve, and TTP in the diabetic group were higher than those in the control group. Values for the absolute peak intensity and area under the curve in the LUT + diabetic group were lower than those in the diabetic group. This finding suggested that luteolin delayed deterioration of renal haemodynamics under hyperglycaemia.
The glomerular filtration barrier is composed of glomerular endothelial cells, the GBM, and podocytes. Podocyte foot processes and the hiatus of the diaphragm cover the surface of the GBM, maintaining a large filtration area, which is the last barrier for preventing protein leakage into the urine.27 Studies have shown that structural and functional damage of podocytes occur in the early stage of DN, and a series of functional and morphological changes occur, including hypertrophy of podocytes,28 epithelial mesenchymal transdifferentiation of podocytes,29 detachment of podocytes23 and apoptosis of podocytes.30,31 The absence of characteristic proteins in podocytes results in an increase in pore space, destruction of the glomerular filtration barrier and a gradual decline in renal function. Podocyte-associated proteins nephrin and Nphs2 have anti-apoptotic signal-transduction characteristics. Nphs2 protein is a membrane protein that is specifically expressed in the perforated septum. Previous studies have found that Nphs2 protein expression in podocytes of patients with DN is significantly reduced.23,32 In our study, Nphs2 protein expression in renal tissue in the diabetic group was lower than that in the control group Additionally, Nphs2 protein expression in the LUT + diabetic group was higher than that in the diabetic group (Figure 6). These findings suggested that luteolin reduced podocyte injury in diabetic rats by protecting Npsh2 protein expression in podocytes.
Caspase-3 is closely related to glomerulosclerosis caused by DN, and it is the main indicator of apoptosis and the main protease involved in occurrence and development of DN.33 Some studies have shown that a high-glucose environment can activate caspase-3 by using the hexylamine pathway. With the assistance of various growth factors and inflammatory factors, glucose promotes secretion of the extracellular matrix and accelerates deposition of the mesangial matrix. This leads to glomerular hypertrophy and an increase in the mesangial matrix, which in turn leads to worsening disease.34 In our study, haematoxylin and eosin staining and electron microscopic observation showed that renal tissue in the diabetic group was destroyed. Caspase-3 expression in renal tissue in the LUT + diabetic and control groups was lower than that in the diabetic group. This finding indicated that application of luteolin inhibited apoptosis and reduced pathological changes in renal tissue, thus playing an effective protective role.
Conclusion
This study shows that luteolin cannot directly reduce blood glucose levels. However, luteolin may protect the filtration function of the basement membrane by upregulating Nphs2 protein expression, and delaying apoptosis and deletion and fusion of podocytes under high glucose conditions. Further, luteolin may inhibit glomerulosclerosis and maintain the relatively normal physiological structure of glomeruli, thus suggesting that luteolin can prevent rapid deterioration of DN. This drug may become a new direction for the treatment of DN and has potentially broad applicability in future clinical applications. Additionally, CEUS quantitative analysis has a high sensitivity to haemodynamic changes in DN and may be used for early diagnosis of diabetes.
Author contributions
Study design: T.C.; literature research: C.X., H.L. and M.F.; experimental studies: C.X. and H.L.; data acquisition: C.X. and Q.W.; data analysis/interpretation: C.X., Q.W., and M.F.; statistical analysis: C.X. and Q.W.; manuscript preparation and editing: C.X.; manuscript revision/review: T.C and B.C.; final approval of the manuscript: T.C and B.C.
Declaration of conflicting interest
The authors declare that there is no conflict of interest.
Funding
The author(s) disclosed receipt of the following financial support for the research, authorship, and/or publication of this article: This research was supported by Wenzhou Science and Technology Bureau (Y20170311).
ORCID iD
Cui Xiong https://orcid.org/0000-0002-9540-2736
References
- 1.Kato M, Natarajan R. Epigenetics and epigenomics in diabetic kidney disease and metabolic memory. Nat Rev Nephrol 2019; 15: 327–345. [DOI] [PMC free article] [PubMed] [Google Scholar]
- 2.Hostetter TH. Hyperfiltration and glomerulosclerosis. Semin Nephrol 2003; 23: 194–199. [DOI] [PubMed] [Google Scholar]
- 3.Reudelhuber TL. Prorenin, renin, and their receptor: moving targets. Hypertension 2010; 55: 1071–1074. [DOI] [PubMed] [Google Scholar]
- 4.Wu L, Wang Q, Guo F, et al. MicroRNA-27a induces mesangial cell injury by targeting of PPARγ, and its in vivo knockdown prevents progression of diabetic nephropathy. Sci Rep-UK 2016; 6: 26072. [DOI] [PMC free article] [PubMed] [Google Scholar]
- 5.Shi S, Yu L, Chiu C, et al. Podocyte-selective deletion of dicer induces proteinuria and glomerulosclerosis. J Am Soc Nephrol 2008; 19: 2159–2169. [DOI] [PMC free article] [PubMed] [Google Scholar]
- 6.Bechtel W, McGoohan S, Zeisberg EM, et al. Methylation determines fibroblast activation and fibrogenesis in the kidney. Nat Med 2010; 16: 544–550. [DOI] [PMC free article] [PubMed] [Google Scholar]
- 7.Keating ST, van Diepen JA, Riksen NP, et al. Epigenetics in diabetic nephropathy, immunity and metabolism. Diabetologia 2018; 61: 6–20. [DOI] [PMC free article] [PubMed] [Google Scholar]
- 8.Yamagishi S, Matsui T, Fukami K. Role of receptor for advanced glycation end products (RAGE) and its ligands in cancer risk. Rejuv Res 2015; 18: 48–56. [DOI] [PubMed] [Google Scholar]
- 9.Wang H, Kouri G, Wollheim CB. ER stress and SREBP-1 activation are implicated in beta-cell glucolipotoxicity. J Cell Sci 2005; 118: 3905–3915. [DOI] [PubMed] [Google Scholar]
- 10.Miean KH, Mohamed S. Flavonoid (myricetin, quercetin, kaempferol, luteolin, and apigenin) content of edible tropical plants. J Agr Food Chem 2001; 49: 3106–3112. [DOI] [PubMed] [Google Scholar]
- 11.Yu Q, Zhang M, Qian L, et al. Luteolin attenuates high glucose-induced podocyte injury via suppressing NLRP3 inflammasome pathway. Life Sci 2019; 225: 1–7. [DOI] [PubMed] [Google Scholar]
- 12.Liu Y, Huang J, Zheng X, et al. Luteolin, a natural flavonoid, inhibits methylglyoxal induced apoptosis via the mTOR/4E-BP1 signaling pathway. Sci Rep-UK 2017; 7: 7877. [DOI] [PMC free article] [PubMed] [Google Scholar]
- 13.Choi BM, Lim DW, Lee JA, et al. Luteolin suppresses cisplatin-induced apoptosis in auditory cells: possible mediation through induction of heme oxygenase-1 expression. J Med Food 2008; 11: 230–236. [DOI] [PubMed] [Google Scholar]
- 14.Aziz N, Kim MY, Cho JY. Anti-inflammatory effects of luteolin: a review of in vitro, in vivo, and in silico studies. J Ethnopharmacol 2018; 225: 342–358. [DOI] [PubMed] [Google Scholar]
- 15.Rooban BN, Sasikala V, Gayathri Devi V, et al. Prevention of selenite induced oxidative stress and cataractogenesis by luteolin isolated from Vitex negundo. Chem-biol Interact 2012; 196: 30–38. [DOI] [PubMed] [Google Scholar]
- 16.Imran M, Rauf A, Abu-Izneid T, et al. Luteolin, a flavonoid, as an anticancer agent: a review. Biomed Pharmacother 2019; 112: 108612. [DOI] [PubMed] [Google Scholar]
- 17.Wang J, Gao T, Wang F, et al. Luteolin improves myocardial cell glucolipid metabolism by inhibiting hypoxia inducible factor-1α expression in angiotensin II/hypoxia-induced hypertrophic H9c2 cells. Nutr Res 2019; 65: 63–70. [DOI] [PubMed] [Google Scholar]
- 18.McArthur C, Baxter GM. Current and potential renal applications of contrast-enhanced ultrasound. Clin Radiol 2012; 67: 909–922. [DOI] [PubMed] [Google Scholar]
- 19.Nilsson A. Contrast-enhanced ultrasound of the kidneys. Eur Radiol 2004; 14: P104–P109. [PubMed] [Google Scholar]
- 20.Bertolotto M, Martegani A, Aiani L, et al. Value of contrast-enhanced ultrasonography for detecting renal infarcts proven by contrast enhanced CT. A feasibility study. Eur Radiol 2008; 18: 376–383. [DOI] [PubMed] [Google Scholar]
- 21.Vleming LJ, Baelde JJ, Westendorp RG, et al. The glomerular deposition of PAS positive material correlates with renal function in human kidney diseases. Clin Nephrol 1997; 47: 158–167. [PubMed] [Google Scholar]
- 22.Muraoka H, Hasegawa K, Sakamaki Y, et al. Role of Nampt-Sirt6 axis in renal proximal tubules in extracellular matrix deposition in diabetic nephropathy. Cell Rep 2019; 27: 199–212.e5. [DOI] [PubMed] [Google Scholar]
- 23.Baelde HJ, Eikmans M, Lappin DWP, et al. Reduction of VEGF-A and CTGF expression in diabetic nephropathy is associated with podocyte loss. Kidney Int 2007; 71: 637–645. [DOI] [PubMed] [Google Scholar]
- 24.Bertolotto M, Bucci S, Valentino M, et al. Contrast-enhanced ultrasound for characterizing renal masses. Eur J Radiol 2018; 105: 41–48. [DOI] [PubMed] [Google Scholar]
- 25.Jha JC, Thallas-Bonke V, Banal C, et al. Podocyte-specific Nox4 deletion affords renoprotection in a mouse model of diabetic nephropathy. Diabetologia 2016; 59: 379–389. [DOI] [PMC free article] [PubMed] [Google Scholar]
- 26.Li C, Siragy HM. High glucose induces podocyte injury via enhanced (pro)renin receptor-Wnt-β-catenin-snail signaling pathway. PLoS One 2014; 9: e89233. [DOI] [PMC free article] [PubMed] [Google Scholar]
- 27.Wolf G. New insights into the pathophysiology of diabetic nephropathy: from haemodynamics to molecular pathology. Eur J Clin Invest 2004; 34: 785–796. [DOI] [PubMed] [Google Scholar]
- 28.Lin JS, Susztak K. Podocytes: the weakest link in diabetic kidney disease? Curr Diabetes Rep 2016; 16: 45. [DOI] [PMC free article] [PubMed] [Google Scholar]
- 29.Xing L, Liu Q, Fu S, et al. PTEN inhibits high glucose-induced phenotypic transition in podocytes. J Cell Biochem 2015; 116: 1776–1784. [DOI] [PubMed] [Google Scholar]
- 30.Wang Y, Li H, Song SP. β-arrestin 1/2 aggravates podocyte apoptosis of diabetic nephropathy via Wnt/β-catenin pathway. Med Sci Monitor 2018; 24: 1724–1732. [DOI] [PMC free article] [PubMed] [Google Scholar]
- 31.Bhatti AB, Usman M. Drug targets for oxidative podocyte injury in diabetic nephropathy. Cureus 2015; 7: e393. [DOI] [PMC free article] [PubMed] [Google Scholar]
- 32.Doublier S, Salvidio G, Lupia E, et al. Nephrin expression is reduced in human diabetic nephropathy: evidence for a distinct role for glycated albumin and angiotensin II. Diabetes 2003; 52: 1023–1030. [DOI] [PubMed] [Google Scholar]
- 33.Shinozaki Y, Furuichi K, Toyama T, et al. Impairment of the carnitine/organic cation transporter 1–ergothioneine axis is mediated by intestinal transporter dysfunction in chronic kidney disease. Kidney Int 2017; 92: 1356–1369. [DOI] [PubMed] [Google Scholar]
- 34.Zeisel SH, Warrier M. Trimethylamine N-oxide, the microbiome, and heart and kidney disease. Annu Rev Nutr 2017; 37: 157–181. [DOI] [PubMed] [Google Scholar]


